UNITED STATES
SECURITIES AND EXCHANGE COMMISSION
WASHINGTON, D.C. 20549
Form 10‑K
|
(Mark One)
|
|
|
☒
|
ANNUAL REPORT PURSUANT TO SECTION 13 OR 15(d) OF THE SECURITIES EXCHANGE ACT OF 1934 FOR THE FISCAL YEAR ENDED DECEMBER 31, 2017
|
|
OR
|
|
☐
|
TRANSITION REPORT PURSUANT TO SECTION 13 OR 15(d) OF THE SECURITIES EXCHANGE ACT OF 1934
|
|
Commission
File Number
|
|
Exact Name of Registrant as Specified in its Charter,
Principal Office Address and Telephone Number
|
|
State of
Incorporation/Organization
|
|
I.R.S. Employer
Identification No.
|
|
001‑32427
|
|
Huntsman Corporation
10003 Woodloch Forest Drive
The Woodlands, Texas 77380
(281) 719‑6000
|
|
Delaware
|
|
42‑1648585
|
|
333‑85141
|
|
Huntsman International LLC
10003 Woodloch Forest Drive
The Woodlands, Texas 77380
(281) 719‑6000
|
|
Delaware
|
|
87‑0630358
|
Securities registered pursuant to Section 12(b) of the Exchange Act:
|
Registrant
|
|
Title of each class
|
|
Name of each exchange on which registered
|
|
Huntsman Corporation
|
|
Common Stock, par value $0.01 per share
|
|
New York Stock Exchange
|
|
Huntsman International LLC
|
|
None
|
|
None
|
Securities registered pursuant to Section 12(g) of the Exchange Act:
|
Registrant
|
|
Title of each class
|
|
Huntsman Corporation
|
|
None
|
|
Huntsman International LLC
|
|
None
|
Indicate by check mark if the registrant is a well‑known seasoned issuer, as defined in Rule 405 of the Securities Act.
|
Huntsman Corporation
|
YES ☒
|
NO ☐
|
|
Huntsman International LLC
|
YES ☐
|
NO ☒
|
Indicate by check mark if the registrant is not required to file reports pursuant to Section 13 or Section 15(d) of the Exchange Act.
|
Huntsman Corporation
|
YES ☐
|
NO ☒
|
|
Huntsman International LLC
|
YES ☐
|
NO ☒
|
Indicate by check mark whether the registrant: (1) has filed all reports required to be filed by Section 13 or 15(d) of the Exchange Act during the preceding 12 months (or for such shorter period that the registrant was required to file such reports) and (2) has been subject to such filing requirements for the past 90 days.
|
Huntsman Corporation
|
YES ☒
|
NO ☐
|
|
Huntsman International LLC
|
YES ☒
|
NO ☐
|
Indicate by check mark whether the registrant has submitted electronically and posted on its corporate Web site, if any, every Interactive Data File required to be submitted and posted pursuant to Rule 405 of Regulation S‑T during the preceding 12 months (or for such shorter period that the registrant was required to submit and post such files).
|
Huntsman Corporation
|
YES ☒
|
NO ☐
|
|
Huntsman International LLC
|
YES ☒
|
NO ☐
|
Indicate by check mark if disclosure of delinquent filers pursuant to Item 405 of Regulation S‑K is not contained herein, and will not be contained, to the best of the registrants’ knowledge, in definitive proxy or information statements incorporated by reference in Part III of this Form 10‑K or any amendment to this Form 10‑K. ☒
Indicate by check mark whether the registrant is a large accelerated filer, an accelerated filer, a non‑accelerated filer, or a smaller reporting company. See the definitions of “large accelerated filer,” “accelerated filer,” and “smaller reporting company” in Rule 12b‑2 of the Exchange Act. Huntsman Corporation
|
Huntsman Corporation
|
Large accelerated filer ☒
|
Accelerated filer ☐
|
Non‑accelerated filer ☐
|
Smaller reporting company ☐
|
Emerging Growth Companies ☐
|
|
Huntsman International LLC
|
Large accelerated filer ☐
|
Accelerated filer ☐
|
Non‑accelerated filer ☒
|
Smaller reporting company ☐
|
Emerging Growth Companies ☐
|
If an emerging growth company, indicate by check mark if the registrant has elected not to use the extended transition period for complying with any new or revised financial accounting standards provided pursuant to Section 7(a)(2)(B) of the Securities Act.
|
|
|
|
|
Huntsman Corporation
|
YES ☐
|
NO ☐
|
|
Huntsman International LLC
|
YES ☐
|
NO ☐
|
Indicate by check mark whether the registrant is a shell company (as defined in Rule 12b‑2 of the Exchange Act).
|
Huntsman Corporation
|
YES ☐
|
NO ☒
|
|
Huntsman International LLC
|
YES ☐
|
NO ☒
|
On June 30, 2017, the last business day of the registrants’ most recently completed second fiscal quarter, the aggregate market value of voting and non‑voting common equity held by non‑affiliates was as follows:
|
Registrant
|
|
Common Equity
|
|
Market Value Held by Nonaffiliates
|
|
Huntsman Corporation
|
|
Common Stock
|
|
$5,030,897,611(1)
|
|
Huntsman International LLC
|
|
Units of Membership Interest
|
|
$0(2)
|
(1)Based on the closing price of $25.84 per share of common stock as quoted on the New York Stock Exchange.
(2)All units of membership interest are held by Huntsman Corporation, an affiliate.
On February 8, 2018, the number of shares outstanding of each of the registrant’s classes of common equity were as follows:
|
|
|
|
|
|
|
Registrant
|
|
Common Equity
|
|
Outstanding
|
|
Huntsman Corporation
|
|
Common Stock
|
|
241,718,674
|
|
Huntsman International LLC
|
|
Units of Membership Interest
|
|
2,728
|
This Annual Report on Form 10‑K presents information for two registrants: Huntsman Corporation and Huntsman International LLC. Huntsman International LLC is a wholly owned subsidiary of Huntsman Corporation and is the principal operating company of Huntsman Corporation. The information reflected in this Annual Report on Form 10‑K is equally applicable to both Huntsman Corporation and Huntsman International LLC, except where otherwise indicated.
Huntsman International LLC meets the conditions set forth in General Instructions (I)(1)(a) and (b) of Form 10‑K and, to the extent applicable, is therefore filing this form with a reduced disclosure format.
Documents Incorporated by Reference
Part III: Proxy Statement for the 2017 Annual Meeting of Stockholders to be filed within 120 days of
Huntsman Corporation’s fiscal year ended December 31, 2017.
HUNTSMAN CORPORATION AND SUBSIDIARIES
HUNTSMAN INTERNATIONAL LLC AND SUBSIDIARIES
2017 ANNUAL REPORT ON FORM 10‑K
TABLE OF CONTENTS
HUNTSMAN CORPORATION AND SUBSIDIARIES
HUNTSMAN INTERNATIONAL LLC AND SUBSIDIARIES
2017 ANNUAL REPORT ON FORM 10‑K
With respect to Huntsman Corporation, certain information set forth in this report contains “forward‑looking statements” within the meaning the Private Securities Litigation Reform Act of 1995, Section 27A of the Securities Act of 1933 and Section 21E of the Securities Exchange Act of 1934. All statements other than historical factual information are forward‑looking statements, including without limitation statements regarding: projections of revenue, expenses, profit, profit margins, tax rates, tax provisions, cash flows, pension and benefit obligations and funding requirements, our liquidity position or other projected financial measures; management’s plans and strategies for future operations, including statements relating to anticipated operating performance, cost reductions, restructuring activities, new product and service developments, competitive strengths or market position, acquisitions, divestitures, spin‑offs or other distributions, strategic opportunities, securities offerings, stock repurchases, dividends and executive compensation; growth, declines and other trends in markets we sell into; new or modified laws, regulations and accounting pronouncements; outstanding claims, legal proceedings, tax audits and assessments and other contingent liabilities; foreign currency exchange rates and fluctuations in those rates; general economic and capital markets conditions; the timing of any of the foregoing; assumptions underlying any of the foregoing; and any other statements that address events or developments that we intend or believe will or may occur in the future. In some cases, forward‑looking statements can be identified by terminology such as “believes,” “expects,” “may,” “will,” “should,” “anticipates” or “intends” or the negative of such terms or other comparable terminology, or by discussions of strategy. We may also make additional forward‑looking statements from time to time. All such subsequent forward‑looking statements, whether written or oral, by us or on our behalf, are also expressly qualified by these cautionary statements.
All forward‑looking statements, including without limitation management’s examination of historical operating trends, are based upon our current expectations and various assumptions. Our expectations, beliefs and projections are expressed in good faith and we believe there is a reasonable basis for them, but there can be no assurance that management’s expectations, beliefs and projections will result or be achieved. All forward‑looking statements apply only as of the date made. We undertake no obligation to publicly update or revise forward‑looking statements whether because of new information, future events or otherwise, except as required by securities and other applicable law.
There are a number of risks and uncertainties that could cause our actual results to differ materially from the forward‑looking statements contained in or contemplated by this report. Any forward‑looking statements should be considered in light of the risks set forth in “Part I. Item 1A. Risk Factors” and elsewhere in this report.
This report includes information with respect to market share, industry conditions and forecasts that we obtained from internal industry research, publicly available information (including industry publications and surveys), and surveys and market research provided by consultants. The publicly available information and the reports, forecasts and other research provided by consultants generally state that the information contained therein has been obtained from sources believed to be reliable. We have not independently verified any of the data from third‑party sources, nor have we ascertained the underlying economic assumptions relied upon therein. Similarly, our internal research and forecasts are based upon our management’s understanding of industry conditions, and such information has not been verified by any independent sources.
For convenience in this report, the terms “Company,” “our,” “us,” or “we” may be used to refer to Huntsman Corporation and, unless the context otherwise requires, its subsidiaries and predecessors. Any references to our “Company,” “we,” “us” or “our” as of a date prior to October 19, 2004 (the date of our formation) are to Huntsman Holdings, LLC and its subsidiaries (including their respective predecessors). In this report, “Huntsman International” refers to Huntsman International LLC (our 100%‑owned subsidiary) and, unless the context otherwise requires, its subsidiaries; “AAC” refers to Arabian Amines Company, our consolidated manufacturing joint venture with the Zamil Group; “HPS” refers to Huntsman Polyurethanes Shanghai Ltd. (our consolidated splitting joint venture with Shanghai Chlor‑Alkali Chemical Company, Ltd); “Sasol‑Huntsman” refers to Sasol‑Huntsman GmbH and Co. KG (our consolidated joint venture with Sasol that owns and operates a maleic anhydride facility in Moers, Germany); and “SLIC” refers to Shanghai Liengheng Isocyanate Investment BV (an unconsolidated manufacturing joint venture with BASF and three Chinese chemical companies).
In this report, we may use, without definition, the common names of competitors or other industry participants. We may also use the common names or abbreviations for certain chemicals or products. Many of these terms are defined in the Glossary of Chemical Terms found at the conclusion of “Part I. Item 1. Business” below.
PART I
ITEM 1. BUSINESS
General
We are a global manufacturer of differentiated organic chemical products. Our Company, a Delaware corporation, was formed in 2004 to hold the Huntsman businesses, which were founded by Jon M. Huntsman. Mr. Huntsman founded the predecessor to our Company in 1970 as a small polystyrene plastics packaging company. Since then, we have grown through a series of significant acquisitions and now own a global portfolio of businesses. Jon M. Huntsman served as the Executive Chairman of our Company until December 31, 2017, at which time Peter Huntsman, our Chief Executive Officer, was appointed to the role of Chairman of the Board. Jon M. Huntsman served as Director and Chairman Emeritus until his passing on February 2, 2018.
We operate all of our businesses through Huntsman International, our 100% owned subsidiary. Huntsman International is a Delaware limited liability company and was formed in 1999.
Our principal executive offices are located at 10003 Woodloch Forest Drive, The Woodlands, Texas 77380, and our telephone number at that location is (281) 719‑6000.
RECENT DEVELOPMENTS
Separation of the P&A Business
In August 2017, we separated our Titanium Dioxide and Performance Additives business (the “P&A Business”) and conducted an initial public offering (“IPO”) of ordinary shares of Venator Materials PLC (“Venator”), formerly a wholly-owned subsidiary of Huntsman (the “Separation”). Additionally, in December 2017, we conducted a secondary offering of Venator ordinary shares. All of such ordinary shares were sold by Huntsman, and Venator did not receive any proceeds from the offerings. Venator’s ordinary shares began trading on The New York Stock Exchange under the symbol “VNTR” on August 3, 2017. As of December 31, 2017, Huntsman retained approximately 55% ownership in Venator. On January 3, 2018, the underwriters purchased an additional 1,948,955 Venator ordinary shares pursuant to their over-allotment option, which reduced Huntsman’s ownership interest in Venator to approximately 53%. Beginning in the third quarter of 2017, we reported the results of operations of the P&A Business as discontinued operations.
Prepayment of Debt
In August 2017, we made early prepayments of $1,207 million on our senior credit facilities (“Senior Credit Facilities”), of which $106 million was paid on our extended term loan B facility due 2015 (“2015 Extended Term Loan B”), $347 million was paid on our term loan B facility due 2021 (“2021 Term Loan B”), and $754 million was paid on our term loan B facility due 2023 (“2023 Term Loan B”). The funds used to pay down the debt included $732 million received from Venator ($750 million of debt raised by Venator, net of $18 million of debt issuance costs), upon its payment of intercompany debt obligations owed to Huntsman, and $475 million from proceeds of the Venator IPO. In connection with the $1,207 million prepayments of our term loans, we recognized a loss on early extinguishment of debt of $34 million. Additionally, in December 2017, we repaid in full the remaining $511 million on our 2023 Term Loan B using the funds raised from the secondary offering and existing cash and recognized a loss on early extinguishment of debt of $15 million.
With available free cash flow, the net proceeds from the sale of our investment in the P&A business and cash from the repayment of related intercompany indebtedness as described above, we repaid $2.1 billion of debt during the full year 2017 and believe we achieved investment grade-type leverage metrics at year end.
Termination of Huntsman and Clariant Merger Agreement
As previously disclosed, on May 21, 2017, Huntsman and Clariant Ltd (“Clariant”) entered into a merger agreement. On October 26, 2017, Huntsman and Clariant entered into a termination agreement pursuant to which the parties mutually terminated the merger agreement. No fees are payable under the terms of the termination agreement at this time. Huntsman and Clariant also agreed to release each other from claims and liabilities arising out of or related to the merger agreement or the transactions contemplated thereby. Pursuant to the termination agreement, each party agreed to bear its own costs, fees and expenses in connection with the merger agreement and the transaction costs contemplated thereby, except for specified joint filing fees and related expenses as set forth in the merger agreement. During the years ended December 31, 2017, 2016 and 2015, we incurred merger-related costs of $28 million, nil and nil, respectively.
U.S. Tax Reform Act
On December 22, 2017, the U.S. Tax Cuts and Jobs Act (the “U.S. Tax Reform Act”) was signed into law. The U.S. Tax Reform Act significantly revised the U.S. corporate income tax regime by, among other things, lowering the U.S. corporate tax rate from 35% to 21%, effective January 1, 2018, repealing the deduction for domestic production activities and imposing a repatriation tax on deemed repatriated earnings of foreign subsidiaries.
As a result of the U.S. Tax Reform Act, the Company recorded a provisional tax benefit of $137 million due to a remeasurement of deferred tax assets and liabilities and a provisional tax expense of $85 million due to the transition tax on deemed repatriation of deferred foreign income. Absent the Venator offering and certain tax related restructuring transactions, our provisional transition tax liability on deemed repatriation of deferred foreign income would have been $12 million.
Share Repurchase Program
On February 7, 2018, our Board of Directors authorized our Company to repurchase up to $400 million in shares of our common stock in addition to the $50 million remaining under our September 2015 share repurchase authorization. Repurchases may be made through the open market or in privately negotiated transactions, and repurchases may be commenced or suspended from time to time without prior notice. Shares of common stock acquired through the repurchase program are held in treasury at cost.
Overview
We are a global manufacturer of differentiated organic chemical products. Our products comprise a broad range of chemicals and formulations, which we market globally to a diversified group of consumer and industrial customers. Our products are used in a wide range of applications, including those in the adhesives, aerospace, automotive, construction products, personal care and hygiene, durable and non-durable consumer products, digital inks, electronics, medical, packaging, coatings and construction, power generation, refining, synthetic fiber, textile chemicals and dyes industries. We are a leading global producer in many of our key product lines, including MDI, amines, surfactants, maleic anhydride, epoxy-based polymer formulations, textile chemicals and dyes.
We operate in four segments: Polyurethanes, Performance Products, Advanced Materials and Textile Effects. In August 2017, we separated our P&A Business through an IPO of ordinary shares of Venator, formerly our wholly-owned subsidiary. Beginning in the third quarter of 2017, we reported the results of the former P&A Business as discontinued operations. See “Note 3. Discontinued Operations and Business Dispositions—Separation of P&A Business” to our consolidated financial statements. In a series of transactions beginning in 2006, we sold or shut down substantially all of our Australian styrenics operations and our North American polymers and base chemicals operations. We also report the results of these businesses as discontinued operations.
As of December 31, 2017, we employed approximately 10,000 associates worldwide. Our revenues for the years ended December 31, 2017, 2016 and 2015 were $8,358 million, $7,518 million and $8,139 million, respectively.
Our Products
Our Polyurethanes, Performance Products, Advanced Materials and Textile Effects segments produce differentiated organic chemical products. Growth in our differentiated products has been driven by the substitution of our products for other materials and by the level of global economic activity. Accordingly, the profitability of our differentiated products has been somewhat less influenced by the cyclicality that typically impacts the petrochemical industry.
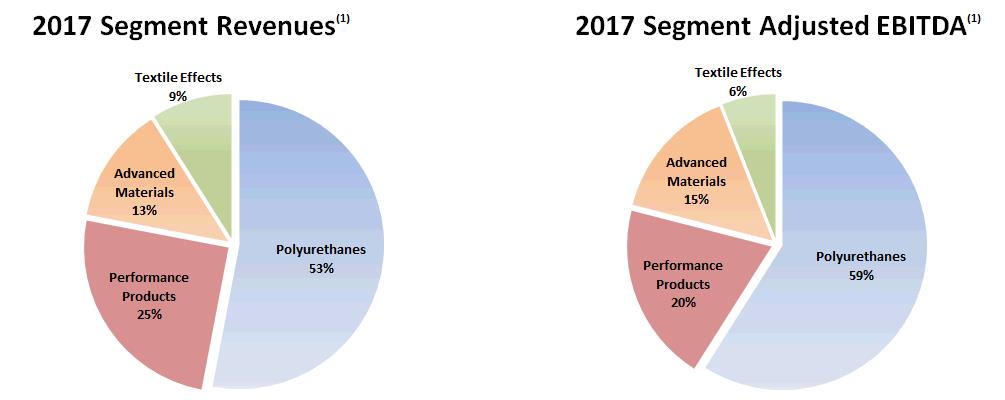
(1)Percentage allocations in this chart do not give effect to Corporate and other unallocated items and eliminations. For a reconciliation of adjusted EBITDA to net income attributable to Huntsman Corporation and cash provided by operating activities, see “Part II. Item 7. Management’s Discussion and Analysis of Financial Condition and Results of Operations—Results of Operations.”
The following table identifies the key products, principal end markets and applications, representative customers, raw materials and representative competitors of each of our business segments:
|
|
Product Line
|
End Markets / Applications
|
|
Representative Customers
|
|
Raw Materials
|
|
Representative Competitors
|
|
|
|
|
|
|
|
|
|
|
|
Polyurethanes
|
MDI
|
Polyurethane chemicals are used to produce rigid and flexible foams, as well as coatings, adhesives, sealants and elastomers. They are also used in refrigeration and appliance insulation, construction products, adhesives, automotive, footwear, furniture, cushioning, specialized engineering applications.
|
|
BMW, CertainTeed, Electrolux, Firestone, Haier, Henkel, Johnson Controls, Louisiana Pacific and Norbord
|
|
Benzene =>Nitrobenzene and Aniline
|
|
|
|
Polyols
|
Polyols are combined with MDI and other isocynates to create a broad spectrum of polyurethane products, such as rigid foam, flexible foam and other non-foam applications.
|
|
|
Mostly PO, some EO
|
|
Wanhua Chemical Group, BASF,
DowDuPont, Covestro
and LyondellBasell
|
|
TPU
|
TPU is a high-quality, fully formulated thermal plastic that can be tailored with unique qualities. It can be used in injection molding and small components for automotive and footwear. It is also extruded into films, wires and cables for use in the coatings, adhesives, sealants and elastomers markets.
|
|
|
Isocyanate (such as MDI) and a polyol
|
|
|
|
Propylene Oxide
|
PO is an intermediate product used in polyols and PG. PG is used in antifreeze, personal care, etc
|
|
|
|
(Iso)butane, propylene and oxygen
|
|
|
|
MTBE
|
MTBE is an oxygenate that is blended with gasoline to reduce harmful vehicle emissions and to enhance the octane rating of the gasoline.
|
|
PMI and Rolympus
|
|
Tertiary butyl alcohol (byproduct of our PO process) and methanol
|
|
LyondellBasell , TPC and Enterprise
Products
|
|
|
|
|
|
|
|
|
|
|
|
Performance Products
|
Amines
|
Amines are a family of intermediate chemicals that are valued for their properties as a reactive agent, emulsifier, dispersant, detergent, solvent or corrosion inhibitor. Amines are used in personal care products, polyurethane foam, fuel and lubricant additives, paints and coatings, composites, gas treatment and construction materials.
|
|
Afton, Ecolab, Chevron-Oronite, Evonik, Hexion, Infineum, Ingevity, Lubrizol, Monsanto, Procter & Gamble and PPG
|
|
Internal: EO, EG and PO External: ethylene dichloride, caustic soda, ammonia, hydrogen, methylamines and acrylonitrile
|
|
AkzoNobel, BASF, Delamine, DowDuPont, Evonik and Tosoh
|
|
Maleic Anhydride
|
Maleic anhydride is an intermediate chemical used primarily to produce unsaturated polyester resins (UPRs). UPRs are mainly used in the production of fiberglass reinforced resins for marine, automotive and construction products. Maleic anhydride is also used in the production of lubricants, food additives and food acidulants.
|
|
AOC, Ashland, Chevron Oronite, Cranston, Dixie, Ingevity, Lubrizol, MFG Chemical, Polynt-Reichhold and Tate & Lyle
|
|
Normal butane
|
|
Lanxess, Flint Hills Resources, Bartek and Ashland
|
|
Surfactants
|
Surfactants are mainly used for their detergency and cleaning in laundry detergent, personal care, industrial and institutional cleaning applications. They are also valued for their emulsification, foaming, dispersing and wetting properties. Specialty surfactants are used in agrochemicals, oilfield, fuel and lubricant additives, electronic chemical, mining, construction, coating and textile treatment.
|
|
Monsanto, Procter & Gamble, Henkel, Unilever, Innospec, Stepan, NuFarm, Lubrizol, Ingevity and Ecolab
|
|
Internal: EO, EG and PO External: synthetic and natural alcohols, alpha olefin, tallow amine and nonylphenol
|
|
Shell, Sasol, DowDuPont, Clariant, BASF and Croda
|
|
Linear Alkyl-Benzene
(LAB)
|
LAB is a surfactant intermediate that is primarily used in producing linear alkyl-benzene sulfonate (LAS). LAS is used in laundry detergent. Additionally, specialty alkylate can be used in lubricant additive and oilfield applications.
|
|
Procter & Gamble, Colgate, Lubrizol, Unilever, Henkel and Church & Dwight
|
|
Benzene, normal paraffin and alpha olefin
|
|
Cepsa, Sasol, Isu, Formosan Union Chemical and Jin Tung Petrochemical
|
|
Ethylene Glycol (EG)
|
EG is primarily used in the production of polyester fibers, PET packaging and antifreeze.
|
|
DAK Americas, Helm and used internally
|
|
Internally produced EO
|
|
MEGlobal, Shell and Sabic
|
|
Ethylene Oxide (EO)
|
EO is an intermediate chemical that we use internally to produce EG, surfactants, carbonates, amines and polyols.
|
|
Used internally
|
|
Ethylene
|
|
Internal consumption
|
|
Olefins
|
Ethylene and propylene are used internally to produce EO & PO
|
|
Used internally
|
|
Ethane
|
|
Internal consumption
|
|
|
Product Line
|
End Markets / Applications
|
|
Representative Customers
|
|
Raw Materials
|
|
Representative Competitors
|
|
|
|
|
|
|
|
|
|
|
|
Advanced Materials
|
Technologically advanced
epoxy, acrylic and
polyurethane‑based
polymer formulations
|
Aerospace and industrial adhesives, composites for aerospace, automotive, oil and gas and wind power generation; construction and civil engineering; industrial coatings; electrical power transmission; consumer electronics and DIY adhesives.
|
|
Bodo Moeller, Chenglai, Freeman, Lianyungang, Ribelin, Schneider, Siemens, Speed Fair, Syngenta and Viasystems
|
|
BLR, epichlorohydrin, amines, polyols, isocyanates, acrylic materials, hardeners and fillers
|
|
Henkel, Sika, 3M, Sumitomo, Hexion, Elantas and Olin
|
|
High performance
thermoset
resins and curing agents
|
High performance chemical building blocks sold to formulators who develop formulations for aerospace, automotive, oil and gas, coatings, construction, electronics, electrical insulation applications.
|
|
Cytec, Hexcel and Toray
|
|
Epichlorohydrin (ECH), amines, phenols, aminophenols, fatty acids
|
|
Hexion, Olin, Sumitomo and Evonik
|
|
Base Liquid Resins (BLR),
Base Solid Resins (BSR)
|
BLR is used internally and is the basic building block for many of our downstream products. Approximately 69% of what we produce is used internally and the rest is sold into the merchant market.
|
|
Akzo, Omya and Sherwin Williams
|
|
Epichlorohydrin, bisphenol A (BPA), BLR, MDA and phenol and aminophenols
|
|
Olin, Hexion, Kukdo and NanYa
|
|
|
|
|
|
|
|
|
|
|
|
Textile Effects
|
Chemicals, Dyes & Inks
|
Textile dyes add color to textiles from cotton, polyester and nylon, while textile chemicals improve the performance characteristics of the textile. These are used in apparel, home and technical textiles. Home and institutional textiles include textiles that are used within the home or institutions such as hotels. Functional and technical textiles include automotive textiles, carpet, military fabrics protective wear, nonwoven and other technical fabrics.
|
|
Esquel Group, Fruit of the Loom, Guilford Mills, Hanesbrands, Kahatex, Sage Automotive, Tencate, Trident, Y.R.C. and Zaber & Zubair
|
|
Thousands of raw materials, with no one representing more than 5% of raw material costs
|
|
Dyes: Archroma, DyStar, Longsheng, Runtu and Jihua
Chemicals: Archroma, DyStar, Transfar/Tannatex and CHT
Digital Inks: Kiian/Jteck/Sawgrass, Sensient/Xennia and DowDuPont
|
For additional information about our business segments, including related financial information, see “Note 24. Operating Segment Information” to our consolidated financial statements and “Part II. Item 7. Management’s Discussion and Analysis of Financial Condition and Results of Operations” of this Form 10‑K.
Polyurethanes
General
We are a leading global manufacturer and marketer of a broad range of polyurethane chemicals, including MDI products, PO, polyols, PG and TPU (each discussed in more detail below under “—Products and Markets”). Polyurethane chemicals are used to produce rigid and flexible foams, as well as coatings, adhesives, sealants and elastomers. We focus on the higher‑margin, higher‑growth markets for specialty MDI and MDI‑based polyurethane systems. Growth in our Polyurethanes segment has been driven primarily by the continued substitution of MDI‑based products for other materials across a broad range of applications. We operate six primary polyurethane manufacturing facilities in the U.S., Europe and China. We also operate 20 strategically located downstream polyurethane formulation facilities, commonly referred to in the chemical industry as “systems houses,” located in close proximity to our customers worldwide (see facilities listed in “—Item 2. Properties” below), which enables us to focus on customer support, technical service and a differentiated product offering. We also operate a specialty polyol manufacturing facility focused on the insulation market and three downstream TPU manufacturing facilities in the U.S., Europe and China.
Our customers produce polyurethane products through the combination of an isocyanate, such as MDI, with polyols, which are derived largely from PO and EO. We are able to produce over 2,000 distinct MDI‑based polyurethane products by modifying the MDI molecule through varying the proportion and type of polyol used and by introducing other chemical additives to our MDI formulations. As a result, polyurethane products, especially those derived from MDI, are continuing to replace traditional products in a wide range of end‑use markets, including insulation in construction and appliances, cushioning for automotive and furniture, coatings, adhesives, wood binders for construction and furniture, footwear and other specialized engineering applications.
We are one of three North American producers of PO. We and some of our customers process PO into derivative products, such as polyols for polyurethane products, PG and various other chemical products. End uses for these derivative products include applications in the home furnishings, construction, appliances, packaging, automotive and transportation, food, paints and coatings and cleaning products industries. We also produce MTBE as a co‑product of our PO manufacturing process. MTBE is an oxygenate that is blended with gasoline to reduce harmful vehicle emissions and to enhance the octane rating of gasoline. See “—Item 1A. Risk Factors.”
In 1992, we were the first global supplier of polyurethane chemicals to open a technical service center in China. We have since expanded this facility to include an integrated polyurethanes formulation facility and a world scale research and development campus. In January 2003, we entered into two related joint ventures to build MDI production and finishing facilities near Shanghai, China in Caojing. In June 2006, HPS, a consolidated joint venture, began production at our MDI finishing plant. In September 2006, SLIC, an unconsolidated joint venture, began production at the MNB, aniline and crude MDI plants. We are in the process of expanding the capacity of these facilities and expect beneficial commercial operations during the first quarter of 2018. These world‑scale facilities strengthen our ability to service our customers in the critical Chinese market, the largest MDI market in the world, and will support the long‑term demand growth that we believe this region will continue to experience. Additionally, in November 2012, we entered into an agreement with Sinopec to form a joint venture to build a world scale PO/MTBE plant in Nanjing, China utilizing our proprietary PO/MTBE manufacturing technology. The facility was completed in early 2017 and beneficial commercial operations began in the second half of 2017. We own a 49% interest in the joint venture and account for our interest in the joint venture as an equity method investment.
Products and Markets
MDI is used primarily in rigid foam applications and in a wide variety of customized, higher‑value flexible foam as well as coatings, adhesives, sealants and elastomers. Polyols, including polyether and polyester polyols, are used in conjunction with MDI in rigid foam, flexible foam and other non‑foam applications. PO is one of the principal raw materials for producing polyether polyols. The following chart illustrates the range of product types and end uses for polyurethane chemicals.
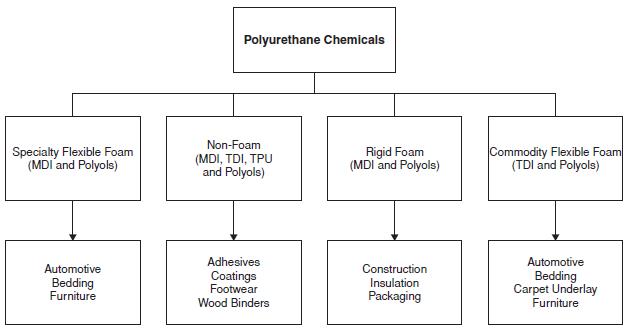
Polyurethane chemicals are sold to customers who combine the chemicals to produce polyurethane products. Depending on their needs, customers will use either component polyurethane chemicals produced for mass sales or polyurethane systems tailored for their specific requirements. By varying the blend, additives and specifications of the polyurethane chemicals, manufacturers are able to develop and produce a breadth and variety of polyurethane products.
Our strategy is focused on growing our differentiated product offering (specialty MDI and polyols, formulated MDI systems and TPU), which requires a greater emphasis on formulating capability to provide our downstream customers with the end effect required in their applications These differentiated products tend to require technical solutions, offer higher margins, lower volatility and are less dependent on industry utilization rates compared to sales of component MDI or component polyols.
MDI. MDI has grown substantially over the past three decades, increasing by a factor of 6% to 7% CAGR, well in excess of global GDP. MDI has a substantially larger market size and a higher growth rate than other polyurethane isocyanates. This is primarily because MDI can be used to make polyurethanes with a broader range of properties and can therefore be used in a wider range of applications. We believe that MDI and formulated MDI systems, which combine MDI and polyols, will continue to grow at approximately double the rate of global GDP driven by the mega trends of energy management, food preservation, demographics and urbanization/transportation. MDI offers key products benefits of energy efficiency, comfort and durability aligned with these megatrends. We believe that MDI and formulated MDI systems will continue to substitute for alternative materials such as fiberglass in insulation, phenol formaldehyde in wood binders and TDI in automotive and furniture. Specialty cushioning and insulation applications, thermoplastic polyurethanes and adhesives and coatings will further contribute to the continued growth of MDI. MDI experiences some seasonality in its sales reflecting its exposure to seasonal construction‑related end markets such as insulation and composite wood products. Sales generally peak during the spring and summer months in the northern hemisphere, resulting in greater sales volumes during the second and third quarters of the year.
TPU. TPU is a high‑quality, fully formulated thermal plastic derived from the reaction of MDI or an aliphatic isocyanate with polyols to produce unique qualities such as durability, flexibility, strength, abrasion‑resistance, shock absorbency and chemical resistance. We can tailor the performance characteristics of TPU to meet the specific requirements of our customers. TPU is used in injection molding and small components for the automotive and footwear
industries. It is also extruded into films for apparel, wires and cables for industrial use and in a wide variety of applications in the coatings, adhesives, sealants and elastomers markets.
Polyols. Polyols are combined with MDI and other isocyanates to create a broad spectrum of formulated polyurethane systems. Demand for specialty polyols has been growing at approximately the same rate at which MDI consumption has grown.
Aniline. Aniline is an intermediate chemical used primarily to manufacture MDI. The majority of our aniline is consumed internally with some sold to third parties. We believe that the lack of a significant spot market for aniline means that in order to remain competitive, MDI manufacturers must either be integrated with an aniline manufacturing facility or have a long‑term, cost‑competitive aniline supply contract.
PO. PO is an intermediate chemical used mainly to produce a wide range of polyols and PG. Demand for PO depends largely on overall economic demand, especially that of consumer durables. Strategically, we use PO produced at our world scale PO/MTBE facility in Port Neches, Texas, downstream in our formulated MDI systems. We also constructed a PO/MTBE facility in Nanjing, China with the strategic aim of supplying PO downstream into our China business, accelerating our differentiated growth in the world’s largest PU market. In addition, we also have an important internal strategic outlet for PO, downstream into our Performance Products amines business, which generates significant added value to the PO molecule.
MTBE. MTBE is an oxygenate that is blended with gasoline to reduce harmful vehicle emissions and to enhance the octane rating of gasoline. While MTBE has been effectively eliminated in the U.S., demand continues to grow in other regions of the world. See “—Item 1A. Risk Factors.” In 2011, we announced the signing of a license agreement with Chinese chemicals manufacturer Yantai Wanhua Polyurethanes Co., Ltd, for the production of PO and MTBE. In November 2012, we entered into an agreement to form a joint venture with Sinopec to construct and operate a PO/MTBE facility in China. Under the joint venture agreement, we hold a 49% interest in the joint venture and Sinopec holds a 51% interest. See “—Manufacturing and Operations” below and “Part II. Item 7. Management’s Discussion and Analysis of Financial Condition and Results of Operations.”
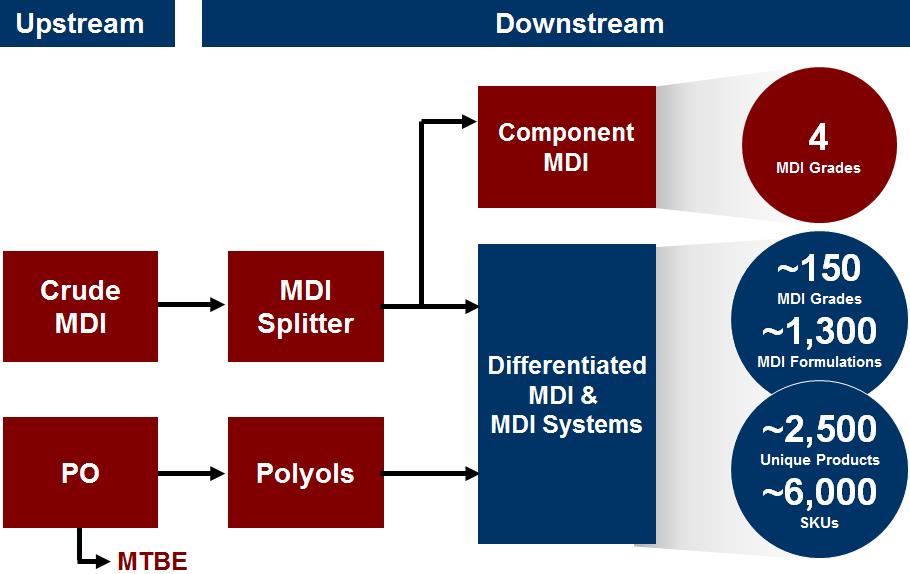
It is important to recognize the strategic link between PO, polyols and MDI. MTBE is a co‑product of the PO manufacturing process which generates cash in the gasoline market. Our strategic focus is on growing our differentiated (specialty MDI and polyols, formulated MDI based systems and TPU) sales and the diagram below provides an overview of that focus with an approximation of the number of grades, formulations, products and stock keeping units which we produce and sell.
Sales and Marketing
We market our polyurethane chemicals to over 3,500 customers in more than 90 countries. Our sales, marketing and technical resources are organized to support major regional markets and key end‑use markets, some of which requires a coordinated global approach, such as key accounts across the automotive sector. These key end‑use markets include the commercial and residential insulation, appliance, automotive, footwear, furniture and coatings, adhesives, sealants and elastomers industries. We sell both directly and indirectly to customers, the latter via a network of distributors and agents who in turn sell our products to customers who cannot be served as cost effectively by our internal sales groups.
We provide a wide variety of polyurethane solutions as components (i.e., the isocyanate or the polyol) or in the form of “systems” in which we provide the total isocyanate and polyol formulation to our customers. Our ability to deliver a range of polyurethane solutions and technical support tailored to meet our customers’ needs is critical to our long‑term success. We have strategically located our downstream polyurethane systems houses close to our customers, enabling us to focus on customer support and technical service. We believe this customer support and technical service system contributes to customer retention and also provides opportunities for identifying further product and service needs of customers.
Our strategy is to grow the number of and capability of our downstream facilities both organically and inorganically. As a result, we have made a number of “bolt‑on” acquisitions in recent years to expand our downstream footprint and align with our strategic intent.
We believe that the extensive market knowledge and industry experience of our sales teams and technical experts, in combination with our strong emphasis on customer relationships, have facilitated our ability to establish and maintain long‑term customer supply positions. Our sales strategy is to continue to increase sales to existing customers and to attract new customers by providing innovative solutions, quality products, reliable supply, competitive prices and superior customer service.
Manufacturing and Operations
Our world‑scale MDI production facilities are located in Geismar, Louisiana; Rotterdam, The Netherlands; and through our joint ventures in Caojing, China. These facilities receive aniline, which is a primary material used in the production of MDI, from our facilities located in Geismar, Louisiana; Wilton, U.K.; and Caojing, China. We believe that this relative scale and product integration of our large facilities is necessary to provide cost competitiveness in MDI production. The following table sets forth the annual production capacity of polyurethane chemicals at each of our polyurethanes facilities:
|
|
|
|
|
|
|
|
|
|
|
|
|
|
|
|
|
|
|
|
|
|
MDI
|
|
Polyols
|
|
TPU
|
|
Aniline
|
|
Nitrobenzene
|
|
PO
|
|
PG
|
|
MTBE
|
|
|
|
|
|
|
(millions of
|
|
|
|
|
(millions of pounds)
|
|
gallons)
|
|
|
Caojing, China
|
|
370
|
(1)
|
|
|
|
|
|
|
|
|
|
|
|
|
|
|
|
Geismar, Louisiana
|
|
1,060
|
|
160
|
|
|
|
750
|
(2)
|
1,000
|
(2)
|
|
|
|
|
|
|
|
Houston, Texas
|
|
|
|
170
|
|
|
|
|
|
|
|
|
|
|
|
|
|
|
Jinshan, China
|
|
|
|
|
|
29
|
|
|
|
|
|
|
|
|
|
|
|
|
Nanjing, China
|
|
|
|
|
|
|
|
|
|
|
|
529
|
(3)
|
|
|
260
|
(3)
|
|
Osnabrück, Germany
|
|
|
|
26
|
|
59
|
|
|
|
|
|
|
|
|
|
|
|
|
Port Neches, Texas
|
|
|
|
|
|
|
|
|
|
|
|
525
|
|
145
|
|
260
|
|
|
Ringwood, Illinois
|
|
|
|
|
|
20
|
|
|
|
|
|
|
|
|
|
|
|
|
Rotterdam, The Netherlands
|
|
1,036
|
|
190
|
|
|
|
|
|
|
|
|
|
|
|
|
|
|
Wilton, U.K.
|
|
|
|
|
|
|
|
783
|
|
1,045
|
|
|
|
|
|
|
|
|
Total
|
|
2,466
|
|
546
|
|
108
|
|
1,533
|
|
2,045
|
|
1,054
|
|
145
|
|
520
|
|
|
|
(1) Represents our 50% share of capacity from SLIC.
|
|
(2) Represents our approximately 85% share of capacity under our consolidated Rubicon LLC manufacturing joint venture with Lanxess AG, formerly Chemtura Corporation.
|
|
(3) Represents our approximately 49% share of capacity under joint venture agreement with Sinopec Jinling Company, a subsidiary of Sinopec.
|
At our Geismar, Rotterdam and Caojing facilities we utilize sophisticated proprietary technology to produce MDI. This technology contributes to our position as a low cost MDI producer. In addition to MDI, we use a proprietary manufacturing process to manufacture PO. We own or license all technology and know‑how developed and utilized at our PO facility. Our process combines isobutane and oxygen in proprietary oxidation (peroxidation) reactors, thereby forming TBHP and TBA, which are further processed into PO and MTBE, respectively. Because our PO production process is less expensive relative to other technologies and allows PO co‑products to be processed into saleable or useable materials, we believe that our PO production technology possesses several distinct advantages over its alternatives.
Joint Ventures
Rubicon Joint Venture. Lanxess AG (“Lanxess”), formerly Chemtura Corporation, is our joint venture partner in Rubicon LLC, which owns aniline, nitrobenzene and DPA manufacturing facilities in Geismar, Louisiana. We are entitled to approximately 85% of the nitrobenzene and aniline production capacity of Rubicon LLC, and Lanxess is entitled to 100% of the DPA production. In addition to operating the joint venture’s aniline, nitrobenzene and DPA facilities, Rubicon LLC operates our wholly‑owned MDI, polyol and maleic anhydride facilities at Geismar and is responsible for providing other auxiliary services to the entire Geismar complex. As a result of this joint venture, we are able to achieve greater scale and lower costs for our products than we would otherwise have been able to obtain. Rubicon LLC is consolidated in our financial statements.
Chinese MDI Joint Ventures. We are involved in two related joint ventures which operate MDI production facilities in Caojing, China. SLIC, our manufacturing joint venture with BASF and three Chinese chemical companies, produces MNB, aniline and crude MDI. We effectively own 35% of SLIC and account for our investment under the equity method. HPS, our splitting joint venture with Shanghai Chlor‑Alkali Chemical Company, Ltd, manufactures pure MDI, polymeric MDI, MDI variants and formulated MDI systems. We own 70% of HPS and it is consolidated in our
financial statements. These projects have been funded by a combination of equity invested by the joint venture partners and borrowed funds. The total production capacity of the SLIC facilities is 740 million pounds per year of MDI, of which HPS is entitled to 50%, and the splitting capacity of the HPS facility is 370 million pounds per year of MDI.
We are in the process of expanding our SLIC capacity in Caojing, China by 530 million pounds of MDI per year. In addition, we are also expanding our HPS splitting capacity. Mechanical completion was achieved at the end of 2017, and we are currently in the process of starting up these units and expect beneficial commercial operations during the first quarter of 2018.
Chinese PO/MTBE Joint Venture. In November 2012, we entered into an agreement to form a joint venture with Sinopec. The joint venture involves the construction and operation of a PO/MTBE facility in China. Under the joint venture agreement, we hold a 49% interest in the joint venture and Sinopec holds a 51% interest. Our total equity investment is anticipated to be approximately $76 million, net of license fees from the joint venture. At the end of 2017, cumulative capital contributions were approximately $83 million, net of license fees from the joint venture. We expect to receive additional license fees of $7 million during 2018. Beneficial commercial operations began during the second half of 2017.
Raw Materials
The primary raw materials for MDI‑based polyurethane chemicals are benzene and PO. Benzene is a widely available commodity that is the primary feedstock for the production of MDI and aniline. Historically, benzene has been the largest component of our raw material costs. We purchase benzene from third parties to manufacture nitrobenzene and aniline, almost all of which we then use to produce MDI.
A major cost in the production of polyols is attributable to the costs of PO. The integration of our PO business with our polyurethane chemicals business gives us access to a competitively priced, strategic source of PO and the opportunity to develop polyols that enhance our range of MDI products. The primary raw materials used in our PO production process are butane/isobutane, propylene, methanol and oxygen.
Competition
Our major competitors in the polyurethane chemicals market include BASF, Covestro, DowDuPont, Wanhua Chemical Group and LyondellBasell. While these competitors and others produce various types and quantities of polyurethane chemicals, we focus on MDI and MDI‑based formulated polyurethane systems. Our polyurethane chemicals business competes in two basic ways: (1) where price is the dominant element of competition, our polyurethane chemicals business differentiates itself by its high level of customer support, including cooperation on technical and safety matters; and (2) elsewhere, we compete on the basis of product performance, our ability to react quickly to changing customer needs and providing customers with innovative solutions to their needs.
Performance Products
General
Our Performance Products segment has leading global positions in the manufacture and sale of amines, surfactants and maleic anhydride and serves a wide variety of consumer and industrial end markets. Our Performance Products segment is organized by region and product family. Our product families are: amines, maleic anhydride (including catalyst and licensing), surfactants (including LAB) and upstream intermediates.
We produce a wide range of amines, many of which are sold into specialty markets such as epoxy curing agents, oil exploration and production, agrochemicals, and fuel and lubricant additives. We believe we are the largest global producer of polyetheramines, one of the largest producers of 2‑(2‑amino ethoxy) ethanol, sold under our DGA® brand, the largest global producer making the full range of ethyleneamines, the second largest producer of morpholine and the second largest North American producer of ethanolamines. We are the only producer and largest supplier of propylene carbonate and ethylene carbonate in North America. Many of the markets for these products have growth rates in excess of global GDP.
We believe we are the largest global producer of maleic anhydride, a highly versatile chemical intermediate that is used to produce UPRs, which are mainly used in the production of fiberglass reinforced resins for marine, automotive and construction products. Maleic anhydride is also used in the production of lubricants, food additives and artificial sweeteners. We are also the leading licensor of maleic anhydride manufacturing technology and are amongst the largest suppliers of fixed bed catalyst used in the manufacture of maleic anhydride from n-butane.
We consume internally produced and third‑party‑sourced base petrochemicals in the manufacture of our surfactants, LAB and ethanolamines products. We produce a broad range of surfactants, which are primarily used in detergency, personal care, agrochemical, oilfield and industrial applications. We manufacture LAB for use as an intermediate in laundry detergents and a higher molecular weight alkylate used as a lubricant additive.
We also use internally produced and third‑party‑sourced base petrochemicals to produce EG, which is primarily used in the production of polyester fibers, PET packaging and antifreeze.
Beginning in 2013, our Performance Products segment initiated a restructuring program to refocus its surfactants business in Europe. In connection with this program, in 2014 we completed the sale of our European commodity surfactants business, including the ethoxylation facility in Lavera, France to Wilmar. Additionally, in 2014 we ceased production at our Patrica, Italy surfactants facility. In December 2015, we announced plans for a reorganization of our commercial and technical functions and a refocused divisional business strategy to better position our segment for growth in coming years and we launched a program to capture growth opportunities, improve manufacturing cost efficiency and reduce inventories. In 2016, we expanded our EO capacity by 265 million pounds at our Port Neches, Texas facility. In December 2016, we completed the sale of our European differentiated surfactants business to Innospec Inc. for $199 million in cash plus our retention of trade receivables and payables for an enterprise value of $225 million. We remain committed to our global surfactants business, including in the U.S. and Australia, where our differentiated surfactants businesses are backward integrated into essential feedstocks.
We operate 14 Performance Products manufacturing facilities in North America, Europe, the Middle East, Asia and Australia.
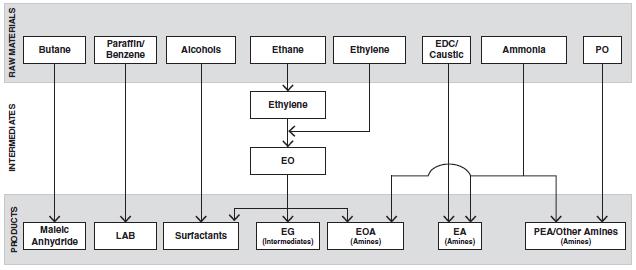
The following chart illustrates the primary raw materials used and range of product types produced by the Performance Products segment:
Products and Markets
Amines. Amines are a family of intermediate chemicals that are produced by reacting ammonia with various ethylene and propylene derivatives. Generally, amines are valued for their properties as a reactive agent, emulsifier, dispersant, solvent or corrosion inhibitor. Growth in demand for amines is highly correlated with GDP growth. However, certain segments of the amines market, such as polyetheramines, have historically grown at rates in excess of GDP growth due to new product development, technical innovation and end‑use substitution. As amines are generally sold based upon the performance characteristics that they provide to customer‑specific end‑use applications, pricing does not
generally fluctuate directly with movements in underlying raw materials. Our amines business is organized around the following product groups:
|
Product Group
|
|
Applications
|
|
Polyetheramines
|
|
Epoxy composites, polyurethane foams and insulation, construction and flooring, paints and coatings, lubricant and fuel additives, adhesives, agrochemicals, oilfield chemicals, printing inks, pigment dispersion
|
|
Ethyleneamines
|
|
Chemical building block used in lubricant and fuel additives, epoxy hardeners, wet strength resins, chelating agents, fungicides
|
|
Ethanolamines
|
|
Wood preservatives, herbicides, construction products, gas treatment, metalworking, personal care
|
|
Other specialty amines, including DGA® Agent
|
|
Gas treating, agricultural chemicals, personal care, lubricant and fuel additives, polyurethane foams, fabric softeners, paints and coatings, refinery processing, water treating
|
Polyetheramines are produced by reacting polyol with ammonia. They provide sophisticated performance characteristics as an additive in the manufacture of highly customized epoxy formulations, enabling customers to penetrate new markets and substitute for traditional curing materials.
Our ethyleneamines are manufactured by reacting EDC and caustic soda with ammonia to produce a range of various ethyleneamines homologues having different molecular weights. Most other producers utilize a reductive amination process, which yields a light slate of ethyleneamines. We believe our heavier slate of homologues allows access to a greater range of markets.
Ethanolamines are a range of chemicals produced by the reaction of EO with ammonia. There are a limited number of competitors due to the technical and cost barriers to entry.
Our amines are used in a wide variety of mainly industrial applications, including composites, paints and coatings, polyurethane foam, fuel and lubricant additives, and solvents. Our key amines customers include Afton, Chevron-Oronite, Ecolab, Evonik, Hexion, Infineum, Ingevity, Lubrizol, Monsanto, Procter & Gamble and PPG.
Maleic Anhydride (including catalyst and licensing). Maleic anhydride is a highly versatile chemical intermediate that is used to produce UPRs, which are the main ingredient in fiberglass reinforced resins used for marine and automotive applications and commercial and residential construction products. Maleic anhydride is also used in the production of lubricants, food additives and artificial sweeteners.
|
Product Group
|
|
Applications
|
|
Maleic anhydride
|
|
Boat hulls, automotive, construction, lubricant and fuel additives, countertops, agrochemicals, paper and food additives
|
|
Maleic anhydride catalyst and technology licensing
|
|
Maleic anhydride, BDO and its derivatives, and PBT production
|
Maleic anhydride is produced by oxidizing either benzene or normal butane through the use of a catalyst. Our maleic anhydride technology is a proprietary fixed bed butane process with solvent. We believe that our process is superior in the areas of feedstock, energy efficiency and solvent recovery. The maleic anhydride‑based route to BDO manufacture is currently the preferred process technology and is favored over the other routes, which include PO, butadiene and acetylene as feedstocks. As a result, the growth in demand for BDO has resulted in increased demand for our maleic anhydride technology and catalyst. Generally, changes in price have resulted from a combination of changes in industry capacity utilization and underlying raw material costs.
We license our maleic anhydride technology and supply our catalysts to licensees and to worldwide merchant customers. Revenue from licensing and catalyst comes from new plant commissioning, as well as current plant retrofits and catalyst change schedules. Our licensing group also licenses technology on behalf of other Performance Products businesses and other segments.
Our key maleic anhydride customers include AOC, Ashland, Chevron Oronite, Cranston, Dixie, Ingevity, Lubrizol, MFG Chemical, Polynt-Reichhold and Tate & Lyle.
Surfactants (including LAB). Surfactants or “surface active agents” are substances that combine a water soluble component with a water insoluble component in the same molecule. While surfactants are most commonly used for their detergency in cleaning applications, they are also valued for their emulsification, foaming, dispersing, penetrating and wetting properties in a variety of industries.
We are a leading global manufacturer of nonionic surfactants products and are characterized by our breadth of product offering and market coverage. Following the sale of our European surfactants business to Innospec at the end of 2016, we now have certain products toll manufactured in Europe.
|
Product Group
|
|
Applications
|
|
Surfactants
|
|
Home and personal care, agricultural chemicals, construction, paper de‑inking and lubricants
|
|
Specialty alkylates
|
|
Precursors for lubricant additives
|
|
LAB
|
|
Consumer, industrial and institutional detergents
|
Demand growth for surfactants used in basic detergency applications is relatively stable and exhibits little cyclicality. However, many product applications for surfactants can demand new formulations with improved performance characteristics, which affords considerable opportunity for innovative surfactants manufacturers like us to provide surfactants and blends with differentiated specifications and properties. We continue to strengthen and diversify our surfactant product offering into formulated specialty surfactant products for use in various industrial applications such as leather and textile treatment, foundry and construction, agrochemicals, fuels and lubricants, personal care and polymers and coatings.
For basic surfactants, pricing tends to have a strong relationship to underlying raw material prices and usually lags raw material price movements. Surfactants used in more specialty applications are generally sold based upon the performance characteristics that they provide to customer‑specific end‑use application. Our key surfactants customers include Monsanto, Procter & Gamble, Henkel, Unilever, Innospec, Stephan, NuFarm, Lubrizol, Ingevity and Ecolab.
LAB is a surfactant intermediate, which is produced through the reaction of benzene with either normal paraffins or linear alpha olefins. Nearly all the LAB produced globally is converted into LAS, a major anionic surfactant used worldwide for the production of consumer, industrial and institutional laundry detergents. We also manufacture a higher‑molecular‑weight alkylate, which is used as an additive to lubricants. Our key customers for LAB and specialty alkylates include Procter & Gamble, Colgate, Lubrizol,Unilever, Henkel and Church & Dwight.
Upstream Intermediates. We consume internally produced and third‑party‑sourced base petrochemicals in the manufacture of our surfactants, LAB, and ethanolamines products, which are primarily used in detergency, consumer products and industrial applications. We also produce EG, which is primarily used in the production of polyester fibers and PET packaging.
We consume our internally produced EO to produce three types of EG: MEG, DEG and TEG. MEG is consumed primarily in the polyester (fiber and bottle resin) and antifreeze end markets and is also used in a wide variety of industrial applications including synthetic lubricants, plasticizers, solvents and emulsifiers. DEG is consumed internally for the production of Morpholine and DGA® Agent and polyols. TEG is used internally for the production of polyols and is sold into the market for dehydration of natural gas. We continue to optimize our EO and EG operations depending on the fundamental market demand for EG.
|
Product Group
|
|
Applications
|
|
EG
|
|
Polyester fibers and PET bottle resins, heat transfer and hydraulic fluids, chemical intermediates, natural gas and hydrocarbon treating agents, unsaturated polyester resins, polyester polyols, plasticizers, solvent
|
Sales and Marketing
We sell over 1,500 products to over 3,000 customers globally through our Performance Products regional sales and marketing organizations, which have extensive market knowledge, considerable chemical industry experience and well established customer relationships.
In more specialty markets (e.g., energy, materials, additives, processing chemicals and agrochemicals), our marketing efforts are focused on how our product offerings perform in certain customer applications. We believe that
this approach enhances the value of our product offerings and creates opportunities for ongoing differentiation in our development activities with our customers.
Our intermediate surfactants are sold mainly into the home and personal care market for which we have a dedicated marketing group. We also sell EG directly.
We provide extensive pre‑ and post‑sales technical service support to our customers where our technical service professionals work closely with our research and development functions to tailor our product offerings to meet our customers unique and changing requirements. These technical service professionals interact closely with our marketing managers and business leadership teams to help guide future offerings and market approach strategies. In addition to our focused direct sales efforts, we maintain an extensive global network of distributors and agents that also sell our products. These distributors and agents typically promote our products to smaller end‑use customers who cannot be served cost effectively by our direct sales forces.
Manufacturing and Operations
Our Performance Products segment has the capacity to produce more than six billion pounds annually of a wide variety of products and formulations at 14 manufacturing locations in North America, EAME, Asia and Australia. These production capacities are as follows:
|
|
|
|
|
|
|
|
|
|
|
|
|
Current capacity
|
|
|
|
North
|
|
|
|
|
|
|
|
Product Area
|
|
America
|
|
EAME
|
|
APAC(1)
|
|
Total
|
|
|
|
(millions of pounds)
|
|
Amines
|
|
1,063
|
|
237
|
(2)
|
107
|
|
1,407
|
|
Surfactants
|
|
613
|
|
|
|
126
|
|
739
|
|
LAB
|
|
400
|
|
|
|
|
|
400
|
|
Maleic anhydride
|
|
340
|
|
231
|
(3)
|
|
|
571
|
|
Carbonates
|
|
52
|
|
|
|
|
|
52
|
|
EG
|
|
890
|
|
|
|
55
|
|
945
|
|
EO
|
|
1,265
|
|
|
|
100
|
|
1,365
|
|
Ethylene
|
|
460
|
|
|
|
|
|
460
|
|
Propylene
|
|
300
|
|
|
|
|
|
300
|
|
|
|
|
|
|
(1) Asia‑Pacific region including India (“APAC”).
|
|
|
|
(2) Includes up to 30 million pounds of ethyleneamines that are made available from DowDuPont’s Terneuzen, The Netherlands facility by way of a long‑term supply arrangement and 70 million pounds from AAC, our consolidated 50%‑owned joint venture, located in Jubail, Saudi Arabia.
|
|
|
|
(3) Represents total capacity of a facility owned by Sasol‑Huntsman, of which we own a 50% equity interest and Sasol owns the remaining 50% interest. We have consolidated the financial results of this entity since April 2011.
|
Our amines facilities are located globally. These facilities have a competitive cost base and use modern manufacturing units that allow for flexibility in production capabilities and technical innovation.
Almost all of our surfactants facilities in the U.S. and Asia have integrated EO supply, which we believe gives us a competitive cost advantage.
Our primary ethylene, propylene, EO, EG and ethanolamines facilities are located in Port Neches, Texas alongside our Polyurethanes PO/MTBE facility. The Port Neches, Texas facility benefits from extensive logistics infrastructure, which allows for efficient sourcing of other raw materials and distribution of finished products.
A number of our facilities are located within large integrated petrochemical manufacturing complexes. We believe this results in greater scale and lower costs for our products than we would be able to obtain if these facilities were stand‑alone operations. These include our LAB facility in Chocolate Bayou, Texas; our maleic anhydride facilities in Pensacola, Florida, Geismar, Louisiana and Moers, Germany and our ethyleneamines facility in Freeport, Texas.
Joint Ventures
Ethyleneamines Joint Venture. Since July 1, 2010, we have consolidated the results of AAC, our 50%‑owned joint venture with the Zamil Group. AAC operates an ethyleneamines manufacturing plant in Jubail, Saudi Arabia. The plant has an approximate annual capacity of 60 million pounds. We purchase and sell all of the production from this joint venture.
Maleic Anhydride Joint Venture. Since the second quarter of 2011, we have consolidated the results of Sasol‑Huntsman, our 50%‑owned maleic anhydride joint venture. This entity operates a manufacturing facility in Moers, Germany with the capacity to produce 230 million pounds of maleic anhydride. The output from the facility is sold in the European region.
Raw Materials
We have the capacity to produce 460 million pounds of ethylene and 300 million pounds of propylene, depending on feedstocks, at our Port Neches, Texas facility. All of the ethylene is used to produce EO and all of the propylene is used to produce PO at our Port Neches, Texas facility (primarily for our Polyurethanes segment). We have the capacity to use approximately 1,200 million pounds of ethylene each year in the production of EO and ethyleneamines. Accordingly, we purchase or toll the remainder of our ethylene requirements from third parties. We consume all of our EO in the manufacture of our EG, surfactants, carbonates and amines products. We also use internally produced PO and EG in the manufacture of these products.
In addition to internally produced raw materials, the main raw materials used in the production of our amines are EDC, caustic soda, ammonia, hydrogen, methylamines and acrylonitrile. The majority of these raw materials are available from multiple sources in the merchant market at competitive prices.
Maleic anhydride is produced by the reaction of normal butane with oxygen using our proprietary catalyst. The principal raw material is normal butane, which is purchased pursuant to long‑term contracts and delivered to our Pensacola, Florida site by barge, to our facility in Geismar, Louisiana via pipeline and to our Moers, Germany joint venture site by railcar. Our maleic anhydride catalyst is toll‑manufactured by a third party according to our proprietary methods. These raw materials are available from multiple sources at competitive prices.
In the production of surfactants and LAB, our primary raw materials, in addition to internally produced and third‑party sourced EO and ethylene, are synthetic and natural alcohols, paraffin, alpha olefins, benzene and nonylphenol. All of these raw materials are widely available in the merchant market at competitive prices.
Competition
There are a small number of competitors for many of our amines due to the considerable customization of product formulations, the proprietary nature of many of our product applications and manufacturing processes and the relatively high research and development and technical costs involved. Our global competitors include AkzoNobel, BASF, Delamine, DowDuPont, Evonik and Tosoh. We compete primarily on the basis of product performance, new product innovation and, to a lesser extent, on the basis of price.
In our maleic anhydride market, we compete primarily on the basis of price, customer service, technical support and logistics management. Our competitors include Lanxess, Flint Hills Resources, Bartek and Ashland. We are a leading global supplier of fixed bed catalyst for the manufacture of maleic anhydride from n-butane. Competitors in our maleic anhydride catalyst market include Clariant and Polynt-Reichhold. In our maleic anhydride technology licensing market, our primary competitor is Conser. We compete primarily on the basis of technological performance and service.
In surfactants, we compete in a broad range of markets with major global suppliers as well as various smaller or more local competitors. Our major competitors include Shell, Sasol, DowDuPont, Clariant, BASF and Croda. For our more specialty offerings into markets such as agrochemicals, oilfield and personal care, we compete on the basis of the performance of our product in customer applications, service and price. Competition in much of the detergency market is based principally on price and reliability of supply.
There are numerous global producers of EG. Our main competitors include global companies such as MEGlobal, Shell and Sabic, as well as various smaller or more local competitors. We compete primarily on the basis of price.
Advanced Materials
General
Our Advanced Materials segment is a leading global manufacturer and marketer of technologically advanced epoxy, acrylic and polyurethane‑based polymer products. We focus on formulations and systems that are used to address customer‑specific needs in a wide variety of industrial and consumer applications. Our products are used either as replacements for traditional materials or in applications where traditional materials do not meet demanding engineering specifications. For example, structural adhesives are used to replace metal rivets and advanced composites are used to replace traditional aluminum panels and other steel materials to lighten structures in aerospace, automotive and other transportation. Our Advanced Materials segment is characterized by the breadth of our product offering, our expertise in complex chemistry, our long‑standing relationships with our customers, our ability to develop and adapt our technology and our applications expertise for new markets and new applications.
We operate synthesis, formulating and production facilities in North America, Europe, Asia, and South America. We sell to more than 1,700 customers in the following end markets: aerospace, automotive, liquid natural gas transport, coatings and construction, printed circuit boards, consumer, industrial and automotive electronics, consumer and industrial appliances, wind power generation, consumer/do it yourself (“DIY”), electrical power transmission and distribution, recreational sports equipment, medical appliances and food and beverage packaging.
Products and Markets
Aerospace. Our Advanced Materials segment is a leading global supplier of advanced, high‑performance materials for the fabrication and repair of aircraft components. We supply leading aerospace companies with innovations in composites, adhesives, laminating and repair systems.
We offer a wide range of materials to the aerospace market under the ARALDITE®, EPIBOND®, EPOCAST® and URALANE® brands. Many of these products are qualified under the specification of major aerospace original equipment manufacturers (“OEM”), complying with appropriate regulations governing large civil aircraft.
Automotive, Wind and Industrial Composites. We offer to the automotive, wind, recreational sports equipment and industrial composite markets, including leading automotive OEM’s and Tier 1 suppliers, high end composite formulations. Lightweight, strength, flexibility, shorter cycle time and fatigue resistance are key requirements of our industrial partners. Our Advanced Materials segment had numerous awards from the JEC Composite Association for innovation in the composite industry.
Our products are used by leading wind blade manufacturers on a large range of applications from plugs to complete composite turbine blade production, as well as its assembly and repair. Our portfolio includes standard products as well as custom‑made solutions formulated to meet specific customer requirements.
Electrical Engineering and Electronics. We are a leading global supplier of insulating materials for motors, generators, switchgears, distribution and instrument transformers, and insulators and bushings for utility and industrial applications. The products formulated by our Advanced Materials segment are designed to provide an extended service life and meet specific industry requirements for electrical insulation in indoor and outdoor environments.
In the field of electronics, our Advanced Materials segment has a long history delivering a wide range of solutions meeting stringent requirements for electronics applications, such as high temperature and chemical resistance, flame‑retardancy and excellent mechanical and dielectric properties. The strong global push for e-vehicles opens up new opportunities in e-motor encapsulation.
Structural Adhesives. ARALDITE® is an important brand in high‑performance adhesive technologies. We offer formulation expertise in various chemistries, including epoxies, polyurethanes, methacrylates and phenolics.
Our materials address requirements such as long open times for large area applications, fast‑curing adhesives for early removal and rapid through‑put, resistance to high temperature, water and chemicals, thixotropy for gap‑filling or vertical applications, and toughness, impact‑resistance and elasticity to cope with different thermal expansions when bonding larger structures.
Sales and Marketing
We maintain multiple routes to market to service our diverse and fragmented customer base throughout the world. These routes to market range from using our own direct sales force for targeted, technically‑oriented distribution to mass distribution. Our direct sales force focuses on engineering solutions for our major customers who purchase
significant amount of product. We use technically‑oriented specialist distributors to augment our sales effort in niche markets and applications where we do not believe it is appropriate to develop direct sales resources. We use mass general distribution channels to sell our products into a wide range of general applications where technical expertise is less important, which reduces our overall selling expenses. We believe our use of multiple routes to market enables us to reach a broader customer base at an efficient cost.
We conduct sales activities through dedicated regional sales teams in EAME, Asia and the Americas. Our global customers are covered by key account managers who are familiar with the specific requirements of these customers. The management of long‑standing customer relationships is critical to the sales and marketing process.
For our consumer/DIY range, with the exception of the Indian market, we have entered into branding and distribution arrangements. Under these arrangements, our distribution partners fund advertising and sales promotions, negotiate and sell to major retail chains, own inventories and provide store deliveries (and sometimes shelf merchandising) in exchange for ARALDITE® branded, ready‑to‑sell packaged products.
Manufacturing and Operations
We are a global business serving customers in three principal geographic regions: EAME, Asia and the Americas. To service our customers efficiently, we maintain manufacturing plants around the world with a strategy of global, regional and local manufacturing employed to optimize the level of service and minimize the cost to our customers. Our facilities in Asia are well‑positioned to take advantage of the market growth that is expected in these regions. The following table summarizes the plants that we operate:
|
Location
|
|
Description of Facility
|
|
Bad Saeckingen, Germany
|
|
Formulating Facility
|
|
Bergkamen, Germany
|
|
Synthesis Facility
|
|
Duxford, U.K.
|
|
Formulating Facility
|
|
East Lansing, Michigan
|
|
Formulating Facility
|
|
Ho Chi Minh City, Vietnam(1)(2)
|
|
Formulating Facility
|
|
Los Angeles, California
|
|
Formulating Facility
|
|
McIntosh, Alabama
|
|
Resins and Synthesis Facility
|
|
Monthey, Switzerland
|
|
Resins and Synthesis Facility
|
|
Nanjing, China(1)
|
|
Formulating Facility
|
|
Pamplona, Spain
|
|
Synthesis Facility
|
|
Panyu, China(1)(3)
|
|
Formulating and Synthesis Facility
|
|
Taboão da Serra, Brazil
|
|
Formulating Facility
|
|
|
(1) Leased land and/or building.
|
|
|
|
(2) Formulating facility is currently under construction
|
|
|
|
(3) 95%‑owned and consolidated manufacturing joint venture with Guangzhou Sheng’an Package Company Limited.
|
Raw Materials
The principal raw materials we purchase for the manufacture of basic and advanced epoxy resins are epichlorohydrin, bisphenol A, MDA, phenol and aminophenols. We also purchase amines, polyols, isocyanates, acrylic materials, hardeners and fillers for the production of our formulated polymer systems and complex chemicals and additives. Raw material costs constitute a sizeable percentage of the costs for certain applications. We have supply contracts with a number of suppliers. The terms of our supply contracts vary, but, in general, these contracts contain provisions that set forth the quantities of product to be supplied and purchased. Formula pricing is sometimes used if advantageous for the business.
Additionally, we produce large volumes of some of our most important raw materials, such as BLR and its basic derivatives, which are the basic building blocks of many of our products. Approximately 69% of the BLR we produce is consumed internally in our downstream products. The balance of our BLR is sold in the merchant market, allowing us to increase the utilization of our production plants and lower our overall BLR production cost.
We consume certain amines produced by our Performance Products segment and isocyanates produced by our Polyurethanes segment, which we use to formulate Advanced Materials products.
Competition
The markets in which Advanced Materials competes are diverse and require an appropriate human capital and asset footprint to compete effectively. The competitive intensity, capital investment and development of proprietary technology and maintenance of product research and development are all market specific. We operate dedicated technology centers in Basel, Switzerland; The Woodlands, Texas; and Shanghai, China in support of our product and technology development. Among our competitors are some of the world’s largest chemical companies with integrated raw material value chains to formulation companies that leverage intellectual and highly proprietary technology for problem solving.
Aerospace. Our leading market position is driven by our specialty resins and formulations offerings backed by customer‑specific certifications, quality and consistency. These products are value‑added, and differentiated, backed by many years of reliable global supply and service. Our major competitors include Hexion, Sumitomo, Wakayama Seika, 3M and Henkel.
Automotive, Wind and Industrial Composites. These dynamic growth markets for thermoset resins are being driven by light weighting and energy efficiency, and are serviced by our leading positions in systems formulations backed by application and process manufacturing knowledge. Our product offering allows for competitively priced solutions with a robust supply chain to fulfill customers’ expectant demand for service and quality. Our major competitors include Olin, Hexion, Swancor, Wells, Henkel, Sika and 3M.
Electrical Engineering and Electronics. Our competitive position in these diverse markets is primarily based on formulations expertise, product reliability and performance, process expertise and technical support. Our competitive strengths result from our focus on defined market segment needs, our long‑standing customer relationships, product reliability and technical performance, and reputation and recognition as a quality supplier. Our major competitors in these markets are Hexion, Hitachi, Nagase, Peters, Taiyo, Elantas, 3M and Lord.
Coatings and Construction. Our long standing position in these mature markets is served by our basic epoxy and specialty resins and additives products. Basic liquid and solid epoxy resins are driven by global supply‑and‑demand and industry consolidation and rationalization continues as a trend as macro‑economic factors affect profitability and supply balance. Our additives and specialty resins offerings, including epoxy hardeners and water based components, are value‑added products that allow our customers to differentiate their own products. Our major competitors include Olin, Hexion, NanYa, Kukdo, Evonik, Allnex, BASF, and Sika.
Textile Effects
Our Textile Effects segment is a major global solutions provider in the wet processing of textiles across pretreatment, coloration, printing and finishing and provides a diverse portfolio of textile chemicals, dyes and digital inks. Our textile solutions provide color and enhance the aesthetic, durability and performance of finished textiles, including functionality such as wrinkle resistance and water and stain repellence. Our Textile Effects segment is characterized by the breadth of our product offering and long‑standing relationships with our customers and downstream brands and retailers and OEMs (e.g., in the automotive sector).
We market products to customers in multiple end‑markets, including consumer fashion apparel, sportswear, career and uniform apparel, military, automotive, home and institutional textiles and furnishings, carpet and other functional textiles. Competition within these markets is generally fragmented with few competitors who can offer complete solutions for each market. We develop and adapt our technology and our applications expertise for new markets and new applications to improve our competitive offering. Increased environmental regulations, particularly in many parts of Asia, and consumer awareness about the environmental impact of the apparel industry has resulted in increased demand for sustainably produced textiles. We are at the forefront of developing sustainable textiles with advanced technology such as non‑fluorinated durable water repellence, waterless dyeing and eco‑friendly digital printing. Our award‑winning AVITERA® reactive dyeing technology meets global industry environmental standards and helps textile mills increase yield, improve productivity and reduce processing costs by significantly reducing water and energy consumption. We operate 13 synthesis and formulation production sites in Asia, Europe and the Americas.
Since 2011, our Textile Effects segment has implemented a plan (the “Textile Effects Restructuring Plan”) to significantly restructure its business including geographically and commercially repositioning operations, optimizing supply chains and improving operational efficiency. The segment closed large, inefficient operations, transferred most of its production to facilities located closer to its customers, formed strategic partnerships and expanded in Mexico,
Thailand and India, which has resulted in improved cash flows in the segment. In connection with the Textile Effects Restructuring Plan, during 2017, we recorded charges of $3 million for decommissioning and $2 million for non‑cancelable long‑term contract termination costs associated with this initiative.
Products and Markets
Textile Chemicals. Our product offering in textile chemicals covers process and effect chemicals for the entire wet processing of textiles, such as pretreatment, optical brightener, dyeing and printing processes and finishing effects such as UV‑protection, flame‑retardancy, wrinkle resistance, water and oil repellency, moisture management and enhanced textile comfort.
We own a portfolio of textile chemical brands such as PHOBOTEX®, which is used in the sportswear sector and for outdoor textiles for products that provide non‑fluorinated durable water repellency, UVITEX®, which is used for products that provide lasting white in the apparel sector to T‑shirts and formal shirts as well as in in the home textile sector for towels and bed sheeting, and PYROVATEX®, which is used for products that provide non‑halogenated flame‑retardancy to functional textiles like protective workwear and textile insulation material used in the automotive sector.
Dyes. We provide dyes for all major fibers, including cotton, polyester, wool, nylon, silk and acrylic, each of which requires different dye chemistry for optimum results. We develop and offer processes for technological applications of dyes that enable our customers to improve their production yield and reduce their water and energy consumption. We focus on high‑quality specialty dyes, which sets us apart from our Asian competitors who are primarily focused on commodity dyes. Because we provide dyes for all major fibers, we are able to differentiate ourselves from industry competitors by providing solutions for a broad range of fiber blended fabrics.
We own a portfolio of dye brands such as AVITERA®, for dyes used in T‑shirts, formal shirts and towels for achieving sustainability, NOVACRON®, for dyes used widely across casual wear and home textiles, LANASOL®, for dyes used in wool formal suits, TERASIL®, for dyes used in sportswear, outerwear, home textiles and furnishings, ERIOFAST®, for dyes used in high‑end intimate apparel and lingerie, TERATOP®, for dyes used across the automotive industry and NOVASOL®, for dyes used across military, protective wear and other technical textiles.
Digital Inks. We are at the forefront of the emerging trend in digital textile printing, including the time‑to‑market pressures of rapidly changing fashion trends and environmental concerns. Our range of digital inks solutions cover cotton, polyester, nylon, silk and other types of fiber blends, and are available for all mainstream digital printing technologies from plotters to industrial printers. Our innovative and sustainable digital inks technology is designed to help mills improve process efficiency, print reliability and improve overall environmental performance.
We own a portfolio of digital inks brands such as LANASET® and TERASIL® used for inks primarily for apparel and sportswear, and LYOSPERSE®, TERASIL® and NOVACRON® used for inks for apparel and home textiles. We have digital ink solutions designed for the fast‑growing segments of soft‑signage and technical textiles.
Markets. Textiles generally involve a complex matrix of fibers, colors, effects and functionality, and the resulting products range from fashion apparel to bulletproof vests, home and institutional textiles to carpet, and upholstery to automotive interiors. Our broad range of dyes, chemicals and digital inks enhance both the aesthetic appearance of these products and the functionality needed to ensure that they perform in their end‑use markets. To meet the emerging digital market landscape and increasing demands for sustainable textiles, our Textile Effects segment has a comprehensive range of digital inks to meet this trend and new market opportunity. Since the requirements for these markets vary dramatically, our business strategy focuses on three major end markets—apparel, home and institutional furnishings, and functional and technical textiles. We work to provide the right balance of products and service to meet the technical and environmental challenges in each of these markets.
The apparel market focuses on products that provide an aesthetic effect through colors, as well as comfort and performance effects. Our solutions also extend to improving the processing efficiency within the textile mill. We offer a complete range of colors for cotton, polyester, wool and nylon that cover the range of shades needed for casualwear, sportswear, intimate apparel, and formal wear. Our dyes have been developed to ensure that they offer the highest levels of color durability currently available in the market. The Textile Effects segment’s AVITERA® dyes meet global industry environmental standards and helps textile mills increase yield, improve productivity and reduce processing costs by reducing water and energy consumption. Pretreatment and dyeing auxiliaries ensure that these fabrics are processed efficiently and effectively—cleaning the fabrics with fewer chemicals, less energy and less water and thereby minimizing the environmental footprint and reducing the processing costs. Silicone softeners may be used to enhance the
feel of products. Textile Effects has developed advanced non‑fluorinated durable water repellent technology that enhances the performance levels of sportswear and outdoor wear offering comfort and durability.
Home and institutional textiles include bed linen, towels, curtains carpets, upholstery, mattress ticking and other textiles that are used within the home or institutions such as hotels. Dyes, chemicals and digital ink technology for these applications enhance color and shape durability, comfort, prevent color fading and enable limitless design possibilities for consumers. Optical brighteners and other pretreatment products provide “bright white” effects for towels and sheeting.
Functional and technical textiles include automotive textiles, carpet, military fabrics protective wear, nonwoven and other technical fabrics. Though the product groups may differ in their end uses, the articles must provide a high‑level of functionality, durability and performance in their respective markets. High‑lightfast dyes and UV absorbers are used in automotive interiors and outdoor furnishings to provide colors that do not fade when exposed to sunlight and heat. Powerful stain repellent and release technology imparts durable protection for upholstery, military and medical fabrics, without affecting the color, breathability or feel of the fabric. Specialized dyes and prints create unique camouflage patterns for military uniforms, backpacks and tarps that will not fade through wash and wear or during exposure to the elements.
Textile Effects is at the forefront of the emerging trend in digital textile printing including the time‑to‑market pressures of rapidly changing fashion trends and environmental concerns. The segment’s range of digital ink solutions cover cotton, polyester, silk and other types of fiber blends. The innovative and sustainable digital ink technology is designed to help mills improve process efficiency, print reliability and improve overall environmental performance.
Sales and Marketing
During 2017, approximately 61% of our sales were generated with approximately 1,600 direct customers through our global sales and technical services network and the remaining 39% is generated through our distribution partners. Our sales and technical services representatives work directly with our existing customers forming strong relationships and uncovering new opportunities.
In determining the markets on which we focus, we look at growth opportunity and value proposition. Consumption markets are primarily in developed economies such as Europe and North America, while production markets are primarily in Asia like China, India, Taiwan, Vietnam, Indonesia, Turkey and Bangladesh. Our downstream marketing team engages with leading brands and retailers in developed economies while our sales force and manufacturing footprint are primarily in Asia, closer to the manufacturing and sourcing base for textiles. We believe that this set‑up also enables us to take advantage of continuous demand growth due to demographic and lifestyle changes in emerging markets.
For our textile effects products, we focus on providing effect competence and process competence to our customers. Effect competence, which we define as delivering value‑added effects to our customers’ products, enables us to capitalize on new and innovative technologies and to assist our customers in their efforts to differentiate themselves from competitors. Process competence, which we define as applying know‑how and expertise to improve customers’ processes, allows us to utilize our technical service to reduce cost, enhance efficiency and offer recommendations to improve the ecological and environmental footprint in the wet processing of textiles.
We maintain strong customer relationships through the delivery of high levels of technical service and product innovation. There are 13 technical services laboratories in North America, South America, Europe and Asia that are close to our customers in these markets, which enables us to serve our customers with greater speed and flexibility.
Manufacturing and Operations
We are a global business serving customers in three principal geographic regions: EAME, the Americas and Asia. To service our customers efficiently, we maintain manufacturing plants around the world with a strategy of global,
regional and local manufacturing employed to optimize the level of service and minimize the cost to our customers. The following table summarizes the capabilities of each of the plants that we operate:
|
|
|
Description of Facility
|
|
|
|
Textile Chemicals
|
|
Textile Dyes
|
|
Inks
|
|
Location
|
|
Synthesis
|
|
Formulation
|
|
Synthesis
|
|
Formulation
|
|
Formulation
|
|
Atotonilquillo, Mexico
|
|
ü
|
|
ü
|
|
ü
|
|
ü
|
|
|
|
Baroda, India
|
|
|
|
ü
|
|
ü
|
|
ü
|
|
|
|
Bogota, Colombia
|
|
|
|
ü
|
|
|
|
|
|
|
|
Charlotte, North Carolina
|
|
|
|
ü
|
|
|
|
|
|
|
|
Fraijanes, Guatemala
|
|
|
|
ü
|
|
|
|
|
|
|
|
Gandaria, Jakarta, Indonesia
|
|
|
|
ü
|
|
|
|
ü
|
|
|
|
Hangzhou, China(1)
|
|
|
|
ü
|
|
|
|
|
|
|
|
Corlu, Turkey(1)(2)
|
|
|
|
ü
|
|
|
|
|
|
|
|
Karachi, Pakistan(1)
|
|
|
|
ü
|
|
|
|
|
|
|
|
Langweid am Leich, Germany
|
|
ü
|
|
ü
|
|
|
|
|
|
ü
|
|
Panyu, China(1)(3)
|
|
ü
|
|
ü
|
|
|
|
|
|
|
|
Samutsakorn (Mahachai), Thailand
|
|
|
|
|
|
ü
|
|
ü
|
|
ü
|
|
Taboão da Serra, Brazil
|
|
|
|
ü
|
|
|
|
|
|
ü
|
|
|
(1) Leased land and/or building.
|
|
|
|
(2) Chemical formulations operations were transferred to Huntsman Pursan Chemicals, a majority-owned joint venture, in 2016.
|
|
|
|
(3) 95%‑owned and consolidated manufacturing joint venture with Guangzhou Sheng’an Package Company Limited.
|
Joint Venture
In September 2015, the Textile Effects segment established a joint venture agreement with Huntsman Pursan Chemicals, a 60% owned consolidated joint venture, for the manufacture, formulation and sale of textile chemicals and dyes in Turkey. The joint venture extends the long term partnership between the two companies to a strategic level of collaboration and strengthens Textile Effects’ competitive position in the Turkish textile sector.
Raw Materials
The manufacture of textile effects products requires a wide selection of raw materials (approximately 1,000 different chemicals), including amines, ethoxylates, acrylics and sulfones. No one raw material represents greater than 5% of our textile effects raw material expenditures. Raw material costs constitute a sizeable percentage of sales for certain applications. We have tolling arrangements with several Chinese suppliers, but the majority of our raw materials are not purchased under long‑term contracts. The terms of our supply contracts vary, but, in general, these contracts contain provisions that set forth the quantities of product to be supplied and purchased.
Competition
We are a major global solutions provider for textile chemicals, dyes and digital inks in our chosen markets. Competition within the textile chemicals and dyes markets is generally fragmented with few competitors who can offer complete solutions for the entire textile markets. Key competitors within dyes include Archroma, Longsheng, Runtu, Jihua and DyStar. Key competitors within textile chemicals include Archroma, DyStar, Transfar/Tannatex and CHT. Key competitors within digital inks include Kiian/Jteck/Sawgrass, Sensient/Xennia and DowDuPont.
We believe that our competitive strengths include our product offering, which is characterized by its broad and deep technology range, high quality, significant integration between products and service, reliable technical expertise, long‑standing relationships with customers, and strong business infrastructure in Asia. We are a leader in environmentally sustainable chemistry with products that help customers enhance efficiency and reduce their environmental footprint. We believe that we have more customer service capability and account management capability than any of our competitors worldwide. In addition, we engage regularly with downstream brands and retailers on industry and sustainability issues.
RESEARCH AND DEVELOPMENT
For the years ended December 31, 2017, 2016 and 2015, we spent $138 million, $137 million and $143 million, respectively, on research and development.
We support our business with a major commitment to research and development, technical services and process engineering improvement. Our research and development centers are located in The Woodlands, Texas; Everberg, Belgium; and Shanghai, China. Other regional development/technical service centers are located in Auburn Hills, Michigan (polyurethanes for the automotive industry); Derry, New Hampshire, Shanghai, China, Deggendorf, Germany and Ternate, Italy (polyurethanes); Melbourne, Australia (surfactants); Port Neches, Texas (process engineering support); Basel, Switzerland and Panyu, China (advanced materials and textile effects); and Mumbai, India (textile effects).
INTELLECTUAL PROPERTY RIGHTS
Proprietary protection of our processes, apparatuses, and other technology and inventions is important to our businesses. We own approximately 2,630 unexpired global patents and have approximately 1,130 patent applications (including provisionals) currently pending. While a presumption of validity exists with respect to issued U.S. patents, we cannot assure that any of our patents will not be challenged, invalidated, circumvented or rendered unenforceable. Furthermore, we cannot assure the issuance of any pending patent application, or that if patents do issue, that these patents will provide meaningful protection against competitors or against competitive technologies. Additionally, our competitors or other third parties may obtain patents that restrict or preclude our ability to lawfully produce or sell our products in a competitive manner.
We also rely upon unpatented proprietary know‑how and continuing technological innovation and other trade secrets to develop and maintain our competitive position. There can be no assurance, however, that confidentiality and other agreements into which we enter and have entered will not be breached, that they will provide meaningful protection for our trade secrets or proprietary know‑how, or that adequate remedies will be available in the event of an unauthorized use or disclosure of such trade secrets and know‑how. In addition, there can be no assurance that others will not obtain knowledge of these trade secrets through independent development or other access by legal means.
In addition to our own patents and patent applications and proprietary trade secrets and know‑how, we are a party to certain licensing arrangements and other agreements authorizing us to use trade secrets, know‑how and related technology and/or operate within the scope of certain patents owned by other entities. We also have licensed or sub‑licensed intellectual property rights to third parties.
We have associated brand names with a number of our products, and we have approximately 4,550 global trademark registrations and 110 pending registrations. These registrations and applications include extensions of protection under the Madrid system for the international registration of marks. However, there can be no assurance that the trademark registrations will provide meaningful protection against the use of similar trademarks by competitors, or that the value of our trademarks will not be diluted.
Because of the breadth and nature of our intellectual property rights and our business, we do not believe that any single intellectual property right (other than certain trademarks for which we intend to maintain the applicable registrations) is material to our business. Moreover, we do not believe that the termination of intellectual property rights expected to occur over the next several years, either individually or in the aggregate, will materially adversely affect our business, financial condition or results of operations.
EMPLOYEES
As of December 31, 2017, we employed approximately 10,000 associates in our operations around the world. Approximately 3,000 of these employees are located in the U.S., while approximately 7,000 are located in other countries. We believe our relations with our employees are good.
GEOGRAPHIC DATA
For sales revenue and long‑lived assets by geographic areas, see “Note 24. Operating Segment Information” to our consolidated financial statements.
ENVIRONMENTAL, HEALTH AND SAFETY MATTERS
General
We are subject to extensive federal, state, local and international laws, regulations, rules and ordinances relating to occupational health and safety, process safety, pollution, protection of the environment and natural resources, product management and distribution, and the generation, storage, handling, transportation, treatment, disposal and remediation of hazardous substances and waste materials. In the ordinary course of business, we are subject to frequent environmental inspections and monitoring and occasional investigations by governmental enforcement authorities. In addition, our production facilities require operating permits that are subject to renewal, modification and, in certain circumstances, revocation. Actual or alleged violations of safety laws, environmental laws or permit requirements could result in restrictions or prohibitions on plant operations or product distribution, substantial civil or criminal sanctions, or injunctions limiting or prohibiting our operations altogether. In addition, some environmental laws may impose liability on a strict, joint and several basis. Moreover, changes in environmental regulations could inhibit or interrupt our operations, or require us to modify our facilities or operations and make significant environmental compliance expenditures. Accordingly, environmental or regulatory matters may cause us to incur significant unanticipated losses, costs or liabilities. Information related to environmental, health and safety (“EHS”) matters may also be found in other areas of this report including “—Item 1A. Risk Factors,” “Note 2. Summary of Significant Accounting Policies—Environmental Expenditures” to our consolidated financial statements and “Note 19. Environmental Health and Safety Matters” to our consolidated financial statements.
Environmental, Health and Safety Systems
We are committed to achieving and maintaining compliance with all applicable EHS legal requirements, and we have developed policies and management systems that are intended to identify the multitude of EHS legal requirements applicable to our operations, enhance compliance with applicable legal requirements, improve the safety of our employees, contractors, community neighbors and customers and minimize the production and emission of wastes and other pollutants. We cannot guarantee, however, that these policies and systems will always be effective or that we will be able to manage EHS legal requirements without incurring substantial costs. Although EHS legal requirements are constantly changing and are frequently difficult to comply with, these EHS management systems are designed to assist us in our compliance goals while also fostering efficiency and improvement and reducing overall risk to us.
Environmental Remediation
We have incurred, and we may in the future incur, liability to investigate and clean up waste or contamination at our current or former facilities or facilities operated by third parties at which we may have disposed of waste or other materials. Similarly, we may incur costs for the cleanup of waste that was disposed of prior to the purchase of our businesses. Under some circumstances, the scope of our liability may extend to damages to natural resources.
In cases where our potential liability arises from historical contamination based on operations and other events occurring prior to our ownership of a business or specific facility, we frequently obtain an indemnity agreement from the prior owner addressing remediation liabilities arising from pre‑closing conditions. We have successfully exercised our rights under these contractual covenants for a number of sites and, where applicable, mitigated our ultimate remediation liability. We cannot assure you, however, that the liabilities for all such matters subject to indemnity will be honored by the prior owner or that our existing indemnities will be sufficient to cover our liabilities for such matters.
Based on available information and the indemnification rights we believe are likely to be available, we believe that the costs to investigate and remediate known contamination will not have a material effect on our financial statements. However, if such indemnities are not honored or do not fully cover the costs of investigation and remediation or we are required to contribute to such costs, then such expenditures may have a material effect on our financial statements. At the current time, we are unable to estimate the total cost, exclusive of indemnification benefits, to remediate contaminated sites.
Regulatory Matters
Greenhouse Gas Regulation and Climate Change
Globally, our operations are increasingly subject to regulations that seek to reduce emissions of greenhouse gases (“GHGs”), such as carbon dioxide and methane, which may be contributing to changes in the earth’s climate. At the Durban negotiations of the Conference of the Parties to the Kyoto Protocol in 2012, a limited group of nations,
including the European Union (the “EU”), agreed to a second commitment period for the Kyoto Protocol, an international treaty that provides for reductions in GHG emissions. More significantly, the EU GHG Emissions Trading System (“ETS”), established pursuant to the Kyoto Protocol to reduce GHG emissions in the EU, continues in its third phase. The EU parliament has used a process to formalize “backloading”—the withholding of GHG allowances during the trading period from 2014 to 2016 with additional allowances auctioned during 2019 to 2020—to prop up carbon prices. As backloading is only a temporary measure, a sustainable solution to the imbalance between supply and demand requires structural changes to the ETS. The European Commission proposes to establish a market stability reserve to address the current surplus of allowances and improve the system’s resilience. The reserve will start operating in 2019. In addition, the EU has announced the binding target to reduce domestic GHG emissions by at least 40% below the 1990 level by 2030. The EU has set a binding target of increasing the share of renewable energy to at least 27% of the EU’s energy consumption by 2030, and additional proposals have been made to increase the target to 35%.
In addition, at the 2015 United Nations Framework Convention on Climate Change in Paris, the U.S. and nearly 200 other nations entered into an international climate agreement, which entered into effect in November 2016 (the “Paris Agreement”). Although the agreement does not create any binding obligations for nations to limit their GHG emissions, it does include pledges to voluntarily limit or reduce future emissions. However, in August 2017 the U.S. informed the United Nations that it is withdrawing from the Paris Agreement. The Paris Agreement provides for a four year exit process.
Federal climate change legislation in the U.S. appears unlikely in the near‑term. As a result, domestic efforts to curb GHG emissions will continue to be led by the U.S. Environmental Protection Agency’s (the “EPA”) GHG regulations and similar programs of certain states. To the extent that our domestic operations are subject to the EPA’s GHG regulations, we may face increased capital and operating costs associated with new or expanded facilities. Significant expansions of our existing facilities or construction of new facilities may be subject to the Clean Air Act’s (the “CAA”) requirements for pollutants regulated under the Prevention of Significant Deterioration and Title V programs. Some of our facilities are also subject to the EPA’s Mandatory Reporting of Greenhouse Gases rule, and any further regulation may increase our operational costs.
We are already managing and reporting GHG emissions, to varying degrees, as required by law for our sites in locations subject to U.S. federal and state requirements, Kyoto Protocol obligations and/or ETS requirements. Although these sites are subject to existing GHG legislation, few have experienced or anticipate significant cost increases as a result of these programs, although it is possible that GHG emission restrictions may increase over time. Potential consequences of such restrictions include capital requirements to modify assets to meet GHG emission restrictions and/or increases in energy costs above the level of general inflation, as well as direct compliance costs. Currently, however, it is not possible to estimate the likely financial impact of potential future regulation on any of our sites.
Finally, it should be noted that some scientists have concluded that increasing concentrations of GHGs in the earth’s atmosphere may produce climate changes that have significant physical effects, such as increased frequency and severity of storms, droughts, and floods and other climatic events. If any of those effects were to occur, they could have an adverse effect on our assets and operations.
AVAILABLE INFORMATION
We maintain an internet website at http://www.huntsman.com. Our annual reports on Form 10‑K, quarterly reports on Form 10‑Q, current reports on Form 8‑K and amendments to these reports are available free of charge through our website as soon as reasonably practicable after we file this material with the SEC. We also provide electronic or paper copies of our SEC filings free of charge upon request.
GLOSSARY OF CHEMICAL TERMS
BDO—butane diol
BLR—base liquid resin
DEG—di‑ethylene glycol
DGA® Agent—DIGLYCOLAMINE® agent
DPA—diphenylamine
EDC—ethylene dichloride
EG—ethylene glycol
EO—ethylene oxide
LAB—linear alkyl benzene
LAS—linear alkylbenzene sulfonate
MDA—methylene dioxy amphetamine
MDI—methyl diphenyl diisocyanate
MEG—mono‑ethylene glycol
MNB—mononitrobenzene
MTBE—methyl tertiary‑butyl ether
PBT—polybutylene terephthalate
PET—polyethylene tesephthalate
PG—propylene glycol
PO—propylene oxide
Polyols—a substance containing several hydroxyl groups. A diol, triol and tetrol contain two, three and four hydroxyl groups, respectively.
TBA—tertiary butyl alcohol
TBHP—tert‑butyl hydroperoxide
TDI—toluene diisocyanate
TEG—tri‑ethylene glycol
TPU—thermoplastic polyurethane
UPR—unsaturated polyester resin
ITEM 1A. RISK FACTORS
Any of the following risks could materially and adversely affect our business, results of operations, financial condition and liquidity.
RISKS RELATED TO OUR BUSINESS
Our industry is affected by global economic factors including risks associated with volatile economic conditions.
Our financial results are substantially dependent on overall economic conditions in the U.S., Europe and Asia. Declining economic conditions in all or any of these locations—or negative perceptions about economic conditions—could result in a substantial decrease in demand for our products and could adversely affect our business. The timing and extent of any changes to currently prevailing market conditions is uncertain, and supply and demand may be unbalanced at any time. Uncertain economic conditions and market instability make it particularly difficult for us to forecast demand trends. As a consequence, we may not be able to accurately predict future economic conditions or the effect of such conditions on our financial condition or results of operations. We can give no assurances as to the timing, extent or duration of the current or future economic cycles impacting the industries in which we operate.
The markets for many of our products are cyclical and volatile, and we may experience depressed market conditions for such products.
The cyclicality that the markets for many of our products experience occurs as a result of alternating periods of tight supply, causing prices and margins to increase, followed by periods of lower capacity utilization, resulting in oversupply and declining prices and margins. The volatility these markets experience occurs as a result of changes in the demand for products as a consequence of global economic activity, changes in energy prices and changes in customers’ requirements. For example, demand for our products depends in part on the housing and construction industries, which are cyclical in nature and have historically been impacted by downturns in the economy. In addition, margins for MTBE sales are volatile and seasonal. The supply‑demand balance is also impacted by capacity additions or reductions that result in changes in utilization rates. The cyclicality and volatility of our industry results in significant fluctuations in profits and cash flow from period to period and over the business cycle.
Disruptions in production at our manufacturing facilities may have a material adverse impact on our business, results of operations and/or financial condition.
Manufacturing facilities in our industry are subject to planned and unplanned production shutdowns, turnarounds, outages and other disruptions. Any serious disruption at any of our facilities could impair our ability to use our facilities and have a material adverse impact on our revenues and increase our costs and expenses. Alternative facilities with sufficient capacity may not be available, may cost substantially more or may take a significant time to increase production or qualify with our customers, any of which could negatively impact our business, results of
operations and/or financial condition. Long‑term production disruptions may cause our customers to seek alternative supply which could further adversely affect our profitability.
Unplanned production disruptions may occur for external reasons including natural disasters, weather, disease, strikes, transportation interruption, government regulation, political unrest or terrorism, or internal reasons, such as fire, unplanned maintenance or other manufacturing problems. Any such production disruption could have a material impact on our operations, operating results and financial condition.
In addition, we rely on a number of vendors, suppliers, and in some cases sole‑source suppliers, service providers, toll manufacturers and collaborations with other industry participants to provide us with chemicals, feedstocks and other raw materials, along with energy sources and, in certain cases, facilities that we need to operate our business. If the business of these third parties is disrupted, some of these companies could be forced to reduce their output, shut down their operations or file for bankruptcy protection. If this were to occur, it could adversely affect their ability to provide us with the raw materials, energy sources or facilities that we need, which could materially disrupt our operations, including the production of certain of our products. Moreover, it could be difficult to find replacements for certain of our business partners without incurring significant delays or cost increases. All of these risks could have a material adverse effect on our business, results of operations, financial condition and liquidity.
While we maintain business recovery plans that are intended to allow us to recover from natural disasters or other events that could disrupt our business, we cannot provide assurances that our plans would fully protect us from the effects of all such disasters or from events that might increase in frequency or intensity due to climate change. In addition, insurance may not adequately compensate us for any losses incurred as a result of natural or other disasters. In areas prone to frequent natural or other disasters, insurance may become increasingly expensive or not available at all. Furthermore, some potential climate‑driven losses, particularly inundation due to sea‑level rise, may pose long‑term risks to our physical facilities such that operations cannot be restored in their current locations.
Our results of operations may be adversely affected by international business risks, including fluctuations in currency exchange rates, legal restrictions and taxes.
We conduct a majority of our business operations outside the U.S., and these operations are subject to risks normally associated with international operations. These risks include the need to convert currencies that may be received for our products into currencies in which we purchase raw materials or pay for services, which could result in a gain or loss depending on fluctuations in exchange rates. We transact business in many foreign currencies, including euros, Swiss francs, Chinese renminbi, Indian rupees, Brazilian reals and Thai bahts. We translate our local currency financial results into U.S. dollars based on average exchange rates prevailing during the reporting period or the exchange rate at the end of that period. During times of a strengthening U.S. dollar, our reported international sales and earnings may be reduced because the local currency may translate into fewer U.S. dollars. Because we currently have significant operations located outside the U.S., we are exposed to fluctuations in global currency rates which may result in gains or losses on our financial statements.
Other risks of international operations include trade barriers, tariffs, exchange controls, cash repatriation restrictions, national and regional labor strikes, social and political risks, general economic risks and required compliance with a variety of U.S. and foreign laws, including monetary policies, tax laws, the Foreign Corrupt Practices Act (and foreign equivalents), export controls and regulations administered by the Office of Foreign Assets Control. Any changes in tariffs or trade barriers could make our products less competitive compared to other producers not subject to the same tariffs or trade barriers. Any decision to repatriate cash as dividends could subject us to foreign and U.S. federal and state income taxes without any offsetting foreign tax credit relief. Although we maintain an anti‑corruption compliance program throughout our Company, violations of our compliance program may result in criminal or civil sanctions, including material monetary fines, penalties and other costs against us or our employees, and may have a material adverse effect on our business. Furthermore, in foreign jurisdictions where legal processes may vary from country to country, we may experience difficulty in enforcing agreements. In jurisdictions where bankruptcy laws and practices vary, we may experience difficulty collecting foreign receivables through foreign legal systems. The occurrence of these risks, among others, could disrupt the businesses of our international subsidiaries, which could significantly affect their ability to make distributions to us.
We operate in a significant number of jurisdictions, which contributes to the volatility of our effective tax rate. Changes in tax laws or the interpretation of tax laws in the jurisdictions in which we operate may affect our effective tax rate. In addition, generally accepted accounting principles in the U.S. (“GAAP” or “U.S. GAAP”) have required us to place valuation allowances against our net operating losses and other deferred tax assets in a significant number of tax jurisdictions. These valuation allowances result from analysis of positive and negative evidence supporting the
realization of tax benefits. Negative evidence includes a cumulative history of pre‑tax operating losses in specific tax jurisdictions. Changes in valuation allowances have resulted in material fluctuations in our effective tax rate. Economic conditions may dictate the continued imposition of current valuation allowances and, potentially, the establishment of new valuation allowances. While significant valuation allowances remain, our effective tax rate will likely continue to experience significant fluctuations. Furthermore, certain foreign jurisdictions may take actions to delay our ability to collect value‑added tax refunds.
Our efforts to grow and transform our businesses may require significant investments; if our strategies are unsuccessful, our business, results of operations and/or financial condition may be materially adversely affected.
We continuously evaluate opportunities for growth and change. These initiatives may involve making acquisitions, entering into partnerships and joint ventures, divesting assets, restructuring our existing operations and assets, creating new financial structures and building new facilities—any of which could require a significant investment and subject us to new kinds of risks. We have incurred indebtedness to finance these opportunities, and we may incur additional indebtedness to finance future initiatives. We could also issue additional shares of stock of our Company or our subsidiaries to finance such initiatives. If our strategies for growth and change are not successful, we could face increased financial pressure, such as increased cash flow demands, reduced liquidity and diminished access to financial markets, and the equity value of our businesses could be diluted.
The implementation of strategies for growth and change may create additional risks, including:
|
·
| |
diversion of management time and attention away from existing operations; |
|
·
| |
requiring capital investment that could otherwise be used for the operation and growth of our existing businesses; |
|
·
| |
disruptions to important business relationships; |
|
·
| |
increased operating costs; |
|
·
| |
limitations imposed by various governmental entities; |
|
·
| |
use of limited investment and other baskets under our debt covenants; and |
|
·
| |
difficulties due to lack of or limited prior experience in any new markets we may enter. |
Our inability to mitigate these risks or other problems encountered in connection with our strategies for growth and change could have a material adverse effect on our business, results of operations and financial condition. In addition, we may fail to fully achieve the savings or growth projected for current or future initiatives notwithstanding the expenditure of substantial resources in pursuit thereof.
We may have difficulties integrating acquired businesses and as a result, our business, results of operations and/or financial condition may be materially adversely affected.
We have completed a number of acquisitions and we will continue to acquire additional businesses and enter into joint ventures as part of our business strategy. Growth through acquisitions and joint ventures involves risks, including:
|
·
| |
inability to efficiently operate new businesses or to integrate acquired businesses and products; |
|
·
| |
inability to accurately predict delays in realizing the costs and benefits of acquisitions, partnerships, or joint ventures; |
|
·
| |
unexpected losses of customers or suppliers of an acquired or existing business; |
|
·
| |
difficulties in retaining key employees of acquired businesses; |
|
·
| |
difficulties in realizing projected synergies; and |
|
·
| |
exposure to unanticipated liabilities, including unexpected environmental exposures, product liability or illegal activities conducted by an acquired company or a joint venture partner. |
Our inability to address these risks could cause us to fail to realize the anticipated benefits of such acquisitions or joint ventures and could have a material adverse effect on our business, results of operations and financial condition.
Significant price volatility or interruptions in supply of our raw materials may result in increased costs that we may be unable to pass on to our customers, which could reduce our profitability.
We purchase a substantial portion of our raw materials from third‑party suppliers and the cost of these raw materials represents a substantial portion of our operating expenses. The prices for a number of these raw materials generally follow price trends of, and vary with market conditions for, crude oil and natural gas feedstocks, which are highly volatile and cyclical. For example, the market for crude oil and natural gas feedstocks experienced depressed pricing throughout 2015 and 2016, leading to favorable prices for the raw materials that we purchase from third parties. Lower raw material prices, however, can lead to downward pressure on selling prices for certain of our products leading to reduced revenue. Our supply agreements typically provide for market‑based pricing and provide us only limited protection against price volatility. While we attempt to match cost increases with corresponding product price increases, we are not always able to raise product prices immediately or at all. Timing differences between raw material prices, which may change daily, and contract product prices, which in many cases are negotiated only monthly or less often, have had and may continue to have a negative effect on our cash flow. Any cost increase that we are not able to pass on to our customers could have a material adverse effect on our business, results of operations, financial condition and liquidity.
In general, the feedstocks and other raw materials we consume are organic chemical commodity products that are readily available at market prices. There are, however, several raw materials for which there are only a limited number of suppliers or a single supplier. To mitigate potential supply constraints, we frequently enter into supply agreements with particular suppliers, evaluate alternative sources of supply and evaluate alternative technologies to avoid reliance on limited or sole‑source suppliers. In addition, where supply relationships are concentrated, particular attention is paid by the parties to ensure strategic intentions are aligned to facilitate long‑term planning. If certain of our suppliers are unable to meet their obligations under present supply agreements, we may be forced to pay higher prices to obtain the necessary raw materials from other sources and we may not be able to increase prices for our finished products to recoup the higher raw materials costs. Any interruption in the supply of raw materials could increase our costs or decrease our revenues, which could reduce our cash flow. The inability of a supplier to meet our raw material needs could have a material adverse effect on our financial statements and results of operations.
The number of sources for and availability of certain raw materials is also specific to the particular geographical region in which a facility is located. Political and economic instability in the countries from which we purchase our raw material supplies could adversely affect their availability. In addition, if raw materials become unavailable within a geographic area from which they are now sourced, then we may not be able to obtain suitable or cost effective substitutes. We may also experience higher operating costs such as energy costs, which could affect our profitability. We may not always be able to increase our selling prices to offset the impact of any higher production costs or reduced production levels, which could reduce our earnings and decrease our liquidity.
The industries in which we compete are highly competitive, and we may not be able to compete effectively with our competitors that have greater financial resources, which could have a material adverse effect on our business, results of operations and financial condition.
The industries in which we operate are highly competitive. Among our competitors are some of the world’s largest chemical companies and major integrated petroleum companies that have their own raw material resources. Changes in the competitive landscape could make it difficult for us to retain our competitive position in various products and markets throughout the world. Some of the companies with whom we compete may be able to produce products more economically than we can. Furthermore, some of our competitors have greater financial resources, which may enable them to invest significant capital into their businesses, including expenditures for research and development.
While we are engaged in a range of research and development programs to develop new products and processes, to improve and refine existing products and processes, and to develop new applications for existing products, the failure to develop new products, processes or applications could make us less competitive. Moreover, if any of our current or future competitors develops proprietary technology that enables them to produce products at a significantly lower cost, our technology could be rendered uneconomical or obsolete.
Further, it is possible that we could abandon certain products, processes, or applications due to potential infringement of third party intellectual property rights or that we could be named in future litigation for the infringement or misappropriation of a competitor’s or other third party’s intellectual property rights, which could include a claim for injunctive relief and damages, and, if so, such adverse results could have a material adverse effect on our business, results of operations and financial position. In addition, certain of our competitors in various countries in which we do business, including China, may be owned by or affiliated with members of local governments and political entities.
These competitors may get special treatment with respect to regulatory compliance and product registration, while certain of our products, including those based on new technologies, may be delayed or even prevented from entering into the local market.
Certain of our businesses use technology that is widely available. Accordingly, barriers to entry, apart from capital availability, may be low in certain product segments of our business. The entrance of new competitors into any of our businesses may reduce our ability to maintain margins or capture improving margins in circumstances where capacity utilization in the industry is increasing. Further, petroleum‑rich countries have become more significant participants in the petrochemical industry and may expand their roles significantly in the future. Increased competition in any of our businesses could compel us to reduce the prices of our products, which could result in reduced margins and loss of market share and have a material adverse effect on our business, results of operations, financial condition and liquidity.
We are subject to risks relating to our information technology systems, and any failure to adequately protect our critical information technology systems could materially affect our operations.
We rely on information technology systems across our operations, including for management, supply chain and financial information and various other processes and transactions. Our ability to effectively manage our business depends on the security, reliability and capacity of these systems. Information technology system failures, network disruptions or breaches of security could disrupt our operations, cause delays or cancellations of customer orders or impede the manufacture or shipment of products, processing of transactions or reporting of financial results. An attack or other problem with our systems could also result in the disclosure of proprietary information about our business or confidential information concerning our customers or employees, which could result in significant damage to our business and our reputation.
We have put in place security measures designed to protect against the misappropriation or corruption of our systems, intentional or unintentional disclosure of confidential information, or disruption of our operations. Current employees have, and former employees may have, access to a significant amount of information regarding our operations which could be disclosed to our competitors or otherwise used to harm us. Moreover, our operations in certain locations, such as China, may be particularly vulnerable to security attacks or other problems. Any breach of our security measures could result in unauthorized access to and misappropriation of our information, corruption of data or disruption of operations or transactions, any of which could have a material adverse effect on our business.
In addition, we could be required to expend significant additional amounts to respond to information technology issues or to protect against threatened or actual security breaches. We may not be able to implement measures that will protect against all of the significant risks to our information technology systems.
Agreements governing our debt may restrict our ability to engage in certain business activities or to obtain additional financing.
The agreements governing our debt arrangements contain certain restrictive covenants. These covenants may limit or prohibit our ability to among other things, incur additional indebtedness; make certain prepayments of debt; pay dividends, redeem stock or make other distributions; issue stock; make investments; create liens; enter into transactions with affiliates; enter into sale and leaseback transactions; merge or consolidate; and transfer or sell assets. Some of our strategies may necessitate receiving consents or waivers under our debt arrangements, which could be withheld.
Our failure to comply with any of our debt covenants, or our failure to make payments of principal or interest on our debt, could result in a default, or trigger cross‑default or acceleration provisions, under our debt agreements. An event of default could result in our debt obligations becoming immediately due and payable, cause our creditors to terminate their lending commitments, or force us or one or more of our subsidiaries into bankruptcy or liquidation. Any of the foregoing occurrences could have a material adverse effect on our business, results of operations and financial condition. For more information regarding our debt covenants, see “Note 13. Debt—Compliance with Covenants” to our consolidated financial statements.
Economic conditions and regulatory changes following the NAFTA negotiations and the United Kingdom's likely exit from the EU could adversely impact our operations, operating results and financial condition.
Following a referendum in June 2016 in which voters in the United Kingdom (the "U.K.”) approved an exit from the EU (“Brexit”), and on March 29, 2017, notified the EU that it intended to exit as provided in Article 50 of the Treaty on European Union. The referendum triggered short-term financial volatility, including a decline in the value of the pound sterling in comparison to both the U.S. dollar and euro. The future effects of Brexit will depend on any
agreements the U.K. makes to retain access to the EU or other markets either during a transitional period or more permanently, the substance of which is not known. Given the lack of comparable precedent and the slow pace of negotiations between the U.K. and the EU, it remains unclear what financial, trade and legal implications the withdrawal of the U.K. from the EU would have and how such withdrawal would affect our Company, although any increase in duties and tariffs between the U.K. and the rest of the EU would be immediately damaging to the profitability and in some cases viability of exports of our products between those regions and, over the long term, might result in the need to relocate major manufacturing assets from one region to the other.
In 2017, the U.S. opened negotiations with Canada and Mexico to renegotiate the terms of the North American Free Trade Agreement (“NAFTA”), a treaty that has been in place since 1994. Some proposed clauses would include a "sunset" provision for NAFTA after a certain number of years. There is a risk that if the negotiations fail, NAFTA could be terminated. Any reversal of NAFTA could lead to significant declines in real GDP, trade, investment and employment in North America. It would also be immediately damaging to the profitability of annual Huntsman exports as between Canada, the U.S. and Mexico, which in the aggregate total hundreds of millions of dollars.
We derive a significant portion of our revenues from sales in the regions that would be impacted by Brexit and a reversal of NAFTA. Approximately 25% of our revenues stem from sales in Europe and 41% from sales in North America. The consequences of Brexit and a reversal of NAFTA, depending upon what the terms and conditions of such events are, together with what may be protracted negotiations in both cases, could introduce significant uncertainties into global financial markets and adversely impact the markets in which we and our customers operate. Brexit or a reversal of NAFTA could also create uncertainty with respect to the legal and regulatory requirements to which we and our customers in these regions are subject and lead to divergent national laws and regulations as the U.K. government determines which EU laws to replace or replicate or as members of NAFTA pursue other trade partners and adopt laws and regulations that are less harmonious with those of existing NAFTA members.
While we are not experiencing any immediate adverse impact on our financial condition as a result of Brexit or the NAFTA negotiations, adverse consequences such as deterioration in economic conditions, volatility in currency exchange rates or adverse changes in regulation could have a negative impact on our future operations, operating results and financial condition. All of these potential consequences could be further magnified if additional countries were to exit the EU.
Our operations involve risks that may increase our operating costs, which could reduce our profitability.
Although we take precautions to enhance the safety of our operations and minimize the risk of disruptions, our operations are subject to hazards inherent in the manufacturing and marketing of chemical and other products. These hazards include: chemical spills, pipeline leaks and ruptures, storage tank leaks, discharges or releases of toxic or hazardous substances or gases and other hazards incident to the manufacturing, processing, handling, transportation and storage of dangerous chemicals. We are also potentially subject to other hazards, including natural disasters and severe weather; explosions and fires; transportation problems, including interruptions, spills and leaks; mechanical failures; unscheduled downtimes; labor difficulties; remediation complications; and other risks. In addition, some equipment and operations at our facilities are owned or controlled by third parties who may not be fully integrated into our safety programs and over whom we are able to exercise limited control. Many potential hazards can cause bodily injury and loss of life, severe damage to or destruction of property and equipment and environmental damage, and may result in suspension of operations and the imposition of civil or criminal penalties and liabilities. Furthermore, we are subject to present and future claims with respect to workplace exposure, exposure of contractors on our premises as well as other persons located nearby, workers’ compensation and other matters.
We maintain property, business interruption, products liability and casualty insurance policies which we believe are in accordance with customary industry practices, as well as insurance policies covering other types of risks, including pollution legal liability insurance, but we are not fully insured against all potential hazards and risks incident to our business. Each of these insurance policies is subject to customary exclusions, deductibles and coverage limits, in accordance with industry standards and practices. As a result of market conditions, premiums and deductibles for certain insurance policies can increase substantially and, in some instances, certain insurance may become unavailable or available only for reduced amounts of coverage. If we were to incur a significant liability for which we were not fully insured, it could have a material adverse effect on our business, results of operations, financial condition and liquidity.
In addition, we are subject to various claims and litigation in the ordinary course of business. We are a party to various pending lawsuits and proceedings. For more information, see “—Item 3. Legal Proceedings” below.
We are subject to many EHS regulations that may result in unanticipated costs or liabilities, which could reduce our profitability.
We are subject to extensive federal, state, local and foreign laws, regulations, rules and ordinances relating to pollution, protection of the environment and human health and safety, and the generation, storage, handling, transportation, treatment, disposal and remediation of hazardous substances and waste materials. Actual or alleged violations of EHS laws or permit requirements could result in restrictions or prohibitions on plant operations and substantial civil or criminal sanctions, as well as, under some EHS laws, the assessment of strict liability and/or joint and several liability.
Many of our products and operations are subject to the chemical control laws of the countries in which they are located. These laws include the regulation of chemical substances and inventories under the Toxic Substances Control Act (“TSCA”) in the U.S. and the Registration, Evaluation and Authorization of Chemicals (“REACH”) and the Classification, Labeling and Packaging of substances and mixtures (“CLP”) regulations in Europe. Analogous regimes exist in other parts of the world, including China, South Korea, and Taiwan. In addition, a number of countries where we operate, including the U.K., have adopted rules to conform chemical labeling in accordance with the globally harmonized system. Many of these foreign regulatory regimes are in the process of a multi‑year implementation period for these rules.
Additional new laws and regulations may be enacted or adopted by various regulatory agencies globally. For example, in the U.S., the EPA finalized revisions to its Risk Management Program in January 2017. The revisions include new requirements for certain facilities to perform hazard analyses, third‑party auditing, incident investigations and root cause analyses, emergency response exercises, and to publically share chemical and process information. Compliance for many of the rule’s new requirements will be required beginning in 2021. The EPA has proposed to delay the rule’s effect until February 2019; however, EPA’s proposed delay has been challenged in the courts by environmental groups. The U.S. Occupational Safety and Health Administration had previously announced that it was considering changes to its Process Safety Management standards that parallel EPA’s Risk Management Program; but additional action appears unlikely at this time. In addition, TSCA reform legislation was enacted in June 2016, and the EPA has begun the process of issuing new chemical control regulations. EPA issued several final rules in 2017 under the revised TSCA related to existing chemicals, including the following: (i) a rule to establish EPA’s process and criteria for identifying chemicals for risk evaluation; (ii) a rule to establish EPA’s process for evaluating high priority chemicals and their uses to determine whether or not they present an unreasonable risk to health or the environment; and (iii) a rule to require industry reporting of chemicals manufactured or processed in the U.S. over the past 10 years. The EPA has also released its draft framework for approving new chemicals and new uses of existing chemicals. Under the draft framework, which is already being used by EPA in TSCA evaluations, a new chemical or use presents an unreasonable risk if it exceeds set standards. Such a finding could result in either the issuance of rules restricting the use of the chemical being evaluated or in the need for additional testing. The costs of compliance with any new laws or regulations cannot be estimated until the manner in which they will be implemented has been more precisely defined.
Furthermore, governmental, regulatory and societal demands for increasing levels of product safety and environmental protection could result in increased pressure for more stringent regulatory control with respect to the chemical industry. In addition, these concerns could influence public perceptions regarding our products and operations, the viability of certain products, our reputation, the cost to comply with regulations, and the ability to attract and retain employees. Moreover, changes in EHS regulations could inhibit or interrupt our operations, or require us to modify our facilities or operations. Accordingly, environmental or regulatory matters may cause us to incur significant unanticipated losses, costs or liabilities, which could reduce our profitability. For example, several of our products are being evaluated under REACH and CLP regulations and actions thereunder could negatively impact sales.
We could incur significant expenditures in order to comply with existing or future EHS laws. Capital expenditures and costs relating to EHS matters will be subject to evolving regulatory requirements and will depend on the timing of the promulgation and enforcement of specific standards which impose requirements on our operations. Capital expenditures and costs beyond those currently anticipated may therefore be required under existing or future EHS laws.
Furthermore, we may be liable for the costs of investigating and cleaning up environmental contamination on or from our properties or at off‑site locations where we disposed of or arranged for the disposal or treatment of hazardous materials, or from disposal activities that pre‑dated our purchase of our businesses. We may therefore incur additional costs and expenditures beyond those currently anticipated to address all such known and unknown situations under existing and future EHS laws.
Regulatory requirements to reduce GHG emissions could have an adverse effect on our results of operations.
Our operations are increasingly subject to regulations that seek to reduce emissions of GHGs, such as carbon dioxide and methane, which may be contributing to changes in the Earth’s climate. There are existing efforts to address GHG emissions at the international, national, and regional levels. For example, the 2015 Paris climate summit agreement, which entered into force in November 2016, resulted in voluntary commitments by numerous countries to reduce their GHG emissions. However, the U.S. notified the United Nations in August 2017 that it will be withdrawing from the agreement, which provides for a four year exit process. The EU also regulates GHGs under the EU ETS and China has established its own country-wide GHG cap and trade program. Domestically, the EPA issued its final Clean Power Plan rules in 2015 that establish carbon pollution standards for power plants, called CO2 emission performance rates. This rule has been challenged in court and the EPA has separately announced that it intends to repeal and potentially replace the Clean Power Plan. In any event, collectively, these rules and agreements may affect the long term price and supply of electricity and natural gas and demand for products that contribute to energy efficiency and renewable energy. These various regulations and agreements are likely to result in increased costs to purchased energy, additional capital costs for installation or modification of GHG emitting equipment, and additional costs associated directly with GHG emissions (such as cap and trade systems or carbon taxes), which are primarily related to energy use. Compliance with these regulations and any more stringent restrictions in the future may increase our operational costs.
In addition, some scientists have concluded that increasing concentrations of GHGs in the Earth’s atmosphere may produce climate changes, such as increased frequency and severity of storms, droughts, floods and other climatic events. If any such effects were to occur in areas where we or our clients operate, they could have an adverse effect on our assets and operations.
We could incur significant expenditures in order to comply with existing or future EHS laws. Capital expenditures and costs relating to EHS matters will be subject to evolving regulatory requirements and will depend on the timing of the promulgation and enforcement of specific standards which impose requirements on our operations. Capital expenditures and costs beyond those currently anticipated may therefore be required under existing or future EHS laws.
Furthermore, we may be liable for the costs of investigating and cleaning up environmental contamination on or from our properties or at off‑site locations where we disposed of or arranged for the disposal or treatment of hazardous materials or from disposal activities that pre‑dated our purchase of our businesses. We may therefore incur additional costs and expenditures beyond those currently anticipated to address all such known and unknown situations under existing and future EHS laws.
Our operations, financial condition and liquidity could be adversely affected by legal claims against us, including antitrust claims.
We face risks arising from various legal actions, including matters relating to antitrust, product liability, intellectual property and environmental claims. It is possible that judgments could be rendered against us in these cases or others for which we could be uninsured or not covered by indemnity, or which may be beyond the amounts that we currently have reserved or anticipate incurring for such matters. Over the past few years, antitrust claims have been made against chemical companies. In this type of litigation, the plaintiffs generally seek treble damages, which may be significant. An adverse outcome in any antitrust claim could be material and significantly impact our operations, financial condition and liquidity.
Financial difficulties and related problems experienced by our customers, vendors, suppliers and other business partners could have a material adverse effect on our business.
During periods of economic disruption, more of our customers than normal may experience financial difficulties, including bankruptcies, restructurings and liquidations, which could affect our business by reducing sales, increasing our risk in extending trade credit to customers and reducing our profitability. A significant adverse change in a customer relationship or in a customer’s financial position could cause us to limit or discontinue business with that customer, require us to assume more credit risk relating to that customer’s receivables or limit our ability to collect accounts receivable from that customer.
Our business is dependent on our intellectual property. If our intellectual property rights cannot be enforced or our trade secrets become known to our competitors, our ability to compete may be adversely affected.
Proprietary protection of our processes, apparatuses and other technology is important to our business. While a presumption of validity exists with respect to patents issued to us in the U.S., there can be no assurance that any of our patents will not be challenged, invalidated, circumvented or rendered unenforceable. Furthermore, if any pending patent application filed by us does not result in an issued patent, or if patents are issued to us, but such patents do not provide meaningful protection of our intellectual property, then our ability to compete may be adversely affected. Additionally, our competitors or other third parties may obtain patents that restrict or preclude our ability to lawfully produce or sell our products in a competitive manner, which could have a material adverse effect on our business, results of operations, financial condition and liquidity.
We also rely upon unpatented proprietary know‑how and continuing technological innovation and other trade secrets to develop and maintain our competitive position. While it is our policy to enter into agreements imposing confidentiality obligations upon our employees and third parties to protect our intellectual property, these confidentiality obligations may be breached, may not provide meaningful protection for our trade secrets or proprietary know‑how, or adequate remedies may not be available in the event of an unauthorized access, use or disclosure of our trade secrets and know‑how. In addition, others could obtain knowledge of our trade secrets through independent development or other access by legal means.
We may have to rely on judicial enforcement of our patents and other proprietary rights. We may not be able to effectively protect our intellectual property rights from misappropriation or infringement in countries where effective patent, trademark, trade secret and other intellectual property laws and judicial systems may be unavailable, or may not protect our proprietary rights to the same extent as U.S. law.
The failure of our patents or confidentiality agreements to protect our processes, apparatuses, technology, trade secrets or proprietary know‑how or the failure of adequate legal remedies for related actions could have a material adverse effect on our business, results of operations, financial condition and liquidity.
Conflicts, military actions, terrorist attacks, political events and general instability, along with increased security regulations related to our industry, could adversely affect our business.
Conflicts, military actions, terrorist attacks and political events have precipitated economic instability and turmoil in international commerce and the global economy. The uncertainty and economic disruption resulting from hostilities, military action or acts of terrorism may impact any or all of our facilities and operations or those of our suppliers or customers. Accordingly, any conflict, military action or terrorist attack that impacts us or any of our suppliers or customers, could have a material adverse effect on our business, results of operations, financial condition and liquidity. Furthermore, instability and turmoil, particularly in energy‑producing nations, may result in raw material cost increases.
Changes in social, political, regulatory and economic conditions or in laws and policies governing foreign trade, manufacturing, development and investment in the territories and countries where we currently develop and sell products, could adversely affect our business. For example, a number of governments have instituted regulations attempting to increase the security of chemical plants and the transportation of hazardous chemicals, which could result in higher operating costs and could have a material adverse effect on our financial condition and liquidity.
If our subsidiaries do not make sufficient distributions to us, then we will not be able to make payment on our debts.
Our debt is generally the exclusive obligation of Huntsman International and our guarantor subsidiaries. Because a significant portion of our operations are conducted by nonguarantor subsidiaries, our cash flow and our ability to service indebtedness, including our ability to pay the interest on our debt when due and principal of such debt at maturity, are dependent to a large extent upon cash dividends and distributions or other transfers from such nonguarantor subsidiaries. Any payment of dividends, distributions, loans or advances by our nonguarantor subsidiaries to us could be subject to restrictions on dividends or repatriation of earnings under applicable local law, monetary transfer restrictions and foreign currency exchange regulations in the jurisdictions in which our subsidiaries operate, and any restrictions imposed by the current and future debt instruments of our nonguarantor subsidiaries. In addition, payments to us by our subsidiaries are contingent upon our subsidiaries’ earnings.
Our subsidiaries are separate legal entities and, except for our guarantor subsidiaries, have no obligation, contingent or otherwise, to pay any amounts due on our debt or to make any funds available for those amounts, whether by dividends, loans, distributions or other payments, and do not guarantee the payment of interest on, or principal of, our
debt. Any right that we have to receive any assets of any of our subsidiaries that are not guarantors upon the liquidation or reorganization of any such subsidiary, and the consequent right of holders of notes to realize proceeds from the sale of their assets, will be structurally subordinated to the claims of that subsidiary’s creditors, including trade creditors and holders of debt issued by that subsidiary.
Regulatory or market changes with respect to MTBE may materially reduce our sales and/or materially increase our costs.
We produce MTBE, an oxygenate that is blended with gasoline to reduce vehicle air emissions and to enhance the octane rating of gasoline. Because of the allegations that MTBE has contaminated some water supplies, its use has become controversial in the U.S. and elsewhere, and its use has been effectively eliminated in the U.S. market. We currently market MTBE, either directly or through third parties, to gasoline additive customers located outside the U.S. This business has been profitable to us over time, and legislative or regulatory initiatives or changing consumer opinion outside the U.S. restricting MTBE or changing consumer opinion could materially adversely affect our ability to market and sell MTBE and our profitability. In 2017, China announced that it would implement a mandate to use gasoline containing 10% ethanol by 2020. If implemented, ethanol could substitute MTBE and other blendstocks in the Chinese market. Expansion of our PO/MTBE operations, including our joint venture with Sinopec in China, further exposes us to these risks.
While we could use all or a portion of our precursor TBA to produce saleable products other than MTBE, this would require significant capital expenditures to modify our facilities. Moreover, the sale of other products would produce a lower level of cash flow than that historically produced from the sale of MTBE.
Our pension and postretirement benefit plan obligations are currently underfunded, and under certain circumstances we may have to significantly increase the level of cash funding to some or all of these plans, which would reduce the cash available for our business.
We have unfunded and underfunded obligations under some of our domestic and foreign pension and postretirement benefit plans. The funded status of our pension plans is dependent upon many factors, including returns on invested assets, the level of certain market interest rates and the discount rates used to determine pension obligations. Unfavorable returns on the plan assets or unfavorable changes in applicable laws or regulations could materially change the timing and amount of required plan funding, which would reduce the cash available for our business. In addition, a decrease in the discount rate used to determine pension obligations could result in an increase in the valuation of pension obligations, which could affect the reported funding status of our pension plans and future contributions, as well as the periodic pension cost in subsequent fiscal years.
With respect to our domestic pension and postretirement benefit plans, the Pension Benefit Guaranty Corporation (“PBGC”) has the authority to terminate an underfunded tax‑qualified pension plan under limited circumstances in accordance with the Employee Retirement Income Security Act of 1974, as amended. In the event our tax‑qualified pension plans are terminated by the PBGC, we could be liable to the PBGC for the entire amount of the underfunding and, under certain circumstances, the liability could be senior to our notes. With respect to our foreign pension and postretirement benefit plans, the effects of underfunding depend on the country in which the pension and postretirement benefit plan is established. For example, in the U.K. and Germany semi‑public pension protection programs have the authority in certain circumstances to assume responsibility for underfunded pension schemes, including the right to recover the amount of the underfunding from us.
Our debt level, a portion of which is subject to variable interest rates, makes us vulnerable to downturns and may limit our ability to respond to market conditions, to obtain additional financing or to refinance our debt.
As of December 31, 2017, our total consolidated outstanding debt was $2,298 million (including current portion of debt); our debt to total capitalization ratio was approximately 41%; our combined outstanding variable rate borrowings were approximately $236 million; and our current portion of debt totaled $40 million. Our debt level and the fact that a portion of our cash flow is required to make payments on our debt could have important consequences for our business, including but not limited to the following:
|
·
| |
we may be more vulnerable to business, industry or economic downturns, making it more difficult to respond to market conditions; |
|
·
| |
cash flow available for other purposes, including the growth of our business, may be reduced; |
|
·
| |
our ability to refinance or obtain additional financing may be constrained, particularly during periods when the capital markets are unsettled; |
|
·
| |
our competitors with lower debt levels may have a competitive advantage relative to us; and |
|
·
| |
part of our debt is subject to variable interest rates, which makes us more vulnerable to increases in interest rates (for example, a 1% increase in interest rates, without giving effect to interest rate hedges or other offsetting items, would increase our annual interest rate expense by approximately $2 million). |
Our debt level also impacts our credit ratings. Any decision by credit rating agencies to downgrade our debt ratings could restrict our ability to obtain additional financing and could result in increased interest and other costs.
U.S. federal income tax reform could adversely affect us.
On December 22, 2017, President Trump signed into law the U.S. Tax Reform Act that significantly reforms the Internal Revenue Code of 1986, as amended. As a result, we recorded a provisional tax benefit of $137 million due to a remeasurement of deferred tax assets and liabilities and a provisional tax expense of $85 million due to the transition tax on deemed repatriation of deferred foreign income. We currently do not expect tax reform to have a material detrimental impact to our future income tax expense or income tax cash payments. However, interpretations and implementation of the provisions of the U.S. Tax Reform Act will be forthcoming from both the federal and state tax authorities. These interpretations and implementations could have material unanticipated impacts on our income tax expense and cash payments and will be recorded in our provision for income taxes in future periods as we have currently recorded only provisional amounts. We continue to examine the impact this tax reform legislation may have on our business.
RISKS RELATED TO OUR COMMON STOCK AND DEBT SECURITIES
Certain provisions contained in our certificate of incorporation and bylaws could discourage a takeover attempt, which may reduce or eliminate the likelihood of a change of control transaction and, therefore, limit your ability to sell our common stock at a price higher than the current market value.
Certain provisions contained in our certificate of incorporation and bylaws, such as limitations on stockholder proposals at meetings of stockholders, the inability of stockholders to call special meetings and certain provisions of Delaware law, could make it more difficult for a third party to acquire control of our Company, even if some of our stockholders were to consider such a change of control to be beneficial. Our certificate of incorporation also authorizes our Board of Directors to issue preferred stock without stockholder approval. Therefore, our Board of Directors could elect to issue preferred stock that has special voting or other rights that could make it even more difficult for a third party to acquire us, which may reduce or eliminate your ability to sell our common stock at a price higher than the current market value.
We have purchased, and may continue to purchase, a portion of our equity and debt securities, which could impact the market for our equity and debt securities and likely would negatively affect our liquidity.
Consistent with past practices, we may from time to time seek to repurchase or redeem our equity and debt securities in open market purchases, accelerated repurchase programs, privately negotiated transactions, tender offers, partial or full calls for redemption or otherwise. Any such repurchases or redemptions and the timing and amount thereof would depend on prevailing market conditions, liquidity requirements, contractual restrictions and other factors. Such transactions could negatively affect our liquidity.
ITEM 1B. UNRESOLVED STAFF COMMENTS
As of the date of this filing, we did not have any unresolved comments from the staff of the SEC.
ITEM 2. PROPERTIES
We own or lease chemical manufacturing and research facilities in the locations indicated in the list below which we believe are adequate for our short‑term and anticipated long‑term needs. We own or lease office space and storage facilities throughout the U.S. and in many foreign countries. Our principal executive offices are located at 10003 Woodloch Forest Drive, The Woodlands, Texas 77380. The following is a list of our principal owned or leased properties where manufacturing, research and main office facilities are located.
|
Location
|
|
Business Segment
|
|
Description of Facility
|
|
|
|
|
|
|
|
The Woodlands, Texas(1)
|
|
Various
|
|
Executive Offices, Operating Headquarters, Global Technology Center and Shared Services Center
|
|
Salt Lake City, Utah(1)
|
|
Corporate and other
|
|
Administrative Offices
|
|
Kuala Lumpur, Malaysia(1)
|
|
Various
|
|
Shared Services Center
|
|
Mumbai, India(1)
|
|
Various
|
|
Technology Center, Administrative Offices, Labs and Shared Services Center
|
|
Sao Paulo, Brazil(1)
|
|
Various
|
|
Administrative Offices and Accounting Shared Services Center
|
|
Geismar, Louisiana(2)
|
|
Polyurethanes and Performance Products
|
|
MDI, Nitrobenzene(2), Aniline(2), Polyols and Maleic Anhydride Manufacturing Facilities, Polyurethane Systems House
|
|
Rotterdam, The Netherlands(1)
|
|
Polyurethanes and other various
|
|
MDI Manufacturing Facility, Polyols Manufacturing Facilities, Polyurethanes Systems House and Accounting Shared Services Center
|
|
Caojing, China
|
|
Polyurethanes
|
|
MDI Finishing Facilities
|
|
Caojing, China(3)
|
|
Polyurethanes
|
|
Precursor MDI Manufacturing Facility
|
|
Jinshan, China(1)
|
|
Polyurethanes
|
|
TPU Manufacturing Facility
|
|
Deer Park, Australia
|
|
Polyurethanes
|
|
Polyurethane Systems House
|
|
Cartagena, Colombia
|
|
Polyurethanes
|
|
Polyurethane Systems House
|
|
Deggendorf, Germany
|
|
Polyurethanes
|
|
Polyurethane Systems House and Technology Center
|
|
Ternate, Italy
|
|
Polyurethanes
|
|
Polyurethane Systems House and Technology Center
|
|
Shanghai, China(1)
|
|
Polyurethanes, Performance Products and Advanced Materials
|
|
Polyurethane Systems House, Global Technology Center, Performance Products Regional Headquarters and Shared Services Center
|
|
Azeglio, Italy
|
|
Polyurethanes
|
|
Polyurethane Systems House
|
|
Location
|
|
Business Segment
|
|
Description of Facility
|
|
|
|
|
|
|
|
Pune, India(1)
|
|
Polyurethanes
|
|
Polyurethane Systems House
|
|
Buenos Aires, Argentina(1)
|
|
Polyurethanes
|
|
Polyurethane Systems House
|
|
Samutprakarn, Thailand(1)
|
|
Polyurethanes
|
|
Polyurethane Systems House
|
|
Istanbul, Turkey
|
|
Polyurethanes
|
|
Polyurethane Systems House
|
|
Kuan Yin, Taiwan(1)
|
|
Polyurethanes
|
|
Polyurethane Systems House
|
|
Tlalnepantla, Mexico
|
|
Polyurethanes
|
|
Polyurethane Systems House
|
|
Mississauga, Canada
|
|
Polyurethanes
|
|
Polyurethane Systems House
|
|
Obninsk, Russia
|
|
Polyurethanes
|
|
Polyurethane Systems House
|
|
Dammam, Saudi Arabia(4)
|
|
Polyurethanes
|
|
Polyurethane Systems House
|
|
Georgsmarienhütte, Germany
|
|
Polyurethanes
|
|
Polyurethane Systems House
|
|
Castelfranco Emilia, Italy
|
|
Polyurethanes
|
|
Polyurethane Systems House
|
|
King’s Lynn, U.K.
|
|
Polyurethanes
|
|
Polyurethane Systems House
|
|
Ho Chi Minh City, Vietnam(1)(5)
|
|
Polyurethanes and Advanced Materials
|
|
Polyurethanes Systems House and Formulating Facility
|
|
Auburn Hills, Michigan(1)
|
|
Polyurethanes
|
|
Polyurethane Research Facility
|
|
Everberg, Belgium
|
|
Polyurethanes and Performance Products
|
|
Polyurethane and Performance Products Regional Headquarters, Global Technology Center and Shared Service Center
|
|
Houston, Texas(1)
|
|
Polyurethanes
|
|
Polyols Manufacturing Facility
|
|
Derry, New Hampshire(1)
|
|
Polyurethanes
|
|
TPU Research Facility
|
|
Ringwood, Illinois(1)
|
|
Polyurethanes
|
|
TPU Manufacturing Facility
|
|
Osnabrück, Germany
|
|
Polyurethanes
|
|
TPU Manufacturing Facility
|
|
Wilton, U.K.
|
|
Polyurethanes and other various
|
|
Aniline and Nitrobenzene Manufacturing Facilities
|
|
Nanjing, China(6)
|
|
Polyurethanes
|
|
PO and MTBE Manufacturing Facilities
|
|
Port Neches, Texas
|
|
Polyurethanes and Performance Products
|
|
Olefins, EO, EG, Surfactants, Amines, PO and MTBE Manufacturing Facilities
|
|
Conroe, Texas
|
|
Performance Products
|
|
Amines and Carbonates Manufacturing Facility
|
|
Petfurdo, Hungary(1)
|
|
Performance Products
|
|
Amines Manufacturing Facility
|
|
Llanelli, U.K.
|
|
Performance Products
|
|
Amines Manufacturing Facility
|
|
Freeport, Texas(1)
|
|
Performance Products
|
|
Amines Manufacturing Facility
|
|
Jurong Island, Singapore(1)
|
|
Performance Products
|
|
Amines Manufacturing Facility
|
|
Jubail, Saudi Arabia(7)
|
|
Performance Products
|
|
Amines Manufacturing Facility
|
|
Chocolate Bayou, Texas(1)
|
|
Performance Products
|
|
LAB Manufacturing Facility
|
|
Pensacola, Florida(1)
|
|
Performance Products
|
|
Maleic Anhydride Manufacturing Facility
|
|
Moers, Germany(8)
|
|
Performance Products
|
|
Maleic Anhydride Manufacturing Facility
|
|
Dayton, Texas
|
|
Performance Products
|
|
Surfactant Manufacturing Facility
|
|
Botany, Australia
|
|
Performance Products
|
|
Surfactant/EG Manufacturing Facility
|
|
Ankleshwar, India(1)
|
|
Performance Products
|
|
Surfactant/Amines Manufacturing Facility
|
|
Melbourne, Australia
|
|
Performance Products
|
|
Research Facility
|
|
Bergkamen, Germany
|
|
Advanced Materials
|
|
Synthesis Facility
|
|
Monthey, Switzerland
|
|
Advanced Materials
|
|
Resins and Synthesis Facility
|
|
Pamplona, Spain
|
|
Advanced Materials
|
|
Synthesis Facility
|
|
McIntosh, Alabama
|
|
Advanced Materials
|
|
Resins and Synthesis Facility
|
|
Bad Saeckingen, Germany
|
|
Advanced Materials
|
|
Formulating Facility
|
|
Duxford, U.K.
|
|
Advanced Materials
|
|
Formulating Facility
|
|
Taboão da Serra, Brazil
|
|
Advanced Materials, Polyurethanes and Textile Effects
|
|
Formulating Facility, Labs, Polyurethane Systems House and Chemicals and Inks Formulations Facility
|
|
Panyu, China(1)(9)
|
|
Advanced Materials and Textile Effects
|
|
Formulating and Synthesis Facility, Technology Center and Shared Services Center
|
|
Nanjing, China(1)
|
|
Advanced Materials
|
|
Formulating Facility
|
|
East Lansing, Michigan
|
|
Advanced Materials
|
|
Formulating Facility
|
|
Los Angeles, California
|
|
Advanced Materials
|
|
Formulating Facility
|
|
Basel, Switzerland
|
|
Advanced Materials and Textile Effects
|
|
Advanced Materials Regional Headquarters, Technology Center
|
|
Langweid am Leich, Germany
|
|
Textile Effects
|
|
Chemicals Synthesis and Chemicals and Inks Formulation Facility
|
|
Charlotte, North Carolina
|
|
Textile Effects
|
|
Chemicals Formulations Facility
|
|
Samutsakorn (Mahachai), Thailand
|
|
Textile Effects
|
|
Textiles Dyes Synthesis and Dyes and Inks Formulations Facility
|
|
Atotonilquillo, Mexico
|
|
Textile Effects
|
|
Textile Dyes and Chemicals Synthesis and Formulations Facility
|
|
Baroda, India
|
|
Textile Effects
|
|
Textile Dyes Synthesis and Dyes and Chemicals Formulations Facility
|
|
Gandaria, Jakarta, Indonesia
|
|
Textile Effects and Polyurethanes
|
|
Textile Dyes and Chemicals Formulations Facility and Polyurethane Systems House
|
|
Fraijanes, Guatemala
|
|
Textile Effects
|
|
Chemicals Formulations Facility
|
|
Bogota, Colombia
|
|
Textile Effects
|
|
Chemicals Formulations Facility
|
|
Hangzhou, China(1)
|
|
Textile Effects
|
|
Chemicals Formulations Facility
|
|
Karachi, Pakistan(1)
|
|
Textile Effects
|
|
Chemicals Formulations Facility
|
|
Corlu, Turkey(1)
|
|
Textile Effects
|
|
Chemicals Formulations Facility
|
|
Location
|
|
Business Segment
|
|
Description of Facility
|
|
|
|
|
|
|
|
Singapore(1)
|
|
Textile Effects and other various
|
|
Textile Effects Headquarters and Administrative Offices
|
|
Wynyard, U.K.(1)
|
|
Various
|
|
Administrative Offices
|
|
(1)
| |
Leased land and/or building. |
|
(2)
| |
The Geismar facility is owned as follows: we own 100% of the MDI, polyol and maleic anhydride facilities, and Rubicon LLC, a consolidated manufacturing joint venture with Lanxess in which we own a 50% interest, owns the aniline and nitrobenzene facilities. Rubicon LLC is a separate legal entity that operates both the assets that we own jointly with Lanxess and our wholly owned assets at Geismar. |
|
(3)
| |
35% interest in SLIC, our unconsolidated manufacturing joint venture with BASF and three Chinese chemical companies. |
|
(4)
| |
51%‑owned consolidated manufacturing joint venture with Basic Chemicals Industries Ltd. |
|
(5)
| |
The Ho Chi Minh City, Vietnam polyurethanes systems house and Advanced Materials formulating facility are currently under construction. |
|
(6)
| |
49% interest in Nanjing Jinling Huntsman New Material Co., Ltd., our unconsolidated manufacturing joint venture with Sinopec. Beneficial commercial operations began during the second half of 2017. |
|
(7)
| |
50% interest in AAC, our consolidated manufacturing joint venture with the Zamil Group. |
|
(8)
| |
50% interest in Sasol‑Huntsman, our consolidated manufacturing joint venture with Sasol. |
|
(9)
| |
95%‑owned consolidated manufacturing joint venture with Guangzhou Sheng’an Package Company Limited. |
ITEM 3. LEGAL PROCEEDINGS
Indemnification Matters
See “Note 18. Commitments and Contingencies—Indemnification Matters” to our consolidated financial statements.
Texas Emissions Penalties
On August 17, 2017, we were informed by the TCEQ that we would be assessed a penalty of $104,128 in connection with eight alleged unauthorized air emission events dating back to November 2015. We anticipate that the order will become final upon approval by the TCEQ commissioners in 2018.
ITEM 4. MINE SAFETY DISCLOSURES
Not applicable.
EXECUTIVE OFFICERS OF THE REGISTRANT
The following is information concerning our executive officers and significant employees as of the date of this report.
Peter R. Huntsman, age 54, is Chairman of the Board, President and Chief Executive Officer of our Company. Peter R. Huntsman has served as Chairman of the Board since January 2018 and as a director of our company and affiliated companies since 1994. Prior to his appointment in July 2000 as Chief Executive Officer, Mr. Huntsman had served as President and Chief Operating Officer since 1994. In 1987, Mr. Huntsman joined Huntsman Polypropylene Corporation as Vice President before serving as Senior Vice President and General Manager. Mr. Huntsman has also served as President of Olympus Oil, as Senior Vice President of Huntsman Chemical Corporation and as a Senior Vice President of Huntsman Packaging Corporation, a former subsidiary of our Company. Mr. Huntsman is a director or manager, as applicable, of Huntsman International and certain of our other subsidiaries. Mr. Huntsman currently serves as Chairman of the Board and a director of Venator Materials PLC, which separated from our Company in 2017.
Sean Douglas, age 53, is Executive Vice President and Chief Financial Officer. Mr. Douglas was appointed to this position in January 2017. Mr. Douglas was previously Vice President, Corporate Development and Treasurer from
July 2015 to July 2016. Mr. Douglas left the Company in July 2012 to perform charitable services and rejoined the Company in July 2015. He previously served as our Vice President, Corporate Development from December 2009 until July 2012. Mr. Douglas served as Vice President and Treasurer from 2002 to December 2009, Vice President, Finance from July 2001 to 2002 and Vice President, Administration from January 1997 to July 2001. Prior to joining Huntsman in 1990, Mr. Douglas worked for the accounting firm of PricewaterhouseCoopers.
J. Kimo Esplin, age 55, is Executive Vice President, Strategy and Investment. Mr. Esplin was appointed to this position in January 2017. Prior to this appointment, Mr. Esplin served as Chief Financial Officer of all of the Huntsman companies from 1999 to December 2016. From 1994 to 1999, Mr. Esplin served as our Treasurer. Prior to joining Huntsman in 1994, Mr. Esplin was a Vice President in the Investment Banking Division of Bankers Trust Company, where he worked for seven years. Mr. Esplin also serves as a director of Nutraceutical International Corporation and Savage Services Corporation.
David M. Stryker, age 59, is Executive Vice President, General Counsel and Secretary. Mr. Stryker was appointed to this position in June 2013. Prior to joining Huntsman, Mr. Stryker served as Senior Vice President, General Counsel, Secretary and Chief Compliance Officer of the BASF Corporation since 2004. Previously, he was Associate General Counsel and Chief Compliance Officer at Siemens Corporation and, prior to that, a partner at the law firm of Kirkland & Ellis. Mr. Stryker started his legal career as a judicial clerk to the Honorable Robert H. Bork on the U.S. Court of Appeals for the D.C. Circuit.
Anthony P. Hankins, age 60, is Division President, Polyurethanes and Chief Executive Officer, Asia‑Pacific. Mr. Hankins was appointed to these positions in March 2004 and February 2011, respectively. From May 2003 to February 2004, Mr. Hankins served as President, Performance Products, from January 2002 to April 2003, he served as Global Vice President, Rigids Division for our Polyurethanes segment, from October 2000 to December 2001, he served as Vice President—Americas for our Polyurethanes segment, and from March 1998 to September 2000, he served as Vice President—Asia‑Pacific for our Polyurethanes segment. Mr. Hankins worked for ICI from 1980 to February 1998, when he joined our Company. At ICI, Mr. Hankins held numerous management positions in the plastics, fibers and polyurethanes businesses. He has extensive international experience, having held senior management positions in Europe, Asia and the U.S.
Rohit Aggarwal, age 50, is Division President, Textile Effects. Mr. Aggarwal was appointed to this position in July 2016. Mr. Aggarwal was previously Vice President and Managing Director of Indian Subcontinent for Huntsman from July 2015 to July 2016 and served in various positions within Huntsman’s Advanced Materials and Textile Effects segments from 2005 to 2013. In 2013, Mr. Aggarwal left Huntsman to join Louis Dreyfus Commodities B.V. as Chief Executive Officer of Asia Region, a position he held until his return to our Company in 2015.
Monte G. Edlund, age 62, is Division President, Performance Products. Prior to his appointment to this position in July 2015, Mr. Edlund served as Vice President—Americas, Advanced Materials since July 2011. From December 2007 to July 2011, Mr. Edlund served as Vice President—Global Specialty Textiles, Textile Effects, from April 2002 to December 2007, he served as Vice President, Polymers and from June 1999 to April 2002, he served as Vice President, Marketing, Base Chemicals and Polymers. Prior to joining Huntsman in 1997 as Vice President—Marketing, Rexene, Mr. Edlund held numerous positions with Rexene Corporation.
Scott J. Wright, age 46, is Division President, Advanced Materials. Mr. Wright was appointed to this position in June 2016. Prior to that time, Mr. Wright served as Vice President of Huntsman Advanced Materials—Europe, Middle East & Africa since 2011. Before joining Huntsman’s Advanced Materials segment, Mr. Wright spent 15 years in Huntsman’s former P&A Business in a number of roles of increasing responsibility including product development, business planning, marketing and sales. Prior to joining Huntsman in July 1999, Mr. Wright worked with ICI.
Ronald W. Gerrard, age 58, is Senior Vice President, Environmental, Health & Safety and Manufacturing Excellence. Mr. Gerrard was appointed to this position in June 2009. He also serves as our Corporate Sustainability Officer. From May 2004 to June 2009, Mr. Gerrard served as Vice President, Global Operations and Technology in our Polyurethanes segment. From 1999 to May 2004, Mr. Gerrard served as Vice President, Asia; Business Director, Flexible Foams; and Director, EHS and Engineering, also within our Polyurethanes segment. Prior to joining Huntsman in 1999, Mr. Gerrard had worked for ICI and for EVC, a joint venture between ICI and Enichem. Mr. Gerrard is a Chartered Engineer.
R. Wade Rogers, age 52, is Senior Vice President, Global Human Resources. Mr. Rogers has held this position since August 2009. From May 2004 to August 2009, Mr. Rogers served as Vice President, Global Human Resources, from October 2003 to May 2004, Mr. Rogers served as Director, Human Resources—Americas and from August 2000 to October 2003, he served as Director, Human Resources for our Polymers and Base Chemicals businesses. From the time
he joined Huntsman in 1994 to August 2000, Mr. Rogers served as Area Manager, Human Resources—Jefferson County Operations. Prior to joining Huntsman, Mr. Rogers held a variety of positions with Texaco Chemical Company.
Randy W. Wright, age 59, is Vice President and Controller. Prior to his appointment to this position in February 2012, Mr. Wright served as Assistant Controller and Director of Financial Reporting since July 2004. Prior to joining Huntsman in 2004, Mr. Wright held various positions with Georgia‑Pacific Corporation, Riverwood International, Johns Manville and PricewaterhouseCoopers. Mr. Wright is a Certified Public Accountant.
Delaney Bellinger, age 59, is Vice President and Chief Information Officer. Ms. Bellinger was appointed to this position in July 2016. Prior to joining Huntsman, Ms. Bellinger served as Chief Information Officer for EP Energy (formerly El Paso Corporation) from May 2012 to May 2016 and as Vice President, Business Solutions from May 2011 to May 2012. Previously, Ms. Bellinger was Chief Information Officer at YUM Brands and held various positions at PEPSICO, Electronic Data Systems (EDS) and Exxon.
Brandon M. Gray, age 42, is Vice President and Treasurer. Prior to his appointment to this position in February 2017, Mr. Gray served as Assistant Treasurer since April 2007. Prior to joining Huntsman in 2004, Mr. Gray held various positions with Novell and PricewaterhouseCoopers. Mr. Gray is a Certified Public Accountant.
Kevin C. Hardman, age 54, is Vice President, Tax. Mr. Hardman served as Chief Tax Officer from 1999 until he was appointed to his current position in 2002. Prior to joining Huntsman in 1999, Mr. Hardman was a tax Senior Manager with the accounting firm of Deloitte & Touche LLP, where he worked for 10 years. Mr. Hardman is a Certified Public Accountant and holds a master’s degree in tax accounting.
Troy M. Keller, age 47, is Vice President, Government Affairs and Associate General Counsel. He has held this position since August 2015. From 2008 to 2015, Mr. Keller served as Vice President, Associate General Counsel & Assistant Secretary and from 2005 to 2008 he served as Senior Corporate Counsel & Assistant Secretary. Prior to joining Huntsman, he had been an attorney at Qwest Communications International and an associate at the law firms of Brobeck, Phleger & Harrison LLP and Brown & Wood LLP.
Ivan Marcuse, age 41, is Vice President, Investor Relations. Prior to joining Huntsman in April 2017, Mr. Marcuse served as Director, Equity Research, Specialty Chemicals for KeyBanc Capital Markets Inc. from August 2011 to February 2017. Previously, he was Vice President, Equity Research, Building Products and Materials, for Northcoast Research. Mr. Marcuse is a CFA charterholder.
Pierre Poukens, age 55, is Vice President, Internal Audit, a position he has held since February 2012. Mr. Poukens was Director of Internal Audit from April 2005 to January 2012 and joined Huntsman as Internal Audit Manager in January 2000. Prior to joining Huntsman, Mr. Poukens held various accounting and auditing positions with European companies in Belgium. Mr. Poukens is a Certified Internal Auditor.
PART II
ITEM 5. MARKET FOR REGISTRANT’S COMMON EQUITY, RELATED STOCKHOLDER MATTERS AND ISSUER PURCHASES OF EQUITY SECURITIES
Market Information And Holders
Our common stock is listed on the New York Stock Exchange under the symbol “HUN.” As of February 8, 2018, there were approximately 55 stockholders of record and the closing price of our common stock on the New York Stock Exchange was $30.83 per share.
The reported high and low sale prices of our common stock on the New York Stock Exchange for each of the periods set forth below are as follows:
|
|
|
|
|
|
|
|
|
Period
|
|
High
|
|
Low
|
|
2017
|
|
|
|
|
|
|
|
First Quarter
|
|
$
|
25.22
|
|
$
|
18.94
|
|
Second Quarter
|
|
|
28.20
|
|
|
23.13
|
|
Third Quarter
|
|
|
28.67
|
|
|
24.51
|
|
Fourth Quarter
|
|
|
33.78
|
|
|
27.06
|
|
|
|
|
|
|
|
|
|
Period
|
|
High
|
|
Low
|
|
2016
|
|
|
|
|
|
|
|
First Quarter
|
|
$
|
13.83
|
|
$
|
7.46
|
|
Second Quarter
|
|
|
16.65
|
|
|
12.45
|
|
Third Quarter
|
|
|
18.11
|
|
|
12.40
|
|
Fourth Quarter
|
|
|
20.52
|
|
|
15.38
|
Dividends
The following tables represent dividends on common stock for our Company for the years ended December 31, 2017 and 2016 (dollars in millions, except per share payment amounts):
|
|
|
|
|
|
|
|
|
|
|
2017
|
|
|
|
Per share
|
|
Approximate
|
|
Quarter ended
|
|
payment amount
|
|
amount paid
|
|
March 31, 2017
|
|
$
|
0.125
|
|
$
|
30
|
|
June 30, 2017
|
|
|
0.125
|
|
|
30
|
|
September 30, 2017
|
|
|
0.125
|
|
|
30
|
|
December 31, 2017
|
|
|
0.125
|
|
|
30
|
|
|
|
|
|
|
|
|
|
|
|
2016
|
|
|
|
Per share
|
|
Approximate
|
|
Quarter ended
|
|
payment amount
|
|
amount paid
|
|
March 31, 2016
|
|
$
|
0.125
|
|
$
|
30
|
|
June 30, 2016
|
|
|
0.125
|
|
|
30
|
|
September 30, 2016
|
|
|
0.125
|
|
|
30
|
|
December 31, 2016
|
|
|
0.125
|
|
|
30
|
The payment of dividends is a business decision made by our Board of Directors from time to time based on our earnings, financial position and prospects, and such other considerations as our Board of Directors considers relevant. Accordingly, while management currently expects that the Company will continue to pay the quarterly cash dividend, its dividend practice may change at any time. On February 7, 2018, the Board of Directors approved an increase to the quarterly cash dividend to $0.1625 per share of common stock beginning with the March 30, 2018 quarterly dividend.
Securities Authorized For Issuance Under Equity Compensation Plans
See “Part III. Item 11. Executive Compensation” for information relating to our equity compensation plans.
Purchases Of Equity Securities By The Company
The following table provides information with respect to shares of restricted stock granted under our stock incentive plans that we withheld upon vesting to satisfy our tax withholding obligations during the three months ended December 31, 2017.
|
|
|
|
|
|
|
|
|
|
|
|
|
|
|
|
|
|
|
|
|
|
Maximum number
|
|
|
|
|
|
|
|
|
Total number of
|
|
(or approximate
|
|
|
|
|
|
|
|
|
shares purchased
|
|
dollar value) of
|
|
|
|
Total number
|
|
Average
|
|
as part of publicly
|
|
shares that may yet
|
|
|
|
of shares
|
|
price paid
|
|
announced plans
|
|
be purchased under
|
|
|
|
purchased
|
|
per share
|
|
or programs(1)
|
|
the plans or programs(1)
|
|
October
|
|
—
|
|
$
|
—
|
|
—
|
|
$
|
50,000,000
|
|
November
|
|
—
|
|
|
—
|
|
—
|
|
|
50,000,000
|
|
December
|
|
54,091
|
|
|
33.29
|
|
—
|
|
|
50,000,000
|
|
Total
|
|
54,091
|
|
$
|
33.29
|
|
|
|
|
|
|
|
(1) On September 29, 2015, our Board of Directors authorized our Company to repurchase up to $150 million in shares of our common stock. No shares were repurchased under our publicly announced stock repurchase program during the three months ended December 31, 2017. On February 7, 2018, our Board of Directors authorized our Company to repurchase up to $400 million in shares of our common stock in addition to the $50 million remaining under our September 2015 share repurchase authorization. For more information, see “Note 20. Huntsman Corporation Stockholders’ Equity—Share Repurchase Program” to our consolidated financial statements.
|
ITEM 6. SELECTED FINANCIAL DATA
The selected historical financial data set forth below presents our historical financial data as of and for the dates and periods indicated. You should read the selected financial data in conjunction with “—Item 7. Management’s Discussion and Analysis of Financial Condition and Results of Operations” and our consolidated financial statements and accompanying notes.
Huntsman Corporation
|
|
|
|
|
|
|
|
|
|
|
|
|
|
|
|
|
|
|
|
Year ended December 31,
|
|
(in millions, except per share amounts)
|
|
2017
|
|
2016
|
|
2015
|
|
2014
|
|
2013
|
|
Statements of Operations Data:
|
|
|
|
|
|
|
|
|
|
|
|
|
|
|
|
|
Revenues
|
|
$
|
8,358
|
|
$
|
7,518
|
|
$
|
8,139
|
|
$
|
10,029
|
|
$
|
9,810
|
|
Gross profit
|
|
|
1,812
|
|
|
1,526
|
|
|
1,734
|
|
|
1,853
|
|
|
1,660
|
|
Restructuring, impairment and plant closing costs
|
|
|
20
|
|
|
47
|
|
|
83
|
|
|
98
|
|
|
147
|
|
Operating income
|
|
|
851
|
|
|
675
|
|
|
717
|
|
|
772
|
|
|
508
|
|
Income from continuing operations
|
|
|
583
|
|
|
365
|
|
|
428
|
|
|
485
|
|
|
169
|
|
Income (loss) from discontinued operations, net of tax(a)
|
|
|
158
|
|
|
(8)
|
|
|
(302)
|
|
|
(140)
|
|
|
(20)
|
|
Net income
|
|
|
741
|
|
|
357
|
|
|
126
|
|
|
345
|
|
|
149
|
|
Net income attributable to noncontrolling interests
|
|
|
(105)
|
|
|
(31)
|
|
|
(33)
|
|
|
(22)
|
|
|
(21)
|
|
Net income attributable to Huntsman Corporation
|
|
|
636
|
|
|
326
|
|
|
93
|
|
|
323
|
|
|
128
|
|
Basic income (loss) per common share:
|
|
|
|
|
|
|
|
|
|
|
|
|
|
|
|
|
Income from continuing operations attributable to Huntsman Corporation common stockholders
|
|
$
|
2.01
|
|
$
|
1.41
|
|
$
|
1.63
|
|
$
|
1.91
|
|
$
|
0.62
|
|
Income (loss) from discontinued operations attributable to Huntsman Corporation common stockholders, net of tax(a)
|
|
|
0.66
|
|
|
(0.03)
|
|
|
(1.25)
|
|
|
(0.58)
|
|
|
(0.09)
|
|
Net income attributable to Huntsman Corporation common stockholders
|
|
$
|
2.67
|
|
$
|
1.38
|
|
$
|
0.38
|
|
$
|
1.33
|
|
$
|
0.53
|
|
Diluted income (loss) per common share:
|
|
|
|
|
|
|
|
|
|
|
|
|
|
|
|
|
Income from continuing operations attributable to Huntsman Corporation common stockholders
|
|
$
|
1.96
|
|
$
|
1.39
|
|
$
|
1.61
|
|
$
|
1.88
|
|
$
|
0.61
|
|
Income (loss) from discontinued operations attributable to Huntsman Corporation common stockholders, net of tax(a)
|
|
|
0.65
|
|
|
(0.03)
|
|
|
(1.23)
|
|
|
(0.57)
|
|
|
(0.08)
|
|
Net income attributable to Huntsman Corporation common stockholders
|
|
$
|
2.61
|
|
$
|
1.36
|
|
$
|
0.38
|
|
$
|
1.31
|
|
$
|
0.53
|
|
Other Data:
|
|
|
|
|
|
|
|
|
|
|
|
|
|
|
|
|
Depreciation and amortization
|
|
$
|
319
|
|
$
|
318
|
|
$
|
298
|
|
$
|
358
|
|
$
|
366
|
|
Capital expenditures
|
|
|
282
|
|
|
318
|
|
|
461
|
|
|
465
|
|
|
372
|
|
Dividends per share
|
|
|
0.50
|
|
|
0.50
|
|
|
0.50
|
|
|
0.50
|
|
|
0.50
|
|
Balance Sheet Data (at period end):
|
|
|
|
|
|
|
|
|
|
|
|
|
|
|
|
|
Total assets
|
|
$
|
10,244
|
|
$
|
9,189
|
|
$
|
9,820
|
|
$
|
10,923
|
|
$
|
9,159
|
|
Total debt
|
|
|
2,298
|
|
|
4,173
|
|
|
4,770
|
|
|
5,104
|
|
|
3,877
|
|
Total liabilities
|
|
|
6,873
|
|
|
7,722
|
|
|
8,191
|
|
|
8,972
|
|
|
7,030
|
|
(a)
| |
Income (loss) from discontinued operations represents the operating results of our former P&A Business as well as our former Australian styrenics business, our former U.S. base chemicals business and our former North American polymers business. The U.S. base chemicals business was sold on November 5, 2007 and the North American polymers business was sold on August 1, 2007. |
ITEM 7. MANAGEMENT’S DISCUSSION AND ANALYSIS OF FINANCIAL CONDITION AND RESULTS OF OPERATIONS
Recent Developments
Separation of the P&A Business
In August 2017, we separated the P&A Business and conducted an IPO of ordinary shares of Venator, formerly a wholly-owned subsidiary of Huntsman. Additionally, in December 2017, we conducted a secondary offering of Venator ordinary shares. All of such ordinary shares were sold by Huntsman, and Venator did not receive any proceeds from the offerings. Venator’s ordinary shares began trading on The New York Stock Exchange under the symbol “VNTR” on August 3, 2017. As of December 31, 2017, Huntsman retained approximately 55% ownership in Venator. On January 3, 2018, the underwriters purchased an additional 1,948,955 Venator ordinary shares pursuant to their over-allotment option, which reduced Huntsman’s ownership interest in Venator to approximately 53%. Beginning in the third quarter of 2017, we reported the results of operations of the P&A Business as discontinued operations. For more information, see “Note 3. Discontinued Operations and Business Dispositions—Separation of P&A Business” to our consolidated financial statements.
Prepayment of Debt
In August 2017, we made early prepayments of $1,207 million on our Senior Credit Facilities, of which $106 million was paid on our 2015 Extended Term Loan B, $347 million was paid on our 2021 Term Loan B, and $754 million was paid on our 2023 Term Loan B. The funds used to pay down the debt included $732 million received from Venator ($750 million of debt raised by Venator, net of $18 million of debt issuance costs), upon its payment of intercompany debt obligations owed to Huntsman, and $475 million from proceeds of the Venator IPO. In connection with the $1,207 million prepayments of our term loans, we recognized a loss on early extinguishment of debt of $34 million. Additionally, in December 2017, we repaid in full the remaining $511 million on our 2023 Term Loan B using the funds raised from the secondary offering and existing cash and recognized a loss on early extinguishment of debt of $15 million. See “Note 13. Debt—Direct and Subsidiary Debt—Senior Credit Facilities” to our consolidated financial statements.
With available free cash flow, the net proceeds from the sale of our investment in the P&A business and cash from the repayment of related intercompany indebtedness as described above, we repaid $2.1 billion of debt during the full year 2017 and believe we achieved investment grade-type leverage metrics at year end. See “Note 13. Debt—Direct and Subsidiary Debt—Senior Credit Facilities” to our consolidated financial statements.
Termination of Huntsman and Clariant Merger Agreement
As previously disclosed, on May 21, 2017, Huntsman and Clariant entered into a merger agreement. On October 26, 2017, Huntsman and Clariant entered into a termination agreement pursuant to which the parties mutually terminated the merger agreement. No fees are payable under the terms of the termination agreement at this time. Huntsman and Clariant also agreed to release each other from claims and liabilities arising out of or related to the merger agreement or the transactions contemplated thereby. Pursuant to the termination agreement, each party agreed to bear its own costs, fees and expenses in connection with the merger agreement and the transaction costs contemplated thereby, except for specified joint filing fees and related expenses as set forth in the merger agreement. During the years ended December 31, 2017, 2016 and 2015, we incurred merger-related costs of $28 million, nil and nil, respectively.
U.S. Tax Reform Act
On December 22, 2017, the U.S. Tax Reform Act was signed into law. The U.S. Tax Reform Act significantly revised the U.S. corporate income tax regime by, among other things, lowering the U.S. corporate tax rate from 35% to 21%, effective January 1, 2018, repealing the deduction for domestic production activities and imposing a repatriation tax on deemed repatriated earnings of foreign subsidiaries.
As a result of the U.S. Tax Reform Act, the Company recorded a provisional tax benefit of $137 million due to a remeasurement of deferred tax assets and liabilities and a provisional tax expense of $85 million due to the transition tax on deemed repatriation of deferred foreign income. Absent the Venator offering and certain tax related restructuring transactions, our provisional transition tax liability on deemed repatriation of deferred foreign income would have been $12 million.
Share Repurchase Program
On February 7, 2018, our Board of Directors authorized our Company to repurchase up to $400 million in shares of our common stock in addition to the $50 million remaining under our September 2015 share repurchase authorization. Repurchases may be made through the open market or in privately negotiated transactions, and repurchases may be commenced or suspended from time to time without prior notice. Shares of common stock acquired through the repurchase program are held in treasury at cost.
Outlook
We expect the following factors to impact our operating segments:
Polyurethanes:
|
·
| |
Solid MDI demand and margins |
|
·
| |
2018 to benefit from new China projects coming on-line |
|
·
| |
Growth in downstream differentiated systems |
|
·
| |
Favorable margins due to supply constraints expected to soften |
|
·
| |
MTBE margins remain depressed, but first quarter of 2018 improving year over year |
Performance Products:
|
·
| |
Recovery continues in 2018 |
|
·
| |
EBITDA growth in amines and surfactants |
|
·
| |
Higher year-over-year sales volumes |
|
·
| |
Lower EBITDA margins in our upstream intermediates businesses |
|
·
| |
Planned Port Neches maintenance with estimated $15 million EBITDA impact in second quarter of 2018 |
Advanced Materials:
|
·
| |
Expected solid growth in 2018 |
|
·
| |
Growth in specialty volumes |
|
·
| |
Pricing initiatives implemented to help offset higher raw material costs |
|
·
| |
Wind market remains challenging |
Textile Effects:
|
·
| |
Sustainable solutions driving two times GDP volume growth |
|
·
| |
Solid EBITDA growth in 2018 |
In 2018, we expect to spend approximately $325 million on capital expenditures.
In 2017, our adjusted effective tax rate was 20%. We expect our long term adjusted effective tax rate will be approximately 23% to 25%, reflecting impacts of approximately 4% for the reduction in the U.S. corporate tax rate, offset by approximately 2% after potentially releasing valuation allowances in Switzerland and the U.K., which we believe may be necessary late this year as described below. We believe our 2018 adjusted effective tax rate will range between 21% and 23%, prior to the tax impact of any potential release of valuation allowances in Switzerland and the U.K. Based upon the separation of our P&A Business from our U.K. combined group and the trend in profitability in our Polyurethanes business in the U.K., we anticipate that by mid to late 2018 our cumulative profitability will result in a release of valuation allowances on certain net deferred tax assets in the U.K. Because there will be limitations on utilization of NOLs, we currently estimate a partial valuation allowance release of approximately $20 million during 2018. In addition, based upon the positive trend in profitability in our Advanced Materials and Textile Effects businesses in Switzerland, we anticipate that by mid to late 2018 our cumulative profitability will result in a release of valuation allowances on certain net deferred tax assets in Switzerland. Given Switzerland’s limited 7 year carryover of net operating losses, we expect that some of our losses will expire unused. Therefore, we currently estimate a partial release
of valuation allowance of approximately $100 million during 2018. For further information, see “Note 17. Income Taxes” to our consolidated financial statements.
Results Of Operations
For each of our Company and Huntsman International, the following tables set forth our consolidated results of operations for the years ended December 31, 2017, 2016 and 2015 (dollars in millions, except per share amounts).
Huntsman Corporation
|
|
|
|
|
|
|
|
|
|
|
|
|
|
|
|
|
|
Year ended December 31,
|
|
Percent Change
|
|
|
|
2017
|
|
2016
|
|
2015
|
|
2017 vs 2016
|
|
2016 vs
2015
|
|
Revenues
|
|
$
|
8,358
|
|
$
|
7,518
|
|
$
|
8,139
|
|
11%
|
|
(8)%
|
|
Cost of goods sold
|
|
|
6,546
|
|
|
5,992
|
|
|
6,405
|
|
9%
|
|
(6)%
|
|
Gross profit
|
|
|
1,812
|
|
|
1,526
|
|
|
1,734
|
|
19%
|
|
(12)%
|
|
Operating expenses
|
|
|
936
|
|
|
905
|
|
|
934
|
|
3%
|
|
(3)%
|
|
Restructuring, impairment and plant closing costs
|
|
|
20
|
|
|
47
|
|
|
83
|
|
(57)%
|
|
(43)%
|
|
Merger costs
|
|
|
28
|
|
|
—
|
|
|
—
|
|
NM
|
|
—
|
|
Other operating (income) expense, net
|
|
|
(23)
|
|
|
(101)
|
|
|
—
|
|
(77)%
|
|
NM
|
|
Operating income
|
|
|
851
|
|
|
675
|
|
|
717
|
|
26%
|
|
(6)%
|
|
Interest expense
|
|
|
(165)
|
|
|
(203)
|
|
|
(205)
|
|
(19)%
|
|
(1)%
|
|
Equity in income of investment in unconsolidated affiliates
|
|
|
13
|
|
|
5
|
|
|
6
|
|
160%
|
|
(17)%
|
|
Loss on early extinguishment of debt
|
|
|
(54)
|
|
|
(3)
|
|
|
(31)
|
|
NM
|
|
(90)%
|
|
Other income, net
|
|
|
2
|
|
|
—
|
|
|
1
|
|
NM
|
|
(100)%
|
|
Income from continuing operations before income taxes
|
|
|
647
|
|
|
474
|
|
|
488
|
|
36%
|
|
(3)%
|
|
Income tax expense
|
|
|
(64)
|
|
|
(109)
|
|
|
(60)
|
|
(41)%
|
|
82%
|
|
Income from continuing operations
|
|
|
583
|
|
|
365
|
|
|
428
|
|
60%
|
|
(15)%
|
|
Income (loss) from discontinued operations, net of tax
|
|
|
158
|
|
|
(8)
|
|
|
(302)
|
|
NM
|
|
(97)%
|
|
Net income
|
|
|
741
|
|
|
357
|
|
|
126
|
|
108%
|
|
183%
|
|
Reconciliation of net income to adjusted EBITDA:
|
|
|
|
|
|
|
|
|
|
|
|
|
|
|
Net income attributable to noncontrolling interests
|
|
|
(105)
|
|
|
(31)
|
|
|
(33)
|
|
239%
|
|
(6)%
|
|
Interest expense from continuing operations
|
|
|
165
|
|
|
203
|
|
|
205
|
|
(19)%
|
|
(1)%
|
|
Interest expense (income) from discontinued operations
|
|
|
19
|
|
|
(1)
|
|
|
—
|
|
NM
|
|
NM
|
|
Income tax expense from continuing operations
|
|
|
64
|
|
|
109
|
|
|
60
|
|
(41)%
|
|
82%
|
|
Income tax expense (benefit) from discontinued operations
|
|
|
67
|
|
|
(24)
|
|
|
(16)
|
|
NM
|
|
50%
|
|
Depreciation and amortization of continuing operations
|
|
|
319
|
|
|
318
|
|
|
298
|
|
—
|
|
7%
|
|
Depreciation and amortization of discontinued operations
|
|
|
68
|
|
|
114
|
|
|
101
|
|
(40)%
|
|
13%
|
|
Other adjustments:
|
|
|
|
|
|
|
|
|
|
|
|
|
|
|
Business acquisition and integration expenses
|
|
|
19
|
|
|
12
|
|
|
9
|
|
|
|
|
|
Merger costs
|
|
|
28
|
|
|
—
|
|
|
—
|
|
|
|
|
|
EBITDA from discontinued operations
|
|
|
(312)
|
|
|
(81)
|
|
|
217
|
|
|
|
|
|
Minority interest of discontinued operations
|
|
|
49
|
|
|
11
|
|
|
7
|
|
|
|
|
|
Loss on early extinguishment of debt
|
|
|
54
|
|
|
3
|
|
|
31
|
|
|
|
|
|
Certain legal settlements and related (income) expenses
|
|
|
(11)
|
|
|
1
|
|
|
1
|
|
|
|
|
|
(Gain) loss on sale of assets
|
|
|
(9)
|
|
|
(97)
|
|
|
1
|
|
|
|
|
|
Amortization of pension and postretirement actuarial losses
|
|
|
73
|
|
|
55
|
|
|
66
|
|
|
|
|
|
Plant incident remediation costs
|
|
|
16
|
|
|
—
|
|
|
—
|
|
|
|
|
|
U.S. Tax Reform Act impact on minority interest
|
|
|
(6)
|
|
|
—
|
|
|
—
|
|
|
|
|
|
Restructuring, impairment and plant closing and transition costs(4)
|
|
|
20
|
|
|
48
|
|
|
87
|
|
|
|
|
|
Adjusted EBITDA(1)
|
|
$
|
1,259
|
|
$
|
997
|
|
$
|
1,160
|
|
26%
|
|
(14)%
|
|
|
|
|
|
|
|
|
|
|
|
|
|
|
|
|
Net cash provided by operating activities from continuing operations
|
|
$
|
842
|
|
$
|
974
|
|
$
|
614
|
|
(14)%
|
|
59%
|
|
Net cash used in investing activities from continuing operations
|
|
|
(265)
|
|
|
(119)
|
|
|
(404)
|
|
123%
|
|
(71)%
|
|
Net cash used in financing activities
|
|
|
(519)
|
|
|
(723)
|
|
|
(562)
|
|
(28)%
|
|
29%
|
|
Capital expenditures from continuing operations
|
|
|
(282)
|
|
|
(318)
|
|
|
(461)
|
|
(11)%
|
|
(31)%
|
Huntsman International
|
|
|
|
|
|
|
|
|
|
|
|
|
|
|
|
|
|
|
|
|
|
|
|
|
|
|
|
|
|
|
|
|
|
Year ended December 31,
|
|
Percent Change
|
|
|
|
2017
|
|
2016
|
|
2015
|
|
2017 vs 2016
|
|
2016 vs 2015
|
|
Revenues
|
|
$
|
8,358
|
|
$
|
7,518
|
|
$
|
8,139
|
|
11%
|
|
(8)%
|
|
Cost of goods sold
|
|
|
6,543
|
|
|
5,988
|
|
|
6,401
|
|
9%
|
|
(6)%
|
|
Gross profit
|
|
|
1,815
|
|
|
1,530
|
|
|
1,738
|
|
19%
|
|
(12)%
|
|
Operating expenses
|
|
|
931
|
|
|
901
|
|
|
929
|
|
3%
|
|
(3)%
|
|
Restructuring, impairment and plant closing costs
|
|
|
20
|
|
|
47
|
|
|
83
|
|
(57)%
|
|
(43)%
|
|
Merger costs
|
|
|
28
|
|
|
—
|
|
|
—
|
|
NM
|
|
—
|
|
Other operating (income) expense, net
|
|
|
(23)
|
|
|
(101)
|
|
|
1
|
|
(77)%
|
|
NM
|
|
Operating income
|
|
|
859
|
|
|
683
|
|
|
725
|
|
26%
|
|
(6)%
|
|
Interest expense
|
|
|
(181)
|
|
|
(215)
|
|
|
(214)
|
|
(16)%
|
|
—
|
|
Equity in income of investment in unconsolidated affiliates
|
|
|
13
|
|
|
5
|
|
|
6
|
|
160%
|
|
(17)%
|
|
Loss on early extinguishment of debt
|
|
|
(54)
|
|
|
(3)
|
|
|
(31)
|
|
NM
|
|
(90)%
|
|
Other income, net
|
|
|
3
|
|
|
5
|
|
|
7
|
|
(40)%
|
|
(29)%
|
|
Income from continuing operations before income taxes
|
|
|
640
|
|
|
475
|
|
|
493
|
|
35%
|
|
(4)%
|
|
Income tax expense
|
|
|
(61)
|
|
|
(108)
|
|
|
(59)
|
|
(44)%
|
|
83%
|
|
Income from continuing operations
|
|
|
579
|
|
|
367
|
|
|
434
|
|
58%
|
|
(15)%
|
|
Income (loss) from discontinued operations, net of tax
|
|
|
155
|
|
|
(13)
|
|
|
(307)
|
|
NM
|
|
(96)%
|
|
Net income
|
|
|
734
|
|
|
354
|
|
|
127
|
|
107%
|
|
179%
|
|
Reconciliation of net income to adjusted EBITDA:
|
|
|
|
|
|
|
|
|
|
|
|
|
|
|
Net income attributable to noncontrolling interests
|
|
|
(105)
|
|
|
(31)
|
|
|
(33)
|
|
239%
|
|
(6)%
|
|
Interest expense from continuing operations
|
|
|
181
|
|
|
215
|
|
|
214
|
|
(16)%
|
|
—
|
|
Interest expense (income) from discontinued operations
|
|
|
19
|
|
|
(1)
|
|
|
—
|
|
NM
|
|
NM
|
|
Income tax expense from continuing operations
|
|
|
61
|
|
|
108
|
|
|
59
|
|
(44)%
|
|
83%
|
|
Income tax expense (benefit) from discontinued operations
|
|
|
67
|
|
|
(24)
|
|
|
(16)
|
|
NM
|
|
50%
|
|
Depreciation and amortization of continuing operations
|
|
|
311
|
|
|
306
|
|
|
286
|
|
2%
|
|
7%
|
|
Depreciation and amortization of discontinued operations
|
|
|
68
|
|
|
114
|
|
|
101
|
|
(40)%
|
|
13%
|
|
Other adjustments:
|
|
|
|
|
|
|
|
|
|
|
|
|
|
|
Business acquisition and integration expenses
|
|
|
19
|
|
|
12
|
|
|
9
|
|
|
|
|
|
Merger costs
|
|
|
28
|
|
|
—
|
|
|
—
|
|
|
|
|
|
EBITDA from discontinued operations
|
|
|
(309)
|
|
|
(76)
|
|
|
223
|
|
|
|
|
|
Minority interest of discontinued operations
|
|
|
49
|
|
|
11
|
|
|
7
|
|
|
|
|
|
Loss on early extinguishment of debt
|
|
|
54
|
|
|
3
|
|
|
31
|
|
|
|
|
|
Certain legal settlements and related (income) expenses
|
|
|
(11)
|
|
|
1
|
|
|
1
|
|
|
|
|
|
(Gain) loss on sale of assets
|
|
|
(9)
|
|
|
(97)
|
|
|
1
|
|
|
|
|
|
Amortization of pension and postretirement actuarial losses
|
|
|
76
|
|
|
58
|
|
|
68
|
|
|
|
|
|
Plant incident remediation costs
|
|
|
16
|
|
|
—
|
|
|
—
|
|
|
|
|
|
U.S. Tax Reform Act impact on minority interest
|
|
|
(6)
|
|
|
—
|
|
|
—
|
|
|
|
|
|
Restructuring, impairment and plant closing and transition costs(4)
|
|
|
20
|
|
|
48
|
|
|
87
|
|
|
|
|
|
Adjusted EBITDA(1)
|
|
$
|
1,263
|
|
$
|
1,001
|
|
$
|
1,165
|
|
26%
|
|
(14)%
|
|
|
|
|
|
|
|
|
|
|
|
|
|
|
|
|
Net cash provided by operating activities from continuing operations
|
|
$
|
836
|
|
$
|
968
|
|
$
|
614
|
|
(14)%
|
|
58%
|
|
Net cash used in investing activities from continuing operations
|
|
|
(279)
|
|
|
(112)
|
|
|
(403)
|
|
149%
|
|
(72)%
|
|
Net cash used in financing activities
|
|
|
(495)
|
|
|
(721)
|
|
|
(408)
|
|
(31)%
|
|
77%
|
|
Capital expenditures from continuing operations
|
|
|
(282)
|
|
|
(318)
|
|
|
(461)
|
|
(11)%
|
|
(31)%
|
Huntsman Corporation
|
|
|
|
|
|
|
|
|
|
|
|
|
|
|
|
|
|
|
|
|
|
|
|
|
|
|
|
|
|
|
|
Year ended
|
|
Year ended
|
|
Year ended
|
|
|
|
December 31, 2017
|
|
December 31, 2016
|
|
December 31, 2015
|
|
|
|
Gross
|
|
Tax and other(3)
|
|
Net
|
|
Gross
|
|
Tax and other(3)
|
|
Net
|
|
Gross
|
|
Tax and other(3)
|
|
Net
|
|
Reconciliation of net income to adjusted net income
|
|
|
|
|
|
|
|
|
|
|
|
|
|
|
|
|
|
|
|
|
|
|
|
|
|
|
|
|
Net income
|
|
|
|
|
|
|
|
$
|
741
|
|
|
|
|
|
|
|
$
|
357
|
|
|
|
|
|
|
|
$
|
126
|
|
Net income attributable to noncontrolling interests
|
|
|
|
|
|
|
|
|
(105)
|
|
|
|
|
|
|
|
|
(31)
|
|
|
|
|
|
|
|
|
(33)
|
|
Business acquisition and integration expenses
|
|
$
|
19
|
|
$
|
(5)
|
|
|
14
|
|
$
|
12
|
|
$
|
(3)
|
|
|
9
|
|
$
|
9
|
|
$
|
(2)
|
|
|
7
|
|
Merger costs
|
|
|
28
|
|
|
(10)
|
|
|
18
|
|
|
—
|
|
|
—
|
|
|
—
|
|
|
—
|
|
|
—
|
|
|
—
|
|
(Income) loss from discontinued operations(7)
|
|
|
(312)
|
|
|
154
|
|
|
(158)
|
|
|
(81)
|
|
|
89
|
|
|
8
|
|
|
217
|
|
|
85
|
|
|
302
|
|
Minority interest of discontinued operations
|
|
|
49
|
|
|
—
|
|
|
49
|
|
|
11
|
|
|
—
|
|
|
11
|
|
|
7
|
|
|
—
|
|
|
7
|
|
Loss on early extinguishment of debt
|
|
|
54
|
|
|
(19)
|
|
|
35
|
|
|
3
|
|
|
(1)
|
|
|
2
|
|
|
31
|
|
|
(11)
|
|
|
20
|
|
Certain legal settlements and related (income) expenses
|
|
|
(11)
|
|
|
4
|
|
|
(7)
|
|
|
1
|
|
|
—
|
|
|
1
|
|
|
1
|
|
|
—
|
|
|
1
|
|
(Gain) loss on sale of assets
|
|
|
(9)
|
|
|
—
|
|
|
(9)
|
|
|
(97)
|
|
|
13
|
|
|
(84)
|
|
|
1
|
|
|
—
|
|
|
1
|
|
Amortization of pension and postretirement actuarial losses
|
|
|
73
|
|
|
(16)
|
|
|
57
|
|
|
55
|
|
|
(12)
|
|
|
43
|
|
|
66
|
|
|
(18)
|
|
|
48
|
|
Plant incident remediation costs
|
|
|
16
|
|
|
(6)
|
|
|
10
|
|
|
—
|
|
|
—
|
|
|
—
|
|
|
—
|
|
|
—
|
|
|
—
|
|
U.S. Tax Reform Act impact on income tax expense
|
|
|
—
|
|
|
(52)
|
|
|
(52)
|
|
|
—
|
|
|
—
|
|
|
—
|
|
|
—
|
|
|
—
|
|
|
—
|
|
U.S. Tax Reform Act impact on minority interest
|
|
|
(6)
|
|
|
—
|
|
|
(6)
|
|
|
—
|
|
|
—
|
|
|
—
|
|
|
—
|
|
|
—
|
|
|
—
|
|
Restructuring, impairment and plant closing and transition costs(4)
|
|
|
20
|
|
|
(3)
|
|
|
17
|
|
|
48
|
|
|
(12)
|
|
|
36
|
|
|
87
|
|
|
(17)
|
|
|
70
|
|
Adjusted net income(2)
|
|
|
|
|
|
|
|
$
|
604
|
|
|
|
|
|
|
|
$
|
352
|
|
|
|
|
|
|
|
$
|
549
|
|
|
|
|
|
|
|
|
|
|
|
|
|
|
|
|
|
|
|
|
|
|
|
|
|
|
|
|
|
|
Weighted average shares-basic
|
|
|
|
|
|
|
|
|
238.4
|
|
|
|
|
|
|
|
|
236.3
|
|
|
|
|
|
|
|
|
242.8
|
|
Weighted average shares-diluted
|
|
|
|
|
|
|
|
|
243.9
|
|
|
|
|
|
|
|
|
239.6
|
|
|
|
|
|
|
|
|
245.4
|
|
|
|
|
|
|
|
|
|
|
|
|
|
|
|
|
|
|
|
|
|
|
|
|
|
|
|
|
|
|
Basic net income attributable to Huntsman Corporation per share:
|
|
|
|
|
|
|
|
|
|
|
|
|
|
|
|
|
|
|
|
|
|
|
|
|
|
|
|
|
Income from continuing operations
|
|
|
|
|
|
|
|
$
|
2.01
|
|
|
|
|
|
|
|
$
|
1.41
|
|
|
|
|
|
|
|
$
|
1.63
|
|
Income (loss) from discontinued operations
|
|
|
|
|
|
|
|
|
0.66
|
|
|
|
|
|
|
|
|
(0.03)
|
|
|
|
|
|
|
|
|
(1.25)
|
|
Net income
|
|
|
|
|
|
|
|
$
|
2.67
|
|
|
|
|
|
|
|
$
|
1.38
|
|
|
|
|
|
|
|
$
|
0.38
|
|
|
|
|
|
|
|
|
|
|
|
|
|
|
|
|
|
|
|
|
|
|
|
|
|
|
|
|
|
|
Diluted net income attributable to Huntsman Corporation per share:
|
|
|
|
|
|
|
|
|
|
|
|
|
|
|
|
|
|
|
|
|
|
|
|
|
|
|
|
|
Income from continuing operations
|
|
|
|
|
|
|
|
$
|
1.96
|
|
|
|
|
|
|
|
$
|
1.39
|
|
|
|
|
|
|
|
$
|
1.61
|
|
Income (loss) from discontinued operations
|
|
|
|
|
|
|
|
|
0.65
|
|
|
|
|
|
|
|
|
(0.03)
|
|
|
|
|
|
|
|
|
(1.23)
|
|
Net income
|
|
|
|
|
|
|
|
$
|
2.61
|
|
|
|
|
|
|
|
$
|
1.36
|
|
|
|
|
|
|
|
$
|
0.38
|
|
|
|
|
|
|
|
|
|
|
|
|
|
|
|
|
|
|
|
|
|
|
|
|
|
|
|
|
|
|
Other non-GAAP measures:
|
|
|
|
|
|
|
|
|
|
|
|
|
|
|
|
|
|
|
|
|
|
|
|
|
|
|
|
|
Adjusted net income per share(2):
|
|
|
|
|
|
|
|
|
|
|
|
|
|
|
|
|
|
|
|
|
|
|
|
|
|
|
|
|
Basic
|
|
|
|
|
|
|
|
$
|
2.53
|
|
|
|
|
|
|
|
$
|
1.49
|
|
|
|
|
|
|
|
$
|
2.26
|
|
Diluted
|
|
|
|
|
|
|
|
|
2.48
|
|
|
|
|
|
|
|
|
1.47
|
|
|
|
|
|
|
|
|
2.24
|
|
|
|
|
|
|
|
|
|
|
|
|
|
|
|
|
|
|
|
|
|
|
|
|
|
|
|
|
|
|
Capital expenditures, net of reimbursements(5)
|
|
|
|
|
|
|
|
$
|
(279)
|
|
|
|
|
|
|
|
$
|
(286)
|
|
|
|
|
|
|
|
$
|
(446)
|
|
|
|
|
|
|
|
|
|
|
|
|
|
|
|
|
|
|
|
|
|
|
|
|
|
|
|
|
|
|
Net cash provided by operating activities from continuing operations
|
|
|
|
|
|
|
|
$
|
842
|
|
|
|
|
|
|
|
$
|
974
|
|
|
|
|
|
|
|
$
|
614
|
|
Capital expenditures
|
|
|
|
|
|
|
|
|
(282)
|
|
|
|
|
|
|
|
|
(318)
|
|
|
|
|
|
|
|
|
(461)
|
|
All other investing activities from continuing operations, excluding acquisitions and disposition activities
|
|
|
|
|
|
|
|
|
6
|
|
|
|
|
|
|
|
|
—
|
|
|
|
|
|
|
|
|
52
|
|
Non-recurring merger costs
|
|
|
|
|
|
|
|
|
28
|
|
|
|
|
|
|
|
|
—
|
|
|
|
|
|
|
|
|
—
|
|
Free cash flow(6)
|
|
|
|
|
|
|
|
$
|
594
|
|
|
|
|
|
|
|
$
|
656
|
|
|
|
|
|
|
|
$
|
205
|
|
|
|
|
|
|
|
|
|
|
|
|
|
|
|
|
|
|
|
|
|
|
|
|
|
|
|
|
|
Huntsman International
|
|
|
|
|
|
|
|
|
|
|
|
|
|
|
|
|
|
|
|
|
|
|
|
|
|
|
|
|
|
|
|
Year ended
|
|
Year ended
|
|
Year ended
|
|
|
|
December 31, 2017
|
|
December 31, 2016
|
|
December 31, 2015
|
|
|
|
Gross
|
|
Tax and other(3)
|
|
Net
|
|
Gross
|
|
Tax and other(3)
|
|
Net
|
|
Gross
|
|
Tax and other(3)
|
|
Net
|
|
Reconciliation of net income to adjusted net income
|
|
|
|
|
|
|
|
|
|
|
|
|
|
|
|
|
|
|
|
|
|
|
|
|
|
|
|
|
Net income
|
|
|
|
|
|
|
|
$
|
734
|
|
|
|
|
|
|
|
$
|
354
|
|
|
|
|
|
|
|
$
|
127
|
|
Net income attributable to noncontrolling interests
|
|
|
|
|
|
|
|
|
(105)
|
|
|
|
|
|
|
|
|
(31)
|
|
|
|
|
|
|
|
|
(33)
|
|
Business acquisition and integration expenses
|
|
$
|
19
|
|
$
|
(5)
|
|
|
14
|
|
$
|
12
|
|
$
|
(3)
|
|
|
9
|
|
$
|
9
|
|
$
|
(2)
|
|
|
7
|
|
Merger costs
|
|
|
28
|
|
|
(10)
|
|
|
18
|
|
|
—
|
|
|
—
|
|
|
—
|
|
|
—
|
|
|
—
|
|
|
—
|
|
(Income) loss from discontinued operations(7)
|
|
|
(309)
|
|
|
154
|
|
|
(155)
|
|
|
(76)
|
|
|
89
|
|
|
13
|
|
|
223
|
|
|
85
|
|
|
308
|
|
Minority interest of discontinued operations
|
|
|
49
|
|
|
—
|
|
|
49
|
|
|
11
|
|
|
—
|
|
|
11
|
|
|
7
|
|
|
—
|
|
|
7
|
|
Loss on early extinguishment of debt
|
|
|
54
|
|
|
(19)
|
|
|
35
|
|
|
3
|
|
|
(1)
|
|
|
2
|
|
|
31
|
|
|
(11)
|
|
|
20
|
|
Certain legal settlements and related (income) expenses
|
|
|
(11)
|
|
|
4
|
|
|
(7)
|
|
|
1
|
|
|
—
|
|
|
1
|
|
|
1
|
|
|
—
|
|
|
1
|
|
(Gain) loss on sale of assets
|
|
|
(9)
|
|
|
—
|
|
|
(9)
|
|
|
(97)
|
|
|
13
|
|
|
(84)
|
|
|
1
|
|
|
—
|
|
|
1
|
|
Amortization of pension and postretirement actuarial losses
|
|
|
76
|
|
|
(16)
|
|
|
60
|
|
|
58
|
|
|
(12)
|
|
|
46
|
|
|
68
|
|
|
(18)
|
|
|
50
|
|
Plant incident remediation costs
|
|
|
16
|
|
|
(4)
|
|
|
12
|
|
|
—
|
|
|
—
|
|
|
—
|
|
|
—
|
|
|
—
|
|
|
—
|
|
U.S. Tax Reform Act impact on income tax expense
|
|
|
—
|
|
|
(53)
|
|
|
(53)
|
|
|
—
|
|
|
—
|
|
|
—
|
|
|
—
|
|
|
—
|
|
|
—
|
|
U.S. Tax Reform Act impact on minority interest
|
|
|
(6)
|
|
|
—
|
|
|
(6)
|
|
|
—
|
|
|
—
|
|
|
—
|
|
|
—
|
|
|
—
|
|
|
—
|
|
Restructuring, impairment and plant closing and transition costs(4)
|
|
|
20
|
|
|
(3)
|
|
|
17
|
|
|
48
|
|
|
(12)
|
|
|
36
|
|
|
87
|
|
|
(17)
|
|
|
70
|
|
Adjusted net income(2)
|
|
|
|
|
|
|
|
$
|
604
|
|
|
|
|
|
|
|
$
|
357
|
|
|
|
|
|
|
|
$
|
558
|
|
Other non-GAAP measures:
|
|
|
|
|
|
|
|
|
|
|
|
|
|
|
|
|
|
|
|
|
|
|
|
|
|
|
|
|
Capital expenditures, net of reimbursements(5)
|
|
|
|
|
|
|
|
$
|
(279)
|
|
|
|
|
|
|
|
$
|
(286)
|
|
|
|
|
|
|
|
$
|
(446)
|
NM—Not meaningful
|
(1)
| |
Our management uses adjusted EBITDA to assess financial performance. Adjusted EBITDA is defined as net income of Huntsman Corporation or Huntsman International, as appropriate, before interest, income tax, depreciation and amortization, net income attributable to noncontrolling interests and certain Corporate and other items, as well as eliminating the following adjustments: (a) business acquisition and integration expenses; (b) merger costs; (c) EBITDA from discontinued operations; (d) minority interest of discontinued operations; (e) loss on early extinguishment of debt; (f) certain legal settlements and related (income) expenses; (g) (gain) loss on sale of assets; (h) amortization of pension and postretirement actuarial losses; (i) plant incident remediation costs; (j) U.S. Tax Reform Act impact on minority interest; and (k) restructuring, impairment and plant closing and transition costs. We believe that net income of Huntsman Corporation or Huntsman International, as appropriate, is the performance measure calculated and presented in accordance with U.S. GAAP that is most directly comparable to adjusted EBITDA. |
We believe adjusted EBITDA is useful to investors in assessing the businesses’ ongoing financial performance and provides improved comparability between periods through the exclusion of certain items that management believes are not indicative of the businesses’ operational profitability and that may obscure underlying business results and trends. However, this measure should not be considered in isolation or viewed as a substitute for net income of Huntsman Corporation or Huntsman International, as appropriate, or other measures of performance determined in accordance with U.S. GAAP. Moreover, adjusted EBITDA as used herein is not necessarily comparable to other similarly titled measures of other companies due to potential inconsistencies in the methods of calculation. Our management believes this measure is useful to compare general operating performance from period to period and to make certain related management decisions. Adjusted EBITDA is also used by securities analysts, lenders and others in their evaluation of different companies because it excludes certain items that can vary widely across different industries or among companies within the same industry. For example, interest expense can be highly dependent on a company’s capital structure, debt levels and credit ratings. Therefore, the impact of interest expense on earnings can vary significantly among companies. In addition, the tax positions of companies can vary because of their differing abilities to take advantage of tax benefits and because of the tax policies of the various jurisdictions in which they operate. As a result, effective tax rates and tax expense can vary considerably among companies. Finally, companies employ productive assets of different ages and utilize different methods of acquiring and depreciating such assets. This can result in considerable variability in the relative costs of productive assets and the depreciation and amortization expense among companies.
Nevertheless, our management recognizes that there are material limitations associated with the use of adjusted EBITDA in the evaluation of our Company as compared to net income of Huntsman Corporation or Huntsman
International, as appropriate, which reflects overall financial performance. For example, we have borrowed money in order to finance our operations and interest expense is a necessary element of our costs and ability to generate revenue. Our management compensates for the limitations of using adjusted EBITDA by using this measure to supplement U.S. GAAP results to provide a more complete understanding of the factors and trends affecting the business rather than U.S. GAAP results alone.
In addition to the limitations noted above, adjusted EBITDA excludes items that may be recurring in nature and should not be disregarded in the evaluation of performance. However, we believe it is useful to exclude such items to provide a supplemental analysis of current results and trends compared to other periods because certain excluded items can vary significantly depending on specific underlying transactions or events, and the variability of such items may not relate specifically to ongoing operating results or trends and certain excluded items, while potentially recurring in future periods, may not be indicative of future results. For example, while EBITDA from discontinued operations is a recurring item, it is not indicative of ongoing operating results and trends or future results.
|
(2)
| |
Adjusted net income is computed by eliminating the after‑tax amounts related to the following from net income attributable to Huntsman Corporation or Huntsman International, as appropriate: (a) business acquisition and integration expenses; (b) merger costs; (c) (gain) loss from discontinued operations; (d) minority interest of discontinued operations; (e) loss on early extinguishment of debt; (f) certain legal settlements and related (income) expenses; (g) (gain) loss on sale of assets; (h) amortization of pension and postretirement actuarial losses; (i) plant incident remediation costs; (j) U.S. Tax Reform Act impact on income tax expense; (k) U.S. Tax Reform Act impact on minority interest; and (l) restructuring, impairment and plant closing and transition costs. Basic adjusted net income per share excludes dilution and is computed by dividing adjusted net income by the weighted average number of shares outstanding during the period. Adjusted diluted net income per share reflects all potential dilutive common shares outstanding during the period and is computed by dividing adjusted net income by the weighted average number of shares outstanding during the period increased by the number of additional shares that would have been outstanding as dilutive securities. Adjusted net income and adjusted net income per share amounts are presented solely as supplemental information. |
|
(3)
| |
The income tax impacts, if any, of each adjusting item represent a ratable allocation of the total difference between the unadjusted tax expense and the total adjusted tax expense, computed without consideration of any adjusting items using a with and without approach. We do not adjust for changes in tax valuation allowances because we do not believe it provides more meaningful information than is provided under GAAP. |
|
(4)
| |
Includes costs associated with transition activities relating to the migration of our information system data centers and the transition of our Textile Effects segment’s production from Basel, Switzerland to a tolling facility. These transition costs were included in either selling, general and administrative expenses or cost of sales on our consolidated statements of operations. |
|
(5)
| |
Capital expenditures, net of reimbursements, represent cash paid for capital expenditures less payments received as reimbursements from customers and joint venture partners. During 2017, 2016 and 2015, capital expenditures of $282 million, $318 million and $461 million, respectively, were reimbursed in part by $3 million, $32 million and $15 million, respectively. |
|
(6)
| |
Management internally uses a free cash flow measure: (a) to evaluate the Company’s liquidity, (b) to evaluate strategic investments, (c) to plan stock buyback and dividend levels, and (d) to evaluate the Company’s ability to incur and service debt. Free cash flow is not a defined term under U.S. GAAP, and it should not be inferred that the entire free cash flow amount is available for discretionary expenditures. The Company defines free cash flow as cash flows provided by operating activities and used in investing activities, excluding acquisition and disposition activities. Free cash flow is typically derived directly from the Company’s consolidated statement of cash flows; however, it may be adjusted for items that affect comparability between periods. |
|
(7)
| |
In addition to income tax impacts, this adjusting item is also impacted by depreciation and amortization expense and interest expense. |
Year Ended December 31, 2017 Compared with Year Ended December 31, 2016
As discussed in “Note 3. Discontinued Operations and Business Dispositions—Separation of P&A Business” to our consolidated financial statements, the results from continuing operations for all periods presented exclude the results of the former P&A Business and the results of our former polymers, base chemicals and Australian styrenics business.
The increase of $310 million in net income attributable to Huntsman Corporation and the increase of $306 million in net income attributable to Huntsman International was the result of the following items:
|
·
| |
Revenues for the year ended December 31, 2017 increased by $840 million, or 11%, as compared with the 2016 period. The increase was primarily due to higher average selling prices in all our segments, except for our Textile Effects segment, and higher sales volumes in our Textile Effects segment. See “—Segment Analysis” below. |
|
·
| |
Our gross profit and the gross profit of Huntsman International for the year ended December 31, 2017 increased by $286 million and $285 million, respectively, or 19% each, as compared with the 2016 period. The increase resulted from higher gross margins in our Polyurethanes and Textile Effects segments. See “—Segment Analysis” below. |
|
·
| |
Our operating expenses and the operating expenses of Huntsman International for the year ended December 31, 2017 increased by $31 million and $30 million, respectively, or 3% each, as compared with the 2016 period, primarily related to an increase in selling, general and administrative expenses in 2017. |
|
·
| |
Restructuring, impairment and plant closing costs for the year ended December 31, 2017 decreased to $20 million from $47 million in the 2016 period. For more information concerning restructuring activities, see “Note 11. Restructuring, Impairment and Plant Closing Costs” to our consolidated financial statements. |
|
·
| |
Merger costs for the year ended December 31, 2017 were $28 million as compared to nil in the 2016 period. During 2017, we incurred $28 million in merger-related costs in connection with the terminated merger between Huntsman and Clariant. For more information concerning the merger activities, see “Note 1. General—Recent Developments—Termination of Huntsman and Clariant Merger Agreement” to our consolidated financial statements. |
|
·
| |
Other operating income, net for the year ended December 31, 2017 decreased by $78 million, or 77%, as compared with the 2016 period, primarily related to a gain on the sale of our European surfactants business in the fourth quarter of 2016. For more information concerning the sale of our European surfactants business, see “Note 3. Discontinued Operations and Business Dispositions—Sale of European Surfactants Manufacturing Facilities” to our consolidated financial statements. |
|
·
| |
Our interest expense and the interest expense of Huntsman International for the year ended December 31, 2017 decreased by $38 million and $34 million, respectively, or 19% and 16%, respectively, as compared with the 2016 period, primarily related to the early repayments in 2017 on our 2015 Extended Term Loan B, our 2021 Term Loan B and our 2023 Term Loan B. We no longer have any senior secured term loans outstanding under our Senior Credit Facilities. For more information, see “Note 13. Debt—Direct and Subsidiary Debt—Senior Credit Facilities” to our consolidated financial statements. |
|
·
| |
Loss on early extinguishment of debt for the year ended December 31, 2017 increased to $54 million from $3 million in the 2016 period. During 2017, we recorded a loss on early extinguishment of debt of $49 million related to the early repayments on our 2015 Extended Term Loan B, our 2021 Term Loan B and our 2023 Term Loan B. |
|
·
| |
Our income tax expense for the year ended December 31, 2017 decreased to $64 million from $109 million in the 2016 period, primarily due to the impact of the U.S. Tax Reform Act, which resulted in a net $52 million benefit—$137 million benefit is related to the corporate rate reduction, net of $85 million expense related to transition tax. The income tax expense of Huntsman International for the year ended December 31, 2017 decreased to $61 million from $108 million in the 2016 period, primarily due to the impact of the U.S. Tax Reform Act, which resulted in a net $53 million benefit—$138 million benefit is related to the corporate rate reduction, net of $85 million expense related to transition tax. Our tax expense is significantly affected by the mix of income and losses in the tax jurisdictions in which we operate, as impacted by the presence of valuation allowances in certain tax jurisdictions. For further information concerning taxes, see “Note 17. Income Taxes” to our consolidated financial statements. |
|
·
| |
Beginning in the third quarter of 2017, we reported the results of operations of the former P&A Business as discontinued operations. See “Note 3. Discontinued Operations and Business Dispositions—Separation of P&A Business” to our consolidated financial statements. In addition to the former P&A Business, the results of operations of our former polymers, base chemicals and Australian businesses are reported as discontinued operations for all periods presented. Our income from discontinued operations, net of tax for the year ended December 31, 2017 increased to $158 million from a loss of $8 million in the 2016 period. |
Income from discontinued operations, net of tax of Huntsman International for the year ended December 31, 2017 increased to $155 million from a loss of $13 million in the 2016 period. The increase was primarily due to Venator’s improved margins primarly as a result from higher average selling prices and higher sales volumes in titanium dioxide, offset in part by higher business separation expenses. |
Segment Analysis
Year Ended December 31, 2017 Compared to Year Ended December 31, 2016
|
|
|
|
|
|
|
|
|
|
|
|
|
|
|
|
|
Percent
|
|
|
|
|
|
|
|
|
Change
|
|
|
Year ended December 31,
|
|
Favorable
|
|
|
2017
|
|
2016
|
|
(Unfavorable)
|
|
Revenues
|
|
|
|
|
|
|
|
|
Polyurethanes
|
$
|
4,399
|
|
$
|
3,667
|
|
20%
|
|
Performance Products
|
|
2,109
|
|
|
2,126
|
|
(1)%
|
|
Advanced Materials
|
|
1,040
|
|
|
1,020
|
|
2%
|
|
Textile Effects
|
|
776
|
|
|
751
|
|
3%
|
|
Corporate and eliminations
|
|
34
|
|
|
(46)
|
|
NM
|
|
Total
|
$
|
8,358
|
|
$
|
7,518
|
|
11%
|
|
|
|
|
|
|
|
|
|
|
Huntsman Corporation
|
|
|
|
|
|
|
|
|
Segment adjusted EBITDA(1)
|
|
|
|
|
|
|
|
|
Polyurethanes
|
$
|
850
|
|
$
|
569
|
|
49%
|
|
Performance Products
|
|
296
|
|
|
316
|
|
(6)%
|
|
Advanced Materials
|
|
219
|
|
|
223
|
|
(2)%
|
|
Textile Effects
|
|
83
|
|
|
73
|
|
14%
|
|
Corporate and other
|
|
(189)
|
|
|
(184)
|
|
(3)%
|
|
Total
|
$
|
1,259
|
|
$
|
997
|
|
26%
|
|
|
|
|
|
|
|
|
|
|
Huntsman International
|
|
|
|
|
|
|
|
|
Segment adjusted EBITDA(1)
|
|
|
|
|
|
|
|
|
Polyurethanes
|
$
|
850
|
|
$
|
569
|
|
49%
|
|
Performance Products
|
|
296
|
|
|
316
|
|
(6)%
|
|
Advanced Materials
|
|
219
|
|
|
223
|
|
(2)%
|
|
Textile Effects
|
|
83
|
|
|
73
|
|
14%
|
|
Corporate and other
|
|
(185)
|
|
|
(180)
|
|
(3)%
|
|
Total
|
$
|
1,263
|
|
$
|
1,001
|
|
26%
|
|
|
NM—Not meaningful
|
|
|
|
(1) For more information, including reconciliation of segment adjusted EBITDA to net income of Huntsman Corporation or Huntsman International, as appropriate, see “Note 24. Operating Segment Information” to our consolidated financial statements.
|
|
|
|
|
|
|
|
|
|
|
|
|
|
Year ended December 31, 2017 vs 2016
|
|
|
|
Average Selling Price(1)
|
|
|
|
|
|
|
|
Local
|
|
Foreign Currency
|
|
Mix &
|
|
Sales
|
|
|
|
Currency
|
|
Translation Impact
|
|
Other
|
|
Volumes(2)
|
|
Period-Over-Period Increase (Decrease)
|
|
|
|
|
|
|
|
|
|
Polyurethanes
|
|
18%
|
|
1%
|
|
3%
|
|
(2)%
|
|
Performance Products
|
|
7%
|
|
—
|
|
3%
|
|
(11)%
|
|
Advanced Materials
|
|
1%
|
|
1%
|
|
—
|
|
—
|
|
Textile Effects
|
|
(2)%
|
|
—
|
|
(2)%
|
|
7%
|
|
Total Company
|
|
12%
|
|
—
|
|
4%
|
|
(5)%
|
|
|
|
|
|
|
|
|
|
|
|
|
|
|
|
|
|
Fourth Quarter 2017 vs Third Quarter 2017
|
|
|
|
Average Selling Price(1)
|
|
|
|
|
|
|
|
Local
|
|
Foreign Currency
|
|
Mix &
|
|
Sales
|
|
|
|
Currency
|
|
Translation Impact
|
|
Other
|
|
Volumes(2)
|
|
Period-Over-Period Increase (Decrease)
|
|
|
|
|
|
|
|
|
|
Polyurethanes
|
|
5%
|
|
—
|
|
1%
|
|
(3)%
|
|
Performance Products
|
|
—
|
|
—
|
|
3%
|
|
—
|
|
Advanced Materials
|
|
2%
|
|
—
|
|
(1)%
|
|
(3)%
|
|
Textile Effects
|
|
—
|
|
—
|
|
—
|
|
(2)%
|
|
Total Company
|
|
3%
|
|
—
|
|
2%
|
|
(3)%
|
|
(1)
| |
Excludes revenues from tolling arrangements, byproducts and raw materials. |
|
(2)
| |
Excludes sales volumes of byproducts and raw materials. |
Polyurethanes
The increase in revenues in our Polyurethanes segment for 2017 compared to 2016 was primarily due to higher average selling prices, partially offset by lower MTBE sales volumes. MDI average selling prices increased in response to higher raw material costs and continued strong market conditions. MTBE average selling prices increased primarily as a result of higher pricing for high octane gasoline. MDI sales volumes increased due to increased demand across most major markets. MTBE sales volumes decreased due to the impact of maintenance and hurricane related production outages during the second and third quarters of 2017. The increase in segment adjusted EBITDA was primarily due to higher MDI margins, partially offset by lower MTBE margins.
Performance Products
The decrease in revenues in our Performance Products segment for 2017 compared to 2016 was due to lower sales volumes principally because of the sale of the European surfactants business to Innospec Inc. on December 30, 2016, partially offset by higher sales volumes in our remaining businesses as well as higher average selling prices. Average selling prices increased primarily in response to higher raw material costs and favorable product mix effect partially from the sale of the European surfactants business. The decrease in segment adjusted EBITDA was primarily due to the sale of the European surfactants business to Innospec Inc. in 2016 and weather related outages offset by higher sales volumes in our remaining businesses and lower fixed costs.
Advanced Materials
The increase in revenues in our Advanced Materials segment for 2017 compared to 2016 was primarily due to higher average selling prices. Average selling prices increased in response to higher raw material costs. Sales volumes remained relatively unchanged as growth in our higher value specialty markets was offset by reduced volumes as we withdrew from certain low margin businesses. The decrease in segment adjusted EBITDA was due to lower margins resulting from higher raw material costs and higher fixed costs.
Textile Effects
The increase in revenues in our Textile Effects segment for 2017 compared to 2016 was due to higher sales volumes, partially offset by lower average selling prices. Sales volumes increased in both textile chemicals and dyes, particularly in our Asia region. Average selling prices decreased primarily due to competitive market conditions. The increase in segment adjusted EBITDA was primarily due to higher sales volumes and lower selling, general and administrative costs.
Corporate and other
Corporate and other includes unallocated corporate overhead, unallocated foreign currency exchange gains and losses, LIFO inventory valuation reserve adjustments, loss on early extinguishment of debt, unallocated restructuring, impairment and plant closing costs, nonoperating income and expense, benzene sales and gains and losses on the disposition of corporate assets. For 2017, adjusted EBITDA from Corporate and other for Huntsman Corporation decreased by $5 million to a loss of $189 million from a loss of $184 million for 2016. For 2017, adjusted EBITDA from Corporate and other for Huntsman International decreased by $5 million to a loss of $185 million from a loss of $180 million for 2016. The decrease in adjusted EBITDA from Corporate and other resulted primarily from an increase
in unallocated corporate overhead and an increase in losses from benzene sales, partially offset by a decrease in LIFO inventory valuation expense.
Year Ended December 31, 2016 Compared with Year Ended December 31, 2015
As discussed in “Note 3. Discontinued Operations and Business Dispositions—Separation of P&A Business” to our consolidated financial statements, the results from continuing operations for all periods presented exclude the results of the former P&A Business and the results of our former polymers, base chemicals and Australian styrenics business. The increase of $233 million in net income attributable to Huntsman Corporation and the increase of $229 million in net income attributable to Huntsman International was the result of the following items:
|
·
| |
Revenues for the year ended December 31, 2016 decreased by $621 million, or 8%, as compared with the 2015 period. The decrease was due principally to lower average selling prices in all our segments and lower sales volumes in our Performance Products and Advanced Materials segments. See “—Segment Analysis” below. |
|
·
| |
Our gross profit and the gross profit of Huntsman International for the year ended December 31, 2016 decreased by $208 million each, or 12% each, as compared with the 2015 period. The decrease resulted from lower gross margins in our Polyurethanes, Performance Products and Advanced Materials segments. See “—Segment Analysis” below. |
|
·
| |
Our operating expenses and the operating expenses of Huntsman International decreased by $29 million and $28 million, respectively, or 3% each, for the year ended December 31, 2016 as compared with the 2015 period, primarily related to a decrease in selling, general and administrative expenses in 2016. |
|
·
| |
Restructuring, impairment and plant closing costs for the year ended December 31, 2016 decreased to $47 million from $83 million in the 2015 period. For more information concerning restructuring activities, see “Note 11. Restructuring, Impairment and Plant Closing Costs” to our consolidated financial statements. |
|
·
| |
Our other operating income, net and other operating income, net of Huntsman International increased by $101 million and $102 million, respectively, for the year ended December 31, 2016 as compared with the 2015 period, primarily related to a gain on the sale of our European surfactants business in the fourth quarter of 2016. For more information concerning the sale of our European surfactants business, see “Note 3. Business Combinations and Dispositions—Sale of European Surfactants Manufacturing Facilities” to our consolidated financial statements. |
|
·
| |
Loss on early extinguishment of debt for the year ended December 31, 2016 decreased to $3 million from $31 million in the 2015 period. During 2016, we recorded a loss on early extinguishment of debt of $3 million primarily related to the repayment of our term loan B facilities due 2017 and our term loan C facility due 2016 as well as voluntary repayments on our 2015 Extended Term Loan B. During 2015, we recorded a loss on early extinguishment of debt of $30 million primarily related to the redemption of our 8.625% senior subordinated notes due 2021 (“2021 Senior Subordinated Notes”). |
|
·
| |
Our income tax expense for the year ended December 31, 2016 increased to $109 million from $60 million in 2015 period. The income tax expense of Huntsman International for the year ended December 31, 2016 increased to $108 million from $59 million in the 2015 period. Our tax expense is significantly affected by the mix of income and losses in the tax jurisdictions in which we operate, as impacted by the presence of valuation allowances in certain tax jurisdictions. For further information concerning taxes, see “Note 17. Income Taxes” to our consolidated financial statements. |
|
·
| |
Beginning in the third quarter of 2017, we reported the results of operations of the former P&A Business as discontinued operations. See “Note 3. Discontinued Operations and Business Dispositions—Separation of P&A Business” to our consolidated financial statements. In addition to the former P&A Business, the results of operations of our former polymers, base chemicals and Australian businesses are reported as discontinued operations for all periods presented. Our loss from discontinued operations, net of tax for the year ended December 31, 2016 decreased to $8 million from a loss of $302 million in the 2015 period. Loss from discontinued operations, net of tax of Huntsman International for the year ended December 31, 2016 decreased to $13 million from a loss of $307 million in the 2015 period. The decrease was primarily due to Venator’s improved margins resulting from restructuring savings. |
Segment Analysis
Year Ended December 31, 2016 Compared to Year Ended December 31, 2015
|
|
|
|
|
|
|
|
|
|
|
|
|
Percent
|
|
|
|
|
Change
|
|
|
Year ended December 31,
|
|
Favorable
|
|
|
2016
|
|
2015
|
|
(Unfavorable)
|
|
Revenues
|
|
|
|
|
|
|
|
|
Polyurethanes
|
$
|
3,667
|
|
$
|
3,811
|
|
(4)%
|
|
Performance Products
|
|
2,126
|
|
|
2,501
|
|
(15)%
|
|
Advanced Materials
|
|
1,020
|
|
|
1,103
|
|
(8)%
|
|
Textile Effects
|
|
751
|
|
|
804
|
|
(7)%
|
|
Corporate and eliminations
|
|
(46)
|
|
|
(80)
|
|
NM
|
|
Total
|
$
|
7,518
|
|
$
|
8,139
|
|
(8)%
|
|
|
|
|
|
|
|
|
|
|
Huntsman Corporation
|
|
|
|
|
|
|
|
|
Segment adjusted EBITDA(1)
|
|
|
|
|
|
|
|
|
Polyurethanes
|
$
|
569
|
|
$
|
573
|
|
(1)%
|
|
Performance Products
|
|
316
|
|
|
460
|
|
(31)%
|
|
Advanced Materials
|
|
223
|
|
|
220
|
|
1%
|
|
Textile Effects
|
|
73
|
|
|
63
|
|
16%
|
|
Corporate and other
|
|
(184)
|
|
|
(156)
|
|
(18)%
|
|
Total
|
$
|
997
|
|
$
|
1,160
|
|
(14)%
|
|
|
|
|
|
|
|
|
|
|
Huntsman International
|
|
|
|
|
|
|
|
|
Segment adjusted EBITDA(1)
|
|
|
|
|
|
|
|
|
Polyurethanes
|
$
|
569
|
|
$
|
573
|
|
(1)%
|
|
Performance Products
|
|
316
|
|
|
460
|
|
(31)%
|
|
Advanced Materials
|
|
223
|
|
|
220
|
|
1%
|
|
Textile Effects
|
|
73
|
|
|
63
|
|
16%
|
|
Corporate and other
|
|
(180)
|
|
|
(151)
|
|
(19)%
|
|
Total
|
$
|
1,001
|
|
$
|
1,165
|
|
(14)%
|
NM—Not meaningful
|
(1)
| |
For more information, including reconciliation of segment adjusted EBITDA to net income of Huntsman Corporation or Huntsman International, as appropriate, see “Note 24. Operating Segment Information” to our consolidated financial statements. |
|
|
|
|
|
|
|
|
|
|
|
|
|
Year ended December 31, 2016 vs 2015
|
|
|
|
Average Selling Price(1)
|
|
|
|
|
|
|
|
Local
|
|
Foreign Currency
|
|
Mix &
|
|
Sales
|
|
|
|
Currency
|
|
Translation Impact
|
|
Other
|
|
Volumes(2)
|
|
Period-Over-Period Increase (Decrease)
|
|
|
|
|
|
|
|
|
|
Polyurethanes
|
|
(9)%
|
|
(1)%
|
|
(5)%
|
|
11%
|
|
Performance Products
|
|
(8)%
|
|
(1)%
|
|
(4)%
|
|
(2)%
|
|
Advanced Materials
|
|
(2)%
|
|
(2)%
|
|
3%
|
|
(7)%
|
|
Textile Effects
|
|
(6)%
|
|
(3)%
|
|
(1)%
|
|
3%
|
|
Total Company
|
|
(7)%
|
|
(1)%
|
|
(3)%
|
|
5%
|
|
(1)
| |
Excludes revenues from tolling arrangements, byproducts and raw materials. |
|
(2)
| |
Excludes sales volumes of byproducts and raw materials. |
Polyurethanes
The decrease in revenues in our Polyurethanes segment for 2016 compared to 2015 was primarily due to lower average selling prices, partially offset by higher sales volumes. MDI average selling prices decreased in response to lower raw material costs. MTBE average selling prices decreased primarily as a result of lower pricing for high octane
gasoline. MDI sales volumes increased due to higher demand in the Americas and European regions. PO/MTBE sales volumes increased primarily due to the impact of the prior year planned maintenance outage. The decrease in segment adjusted EBITDA was primarily due to lower MTBE margins, partially offset by higher MDI margins and sales volumes and the prior year planned PO/MTBE maintenance outage of approximately $90 million.
Performance Products
The decrease in revenues in our Performance Products segment for 2016 compared to 2015 was primarily due to lower average selling prices and lower sales volumes. Average selling prices decreased primarily in response to lower raw material costs and competitive market conditions. Sales volumes decreased primarily due to competitive market conditions, softer demand in China and oilfield applications as well as the impact of weather related and other production outages. The decrease in segment adjusted EBITDA was primarily due to lower sales volumes, lower margins in our amines, maleic anhydride and upstream intermediates businesses as well as the impact of weather related and other production outages estimated at approximately $15 million.
Advanced Materials
The decrease in revenues in our Advanced Materials segment for 2016 compared to 2015 was due to lower sales volumes and lower average selling prices. Sales volumes decreased primarily in the Americas region, due to competitive pressure and soft demand. Average selling prices decreased in our Asia Pacific and European regions primarily due to price concessions in our electrical, electronic and wind markets and the foreign currency exchange impact of a stronger U.S. dollar against major international currencies. The increase in segment adjusted EBITDA was primarily due to lower fixed costs, partially offset by lower margins as savings from lower raw material costs were offset by lower sales volumes and lower selling prices.
Textile Effects
The decrease in revenues in our Textile Effects segment for 2016 compared to 2015 was due to lower average selling prices, partially offset by higher sales volumes. Average selling prices decreased primarily due to lower raw material costs and the foreign currency exchange impact of a stronger U.S. dollar against major international currencies. Sales volumes increased in key target countries, mainly in South Asia. The increase in segment adjusted EBITDA was primarily due to higher margins from lower raw material costs and lower selling, general and administrative costs.
Corporate and other
Corporate and other includes unallocated corporate overhead, unallocated foreign exchange gains and losses, LIFO inventory valuation reserve adjustments, loss on early extinguishment of debt, unallocated restructuring, impairment and plant closing costs, nonoperating income and expense, benzene sales and gains and losses on the disposition of corporate assets. For 2016, adjusted EBITDA from Corporate and other for Huntsman Corporation decreased by $28 million to a loss of $184 million from a loss of $156 million for the same period in 2015. For 2016, adjusted EBITDA from Corporate and other for Huntsman International decreased by $29 million to a loss of $180 million from a loss of $151 million for the same period in 2015. The decrease in adjusted EBITDA from Corporate and other resulted primarily from an increase in LIFO inventory valuation expense, partially offset by an increase in gains from benzene sales.
Liquidity and Capital Resources
The following is a discussion of our liquidity and capital resources and generally does not include separate information with respect to Huntsman International in accordance with General Instruction I of Form 10‑K.
Cash Flows for Year Ended December 31, 2017 Compared to the Year Ended December 31, 2016
Net cash provided by operating activities from continuing operations for 2017 and 2016 was $842 million and $974 million, respectively. The decrease in net cash provided by operating activities during 2017 compared with 2016 was primarily attributable to an unfavorable variance of $424 million in operating assets and liabilities in 2017, offset in part by increased operating income as described in “—Results of Operations” above.
Net cash used in investing activities from continuing operations for 2017 and 2016 was $265 million and $119 million, respectively. During 2017 and 2016, we paid $282 million and $318 million, respectively, for capital expenditures. We paid $14 million and nil for the acquisition of a business during the year ended December 31, 2017 and 2016, respectively. During 2017 and 2016 we received proceeds from the sale of businesses and assets of $25 million
and $199 million, respectively, including proceeds of $199 million from the sale of our European surfactants business during 2016. For further information, see “Note 3. Discontinued Operations and Business Dispositions—Sale of European Surfactants Manufacturing Facilities” to our consolidated financial statements. During the year ended December 31, 2017 and 2016, we received $7 million and nil, respectively, from the termination of cross-currency interest rate contracts.
Net cash used in financing activities for 2017 and 2016 was $519 million and $723 million, respectively. The decrease in net cash used in financing activities was primarily due to proceeds from the IPO and secondary offering of our former P&A Business, offset in part by an increase in net repayments of our revolving loan facility and net repayments of long‑term debt during 2017 as compared with 2016.
Free cash flow from continuing operations for 2017 and 2016 were cash proceeds of $594 million and $656 million, respectively. The decrease in free cash flow was attributable to the changes in cash flows from operating and investing activities, excluding merger and acquisition activities.
Cash Flows for Year Ended December 31, 2016 Compared to the Year Ended December 31, 2015
Net cash provided by operating activities from continuing operations for 2016 and 2015 was $974 million and $614 million, respectively. The increase in net cash provided by operating activities during 2016 compared with 2015 was primarily attributable to higher net income for 2015 as described in “—Results of Operations” above and a $522 million favorable variance in operating assets and liabilities for 2016 as compared with 2015.
Net cash used in investing activities from continuing operations for 2016 and 2015 was $119 million and $404 million, respectively. During 2016 and 2015, we paid $318 million and $461 million, respectively, for capital expenditures. During 2016 and 2015 we received proceeds from the sale of businesses and assets of $199 million and $1 million, respectively, including proceeds of $199 million from the sale of our European surfactants business during 2016. For further information, see “Note 3. Discontinued Operations and Business Dispositions—Sale of European Surfactants Manufacturing Facilities” to our consolidated financial statements. During 2016 and 2015, we made investments in our BASF Huntsman Shanghai Isocyanate Investment B.V. joint venture of nil and $12 million, respectively. During 2016 and 2015, we received nil and $66 million, respectively, from the termination of cross‑currency interest rate contracts.
Net cash used in financing activities for 2016 and 2015 was $723 million and $562 million, respectively. The increase in net cash used in financing activities was primarily due to an increase in repayments of long‑term debt, partially offset by an increase in proceeds from the issuance of long‑term debt during the 2016 period as compared to the 2015 period. On April 1, 2016, we entered into our 2016 term loan B facility due 2023 (“2016 Term Loan B”) in an aggregate principal amount of $550 million. Additionally, on April 1, 2016, we used the net proceeds of the 2016 Term Loan B to repay in full our extended term loan B due 2017, extended term loan B—series 2 due 2017 and our Term Loan C. On both July 22, 2016 and September 30, 2016, we prepaid $100 million of our 2015 Extended Term Loan B. On December 30, 2016, we made an early repayment of $260 million on our 2015 Extended Term Loan B using proceeds from the sale of our European surfactants business and existing cash. On March 31, 2015, we issued €300 million (approximately $326 million) aggregate principal amount of our 4.25% senior notes due April 1, 2025 (“2025 Senior Notes”). On April 17, 2015, we used the net proceeds of this offering to redeem $289 million ($294 million carrying value) of our 2021 Senior Subordinated Notes and redeemed the remaining $195 million ($198 million carrying value) of our 2021 Senior Subordinated Notes during the third quarter of 2015. During 2015, we repurchased $100 million of our common stock.
Free cash flow from continuing operations for 2016 and 2015 were cash proceeds of $656 million and $205 million, respectively. The increase in free cash flow was attributable to the changes in cash flows from operating and investing activities, excluding merger and acquisition activities.
Changes in Financial Condition
The following information summarizes our working capital (dollars in millions):
|
|
|
|
|
|
|
|
|
|
|
|
|
|
|
|
December 31,
|
|
December 31,
|
|
Increase
|
|
Percent
|
|
|
|
2017
|
|
2016
|
|
(Decrease)
|
|
Change
|
|
Cash and cash equivalents
|
|
$
|
470
|
|
$
|
385
|
|
$
|
85
|
|
22%
|
|
Restricted cash
|
|
|
11
|
|
|
11
|
|
|
—
|
|
—
|
|
Accounts and notes receivable, net
|
|
|
1,283
|
|
|
1,183
|
|
|
100
|
|
8%
|
|
Inventories
|
|
|
1,073
|
|
|
918
|
|
|
155
|
|
17%
|
|
Prepaid expenses
|
|
|
60
|
|
|
49
|
|
|
11
|
|
22%
|
|
Other current assets
|
|
|
202
|
|
|
232
|
|
|
(30)
|
|
(13)%
|
|
Current assets held for sale(1)
|
|
|
2,880
|
|
|
777
|
|
|
2,103
|
|
271%
|
|
Total current assets
|
|
|
5,979
|
|
|
3,555
|
|
|
2,424
|
|
68%
|
|
Accounts payable
|
|
|
964
|
|
|
790
|
|
|
174
|
|
22%
|
|
Accrued liabilities
|
|
|
569
|
|
|
471
|
|
|
98
|
|
21%
|
|
Current portion of debt
|
|
|
40
|
|
|
50
|
|
|
(10)
|
|
(20)%
|
|
Current liabilities held for sale(1)
|
|
|
1,692
|
|
|
467
|
|
|
1,225
|
|
262%
|
|
Total current liabilities
|
|
|
3,265
|
|
|
1,778
|
|
|
1,487
|
|
84%
|
|
Working capital
|
|
$
|
2,714
|
|
$
|
1,777
|
|
$
|
937
|
|
53%
|
|
(1)
| |
The assets and liabilities held for sale are classified as current as of December 31, 2017 because it is probable that the sale of our remaining ownership interest in Venator ordinary shares will occur and proceeds will be collected within one year. |
Our working capital increased by $937 million as a result of the net impact of the following significant changes:
|
·
| |
The increase in cash and cash equivalents of $85 million resulted from the matters identified on our consolidated statements of cash flows. |
|
·
| |
Accounts and notes receivable increased by $100 million mainly due to higher revenues in the three months ended December 31, 2017 compared to the three months ended December 31, 2016. |
|
·
| |
Inventories increased by $155 million primarily due to higher inventory volumes and higher raw material costs. |
|
·
| |
Accounts payable increased by $174 million primarily due to higher purchases consistent with the higher inventory balances. |
|
·
| |
Accrued liabilities increased by $98 million primarily due to an increase in income taxes payable, accrued taxes other than income and accrued payroll. |
Direct and Subsidiary Debt
See “Note 13. Debt—Direct and Subsidiary Debt” to our consolidated financial statements.
Debt Issuance Costs
See “Note 13. Debt—Direct and Subsidiary Debt—Debt Issuance Costs” to our consolidated financial statements.
Senior Credit Facilities
See “Note 13. Debt—Direct and Subsidiary Debt—Senior Credit Facilities” to our consolidated financial statements.
Seventeenth Amendment to Credit Agreement
See “Note 13. Debt—Direct and Subsidiary Debt—Seventeenth Amendment to Credit Agreement” to our consolidated financial statements.
A/R Programs
See “Note 13. Debt—Direct and Subsidiary Debt—A/R Programs” to our consolidated financial statements.
Notes
See “Note 13. Debt—Direct and Subsidiary Debt—Notes” to our consolidated financial statements.
Redemption of Notes and Loss on Early Extinguishment of Debt
See “Note 13. Debt—Direct and Subsidiary Debt—Redemption of Notes and Loss on Early Extinguishment of Debt” to our consolidated financial statements.
Variable Interest Entity Debt
See “Note 13. Debt—Direct and Subsidiary Debt—Variable Interest Entity Debt” to our consolidated financial statements.
Other Debt
See “Note 13. Debt—Direct and Subsidiary Debt—Other Debt” to our consolidated financial statements.
Note Payable from Huntsman International to Huntsman Corporation
See “Note 13. Debt—Direct and Subsidiary Debt—Note Payable from Huntsman International to Huntsman Corporation” to our consolidated financial statements.
Compliance With Covenants
See “Note 13. Debt—Direct and Subsidiary Debt—Compliance with Covenants” to our consolidated financial statements.
Maturities
See “Note 13. Debt—Direct and Subsidiary Debt—Maturities” to our consolidated financial statements.
Short‑Term and Long‑Term Liquidity
We depend upon our cash, Senior Credit Facilities, U.S. accounts receivable securitization program (“U.S. A/R Program”), European accounts receivable securitization program (“EU A/R Program” and collectively with the U.S. A/R Program, “A/R Programs”) and other debt instruments to provide liquidity for our operations and working capital needs. As of December 31, 2017, we had $1,247 million of combined cash and unused borrowing capacity, consisting of $481 million in cash and restricted cash, $641 million in availability under our revolving facility (“Revolving Facility”), and $125 million in availability under our A/R Programs. Our liquidity can be significantly impacted by various factors. The following matters had, or are expected to have, a significant impact on our liquidity:
|
·
| |
Cash invested in our accounts receivable and inventory, net of accounts payable, increased by approximately $133 million for 2017, as reflected in our consolidated statements of cash flows. We expect volatility in our working capital components to continue. |
|
·
| |
During 2018, we expect to spend approximately $325 million on capital expenditures. Our future expenditures include certain EHS maintenance and upgrades, periodic maintenance and repairs applicable to major units of manufacturing facilities and cost reduction and expansion projects. We expect to fund this spending with cash provided by operations. |
|
·
| |
During 2017, we made contributions to our pension and postretirement benefit plans related to continuing operations of $103 million. During 2018, we expect to contribute approximately $96 million to these plans. |
|
·
| |
We are involved in a number of cost reduction programs for which we have established restructuring accruals. As of December 31, 2017, we had $53 million of accrued restructuring costs from continuing operations, of which $15 million is classified as current. For further discussion of these plans and the costs involved, see “Note 11. Restructuring, Impairment and Plant Closing Costs” to our consolidated financial statements. |
|
·
| |
The payment of dividends is a business decision made by our Board of Directors from time to time based on our earnings, financial position and prospects, and such other considerations as our Board of Directors considers relevant. Historically, our Board of Directors has declared quarterly cash dividends of $0.125 per share of common stock. On February 7, 2018, the Board of Directors approved an increase to the quarterly cash dividend to $0.1625 per share of common stock beginning with the March 30, 2018 quarterly dividend. While management currently expects that the Company will continue to pay the quarterly cash dividend, its dividend practice may change at any time. |
|
·
| |
On February 7, 2018, our Board of Directors authorized our Company to repurchase up to $400 million in shares of our common stock in addition to the $50 million remaining under our September 2015 share repurchase authorization. Repurchases may be made through the open market or in privately negotiated transactions, and repurchases may be commenced or suspended from time to time without prior notice. Shares of common stock acquired through the repurchase program are held in treasury at cost. |
|
·
| |
On October 27, 2017, we announced the mutual termination of the Merger Agreement with Clariant. For the the year ended December 31, 2017, we incurred $28 million of merger related costs. For more information regarding the merger, see “Note 1. General—Recent Developments—Termination of Huntsman and Clariant Merger Agreement” to our consolidated financial statements. |
|
·
| |
During 2017, we received a cash benefit of approximately $90 million related to overpayments of prior year tax payments. |
|
·
| |
In August 2017, we separated the P&A Business and conducted an IPO of ordinary shares of Venator, formerly a wholly-owned subsidiary of Huntsman. Additionally, in December 2017, we conducted a secondary offering of Venator ordinary shares. All of such ordinary shares were sold by Huntsman and Venator did not receive any proceeds from the offerings. In connection with these offerings, we received net proceeds of $954 million. For more information, see “Note 3. Discontinued Operations and Business Dispositions—Separation of P&A Business” to our consolidated financial statements. In addition, in connection with the separation and IPO of Venator, we received net proceeds of $732 million from Venator in connection with their debt offering and repayment of intercompany debt obligations to Huntsman. See “Note 13. Debt—Direct and Subsidiary Debt—Senior Credit Facilities” to our consolidated financial statements. |
With available free cash flow, the net proceeds from the sale of our investment in the P&A business and cash from the repayment of related intercompany indebtedness as described above, we repaid $2.1 billion of debt during the full year 2017 and believe we achieved investment grade-type leverage metrics at year end. See “Note 13. Debt—Direct and Subsidiary Debt —Senior Credit Facilities” to our consolidated financial statements. We seek to achieve investment grade ratings on our debt from the rating agencies, although we cannot provide any assurances of such status.
|
·
| |
As of December 31, 2017, we retained approximately 55% ownership in Venator. On January 3, 2018, the underwriters purchased an additional 1,948,955 Venator ordinary shares pursuant to their over-allotment option, which reduced our ownership interest in Venator to approximately 53%. We are planning to monetize our remaining investment in Venator and expect to use the net proceeds to return value to stockholders and for other corporate purposes. |
As of December 31, 2017, we had $40 million classified as current portion of debt, including debt at our variable interest entities of $21 million, and certain other short‑term facilities and scheduled amortization payments totaling $19 million. Although we cannot provide assurances, we intend to renew, repay or extend the majority of these short‑term facilities in the next twelve months.
As of December 31, 2017, we had approximately $402 million of cash and cash equivalents, including restricted cash, held by our foreign subsidiaries, including our variable interest entities. Additionally, we have intercompany debt obligations owed to us by our non‑U.S. subsidiaries. We intend to use cash held in our foreign subsidiaries to fund our local operations. Nevertheless, we could repatriate cash as dividends or as repayments of intercompany debt, and the repatriation of cash as a dividend or repayment of intercompany debt would generally not be subject to U.S. taxation as a result of the U.S. Tax Reform Act, but may potentially be subject to limited foreign taxes. Cash held by certain foreign subsidiaries, including our variable interest entities, may be subject to changing monetary policies of governments and legal restrictions, including those arising from the interests of our partners, which could limit the amounts available for repatriation.
Venator is commissioning a new production facility in Augusta, Georgia for the synthesis of iron oxide pigments, which was purchased from Rockwood. During commissioning, the facility has experienced delays producing products at the expected specifications and quantities, raising questions regarding the capabilities of the Augusta technology. Based on the facility’s performance during the commissioning process, it was concluded that production capacity at Venator’s Augusta facility will be substantially lower than originally anticipated. On February 6, 2017, Huntsman filed a lawsuit against Rockwood, Albemarle Corporation (as Rockwood’s successor) and certain former Rockwood executives to recover damage for fraud and breach of contract involving the Augusta technology. Venator is not party to the suit.
Contractual Obligations and Commercial Commitments
Our obligations under long‑term debt (including the current portion), lease agreements and other contractual commitments as of December 31, 2017 are summarized below (dollars in millions):
|
|
|
|
|
|
|
|
|
|
|
|
|
|
|
|
|
|
|
|
2018
|
|
2019 - 2020
|
|
2021 - 2022
|
|
After 2022
|
|
Total
|
|
Long-term debt, including current portion
|
|
$
|
40
|
|
$
|
892
|
|
$
|
969
|
|
$
|
397
|
|
$
|
2,298
|
|
Interest(1)
|
|
|
107
|
|
|
205
|
|
|
78
|
|
|
21
|
|
|
411
|
|
Operating leases(2)
|
|
|
74
|
|
|
127
|
|
|
103
|
|
|
134
|
|
|
438
|
|
Purchase commitments(3)
|
|
|
1,299
|
|
|
1,986
|
|
|
994
|
|
|
2,087
|
|
|
6,366
|
|
Total(4)(5)
|
|
$
|
1,520
|
|
$
|
3,210
|
|
$
|
2,144
|
|
$
|
2,639
|
|
$
|
9,513
|
|
|
(1) Interest calculated using interest rates as of December 31, 2017 and contractual maturity dates assuming no refinancing or extension of debt instruments.
|
|
|
|
(2) Future minimum lease payments have not been reduced by minimum sublease rentals of $2 million due in the future under noncancelable subleases.
|
|
|
|
(3) We have various purchase commitments extending through 2039 for materials, supplies and services entered into in the ordinary course of business. Included in the purchase commitments table above are contracts which require minimum volume purchases that extend beyond one year or are renewable annually and have been renewed for 2017. Certain contracts allow for changes in minimum required purchase volumes in the event of a temporary or permanent shutdown of a facility. To the extent the contract requires a minimum notice period, such notice period has been included in the above table. The contractual purchase price for substantially all of these contracts is variable based upon market prices, subject to annual negotiations. We have estimated our contractual obligations by using the terms of our current pricing for each contract. We also have a limited number of contracts which require a minimum payment even if no volume is purchased. We believe that all of our purchase obligations will be utilized in our normal operations. For the years ended December 31, 2017, 2016 and 2015, we made minimum payments of nil, $1 million and nil, respectively, under such take or pay contracts without taking the product.
|
|
|
|
(4) Totals do not include commitments pertaining to our pension and other postretirement obligations. Our estimated future contributions to our pension and postretirement plans related to continuing operations are as follows (dollars in millions):
|
|
|
|
|
|
|
|
|
|
|
|
|
|
|
|
|
|
|
|
|
|
|
|
|
|
|
5-Year
|
|
|
|
|
|
|
|
|
|
|
|
|
Average
|
|
|
|
2018
|
|
2019 - 2020
|
|
2021 - 2022
|
|
Annual
|
|
Pension plans
|
|
$
|
89
|
|
$
|
161
|
|
$
|
163
|
|
$
|
71
|
|
Other postretirement obligations
|
|
|
7
|
|
|
13
|
|
|
13
|
|
|
6
|
|
(5) The above table does not reflect expected tax payments and unrecognized tax benefits due to the inability to make reasonably reliable estimates of the timing and amount of payments. For additional discussion on unrecognized tax benefits, see “Note 17. Income Taxes” to our consolidated financial statements.
|
Off‑Balance Sheet Arrangements
No off‑balance sheet arrangements exist.
Restructuring, Impairment and Plant Closing Costs
For a discussion of restructuring plans and the costs involved, see “Note 11. Restructuring, Impairment and Plant Closing Costs” to our consolidated financial statements.
Legal Proceedings
For a discussion of legal proceedings, see “Note 18. Commitments and Contingencies—Legal Matters” to our consolidated financial statements.
Environmental, Health and Safety Matters
As noted above in “Part I. Item 1. Business—Environmental, Health and Safety Matters” and “Part I. Item 1A. Risk Factors,” we are subject to extensive environmental regulations, which may impose significant additional costs on our operations in the future. While we do not expect any of these enactments or proposals to have a material adverse effect on us in the near term, we cannot predict the longer‑term effect of any of these regulations or proposals on our future financial condition. For a discussion of environmental, health and safety matters, see “Note 19. Environmental, Health and Safety Matters” to our consolidated financial statements.
Recently Issued Accounting Pronouncements
For a discussion of recently issued accounting pronouncements, see “Note 2. Summary of Significant Accounting Policies—Recently Issued Accounting Pronouncements” to our consolidated financial statements.
Critical Accounting Policies
The preparation of financial statements and related disclosures in conformity with U.S. GAAP requires management to make judgments, estimates and assumptions that affect the reported amounts in our consolidated financial statements. Our significant accounting policies are summarized in “Note 2. Summary of Significant Accounting Policies” to our consolidated financial statements. Summarized below are our critical accounting policies:
Income Taxes
We use the asset and liability method of accounting for income taxes. Deferred income taxes reflect the net tax effects of temporary differences between the carrying amounts of assets and liabilities for financial and tax reporting purposes. We evaluate deferred tax assets to determine whether it is more likely than not that they will be realized. Valuation allowances are reviewed on a tax jurisdiction basis to analyze whether there is sufficient positive or negative evidence to support a change in judgment about the realizability of the related deferred tax assets for each jurisdiction. These conclusions require significant judgment. In evaluating the objective evidence that historical results provide, we consider the cyclicality of businesses and cumulative income or losses during the applicable period. Cumulative losses incurred over the period limits our ability to consider other subjective evidence such as our projections for the future. Changes in expected future income in applicable jurisdictions could affect the realization of deferred tax assets in those jurisdictions. As of December 31, 2017, we had total valuation allowances of $424 million. See “Note 17. Income Taxes” to our consolidated financial statements for more information regarding our valuation allowances.
On December 22, 2017, the U.S. Tax Reform Act was signed into law. The U.S. Tax Reform Act significantly revised the U.S. corporate income tax regime by, among other things, lowering the U.S. corporate tax rate from 35% to 21%, effective January 1, 2018, repealing the deduction for domestic production activities and imposing a repatriation tax on deemed repatriated earnings of foreign subsidiaries.
As a result of the U.S. Tax Reform Act, the Company recorded a provisional tax benefit of $137 million due to a remeasurement of deferred U.S. tax assets and liabilities and a provisional tax expense of $85 million due to the transition tax on deemed repatriation of deferred foreign income. Absent the Venator offering and certain tax related restructuring transactions, our provisional transition tax liability on deemed repatriation of deferred foreign income would have been $12 million.
Both the tax benefit and the tax charge represent provisional amounts and our current best estimates. Any adjustments recorded to the provisional amounts through calendar year 2018 will be included in income as an adjustment to tax expense in the period of the adjustment. The provisional amounts incorporate assumptions made based upon
available information and our current interpretation of the U.S. Tax Reform Act and may change as we receive additional implementation guidance and as we further refine our calculations with additional information.
Accounting for uncertainty in income taxes prescribes a recognition threshold and measurement attribute for the financial statement recognition and measurement of a tax position taken or expected to be taken in a tax return. The application of income tax law is inherently complex. We are required to determine if an income tax position meets the criteria of more‑likely‑than‑not to be realized based on the merits of the position under tax law, in order to recognize an income tax benefit. This requires us to make significant judgments regarding the merits of income tax positions and the application of income tax law. Additionally, if a tax position meets the recognition criteria of more‑likely‑than‑not we are required to make judgments and apply assumptions in order to measure the amount of the tax benefits to recognize. These judgments are based on the probability of the amount of tax benefits that would be realized if the tax position was challenged by the taxing authorities. Interpretations and guidance surrounding income tax laws and regulations change over time. As a consequence, changes in assumptions and judgments can materially affect amounts recognized in our consolidated financial statements. We have not determined the need for, or change in, any unrecognized tax positions due to the U.S. Tax Reform Act. For further information concerning taxes, see “Note 17. Income Taxes” to our consolidated financial statements.
Employee Benefit Programs
We sponsor several contributory and non‑contributory defined benefit plans, covering employees primarily in the U.S., the U.K., The Netherlands, Belgium and Switzerland, but also covering employees in a number of other countries. We fund the material plans through trust arrangements (or local equivalents) where the assets are held separately from us. We also sponsor unfunded postretirement plans which provide medical and, in some cases, life insurance benefits covering certain employees in the U.S. and Canada. Amounts recorded in our consolidated financial statements are recorded based upon actuarial valuations performed by various independent actuaries. Inherent in these valuations are numerous assumptions regarding expected long‑term rates of return on plan assets, discount rates, compensation increases, mortality rates and health care cost trends. These assumptions are described in “Note 16. Employee Benefit Plans” to our consolidated financial statements.
Management, with the advice of actuaries, uses judgment to make assumptions on which our employee pension and postretirement benefit plan obligations and expenses are based. The effect of a 1% change in three key assumptions is summarized as follows (dollars in millions):
|
|
|
|
|
|
|
|
|
|
|
Statement of
|
|
Balance Sheet
|
|
Assumptions
|
|
Operations(1)
|
|
Impact(2)
|
|
Discount rate
|
|
|
|
|
|
|
|
—1% increase
|
|
$
|
(10)
|
|
$
|
(470)
|
|
—1% decrease
|
|
|
12
|
|
|
557
|
|
Expected long-term rates of return on plan assets
|
|
|
|
|
|
|
|
—1% increase
|
|
|
(23)
|
|
|
—
|
|
—1% decrease
|
|
|
23
|
|
|
—
|
|
Rate of compensation increase
|
|
|
|
|
|
|
|
—1% increase
|
|
|
8
|
|
|
98
|
|
—1% decrease
|
|
|
(8)
|
|
|
(93)
|
|
|
(1) Estimated increase (decrease) on 2017 net periodic benefit cost
|
|
|
|
(2) Estimated increase (decrease) on December 31, 2017 pension and postretirement liabilities and accumulated other comprehensive loss
|
Contingent Loss Accruals
Environmental remediation costs for our facilities are accrued when it is probable that a liability has been incurred and the amount can be reasonably estimated. Estimates of environmental reserves require evaluating government regulation, available technology, site‑specific information and remediation alternatives. We accrue an amount equal to our best estimate of the costs to remediate based upon the available information. The extent of environmental impacts may not be fully known and the processes and costs of remediation may change as new information is obtained or technology for remediation is improved. Our process for estimating the expected cost for remediation considers the information available, technology that can be utilized and estimates of the extent of environmental damage. Adjustments to our estimates are made periodically based upon additional information received
as remediation progresses. For further information, see “Note 19. Environmental, Health and Safety Matters” to our consolidated financial statements.
We are subject to legal proceedings and claims arising out of our business operations. We routinely assess the likelihood of any adverse outcomes to these matters, as well as ranges of probable losses. A determination of the amount of the reserves required, if any, for these contingencies is made after analysis of each known claim. We have an active risk management program consisting of numerous insurance policies secured from many carriers. These policies often provide coverage that is intended to minimize the financial impact, if any, of the legal proceedings. The required reserves may change in the future due to new developments in each matter. For further information, see “Note 18. Commitments and Contingencies—Legal Matters” to our consolidated financial statements.
Restructuring and Plant Closing Costs
We have recorded restructuring charges in recent periods in connection with closing certain plant locations, workforce reductions and other cost savings programs in each of our business segments. These charges are recorded when management has committed to a plan and incurred a liability related to the plan. Estimates for plant closing costs include the write‑off of the carrying value of the plant, any necessary environmental and/or regulatory costs, contract termination and demolition costs. Estimates for workforce reductions and other costs savings are recorded based upon estimates of the number of positions to be terminated, termination benefits to be provided and other information, as necessary. Management evaluates the estimates on a quarterly basis and will adjust the reserve when information indicates that the estimate is above or below the currently recorded estimate. For further discussion of our restructuring activities, see “Note 11. Restructuring, Impairment and Plant Closing Costs” to our consolidated financial statements.
Goodwill
We test our goodwill for impairment at least annually (at the beginning of the third quarter) and when events and circumstances change that would more likely than not reduce the fair value of a reporting unit below its carrying amount. Goodwill has been assigned to reporting units for purposes of impairment testing. Approximately 59% of our goodwill balance relates to our Advanced Materials reporting unit. The remaining goodwill relates to three other reporting units.
Fair value is estimated using the market approach, as well as the income approach based on discounted cash flow projections. The estimated fair values of our reporting units are dependent on several significant assumptions including, among others, market information, discount rates operating results, earnings projections and anticipated future cash flows.
We tested goodwill for impairment at the beginning of the third quarter of 2017 as part of the annual impairment testing procedures and determined that no goodwill impairment existed. Our most recent fair value determination resulted in an amount that exceeded the carrying amounts of all reporting units by a significant margin.
Long‑Lived Assets
The useful lives of our property, plant and equipment are estimated based upon our historical experience, engineering estimates and industry information and are reviewed when economic events indicate that we may not be able to recover the carrying value of the assets. The estimated lives of our property range from 3 to 50 years and depreciation is recorded on the straight‑line method. Inherent in our estimates of useful lives is the assumption that periodic maintenance and an appropriate level of annual capital expenditures will be performed. Without on‑going capital improvements and maintenance, the productivity and cost efficiency declines and the useful lives of our assets would be shorter.
Management uses judgment to estimate the useful lives of our long‑lived assets. At December 31, 2017, if the estimated useful lives of our property, plant and equipment had either been one year greater or one year less than their recorded lives, then depreciation expense for 2017 would have been approximately $35 million less or $41 million greater, respectively.
We are required to evaluate the carrying value of our long‑lived tangible and intangible assets whenever events indicate that such carrying value may not be recoverable in the future or when management’s plans change regarding those assets, such as idling or closing a plant. We evaluate impairment by comparing undiscounted cash flows of the related asset groups that are largely independent of the cash flows of other asset groups to their carrying values. Key assumptions in determining the future cash flows include the useful life, technology, competitive pressures, raw material pricing and regulations. In connection with our asset evaluation policy, we reviewed all of our long‑lived assets for indicators that the carrying value may not be recoverable.
ITEM 7A. QUANTITATIVE AND QUALITATIVE DISCLOSURES ABOUT MARKET RISK
We are exposed to market risks, such as changes in interest rates, foreign exchange rates and commodity prices. From time to time, we enter into transactions, including transactions involving derivative instruments, to manage certain of these exposures. We also hedge our net investment in certain European operations. Changes in the fair value of the hedge in the net investment of certain European operations are recorded in accumulated other comprehensive loss.
Interest Rate Risks
Through our borrowing activities, we are exposed to interest rate risk. Such risk arises due to the structure of our debt portfolio, including the mix of fixed and floating interest rates. Actions taken to reduce interest rate risk include managing the mix and rate characteristics of various interest bearing liabilities, as well as entering into interest rate derivative instruments.
From time to time, we may purchase interest rate swaps and/or other derivative instruments to reduce the impact of changes in interest rates on our floating-rate long-term debt. Under interest rate swaps, we agree with other parties to exchange, at specified intervals, the difference between fixed-rate and floating-rate interest amounts calculated by reference to an agreed notional principal amount.
Huntsman International had entered into several interest rate contracts to hedge the variability caused by monthly changes in cash flow due to associated changes in LIBOR under our Senior Credit Facilities. These swaps were designated as cash flow hedges and the effective portion of the changes in the fair value of the swaps were recorded in other comprehensive income (loss). These swaps expired in April 2017.
Beginning in 2009, AAC entered into a 12-year floating to fixed interest rate contract providing for a receipt of LIBOR interest payments for a fixed payment of 5.02%. In connection with the consolidation of AAC as of July 1, 2010, the interest rate contract is now included in our consolidated results. See “Note 7. Variable Interest Entities” to our consolidated financial statements. The notional amount of the swap as of December 31, 2017 was $14 million, and the interest rate contract is not designated as a cash flow hedge. As of both December 31, 2017 and 2016, the fair value of the swap was $1 million, and was recorded as other noncurrent liabilities on our consolidated balance sheets. For 2017 and 2016, we recorded a reduction of interest expense of nil each due to changes in fair value of the swap.
During 2017, accumulated other comprehensive loss of nil was reclassified to earnings. The actual amount that will be reclassified to earnings over the next twelve months may vary from this amount due to changing market conditions. We would be exposed to credit losses in the event of nonperformance by a counterparty to our derivative financial instruments. We anticipate, however, that the counterparties will be able to fully satisfy their obligations under the contracts. Market risk arises from changes in interest rates.
Foreign Exchange Rate Risk
Our cash flows and earnings are subject to fluctuations due to exchange rate variation. Our revenues and expenses are denominated in various currencies. We enter into foreign currency derivative instruments to minimize the short-term impact of movements in foreign currency rates. Where practicable, we generally net multicurrency cash balances among our subsidiaries to help reduce exposure to foreign currency exchange rates. Certain other exposures may be managed from time to time through financial market transactions, principally through the purchase of spot or forward foreign exchange contracts (generally with maturities of three months or less). We do not hedge our currency exposures in a manner that would eliminate the effect of changes in exchange rates on our cash flows and earnings. As of December 31, 2017 and 2016, we had approximately $93 million and $176 million, respectively, notional amount (in U.S. dollar equivalents) outstanding in foreign currency contracts with a term of approximately one month, of which nil and $88 million, respectively, were on behalf of our former P&A Business.
In November 2014, we entered into two five year cross-currency interest rate contracts and one eight year cross-currency interest rate contract to swap an aggregate notional $200 million for an aggregate notional €161 million. The swap was designated as a hedge of net investment for financial reporting purposes. In August 2017, we terminated these cross-currency interest rate contracts and received $7 million from the counterparties.
In March 2010, we entered into three five year cross-currency interest rate contracts to swap an aggregate notional $350 million for an aggregate notional €255 million. This swap was designated as a hedge of net investment for financial reporting purposes. During the three months ended March 31, 2015, we terminated these cross-currency interest rate contracts and received $66 million in payments from the counterparties.
A portion of our debt is denominated in euros. We also finance certain of our non-U.S. subsidiaries with intercompany loans that are, in many cases, denominated in currencies other than the entities’ functional currency. We manage the net foreign currency exposure created by this debt through various means, including cross-currency swaps, the designation of certain intercompany loans as permanent loans because they are not expected to be repaid in the foreseeable future and the designation of certain debt and swaps as net investment hedges.
Foreign currency transaction gains and losses on intercompany loans that are not designated as permanent loans are recorded in earnings. Foreign currency transaction gains and losses on intercompany loans that are designated as permanent loans are recorded in other comprehensive income (loss). From time to time, we review such designation of intercompany loans.
We review our non‑U.S. dollar denominated debt and derivative instruments to determine the appropriate amounts designated as hedges. As of December 31, 2017, for our continuing operations, we have designated approximately €470 million (approximately $559 million) of euro‑denominated debt and cross‑currency interest rate contracts as a hedge of our net investment. For the years ended December 31, 2017, 2016 and 2015, for our continuing operations, the amounts recognized on the hedge of our net investment was a loss of $96 million, and gains of $27 million and $68 million, respectively, and were recorded in other comprehensive income (loss).
Commodity Prices Risk
Inherent in our business is exposure to price changes for several commodities. However, our exposure to changing commodity prices is somewhat limited since the majority of our raw materials are acquired at posted or market related prices, and sales prices for many of our finished products are at market related prices which are largely set on a monthly or quarterly basis in line with industry practice. Consequently, we do not generally hedge our commodity exposures.
ITEM 8. FINANCIAL STATEMENTS AND SUPPLEMENTARY DATA
Our consolidated financial statements required by this item are included on the pages immediately following the Index to Consolidated Financial Statements appearing on page F‑1.
ITEM 9. CHANGES IN AND DISAGREEMENTS WITH ACCOUNTANTS ON ACCOUNTING AND FINANCIAL DISCLOSURE
There have been no changes in our independent accountants, Deloitte & Touche LLP, or disagreements with them on matters of accounting or financial disclosure.
ITEM 9A. CONTROLS AND PROCEDURES
Evaluation of Disclosure Controls and Procedures
Our management, with the participation of our chief executive officer and chief financial officer, has evaluated the effectiveness of our disclosure controls and procedures (as defined in Rules 13a‑15(e) and 15d‑15(e) under the Exchange Act) as of December 31, 2017. Based on this evaluation, our chief executive officer and chief financial officer have concluded that, as of December 31, 2017, our disclosure controls and procedures were effective, in that they ensure that information required to be disclosed by us in the reports that we file or submit under the Exchange Act is (1) recorded, processed, summarized and reported within the time periods specified in the SEC’s rules and forms, and (2) accumulated and communicated to our management, including our chief executive officer and chief financial officer, as appropriate to allow timely decisions regarding required disclosure.
Changes in Internal Control Over Financial Reporting
No changes to our internal control over financial reporting occurred during the quarter ended December 31, 2017 that have materially affected, or are reasonably likely to materially affect, our internal control over financial reporting (as defined in Rules 13a‑15(f) and 15d‑15(f) under the Exchange Act).
Management’s Report on Internal Control Over Financial Reporting
Management is responsible for establishing and maintaining adequate internal control over financial reporting. Our internal control framework and processes for our Company and Huntsman International are designed to provide reasonable assurance to management, Huntsman International’s Board of Managers and our Board of Directors regarding
the reliability of financial reporting and the preparation of our consolidated financial statements in accordance with accounting principles generally accepted in the United States of America.
Our internal control over financial reporting for our Company and Huntsman International includes those policies and procedures that:
|
·
| |
pertain to the maintenance of records that, in reasonable detail, accurately and fairly reflect the transactions and dispositions of the assets of our Company and Huntsman International; |
|
·
| |
provide reasonable assurance that transactions are recorded properly to allow for the preparation of financial statements in accordance with generally accepted accounting principles, and that receipts and expenditures of our Company and Huntsman International are being made only in accordance with authorizations of management and Directors of our Company and Huntsman International; |
|
·
| |
provide reasonable assurance regarding prevention or timely detection of unauthorized acquisition, use or disposition of our assets that could have a material effect on our consolidated financial statements; and |
|
·
| |
provide reasonable assurance as to the detection of fraud. |
Because of its inherent limitations, a system of internal control over financial reporting can provide only reasonable assurance and may not prevent or detect misstatements. Further, because of changing conditions, effectiveness of internal control over financial reporting may vary over time.
Our management assessed the effectiveness of our internal control over financial reporting for our Company and Huntsman International and concluded that, as of December 31, 2017, such internal control is effective. In making this assessment, management used the criteria set forth by the Committee of Sponsoring Organizations of the Treadway Commission in Internal Control—Integrated Framework (2013) (“COSO”).
Our independent registered public accountants, Deloitte & Touche LLP, with direct access to our Board of Directors through our Audit Committee, have audited our consolidated financial statements prepared by our Company and Huntsman International and have issued attestation reports on internal control over financial reporting for our Company and Huntsman International.
REPORT OF INDEPENDENT REGISTERED PUBLIC ACCOUNTING FIRM
To the Board of Directors and Stockholders of
Huntsman Corporation
Opinion on Internal Control over Financial Reporting
We have audited the internal control over financial reporting of Huntsman Corporation and subsidiaries (the “Company”) as of December 31, 2017, based on criteria established in Internal Control — Integrated Framework (2013) issued by the Committee of Sponsoring Organizations of the Treadway Commission (COSO). In our opinion, the Company maintained, in all material respects, effective internal control over financial reporting as of December 31, 2017, based on criteria established in Internal Control — Integrated Framework (2013) issued by COSO.
We have also audited, in accordance with the standards of the Public Company Accounting Oversight Board (United States) (PCAOB), the consolidated financial statements as of and for the year ended December 31, 2017 of the Company and our report dated February 23, 2018, expressed an unqualified opinion on those financial statements.
Basis for Opinion
The Company’s management is responsible for maintaining effective internal control over financial reporting and for its assessment of the effectiveness of internal control over financial reporting, included in the accompanying Management’s Report on Internal Control Over Financial Reporting. Our responsibility is to express an opinion on the Company’s internal control over financial reporting based on our audit. We are a public accounting firm registered with the PCAOB and are required to be independent with respect to the Company in accordance with the U.S. federal securities laws and the applicable rules and regulations of the Securities and Exchange Commission and the PCAOB.
We conducted our audit in accordance with the standards of the PCAOB. Those standards require that we plan and perform the audit to obtain reasonable assurance about whether effective internal control over financial reporting was maintained in all material respects. Our audit included obtaining an understanding of internal control over financial reporting, assessing the risk that a material weakness exists, testing and evaluating the design and operating effectiveness of internal control based on the assessed risk, and performing such other procedures as we considered necessary in the circumstances. We believe that our audit provides a reasonable basis for our opinion.
Definition and Limitations of Internal Control over Financial Reporting
A company’s internal control over financial reporting is a process designed to provide reasonable assurance regarding the reliability of financial reporting and the preparation of financial statements for external purposes in accordance with generally accepted accounting principles. A company’s internal control over financial reporting includes those policies and procedures that (1) pertain to the maintenance of records that, in reasonable detail, accurately and fairly reflect the transactions and dispositions of the assets of the company; (2) provide reasonable assurance that transactions are recorded as necessary to permit preparation of financial statements in accordance with generally accepted accounting principles, and that receipts and expenditures of the company are being made only in accordance with authorizations of management and directors of the company; and (3) provide reasonable assurance regarding prevention or timely detection of unauthorized acquisition, use, or disposition of the company’s assets that could have a material effect on the financial statements.
Because of its inherent limitations, internal control over financial reporting may not prevent or detect misstatements. Also, projections of any evaluation of effectiveness to future periods are subject to the risk that controls may become inadequate because of changes in conditions, or that the degree of compliance with the policies or procedures may deteriorate.
/s/ DELOITTE & TOUCHE LLP
Houston, Texas
February 23, 2018
REPORT OF INDEPENDENT REGISTERED PUBLIC ACCOUNTING FIRM
To the Board of Managers and Members of
Huntsman International LLC
Opinion on Internal Control over Financial Reporting
We have audited the internal control over financial reporting of Huntsman International and subsidiaries (the “Company”) as of December 31, 2017, based on criteria established in Internal Control — Integrated Framework (2013) issued by the Committee of Sponsoring Organizations of the Treadway Commission (COSO). In our opinion, the Company maintained, in all material respects, effective internal control over financial reporting as of December 31, 2017, based on criteria established in Internal Control — Integrated Framework (2013) issued by COSO.
We have also audited, in accordance with the standards of the Public Company Accounting Oversight Board (United States) (PCAOB), the consolidated financial statements as of and for the year ended December 31, 2017 of the Company and our report dated February 23, 2018, expressed an unqualified opinion on those financial statements.
Basis for Opinion
The Company’s management is responsible for maintaining effective internal control over financial reporting and for its assessment of the effectiveness of internal control over financial reporting, included in the accompanying Management’s Report on Internal Control Over Financial Reporting. Our responsibility is to express an opinion on the Company’s internal control over financial reporting based on our audit. We are a public accounting firm registered with the PCAOB and are required to be independent with respect to the Company in accordance with the U.S. federal securities laws and the applicable rules and regulations of the Securities and Exchange Commission and the PCAOB.
We conducted our audit in accordance with the standards of the PCAOB. Those standards require that we plan and perform the audit to obtain reasonable assurance about whether effective internal control over financial reporting was maintained in all material respects. Our audit included obtaining an understanding of internal control over financial reporting, assessing the risk that a material weakness exists, testing and evaluating the design and operating effectiveness of internal control based on the assessed risk, and performing such other procedures as we considered necessary in the circumstances. We believe that our audit provides a reasonable basis for our opinion.
Definition and Limitations of Internal Control over Financial Reporting
A company’s internal control over financial reporting is a process designed to provide reasonable assurance regarding the reliability of financial reporting and the preparation of financial statements for external purposes in accordance with generally accepted accounting principles. A company’s internal control over financial reporting includes those policies and procedures that (1) pertain to the maintenance of records that, in reasonable detail, accurately and fairly reflect the transactions and dispositions of the assets of the company; (2) provide reasonable assurance that transactions are recorded as necessary to permit preparation of financial statements in accordance with generally accepted accounting principles, and that receipts and expenditures of the company are being made only in accordance with authorizations of management and directors of the company; and (3) provide reasonable assurance regarding prevention or timely detection of unauthorized acquisition, use, or disposition of the company’s assets that could have a material effect on the financial statements.
Because of its inherent limitations, internal control over financial reporting may not prevent or detect misstatements. Also, projections of any evaluation of effectiveness to future periods are subject to the risk that controls may become inadequate because of changes in conditions, or that the degree of compliance with the policies or procedures may deteriorate.
/s/ DELOITTE & TOUCHE LLP
Houston, Texas
February 23, 2018
ITEM 9B. OTHER INFORMATION
None.
PART III
ITEM 10. DIRECTORS, EXECUTIVE OFFICERS AND CORPORATE GOVERNANCE
Information relating to our Directors (including identification of our Audit Committee’s financial expert(s)) and executive officers will be disclosed in the definitive Proxy Statement for our Annual Meeting of Stockholders and is incorporated herein by reference. See also the information regarding executive officers of the registrant set forth in Part I under the caption “Executive Officers of the Registrant” in reliance on General Instruction G to Form 10‑K.
Code of Ethics
Our Company has adopted a code of ethics, as defined by Item 406(b) of Regulation S‑K under the Exchange Act, that applies to our principal executive officer, principal financial officer and principal accounting officer or controller. A copy of the code of ethics is posted on our website, at www.huntsman.com. We intend to disclose any amendments to, or waivers from, our code of ethics on our website.
ITEM 11. EXECUTIVE COMPENSATION
Information relating to executive compensation and our equity compensation plans will be disclosed in the definitive Proxy Statement for our Annual Meeting of Stockholders and is incorporated herein by reference.
ITEM 12. SECURITY OWNERSHIP OF CERTAIN BENEFICIAL OWNERS AND MANAGEMENT AND RELATED STOCKHOLDER MATTERS
Information with respect to beneficial ownership of our common stock by each Director and all Directors and officers of our Company as a group will be disclosed in the definitive Proxy Statement for our Annual Meeting of Stockholders and is incorporated herein by reference.
Information relating to any person who beneficially owns in excess of 5 percent of the total outstanding shares of our common stock will be disclosed in the definitive Proxy Statement for our Annual Meeting of Stockholders and is incorporated herein by reference.
Information with respect to compensation plans under which equity securities are authorized for issuance will be disclosed in the definitive Proxy Statement for our Annual Meeting of Stockholders and is incorporated herein by reference.
ITEM 13. CERTAIN RELATIONSHIPS AND RELATED TRANSACTIONS, AND DIRECTOR INDEPENDENCE
Information with respect to certain relationships and related transactions will be disclosed in the definitive Proxy Statement for our Annual Meeting of Stockholders and is incorporated herein by reference.
ITEM 14. PRINCIPAL ACCOUNTANT FEES AND SERVICES
Information with respect to principal accountant fees and services, and the disclosure of the Audit Committee’s pre‑approval policies and procedures are contained in the definitive Proxy Statement for our Annual Meeting of Stockholders and are incorporated herein by reference.
PART IV
ITEM 15. EXHIBITS AND FINANCIAL STATEMENT SCHEDULES
|
(a)
| |
Documents filed with this report. |
|
1.
| |
Consolidated Financial Statements: |
See Index to Consolidated Financial Statements on page F‑1
|
2.
| |
Financial Statement Schedules: |
Other than as stated on the Index to Consolidated Financial Statements on page F‑1 with respect to Schedule I and Schedule II, financial statement schedules are omitted because they are not required or are not applicable or the required information is shown in the consolidated financial statements or notes thereto.
The exhibits to this report are listed on the Exhibit Index below.
|
(b)
| |
Description of exhibits. |
EXHIBIT INDEX
|
|
|
|
Incorporated by Reference
|
|
Number
|
|
Description
|
Form
|
Exhibit
|
Filing Date
|
| 3.1
|
|
Amended and Restated Certificate of Incorporation of Huntsman Corporation
|
8-K
|
3.1
|
May 12, 2014
|
| 3.2
|
|
Fifth Amended and Restated Bylaws of Huntsman Corporation dated as of December 21, 2016
|
8-K
|
3.1
|
December 23, 2016
|
| 4.1
|
|
Registration Rights Agreement dated as of February 10, 2005, by and among Huntsman Corporation and the stockholders signatory thereto (File No. 001‑32427)
|
8-K
|
10.1
|
February 16, 2005
|
| 4.2
|
|
Form of stock certificate of Huntsman Corporation
|
S-1
|
4.68
|
February 8, 2005
|
| 4.3
|
|
Form of Restricted Stock Unit Agreement for Outside Directors, effective for grants prior to February 6, 2008
|
S-8
|
4.8
|
February 10, 2006
|
| 4.4
|
|
Form of Restricted Stock Unit Agreement for Outside Directors, effective for grants from February 6, 2008 to September 21, 2010 (File No. 001‑32427)
|
10-K
|
4.32
|
February 22, 2008
|
| 4.5
|
|
Indenture, dated as of November 19, 2012, by and among Huntsman International LLC, the guarantors named therein and Wells Fargo Bank, National Association, as trustee
|
8-K
|
4.1
|
November 19, 2012
|
| 4.6
|
|
Form of 4.875% Senior Note due 2020 (included as Exhibit A to Exhibit 4.5)
|
8-K
|
4.2
|
November 19, 2012
|
| 4.7
|
|
Form of Notation of Guarantee (included as Exhibit D to Exhibit 4.5)
|
8-K
|
4.3
|
November 19, 2012
|
| 4.8
|
|
Indenture, dated as of December 23, 2013, by and among Huntsman International LLC, the guarantors named therein, Citibank, N.A., London Branch, as paying agent, registrar and transfer agent, and Wilmington Trust, National Association, as trustee
|
8-K
|
4.1
|
December 23, 2013
|
|
|
|
|
Incorporated by Reference
|
|
Number
|
|
Description
|
Form
|
Exhibit
|
Filing Date
|
| 4.9
|
|
Form of 51/8% Senior Note (included as Exhibit A to Exhibit 4.8)
|
8-K
|
4.2
|
December 23, 2013
|
| 4.10
|
|
Form of Notation of Guarantee (included as Exhibit D to Exhibit 4.8)
|
8-K
|
4.3
|
December 23, 2013
|
| 4.11
|
|
Indenture, dated as of November 13, 2014, by and among Huntsman International LLC, the guarantors named therein, and Wilmington Trust, National Association, as trustee
|
8-K
|
4.1
|
November 17, 2014
|
| 4.12
|
|
Form of 51/8% Senior Note (included as Exhibit A to Exhibit 4.11)
|
8-K
|
4.2
|
November 17, 2014
|
| 4.13
|
|
Form of Notation of Guarantee (included as Exhibit D to Exhibit 4.11)
|
8-K
|
4.3
|
November 17, 2014
|
| 4.14
|
|
Indenture, dated as of March 31, 2015, by and among Huntsman International LLC, the guarantors named therein, Citibank, N.A., London Branch, as paying agent, transfer agent, registrar and authenticating agent, and Wilmington Trust, National Association, as trustee
|
8-K
|
4.1
|
April 2, 2015
|
| 4.15
|
|
Form of 4.25% Senior Notes due 2025 (included as Exhibit A to Exhibit 4.14)
|
8-K
|
4.2
|
April 2, 2015
|
| 4.16
|
|
Form of Notation of Guarantee (included as Exhibit D to Exhibit 4.14)
|
8-K
|
4.3
|
April 2, 2015
|
| 10.1
|
|
Employment Agreement with Anthony Hankins
|
S-1/A
|
10.27
|
January 28, 2005
|
| 10.2
|
|
Huntsman Corporation Stock Incentive Plan
|
S-1/A
|
10.19
|
February 8, 2005
|
| 10.3
|
|
Form of Nonqualified Stock Option Agreement, effective for grants prior to February 21, 2011
|
S-1/A
|
10.20
|
February 8, 2005
|
| 10.4
|
|
Form of Indemnification Agreement
|
S-1/A
|
10.25
|
February 8, 2005
|
| 10.5
|
|
Credit Agreement dated August 16, 2005 among Huntsman International LLC, Deutsche Bank AG New York Branch as Administrative Agent and the other financial institutions named therein (File No. 333‑85141)
|
8-K
|
10.1
|
August 22, 2005
|
| 10.6
|
|
Consent and First Amendment to Credit Agreement dated December 12, 2005 among Huntsman International LLC, Deutsche Bank AG New York Branch as Administrative Agent and the other financial institutions named therein (File No. 333‑85141)
|
8-K
|
10.1
|
December 27, 2005
|
| 10.7
|
|
Amended and Restated Huntsman Supplemental Executive Retirement Plan (File No. 001‑32427)
|
8-K
|
10.1
|
December 30, 2005
|
| 10.8
|
|
Huntsman Supplemental Executive MPP Plan (File No. 001‑32427)
|
8-K
|
10.2
|
December 30, 2005
|
| 10.9
|
|
Amended and Restated Huntsman Supplemental Savings Plan (File No. 001‑32427)
|
8-K
|
10.3
|
December 30, 2005
|
| 10.10
|
|
Huntsman Outside Directors Elective Deferral Plan (File No. 001‑32427)
|
8-K
|
10.4
|
December 30, 2005
|
|
|
|
|
Incorporated by Reference
|
|
Number
|
|
Description
|
Form
|
Exhibit
|
Filing Date
|
| 10.11
|
|
Consent and Second Amendment to Credit Agreement and Amendment to Security Documents, dated June 30, 2006, by and among Huntsman International LLC, as Borrower, Deutsche Bank AG New York Branch, as Administrative Agent and Collateral Agent, and the other financial institutions party thereto (File No. 001‑32427)
|
8-K
|
10.1
|
July 7, 2006
|
| 10.12
|
|
Third Amendment to Credit Agreement dated April 19, 2007 by and among Huntsman International LLC, as Borrower, Deutsche Bank AG New York Branch, as Administrative Agent and Collateral Agent, and the other financial institutions party thereto (File No. 001‑32427))
|
8-K
|
10.1
|
February 22, 2008
|
| 10.13
|
|
First Amendment to Huntsman Supplemental Executive Retirement Plan (File No. 001‑32427)
|
10-K
|
10.32
|
February 22, 2008
|
| 10.14
|
|
First Amendment to Huntsman Supplemental Executive MPP Plan (File No. 001‑32427)
|
10-K
|
10.33
|
February 22, 2008
|
| 10.15
|
|
First Amendment to Huntsman Supplemental Savings Plan (File No. 001‑32427)
|
10-K
|
10.34
|
February, 22, 2008
|
| 10.16
|
|
Second Amendment to Huntsman Supplemental Savings Plan (File No. 001‑32427)
|
10-K
|
10.35
|
February 22, 2008
|
| 10.17
|
|
First Amendment to Huntsman Outside Directors Elective Deferral Plan (File No. 001‑32427)
|
10-K
|
10.36
|
February 22, 2008
|
| 10.18
|
|
Fourth Amendment to Credit Agreement, dated as of June 22, 2009, by and among Huntsman International LLC and Credit Suisse Securities (USA) LLC and Deutsche Bank Securities Inc. (File No. 001‑32427)
|
8-K
|
10.3
|
June 23, 2009
|
| 10.19
|
|
U.S. Receivables Loan Agreement dated as of October 16, 2009 among Huntsman Receivables Finance II LLC, Huntsman (Europe) BVBA, the several entities party thereto as lenders, the several financial institutions party thereto as funding agents, the several commercial paper conduits party thereto as conduit lenders, the several financial institutions party thereto as committed lenders, Wachovia Bank National Association, as administrative agent, and Wachovia Bank National Association, as collateral Agent (File No. 001‑32427)
|
8-K
|
10.1
|
October 22, 2009
|
| 10.20
|
|
U.S. Contribution Agreement dated as of October 16, 2009 between Huntsman International LLC and Huntsman Receivables Finance II LLC (File No. 001‑32427)
|
8-K
|
10.2
|
October 22, 2009
|
|
|
|
|
Incorporated by Reference
|
|
Number
|
|
Description
|
Form
|
Exhibit
|
Filing Date
|
| 10.21
|
|
European Receivables Loan Agreement dated as of October 16, 2009 between Huntsman Receivables Finance LLC, Huntsman (Europe) BVBA, the several entities party thereto as lenders, the several financial institutions party thereto as funding agents, Barclays Bank Plc, as administrative agent, and Barclays Bank Plc, as collateral agent (File No. 001‑32427)
|
8-K
|
10.3
|
October 22, 2009
|
| 10.22
|
|
European Contribution Agreement dated as of October 16, 2009 between Huntsman International LLC and Huntsman Receivables Finance LLC (File No. 001‑32427)
|
8-K
|
10.4
|
October 22, 2009
|
| 10.23
|
|
Fifth Amendment to Credit Agreement, dated as of March 9, 2010, by and among Huntsman International LLC, JPMorgan Chase Bank, N.A. and the other financial institutions party thereto (File No. 001‑32427)
|
10-Q
|
10.1
|
May 7, 2010
|
| 10.24
|
|
Certain exhibits and schedules to Exhibit A to the Fifth Amendment to Credit Agreement, dated as of March 9, 2010, which was previously filed as Exhibit 10.1 to our quarterly report on Form 10‑Q filed May 7, 2010 (File No. 001‑32427)
|
10-Q
|
10.2
|
November 4, 2010
|
| 10.25
|
|
Second Amendment to Huntsman Supplemental Executive Retirement Plan (File No. 001‑32427)
|
10-K
|
10.38
|
February 17, 2011
|
| 10.26
|
|
Third Amendment to Huntsman Supplemental Executive Retirement Plan (File No. 001‑32427)
|
10-K
|
10.39
|
February 17, 2011
|
| 10.27
|
|
Form of Restricted Stock Agreement effective for grants from February 2, 2011 to May 5, 2016 (File No. 001‑32427)
|
10-K
|
10.40
|
February 17, 2011
|
| 10.28
|
|
Form of Phantom Share Agreement effective for grants from February 2, 2011 to May 5, 2016 (File No. 001‑32427)
|
10-K
|
10.41
|
February 17, 2011
|
| 10.29
|
|
Form of Nonqualified Stock Option Agreement effective for grants from February 2, 2011 to May 5, 2016 (File No. 001‑32427)
|
10-K
|
10.42
|
February 17, 2011
|
| 10.30
|
|
Form of Restricted Stock Unit Agreement for Outside Directors effective for grants from February 2, 2011 to May 5, 2016 (File No. 001‑32427)
|
10-K
|
10.43
|
February 17, 2011
|
| 10.31
|
|
Sixth Amendment, dated as of March 7, 2011, to the Credit Agreement, dated as of August 16, 2005, among Huntsman International LLC, the lenders from time to time party thereto, and JPMorgan Chase Bank, N.A., as administrative agent (File No. 001‑32427)
|
8-K
|
10.1
|
March 9, 2011
|
| 10.32
|
|
Master Amendment No. 2 to the U.S. Receivables Loan Agreement, U.S. Servicing Agreement and Transaction Documents dated as of April 18, 2011 (File No. 001‑32427)
|
8-K
|
10.1
|
April 20, 2011
|
|
|
|
|
Incorporated by Reference
|
|
Number
|
|
Description
|
Form
|
Exhibit
|
Filing Date
|
| 10.33
|
|
Master Amendment No. 2 to the European Receivables Loan Agreement, European Servicing Agreement and Transaction Documents dated as of April 15, 2011 (File No. 001‑32427)
|
8-K
|
10.2
|
April 20, 2011
|
| 10.34
|
|
Second Amendment to Huntsman Outside Directors Elective Deferral Plan (File No. 001‑32427)
|
10-Q
|
10.5
|
May 5, 2011
|
| 10.35
|
|
Third Amendment to Huntsman Outside Directors Elective Deferral Plan (File No. 001‑32427)
|
10-Q
|
10.6
|
May 5, 2011
|
| 10.36
|
|
Huntsman Corporation Stock Incentive Plan (amended and restated) (File No. 001‑32427)
|
S-8
|
4.1
|
May 10, 2011
|
| 10.37
|
|
Seventh Amendment, dated as of March 6, 2012, to Credit Agreement, dated as of August 16, 2005, among Huntsman International LLC, the lenders from time to time party thereto, and JPMorgan Chase Bank, N.A., as administrative agent (File No. 001‑32427)
|
8-K
|
10.1
|
March 6, 2012
|
| 10.38
|
|
First Amendment to the Huntsman Corporation Stock Incentive Plan (as amended and restated) (File No. 001‑32427)
|
10-K
|
10.56
|
February 12, 2013
|
| 10.39
|
|
Eighth Amendment, dated as of March 11, 2013, to Credit Agreement, dated as of August 16, 2005, among Huntsman International LLC, the lenders from time to time party thereto, and JPMorgan Chase Bank, N.A., as administrative agent
|
8-K
|
10.1
|
March 12, 2013
|
| 10.40
|
|
Master Amendment No. 3 to the U.S. Receivables Loan Agreement, U.S. Servicing Agreement and Transaction Documents dated as of April 29, 2013
|
8-K
|
10.1
|
May 2, 2013
|
| 10.41
|
|
Master Amendment No. 3 to the European Receivables Loan Agreement dated as of April 29, 2013
|
8-K
|
10.2
|
May 2, 2013
|
| 10.42
|
|
Ninth Amendment, dated as of August 22, 2013, to Credit Agreement, dated as of August 16, 2005, among Huntsman International LLC, the lenders from time to time party thereto, and JPMorgan Chase Bank, N.A., as administrative agent
|
8-K
|
10.1
|
August 26, 2013
|
| 10.43
|
|
Tenth Amendment to Credit Agreement, Second Amendment to Collateral Security Agreement, Second Amendment to Pledge Agreement and Second Amendment to Subsidiary Guaranty, dated as of October 15, 2013, among Huntsman International LLC, the subsidiary guarantors party thereto, the lenders from time to time party thereto, and JPMorgan Chase Bank, N.A., as administrative agent
|
8-K
|
10.1
|
October 18, 2013
|
| 10.44
|
|
Huntsman Executive Severance Plan (as amended and restated)
|
10-Q
|
10.3
|
October 29, 2013
|
| 10.45
|
|
Huntsman Corporation Stock Incentive Plan (amended and restated)
|
8-K
|
10.1
|
May 12, 2014
|
|
|
|
|
Incorporated by Reference
|
|
Number
|
|
Description
|
Form
|
Exhibit
|
Filing Date
|
| 10.46
|
|
Eleventh Amendment, dated as of August 12, 2014, to Credit Agreement, dated as of August 16, 2005, among Huntsman International LLC, the lenders from time to time party thereto, and JPMorgan Chase Bank, N.A., as administrative agent
|
8-K
|
10.1
|
August 15, 2014
|
| 10.47
|
|
Twelfth Amendment, dated as of August 13, 2014, to Credit Agreement, dated as of August 16, 2005, among Huntsman International LLC, the lenders from time to time party thereto, and JPMorgan Chase Bank, N.A., as administrative agent
|
8-K
|
10.2
|
August 15, 2014
|
| 10.48
|
|
Thirteenth Amendment to Credit Agreement, dated as of October 1, 2014, among Huntsman International LLC, the subsidiary guarantors party thereto, the lenders from time to time party thereto, and JPMorgan Chase Bank, N.A., as administrative agent
|
8-K
|
10.1
|
October 7, 2014
|
| 10.49
|
|
Registration Rights Agreement, dated as of November 13, 2014, by and among Huntsman International LLC, the guarantors named therein and J.P. Morgan Securities LLC, as representative of the several purchasers
|
8-K
|
10.1
|
November 17, 2014
|
| 10.50
|
|
Form of Performance Share Unit Award Agreement effective for grants from February 4, 2015 to May 5, 2016
|
10-K
|
10.65
|
February 18, 2015
|
| 10.51
|
|
Amendment to the Huntsman Corporation Stock Incentive Plan Nonqualified Stock Option Agreement effective for grants through May 5, 2016
|
10-K
|
10.66
|
February 18, 2015
|
| 10.52
|
|
Registration Rights Agreement, dated as of March 31, 2015, by and among Huntsman International LLC, the guarantors named therein and the several initial purchasers
|
8-K
|
10.1
|
April 2, 2015
|
| 10.53
|
|
Master Amendment No. 4 to the European Receivables Loan Agreement, the Servicing Agreement, the Liquidation Servicer Agreement and the Transaction Documents, dated as of March 5, 2015
|
8-K
|
10.1
|
March 9, 2015
|
| 10.54
|
|
Master Amendment No. 4 to the U.S. Receivables Loan Agreement, U.S. Servicing Agreement and Transaction Documents and Waiver, dated as of March 30, 2015
|
8-K
|
10.2
|
April 2, 2015
|
| 10.55
|
|
Fourteenth Amendment to Credit Agreement, dated as of August 10, 2015, among Huntsman International LLC, the lenders from time to time party thereto, and JPMorgan Chase Bank, N.A., as administrative agent
|
8-K
|
10.1
|
August 10, 2015
|
| 10.56
|
|
Fifteenth Amendment to Credit Agreement, dated as of April 1, 2016, among Huntsman International LLC, the lenders from time to time party thereto, and JPMorgan Chase Bank, N.A., as administrative agent
|
8-K
|
10.1
|
April 6, 2016
|
| 10.57
|
|
Huntsman Corporation 2016 Stock Incentive Plan
|
8-K
|
10.1
|
May 11, 2016
|
|
|
|
|
Incorporated by Reference
|
|
Number
|
|
Description
|
Form
|
Exhibit
|
Filing Date
|
| 10.58
|
|
Form of Nonqualified Stock Option Agreement effective for grants from May 5, 2016 to January 31, 2017
|
S-8
|
99.1
|
May 31, 2016
|
| 10.59
|
|
Form of Restricted Stock Agreement effective for grants from May 5, 2016 to January 31, 2017
|
S-8
|
99.2
|
May 31, 2016
|
| 10.60
|
|
Form of Phantom Share Agreement effective for grants from May 5, 2016 to January 31, 2017
|
S-8
|
99.3
|
May 31, 2016
|
| 10.61
|
|
Sixteenth Amendment to Credit Agreement, dated as of November 15, 2016, among Huntsman International LLC, the lenders from time to time party thereto, and JPMorgan Chase Bank, N.A., as administrative agent
|
8-K
|
10.1
|
November 16, 2016
|
| 10.62
|
|
Form of Phantom Share Agreement
|
10-K
|
10.66
|
February 15, 2017
|
| 10.63
|
|
Form of Performance Share Unit Award Agreement
|
10-K
|
10.67
|
February 15, 2017
|
| 10.64
|
|
Form of Nonqualified Stock Option Agreement
|
10-K
|
10.68
|
February 15, 2017
|
| 10.65
|
|
Form of Restricted Stock Agreement
|
10-K
|
10.69
|
February 15, 2017
|
| 10.66
|
|
Form of Stock Unit Agreement for Outside Directors
|
10-K
|
10.70
|
February 15, 2017
|
| 10.67
|
|
Form of Notice of Award of Common Stock
|
10-K
|
10.71
|
February 15, 2017
|
| 10.68
|
|
Amended and Restated European Receivables Loan Agreement dated as of April 21, 2017 between Huntsman Receivables Finance LLC, Vantico Group S.à r.l., the several entities party thereto as lenders, the several financial institutions party thereto as funding agents, Barclays Bank Plc, as administrative agent, and Barclays Bank Plc, as collateral agent
|
10-Q
|
10.1
|
April 26, 2017
|
| 10.69
|
|
Master Amendment No. 6 to the U.S. Receivables Loan Agreement, U.S. Servicing Agreement, U.S Receivables Purchase Agreement and Transaction Documents dated as of April 21, 2017
|
10-Q
|
10.2
|
April 26, 2017
|
| 10.70
|
|
Seventeenth Amendment to Credit Agreement, dated as of June 15, 2017, among Huntsman International LLC, the lenders from time to time party thereto, and JPMorgan Chase Bank, N.A., as administrative agent
|
8-K
|
10.1
|
June 19, 2017
|
| 10.71
|
|
Amended and Restated Severance Agreement dated December 19, 2017 between Huntsman Corporation and Peter R. Huntsman
|
8-K
|
10.2
|
December 22, 2017
|
|
21.1*
|
|
Subsidiaries of Huntsman Corporation
|
|
|
|
|
23.1*
|
|
Consent of Independent Registered Public Accounting Firm
|
|
|
|
|
31.1*
|
|
Certification of Chief Executive Officer pursuant to Section 302 of the Sarbanes‑Oxley Act of 2002
|
|
|
|
|
31.2*
|
|
Certification of Chief Financial Officer pursuant to Section 302 of the Sarbanes‑Oxley Act of 2002
|
|
|
|
|
32.1*
|
|
Certification of Chief Executive Officer pursuant to Section 906 of the Sarbanes‑Oxley Act of 2002
|
|
|
|
|
32.2*
|
|
Certification of Chief Financial Officer pursuant to Section 906 of the Sarbanes‑Oxley Act of 2002
|
|
|
|
|
101.INS*
|
|
XBRL Instance Document
|
|
|
|
|
|
|
|
Incorporated by Reference
|
|
Number
|
|
Description
|
Form
|
Exhibit
|
Filing Date
|
|
101.SCH*
|
|
XBRL Taxonomy Extension Schema
|
|
|
|
|
101.CAL*
|
|
XBRL Taxonomy Extension Calculation Linkbase
|
|
|
|
|
101.LAB*
|
|
XBRL Taxonomy Extension Label Linkbase
|
|
|
|
|
101.PRE*
|
|
XBRL Taxonomy Extension Presentation Linkbase
|
|
|
|
|
101.DEF*
|
|
XBRL Taxonomy Extension Definition Linkbase
|
|
|
|
*Filed herewith.
SIGNATURES
Pursuant to the requirements of Section 13 or 15(d) of the Securities Exchange Act of 1934, the registrants have duly caused this report to be signed on their behalf by the undersigned, thereunto duly authorized.
Dated: February 23, 2018
|
|
Huntsman Corporation
Huntsman International LLC
|
|
|
|
|
|
By:
|
/s/ Sean Douglas
|
|
|
|
Sean Douglas
Executive Vice President and Chief Financial Officer
|
Pursuant to the requirements of the Securities Exchange Act of 1934, this report has been signed below by the following persons on behalf of Huntsman Corporation in the capacities indicated on the 23rd day of February 2018.
|
|
|
|
|
/s/ Peter R. Huntsman
|
|
/s/ Sean Douglas
|
|
Peter R. Huntsman
Chairman, President and Chief Executive Officer
(Principal Executive Officer)
|
|
Sean Douglas
Executive Vice President and Chief Financial Officer (Principal Financial Officer)
|
|
|
|
|
|
/s/ Randy W. Wright
|
|
/s/ Wayne A. Reaud
|
|
Randy W. Wright
Vice President and Controller (Authorized Signatory and Principal Accounting Officer)
|
|
Wayne A. Reaud
Chairman of the Litigation Committee and Director
|
|
|
|
|
|
/s/ Nolan D. Archibald
|
|
/s/ M. Anthony Burns
|
|
Nolan D. Archibald
Chairman of the Nominating and Corporate Governance Committee and Director
|
|
M. Anthony Burns
Chairman of the Audit Committee and Director
|
|
|
|
|
|
/s/ Alvin V. Shoemaker
|
|
/s/ Sir Robert Margetts
|
|
Alvin V. Shoemaker
Chairman of the Compensation Committee and Director
|
|
Sir Robert Margetts
Director
|
|
|
|
|
|
/s/ Mary C. Beckerle
|
|
|
|
Mary C. Beckerle
Director
|
|
|
Pursuant to the requirements of the Securities Exchange Act of 1934, this report has been signed below by the following persons on behalf of Huntsman International in the capacities indicated on the 23rd day of February 2018.
|
|
|
|
|
/s/ Peter R. Huntsman
|
|
/s/ Sean Douglas
|
|
Peter R. Huntsman
President, Chief Executive Officer and Manager (Principal Executive Officer)
|
|
Sean Douglas
Executive Vice President, Chief Financial Officer and Manager (Principal Financial Officer)
|
|
|
|
|
|
/s/ Randy W. Wright
|
|
/s/ David M. Stryker
|
|
Randy W. Wright
Vice President and Controller (Authorized Signatory and Principal Accounting Officer)
|
|
David M. Stryker
Executive Vice President, General Counsel,
Secretary and Manager
|
|
|
|
|
|
|
|
|
|
|
|
|
HUNTSMAN CORPORATION AND SUBSIDIARIES
HUNTSMAN INTERNATIONAL LLC AND SUBSIDIARIES
INDEX TO CONSOLIDATED FINANCIAL STATEMENTS
|
|
|
Page
|
|
|
Huntsman Corporation and Subsidiaries:
|
|
|
|
|
Consolidated Financial Statements
|
|
|
|
|
Report of Independent Registered Public Accounting Firm
|
|
F‑2
|
|
|
Consolidated Balance Sheets as of December 31, 2017 and 2016
|
|
F‑3
|
|
|
Consolidated Statements of Operations for the Years Ended December 31, 2017, 2016 and 2015
|
|
F‑4
|
|
|
Consolidated Statements of Comprehensive Income (Loss) for the Years Ended December 31, 2017, 2016 and 2015
|
|
F‑5
|
|
|
Consolidated Statements of Equity for the Years Ended December 31, 2017, 2016 and 2015
|
|
F‑6
|
|
|
Consolidated Statements of Cash Flows for the Years Ended December 31, 2017, 2016 and 2015
|
|
F‑7
|
|
|
Huntsman International LLC and Subsidiaries:
|
|
|
|
|
Consolidated Financial Statements
|
|
|
|
|
Report of Independent Registered Public Accounting Firm
|
|
F‑9
|
|
|
Consolidated Balance Sheets as of December 31, 2017 and 2016
|
|
F‑10
|
|
|
Consolidated Statements of Operations for the Years Ended December 31, 2017, 2016 and 2015
|
|
F‑11
|
|
|
Consolidated Statements of Comprehensive Income (Loss) for the Years Ended December 31, 2017, 2016 and 2015
|
|
F‑12
|
|
|
Consolidated Statements of Equity for the Years Ended December 31, 2017, 2016 and 2015
|
|
F‑13
|
|
|
Consolidated Statements of Cash Flows for the Years Ended December 31, 2017, 2016 and 2015
|
|
F‑14
|
|
|
Huntsman Corporation and Subsidiaries and Huntsman International LLC and Subsidiaries:
|
|
|
|
|
Notes to Consolidated Financial Statements
|
|
F‑16
|
|
|
Schedules to Consolidated Financial Statements
|
|
|
|
|
Schedule to Consolidated Financial Statements, Schedule I—Condensed Financial Information of Registrant (Huntsman Corporation only)
|
|
F‑87
|
|
|
Schedule to Consolidated Financial Statements, Schedule II—Valuation and Qualifying Accounts (Huntsman Corporation and Subsidiaries and Huntsman International LLC and Subsidiaries)
|
|
F‑92
|
|
REPORT OF INDEPENDENT REGISTERED PUBLIC ACCOUNTING FIRM
To the Board of Directors and Stockholders of
Huntsman Corporation
Opinion on the Financial Statements
We have audited the accompanying consolidated balance sheets of Huntsman Corporation and subsidiaries (the "Company”) as of December 31, 2017 and 2016, the related consolidated statements of operations, comprehensive income (loss), equity, and cash flows for each of the three years in the period ended December 31, 2017, and the related notes and the schedules listed in the Index on page F-1 (collectively referred to as the “financial statements”). In our opinion, the consolidated financial statements present fairly, in all material respects, the financial position of the Company as of December 31, 2017 and 2016, and the results of its operations and its cash flows for each of the three years in the period ended December 31, 2017, in conformity with accounting principles generally accepted in the United States of America.
We have also audited, in accordance with the standards of the Public Company Accounting Oversight Board (United States) (PCAOB), the Company's internal control over financial reporting as of December 31, 2017, based on criteria established in Internal Control—Integrated Framework (2013) issued by the Committee of Sponsoring Organizations of the Treadway Commission and our report dated February 23, 2018, expressed an unqualified opinion on the Company's internal control over financial reporting.
Basis for Opinion
These financial statements are the responsibility of the Company's management. Our responsibility is to express an opinion on the Company’s financial statements based on our audits. We are a public accounting firm registered with the PCAOB and are required to be independent with respect to the Company in accordance with the U.S. federal securities laws and the applicable rules and regulations of the Securities and Exchange Commission and the PCAOB.
We conducted our audits in accordance with the standards of the PCAOB. Those standards require that we plan and perform the audit to obtain reasonable assurance about whether the financial statements are free of material misstatement, whether due to error or fraud. Our audits included performing procedures to assess the risks of material misstatement of the financial statements, whether due to error or fraud, and performing procedures that respond to those risks. Such procedures included examining, on a test basis, evidence regarding the amounts and disclosures in the financial statements. Our audits also included evaluating the accounting principles used and significant estimates made by management, as well as evaluating the overall presentation of the financial statements. We believe that our audits provide a reasonable basis for our opinion.
/s/ DELOITTE & TOUCHE LLP
Houston, Texas
February 23, 2018
We have served as the Company’s auditor since 1984.
HUNTSMAN CORPORATION AND SUBSIDIARIES
CONSOLIDATED BALANCE SHEETS
(In Millions, Except Per Share Amounts)
|
|
|
|
|
|
|
|
|
|
|
December 31,
|
|
December 31,
|
|
|
|
2017
|
|
2016
|
|
ASSETS
|
|
|
|
|
|
|
|
Current assets:
|
|
|
|
|
|
|
|
Cash and cash equivalents(a)
|
|
$
|
470
|
|
$
|
385
|
|
Restricted cash(a)
|
|
|
11
|
|
|
11
|
|
Accounts and notes receivable (net of allowance for doubtful accounts of $25 and $23, respectively), ($334 and $328 pledged as collateral, respectively)(a)
|
|
|
1,256
|
|
|
1,168
|
|
Accounts receivable from affiliates
|
|
|
27
|
|
|
15
|
|
Inventories(a)
|
|
|
1,073
|
|
|
918
|
|
Prepaid expenses
|
|
|
60
|
|
|
49
|
|
Other current assets(a)
|
|
|
202
|
|
|
232
|
|
Current assets held for sale
|
|
|
2,880
|
|
|
777
|
|
Total current assets
|
|
|
5,979
|
|
|
3,555
|
|
Property, plant and equipment, net(a)
|
|
|
3,098
|
|
|
3,034
|
|
Investment in unconsolidated affiliates
|
|
|
266
|
|
|
248
|
|
Intangible assets, net(a)
|
|
|
56
|
|
|
43
|
|
Goodwill
|
|
|
140
|
|
|
121
|
|
Deferred income taxes
|
|
|
208
|
|
|
253
|
|
Other noncurrent assets(a)
|
|
|
497
|
|
|
472
|
|
Noncurrent assets held for sale
|
|
|
—
|
|
|
1,463
|
|
Total assets
|
|
$
|
10,244
|
|
$
|
9,189
|
|
|
|
|
|
|
|
|
|
LIABILITIES AND EQUITY
|
|
|
|
|
|
|
|
Current liabilities:
|
|
|
|
|
|
|
|
Accounts payable(a)
|
|
$
|
946
|
|
$
|
774
|
|
Accounts payable to affiliates
|
|
|
18
|
|
|
16
|
|
Accrued liabilities(a)
|
|
|
569
|
|
|
471
|
|
Current portion of debt(a)
|
|
|
40
|
|
|
50
|
|
Current liabilities held for sale
|
|
|
1,692
|
|
|
467
|
|
Total current liabilities
|
|
|
3,265
|
|
|
1,778
|
|
Long-term debt(a)
|
|
|
2,258
|
|
|
4,122
|
|
Notes payable to affiliates
|
|
|
—
|
|
|
1
|
|
Deferred income taxes
|
|
|
264
|
|
|
371
|
|
Other noncurrent liabilities(a)
|
|
|
1,086
|
|
|
1,057
|
|
Noncurrent liabilities held for sale
|
|
|
—
|
|
|
393
|
|
Total liabilities
|
|
|
6,873
|
|
|
7,722
|
|
Commitments and contingencies (Notes 18 and 19)
|
|
|
|
|
|
|
|
Equity
|
|
|
|
|
|
|
|
Huntsman Corporation stockholders’ equity:
|
|
|
|
|
|
|
|
Common stock $0.01 par value, 1,200,000,000 shares authorized, 252,759,715 and 250,802,175 shares issued and 240,213,606 and 236,370,347 shares outstanding, respectively
|
|
|
3
|
|
|
3
|
|
Additional paid-in capital
|
|
|
3,889
|
|
|
3,447
|
|
Treasury stock, 12,607,223 shares
|
|
|
(150)
|
|
|
(150)
|
|
Unearned stock-based compensation
|
|
|
(15)
|
|
|
(17)
|
|
Retained earnings (accumulated deficit)
|
|
|
161
|
|
|
(325)
|
|
Accumulated other comprehensive loss
|
|
|
(1,268)
|
|
|
(1,671)
|
|
Total Huntsman Corporation stockholders’ equity
|
|
|
2,620
|
|
|
1,287
|
|
Noncontrolling interests in subsidiaries
|
|
|
751
|
|
|
180
|
|
Total equity
|
|
|
3,371
|
|
|
1,467
|
|
Total liabilities and equity
|
|
$
|
10,244
|
|
$
|
9,189
|
|
(a)
| |
At December 31, 2017 and December 31, 2016, respectively, $15 and $20 of cash and cash equivalents, $11 and $10 of restricted cash, $35 and $21 of accounts and notes receivable (net), $46 and $45 of inventories, $7 and $5 of other current assets, $283 and $279 of property, plant and equipment (net), $10 each of intangible assets (net), $43 and $37 of other noncurrent assets, $109 and $89 of accounts payable, $32 and $30 of accrued liabilities, $21 and $12 of current portion of debt, $86 and $114 of long‑term debt, and $98 and $76 of other noncurrent liabilities from consolidated variable interest entities are included in the respective Balance Sheet captions above. See “Note 7. Variable Interest Entities.” |
See accompanying notes to consolidated financial statements.
HUNTSMAN CORPORATION AND SUBSIDIARIES
CONSOLIDATED STATEMENTS OF OPERATIONS
(In Millions, Except Per Share Amounts)
|
|
|
|
|
|
|
|
|
|
|
|
|
|
Year ended December 31,
|
|
|
|
2017
|
|
2016
|
|
2015
|
|
Revenues:
|
|
|
|
|
|
|
|
|
|
|
Trade sales, services and fees, net
|
|
$
|
8,208
|
|
$
|
7,387
|
|
$
|
8,008
|
|
Related party sales
|
|
|
150
|
|
|
131
|
|
|
131
|
|
Total revenues
|
|
|
8,358
|
|
|
7,518
|
|
|
8,139
|
|
Cost of goods sold
|
|
|
6,546
|
|
|
5,992
|
|
|
6,405
|
|
Gross profit
|
|
|
1,812
|
|
|
1,526
|
|
|
1,734
|
|
Operating expenses:
|
|
|
|
|
|
|
|
|
|
|
Selling, general and administrative
|
|
|
798
|
|
|
768
|
|
|
791
|
|
Research and development
|
|
|
138
|
|
|
137
|
|
|
143
|
|
Restructuring, impairment and plant closing costs
|
|
|
20
|
|
|
47
|
|
|
83
|
|
Merger costs
|
|
|
28
|
|
|
—
|
|
|
—
|
|
Other operating income, net
|
|
|
(23)
|
|
|
(101)
|
|
|
—
|
|
Total operating expenses
|
|
|
961
|
|
|
851
|
|
|
1,017
|
|
Operating income
|
|
|
851
|
|
|
675
|
|
|
717
|
|
Interest expense
|
|
|
(165)
|
|
|
(203)
|
|
|
(205)
|
|
Equity in income of investment in unconsolidated affiliates
|
|
|
13
|
|
|
5
|
|
|
6
|
|
Loss on early extinguishment of debt
|
|
|
(54)
|
|
|
(3)
|
|
|
(31)
|
|
Other income, net
|
|
|
2
|
|
|
—
|
|
|
1
|
|
Income from continuing operations before income taxes
|
|
|
647
|
|
|
474
|
|
|
488
|
|
Income tax expense
|
|
|
(64)
|
|
|
(109)
|
|
|
(60)
|
|
Income from continuing operations
|
|
|
583
|
|
|
365
|
|
|
428
|
|
Income (loss) from discontinued operations, net of tax
|
|
|
158
|
|
|
(8)
|
|
|
(302)
|
|
Net income
|
|
|
741
|
|
|
357
|
|
|
126
|
|
Net income attributable to noncontrolling interests
|
|
|
(105)
|
|
|
(31)
|
|
|
(33)
|
|
Net income attributable to Huntsman Corporation
|
|
$
|
636
|
|
$
|
326
|
|
$
|
93
|
|
|
|
|
|
|
|
|
|
|
|
|
Basic income (loss) per share:
|
|
|
|
|
|
|
|
|
|
|
Income from continuing operations attributable to Huntsman Corporation common stockholders
|
|
$
|
2.01
|
|
$
|
1.41
|
|
$
|
1.63
|
|
Income (loss) from discontinued operations attributable to Huntsman Corporation common stockholders, net of tax
|
|
|
0.66
|
|
|
(0.03)
|
|
|
(1.25)
|
|
Net income attributable to Huntsman Corporation common stockholders
|
|
$
|
2.67
|
|
$
|
1.38
|
|
$
|
0.38
|
|
Weighted average shares
|
|
|
238.4
|
|
|
236.3
|
|
|
242.8
|
|
|
|
|
|
|
|
|
|
|
|
|
Diluted income (loss) per share:
|
|
|
|
|
|
|
|
|
|
|
Income from continuing operations attributable to Huntsman Corporation common stockholders
|
|
$
|
1.96
|
|
$
|
1.39
|
|
$
|
1.61
|
|
Income (loss) from discontinued operations attributable to Huntsman Corporation common stockholders, net of tax
|
|
|
0.65
|
|
|
(0.03)
|
|
|
(1.23)
|
|
Net income attributable to Huntsman Corporation common stockholders
|
|
$
|
2.61
|
|
$
|
1.36
|
|
$
|
0.38
|
|
Weighted average shares
|
|
|
243.9
|
|
|
239.6
|
|
|
245.4
|
|
Amounts attributable to Huntsman Corporation common stockholders:
|
|
|
|
|
|
|
|
|
|
|
Income from continuing operations
|
|
$
|
478
|
|
$
|
334
|
|
$
|
395
|
|
Income (loss) from discontinued operations, net of tax
|
|
|
158
|
|
|
(8)
|
|
|
(302)
|
|
Net income
|
|
$
|
636
|
|
$
|
326
|
|
$
|
93
|
|
Dividends per share
|
|
$
|
0.50
|
|
$
|
0.50
|
|
$
|
0.50
|
See accompanying notes to consolidated financial statements.
HUNTSMAN CORPORATION AND SUBSIDIARIES
CONSOLIDATED STATEMENTS OF COMPREHENSIVE INCOME (LOSS)
(In Millions)
|
|
|
|
|
|
|
|
|
|
|
|
|
|
|
|
|
|
|
|
|
|
|
|
|
|
Year ended December 31,
|
|
|
|
2017
|
|
2016
|
|
2015
|
|
Net income
|
|
$
|
741
|
|
$
|
357
|
|
$
|
126
|
|
Other comprehensive income (loss), net of tax:
|
|
|
|
|
|
|
|
|
|
|
Foreign currency translations adjustments
|
|
|
210
|
|
|
(171)
|
|
|
(313)
|
|
Pension and other postretirement benefits adjustments
|
|
|
86
|
|
|
(219)
|
|
|
66
|
|
Other, net
|
|
|
—
|
|
|
(1)
|
|
|
7
|
|
Other comprehensive income (loss), net of tax
|
|
|
296
|
|
|
(391)
|
|
|
(240)
|
|
Comprehensive income (loss)
|
|
|
1,037
|
|
|
(34)
|
|
|
(114)
|
|
Comprehensive income attributable to noncontrolling interests
|
|
|
(127)
|
|
|
(23)
|
|
|
(28)
|
|
Comprehensive income (loss) attributable to Huntsman Corporation
|
|
$
|
910
|
|
$
|
(57)
|
|
$
|
(142)
|
See accompanying notes to consolidated financial statements.
HUNTSMAN CORPORATION AND SUBSIDIARIES
CONSOLIDATED STATEMENTS OF EQUITY
(In Millions, Except Share Amounts)
|
|
|
|
|
|
|
|
|
|
|
|
|
|
|
|
|
|
|
|
|
|
|
|
|
|
|
|
|
|
|
Huntsman Corporation Stockholders’ Equity
|
|
|
|
|
|
|
|
|
|
|
|
|
|
|
|
|
|
|
|
|
|
|
|
Retained
|
|
Accumulated
|
|
|
|
|
|
|
|
|
|
Shares
|
|
|
|
|
Additional
|
|
|
|
|
Unearned
|
|
earnings
|
|
other
|
|
Noncontrolling
|
|
|
|
|
|
|
Common
|
|
Common
|
|
paid-in
|
|
Treasury
|
|
stock-based
|
|
(accumulated
|
|
comprehensive
|
|
interests in
|
|
Total
|
|
|
|
stock
|
|
stock
|
|
capital
|
|
stock
|
|
compensation
|
|
deficit)
|
|
loss
|
|
subsidiaries
|
|
equity
|
|
Beginning balance, January 1, 2015
|
|
243,416,979
|
|
$
|
3
|
|
$
|
3,385
|
|
$
|
(50)
|
|
$
|
(14)
|
|
$
|
(493)
|
|
$
|
(1,053)
|
|
$
|
173
|
|
$
|
1,951
|
|
Net income
|
|
—
|
|
|
—
|
|
|
—
|
|
|
—
|
|
|
—
|
|
|
93
|
|
|
—
|
|
|
33
|
|
|
126
|
|
Other comprehensive loss
|
|
—
|
|
|
—
|
|
|
—
|
|
|
—
|
|
|
—
|
|
|
—
|
|
|
(235)
|
|
|
(5)
|
|
|
(240)
|
|
Issuance of nonvested stock awards
|
|
—
|
|
|
—
|
|
|
19
|
|
|
—
|
|
|
(19)
|
|
|
—
|
|
|
—
|
|
|
—
|
|
|
—
|
|
Vesting of stock awards
|
|
1,037,743
|
|
|
—
|
|
|
7
|
|
|
—
|
|
|
—
|
|
|
—
|
|
|
—
|
|
|
—
|
|
|
7
|
|
Recognition of stock-based compensation
|
|
—
|
|
|
—
|
|
|
10
|
|
|
—
|
|
|
16
|
|
|
—
|
|
|
—
|
|
|
—
|
|
|
26
|
|
Repurchase and cancellation of stock awards
|
|
(304,340)
|
|
|
—
|
|
|
—
|
|
|
—
|
|
|
—
|
|
|
(7)
|
|
|
—
|
|
|
—
|
|
|
(7)
|
|
Stock options exercised
|
|
48,572
|
|
|
—
|
|
|
1
|
|
|
—
|
|
|
—
|
|
|
—
|
|
|
—
|
|
|
—
|
|
|
1
|
|
Dividends paid to noncontrolling interests
|
|
—
|
|
|
—
|
|
|
—
|
|
|
—
|
|
|
—
|
|
|
—
|
|
|
—
|
|
|
(14)
|
|
|
(14)
|
|
Excess tax benefit related to stock-based compensation
|
|
—
|
|
|
—
|
|
|
1
|
|
|
—
|
|
|
—
|
|
|
—
|
|
|
—
|
|
|
—
|
|
|
1
|
|
Cash paid for noncontrolling interest
|
|
—
|
|
|
—
|
|
|
(1)
|
|
|
—
|
|
|
—
|
|
|
—
|
|
|
—
|
|
|
—
|
|
|
(1)
|
|
Treasury stock repurchased
|
|
(7,118,928)
|
|
|
—
|
|
|
(15)
|
|
|
(85)
|
|
|
—
|
|
|
—
|
|
|
—
|
|
|
—
|
|
|
(100)
|
|
Dividends declared on common stock
|
|
—
|
|
|
—
|
|
|
—
|
|
|
—
|
|
|
—
|
|
|
(121)
|
|
|
—
|
|
|
—
|
|
|
(121)
|
|
Balance, December 31, 2015
|
|
237,080,026
|
|
|
3
|
|
|
3,407
|
|
|
(135)
|
|
|
(17)
|
|
|
(528)
|
|
|
(1,288)
|
|
|
187
|
|
|
1,629
|
|
Net income
|
|
—
|
|
|
—
|
|
|
—
|
|
|
—
|
|
|
—
|
|
|
326
|
|
|
—
|
|
|
31
|
|
|
357
|
|
Other comprehensive loss
|
|
—
|
|
|
—
|
|
|
—
|
|
|
—
|
|
|
—
|
|
|
—
|
|
|
(383)
|
|
|
(8)
|
|
|
(391)
|
|
Issuance of nonvested stock awards
|
|
—
|
|
|
—
|
|
|
16
|
|
|
—
|
|
|
(16)
|
|
|
—
|
|
|
—
|
|
|
—
|
|
|
—
|
|
Vesting of stock awards
|
|
914,081
|
|
|
—
|
|
|
2
|
|
|
—
|
|
|
—
|
|
|
—
|
|
|
—
|
|
|
—
|
|
|
2
|
|
Recognition of stock-based compensation
|
|
—
|
|
|
—
|
|
|
9
|
|
|
—
|
|
|
16
|
|
|
—
|
|
|
—
|
|
|
—
|
|
|
25
|
|
Repurchase and cancellation of stock awards
|
|
(256,468)
|
|
|
—
|
|
|
—
|
|
|
—
|
|
|
—
|
|
|
(3)
|
|
|
—
|
|
|
—
|
|
|
(3)
|
|
Stock options exercised
|
|
77,477
|
|
|
—
|
|
|
1
|
|
|
—
|
|
|
—
|
|
|
—
|
|
|
—
|
|
|
—
|
|
|
1
|
|
Dividends paid to noncontrolling interests
|
|
—
|
|
|
—
|
|
|
—
|
|
|
—
|
|
|
—
|
|
|
—
|
|
|
—
|
|
|
(30)
|
|
|
(30)
|
|
Excess tax benefit related to stock-based compensation
|
|
—
|
|
|
—
|
|
|
(3)
|
|
|
—
|
|
|
—
|
|
|
—
|
|
|
—
|
|
|
—
|
|
|
(3)
|
|
Treasury stock repurchased
|
|
(1,444,769)
|
|
|
—
|
|
|
15
|
|
|
(15)
|
|
|
—
|
|
|
—
|
|
|
—
|
|
|
—
|
|
|
—
|
|
Dividends declared on common stock
|
|
—
|
|
|
—
|
|
|
—
|
|
|
—
|
|
|
—
|
|
|
(120)
|
|
|
—
|
|
|
—
|
|
|
(120)
|
|
Balance, December 31, 2016
|
|
236,370,347
|
|
|
3
|
|
|
3,447
|
|
|
(150)
|
|
|
(17)
|
|
|
(325)
|
|
|
(1,671)
|
|
|
180
|
|
|
1,467
|
|
Net income
|
|
—
|
|
|
—
|
|
|
—
|
|
|
—
|
|
|
—
|
|
|
636
|
|
|
—
|
|
|
105
|
|
|
741
|
|
Other comprehensive income
|
|
—
|
|
|
—
|
|
|
—
|
|
|
—
|
|
|
—
|
|
|
—
|
|
|
403
|
|
|
(107)
|
|
|
296
|
|
Issuance of nonvested stock awards
|
|
—
|
|
|
—
|
|
|
18
|
|
|
—
|
|
|
(18)
|
|
|
—
|
|
|
—
|
|
|
—
|
|
|
—
|
|
Vesting of stock awards
|
|
1,316,975
|
|
|
—
|
|
|
8
|
|
|
—
|
|
|
—
|
|
|
—
|
|
|
—
|
|
|
—
|
|
|
8
|
|
Recognition of stock-based compensation
|
|
—
|
|
|
—
|
|
|
10
|
|
|
—
|
|
|
18
|
|
|
—
|
|
|
—
|
|
|
—
|
|
|
28
|
|
Repurchase and cancellation of stock awards
|
|
(402,978)
|
|
|
—
|
|
|
—
|
|
|
—
|
|
|
—
|
|
|
(12)
|
|
|
—
|
|
|
—
|
|
|
(12)
|
|
Contribution from noncontrolling interests
|
|
—
|
|
|
—
|
|
|
—
|
|
|
—
|
|
|
—
|
|
|
—
|
|
|
—
|
|
|
5
|
|
|
5
|
|
Dividends paid to noncontrolling interests
|
|
—
|
|
|
—
|
|
|
—
|
|
|
—
|
|
|
—
|
|
|
—
|
|
|
—
|
|
|
(34)
|
|
|
(34)
|
|
Disposition of a portion of P&A Business
|
|
—
|
|
|
—
|
|
|
413
|
|
|
—
|
|
|
—
|
|
|
—
|
|
|
—
|
|
|
—
|
|
|
413
|
|
Costs of the IPO and secondary offering of the P&A Business
|
|
—
|
|
|
—
|
|
|
(58)
|
|
|
—
|
|
|
—
|
|
|
—
|
|
|
—
|
|
|
—
|
|
|
(58)
|
|
Conversion of restricted awards to P&A Business awards
|
|
—
|
|
|
—
|
|
|
(2)
|
|
|
—
|
|
|
2
|
|
|
—
|
|
|
—
|
|
|
—
|
|
|
—
|
|
Noncontrolling interest from partial disposal of P&A Business
|
|
—
|
|
|
—
|
|
|
—
|
|
|
—
|
|
|
—
|
|
|
—
|
|
|
—
|
|
|
602
|
|
|
602
|
|
Stock options exercised
|
|
2,929,262
|
|
|
—
|
|
|
53
|
|
|
—
|
|
|
—
|
|
|
(18)
|
|
|
—
|
|
|
—
|
|
|
35
|
|
Dividends declared on common stock
|
|
—
|
|
|
—
|
|
|
—
|
|
|
—
|
|
|
—
|
|
|
(120)
|
|
|
—
|
|
|
—
|
|
|
(120)
|
|
Balance, December 31, 2017
|
|
240,213,606
|
|
$
|
3
|
|
$
|
3,889
|
|
$
|
(150)
|
|
$
|
(15)
|
|
$
|
161
|
|
$
|
(1,268)
|
|
$
|
751
|
|
$
|
3,371
|
See accompanying notes to consolidated financial statements.
HUNTSMAN CORPORATION AND SUBSIDIARIES
CONSOLIDATED STATEMENTS OF CASH FLOWS
(In Millions)
|
|
|
|
|
|
|
|
|
|
|
|
|
|
Year ended December 31,
|
|
|
|
2017
|
|
2016
|
|
2015
|
|
Operating Activities:
|
|
|
|
|
|
|
|
|
|
|
Net income
|
|
$
|
741
|
|
$
|
357
|
|
$
|
126
|
|
Less: (Income) loss from discontinued operations
|
|
|
(158)
|
|
|
8
|
|
|
302
|
|
Income from continuing operations
|
|
|
583
|
|
|
365
|
|
|
428
|
|
Adjustments to reconcile income from continuing operations to net cash provided by operating activities from continuing operations:
|
|
|
|
|
|
|
|
|
|
|
Equity in income of investment in unconsolidated affiliates
|
|
|
(13)
|
|
|
(5)
|
|
|
(6)
|
|
Depreciation and amortization
|
|
|
319
|
|
|
318
|
|
|
298
|
|
(Gain) loss on disposal of businesses/assets, net
|
|
|
(6)
|
|
|
(94)
|
|
|
5
|
|
Loss on early extinguishment of debt
|
|
|
54
|
|
|
3
|
|
|
31
|
|
Noncash interest expense
|
|
|
8
|
|
|
16
|
|
|
13
|
|
Noncash restructuring and impairment charges (credits)
|
|
|
1
|
|
|
(4)
|
|
|
7
|
|
Deferred income taxes
|
|
|
(55)
|
|
|
4
|
|
|
(18)
|
|
Noncash (gain) loss on foreign currency transactions
|
|
|
(5)
|
|
|
(2)
|
|
|
10
|
|
Stock-based compensation
|
|
|
36
|
|
|
32
|
|
|
29
|
|
Other, net
|
|
|
6
|
|
|
3
|
|
|
1
|
|
Changes in operating assets and liabilities:
|
|
|
|
|
|
|
|
|
|
|
Accounts and notes receivable
|
|
|
(183)
|
|
|
(25)
|
|
|
87
|
|
Inventories
|
|
|
(104)
|
|
|
177
|
|
|
84
|
|
Prepaid expenses
|
|
|
(11)
|
|
|
5
|
|
|
(10)
|
|
Other current assets
|
|
|
24
|
|
|
12
|
|
|
(74)
|
|
Other noncurrent assets
|
|
|
(60)
|
|
|
44
|
|
|
(100)
|
|
Accounts payable
|
|
|
154
|
|
|
46
|
|
|
(129)
|
|
Accrued liabilities
|
|
|
63
|
|
|
123
|
|
|
(35)
|
|
Other noncurrent liabilities
|
|
|
31
|
|
|
(44)
|
|
|
(7)
|
|
Net cash provided by operating activities from continuing operations
|
|
|
842
|
|
|
974
|
|
|
614
|
|
Net cash provided by (used in) operating activities from discontinued operations
|
|
|
377
|
|
|
114
|
|
|
(39)
|
|
Net cash provided by operating activities
|
|
|
1,219
|
|
|
1,088
|
|
|
575
|
|
|
|
|
|
|
|
|
|
|
|
|
Investing Activities:
|
|
|
|
|
|
|
|
|
|
|
Capital expenditures
|
|
|
(282)
|
|
|
(318)
|
|
|
(461)
|
|
Investment in unconsolidated affiliates
|
|
|
—
|
|
|
(1)
|
|
|
(12)
|
|
Acquisition of business, net of cash acquired
|
|
|
(14)
|
|
|
—
|
|
|
(14)
|
|
Proceeds from sale of businesses/assets
|
|
|
25
|
|
|
199
|
|
|
1
|
|
Cash received from purchase price adjustment for business acquired
|
|
|
—
|
|
|
—
|
|
|
18
|
|
Cash received from termination of cross-currency interest rate contracts
|
|
|
7
|
|
|
—
|
|
|
66
|
|
Change in restricted cash
|
|
|
—
|
|
|
1
|
|
|
(3)
|
|
Other, net
|
|
|
(1)
|
|
|
—
|
|
|
1
|
|
Net cash used in investing activities from continuing operations
|
|
|
(265)
|
|
|
(119)
|
|
|
(404)
|
|
Net cash used in investing activities from discontinued operations
|
|
|
(159)
|
|
|
(83)
|
|
|
(196)
|
|
Net cash used in investing activities
|
|
|
(424)
|
|
|
(202)
|
|
|
(600)
|
(continued)
HUNTSMAN CORPORATION AND SUBSIDIARIES
CONSOLIDATED STATEMENTS OF CASH FLOWS (Continued)
(In Millions)
|
|
|
|
|
|
|
|
|
|
|
|
|
|
|
|
|
|
|
|
|
|
|
|
|
|
|
|
Year ended December 31,
|
|
|
|
2017
|
|
2016
|
|
2015
|
|
Financing Activities:
|
|
|
|
|
|
|
|
|
|
|
Net repayments under revolving loan facilities
|
|
$
|
(41)
|
|
$
|
—
|
|
$
|
(1)
|
|
Net borrowings (repayments) on overdraft facilities
|
|
|
1
|
|
|
(1)
|
|
|
(8)
|
|
Repayments of short-term debt
|
|
|
(15)
|
|
|
(56)
|
|
|
—
|
|
Borrowings on short-term debt
|
|
|
8
|
|
|
10
|
|
|
12
|
|
Repayments of long-term debt
|
|
|
(2,058)
|
|
|
(1,070)
|
|
|
(604)
|
|
Proceeds from long-term debt of P&A Business
|
|
|
750
|
|
|
—
|
|
|
—
|
|
Proceeds from issuance of long-term debt
|
|
|
24
|
|
|
559
|
|
|
326
|
|
Repayments of notes payable
|
|
|
(27)
|
|
|
(33)
|
|
|
(33)
|
|
Borrowings on notes payable
|
|
|
31
|
|
|
31
|
|
|
34
|
|
Debt issuance costs paid
|
|
|
(21)
|
|
|
(9)
|
|
|
(8)
|
|
Call premiums related to early extinguishment of debt
|
|
|
—
|
|
|
(1)
|
|
|
(35)
|
|
Contingent consideration paid for acquisition
|
|
|
—
|
|
|
—
|
|
|
(4)
|
|
Dividends paid to noncontrolling interests
|
|
|
(34)
|
|
|
(30)
|
|
|
(14)
|
|
Contribution from noncontrolling interests
|
|
|
5
|
|
|
—
|
|
|
—
|
|
Dividends paid to common stockholders
|
|
|
(120)
|
|
|
(120)
|
|
|
(121)
|
|
Repurchase and cancellation of stock awards
|
|
|
(12)
|
|
|
(3)
|
|
|
(7)
|
|
Proceeds from issuance of common stock
|
|
|
35
|
|
|
1
|
|
|
1
|
|
Repurchase of common stock
|
|
|
—
|
|
|
—
|
|
|
(100)
|
|
Proceeds from the IPO and secondary offering of P&A Business
|
|
|
1,012
|
|
|
—
|
|
|
—
|
|
Cash paid for expenses of the IPO and secondary offering of P&A Business
|
|
|
(58)
|
|
|
—
|
|
|
—
|
|
Other, net
|
|
|
1
|
|
|
(1)
|
|
|
—
|
|
Net cash used in financing activities
|
|
|
(519)
|
|
|
(723)
|
|
|
(562)
|
|
Effect of exchange rate changes on cash
|
|
|
18
|
|
|
(6)
|
|
|
(16)
|
|
Increase in cash and cash equivalents
|
|
|
294
|
|
|
157
|
|
|
(603)
|
|
Cash and cash equivalents from continuing operations at beginning of period
|
|
|
385
|
|
|
236
|
|
|
825
|
|
Cash and cash equivalents from discontinued operations at beginning of period
|
|
|
29
|
|
|
21
|
|
|
35
|
|
Cash and cash equivalents at end of period
|
|
$
|
708
|
|
$
|
414
|
|
$
|
257
|
|
|
|
|
|
|
|
|
|
|
|
|
Supplemental cash flow information:
|
|
|
|
|
|
|
|
|
|
|
Cash paid for interest
|
|
$
|
175
|
|
$
|
205
|
|
$
|
225
|
|
Cash paid for income taxes
|
|
|
25
|
|
|
40
|
|
|
126
|
As of December 31, 2017, 2016 and 2015, the amount of capital expenditures in accounts payable was $51 million, $61 million and $53 million, respectively. In addition, as of December 31, 2017, the amount of cash interest and cash income taxes included in our supplemental cash flow information related to cash paid for interest and cash paid for income taxes that was paid by our former P&A Business after the IPO date was $6 million and $16 million, respectively.
See accompanying notes to consolidated financial statements.
REPORT OF INDEPENDENT REGISTERED PUBLIC ACCOUNTING FIRM
To the Board of Managers and Members of
Huntsman International LLC
Opinion on the Financial Statements
We have audited the accompanying consolidated balance sheets of Huntsman International LLC and subsidiaries (the "Company”) as of December 31, 2017 and 2016, the related consolidated statements of operations, comprehensive income (loss), equity, and cash flows for each of the three years in the period ended December 31, 2017, and the related notes and the schedule listed in the Index on page F-1 (collectively referred to as the “financial statements”). In our opinion, the consolidated financial statements present fairly, in all material respects, the financial position of the Company as of December 31, 2017 and 2016, and the results of its operations and its cash flows for each of the three years in the period ended December 31, 2017, in conformity with accounting principles generally accepted in the United States of America.
We have also audited, in accordance with the standards of the Public Company Accounting Oversight Board (United States) (PCAOB), the Company's internal control over financial reporting as of December 31, 2017, based on criteria established in Internal Control—Integrated Framework (2013) issued by the Committee of Sponsoring Organizations of the Treadway Commission and our report dated February 23, 2018, expressed an unqualified opinion on the Company's internal control over financial reporting.
Basis for Opinion
These financial statements are the responsibility of the Company's management. Our responsibility is to express an opinion on the Company’s financial statements based on our audits. We are a public accounting firm registered with the PCAOB and are required to be independent with respect to the Company in accordance with the U.S. federal securities laws and the applicable rules and regulations of the Securities and Exchange Commission and the PCAOB.
We conducted our audits in accordance with the standards of the PCAOB. Those standards require that we plan and perform the audit to obtain reasonable assurance about whether the financial statements are free of material misstatement, whether due to error or fraud. Our audits included performing procedures to assess the risks of material misstatement of the financial statements, whether due to error or fraud, and performing procedures that respond to those risks. Such procedures included examining, on a test basis, evidence regarding the amounts and disclosures in the financial statements. Our audits also included evaluating the accounting principles used and significant estimates made by management, as well as evaluating the overall presentation of the financial statements. We believe that our audits provide a reasonable basis for our opinion.
/s/ DELOITTE & TOUCHE LLP
Houston, Texas
February 23, 2018
We have served as the Company’s auditor since 1984.
HUNTSMAN INTERNATIONAL LLC AND SUBSIDIARIES
CONSOLIDATED BALANCE SHEETS
(In Millions, Except Unit Amounts)
|
|
|
|
|
|
|
|
|
|
|
December 31,
|
|
December 31,
|
|
|
|
2017
|
|
2016
|
|
ASSETS
|
|
|
|
|
|
|
|
Current assets:
|
|
|
|
|
|
|
|
Cash and cash equivalents(a)
|
|
$
|
468
|
|
$
|
384
|
|
Restricted cash(a)
|
|
|
11
|
|
|
11
|
|
Accounts and notes receivable (net of allowance for doubtful accounts of $25 and $23, respectively), ($334 and $328 pledged as collateral, respectively)(a)
|
|
|
1,255
|
|
|
1,168
|
|
Accounts receivable from affiliates
|
|
|
373
|
|
|
329
|
|
Inventories(a)
|
|
|
1,073
|
|
|
918
|
|
Prepaid expenses
|
|
|
59
|
|
|
49
|
|
Other current assets(a)
|
|
|
204
|
|
|
227
|
|
Current assets held for sale
|
|
|
2,880
|
|
|
777
|
|
Total current assets
|
|
|
6,323
|
|
|
3,863
|
|
Property, plant and equipment, net(a)
|
|
|
3,095
|
|
|
3,012
|
|
Investment in unconsolidated affiliates
|
|
|
266
|
|
|
248
|
|
Intangible assets, net(a)
|
|
|
56
|
|
|
43
|
|
Goodwill
|
|
|
140
|
|
|
121
|
|
Deferred income taxes
|
|
|
208
|
|
|
253
|
|
Other noncurrent assets(a)
|
|
|
497
|
|
|
472
|
|
Noncurrent assets held for sale
|
|
|
—
|
|
|
1,463
|
|
Total assets
|
|
$
|
10,585
|
|
$
|
9,475
|
|
|
|
|
|
|
|
|
|
LIABILITIES AND EQUITY
|
|
|
|
|
|
|
|
Current liabilities:
|
|
|
|
|
|
|
|
Accounts payable(a)
|
|
$
|
946
|
|
$
|
773
|
|
Accounts payable to affiliates
|
|
|
70
|
|
|
51
|
|
Accrued liabilities(a)
|
|
|
566
|
|
|
468
|
|
Notes payable to affiliates
|
|
|
100
|
|
|
100
|
|
Current portion of debt(a)
|
|
|
40
|
|
|
50
|
|
Current liabilities held for sale
|
|
|
1,692
|
|
|
467
|
|
Total current liabilities
|
|
|
3,414
|
|
|
1,909
|
|
Long-term debt(a)
|
|
|
2,258
|
|
|
4,122
|
|
Notes payable to affiliates
|
|
|
742
|
|
|
697
|
|
Deferred income taxes
|
|
|
265
|
|
|
367
|
|
Other noncurrent liabilities(a)
|
|
|
1,072
|
|
|
1,051
|
|
Noncurrent liabilities held for sale
|
|
|
—
|
|
|
393
|
|
Total liabilities
|
|
|
7,751
|
|
|
8,539
|
|
Commitments and contingencies (Notes 18 and 19)
|
|
|
|
|
|
|
|
Equity
|
|
|
|
|
|
|
|
Huntsman International LLC members’ equity:
|
|
|
|
|
|
|
|
Members’ equity, 2,728 units issued and outstanding
|
|
|
3,616
|
|
|
3,226
|
|
Accumulated deficit
|
|
|
(270)
|
|
|
(779)
|
|
Accumulated other comprehensive loss
|
|
|
(1,263)
|
|
|
(1,691)
|
|
Total Huntsman International LLC members’ equity
|
|
|
2,083
|
|
|
756
|
|
Noncontrolling interests in subsidiaries
|
|
|
751
|
|
|
180
|
|
Total equity
|
|
|
2,834
|
|
|
936
|
|
Total liabilities and equity
|
|
$
|
10,585
|
|
$
|
9,475
|
|
(a)
| |
At December 31, 2017 and December 31, 2016, respectively, $15 and $20 of cash and cash equivalents, $11 and $10 of restricted cash, $35 and $21 of accounts and notes receivable (net), $46 and $45 of inventories, $7 and $5 of other current assets, $283 and $279 of property, plant and equipment (net), $10 each of intangible assets (net), $43 and $37 of other noncurrent assets, $109 and $89 of accounts payable, $32 and $30 of accrued liabilities, $21 and $12 of current portion of debt, $86 and $114 of long‑term debt, and $98 and $76 of other noncurrent liabilities from consolidated variable interest entities are included in the respective Balance Sheet captions above. See “Note 7. Variable Interest Entities.” |
See accompanying notes to consolidated financial statements.
HUNTSMAN INTERNATIONAL LLC AND SUBSIDIARIES
CONSOLIDATED STATEMENTS OF OPERATIONS
(In Millions)
|
|
|
|
|
|
|
|
|
|
|
|
|
|
Year ended December 31,
|
|
|
|
2017
|
|
2016
|
|
2015
|
|
Revenues:
|
|
|
|
|
|
|
|
|
|
|
Trade sales, services and fees, net
|
|
$
|
8,208
|
|
$
|
7,387
|
|
$
|
8,008
|
|
Related party sales
|
|
|
150
|
|
|
131
|
|
|
131
|
|
Total revenues
|
|
|
8,358
|
|
|
7,518
|
|
|
8,139
|
|
Cost of goods sold
|
|
|
6,543
|
|
|
5,988
|
|
|
6,401
|
|
Gross profit
|
|
|
1,815
|
|
|
1,530
|
|
|
1,738
|
|
Operating expenses:
|
|
|
|
|
|
|
|
|
|
|
Selling, general and administrative
|
|
|
793
|
|
|
764
|
|
|
786
|
|
Research and development
|
|
|
138
|
|
|
137
|
|
|
143
|
|
Restructuring, impairment and plant closing costs
|
|
|
20
|
|
|
47
|
|
|
83
|
|
Merger costs
|
|
|
28
|
|
|
—
|
|
|
—
|
|
Other operating (income) expense, net
|
|
|
(23)
|
|
|
(101)
|
|
|
1
|
|
Total operating expenses
|
|
|
956
|
|
|
847
|
|
|
1,013
|
|
Operating income
|
|
|
859
|
|
|
683
|
|
|
725
|
|
Interest expense
|
|
|
(181)
|
|
|
(215)
|
|
|
(214)
|
|
Equity in income of investment in unconsolidated affiliates
|
|
|
13
|
|
|
5
|
|
|
6
|
|
Loss on early extinguishment of debt
|
|
|
(54)
|
|
|
(3)
|
|
|
(31)
|
|
Other income, net
|
|
|
3
|
|
|
5
|
|
|
7
|
|
Income from continuing operations before income taxes
|
|
|
640
|
|
|
475
|
|
|
493
|
|
Income tax expense
|
|
|
(61)
|
|
|
(108)
|
|
|
(59)
|
|
Income from continuing operations
|
|
|
579
|
|
|
367
|
|
|
434
|
|
Income (loss) from discontinued operations, net of tax
|
|
|
155
|
|
|
(13)
|
|
|
(307)
|
|
Net income
|
|
|
734
|
|
|
354
|
|
|
127
|
|
Net income attributable to noncontrolling interests
|
|
|
(105)
|
|
|
(31)
|
|
|
(33)
|
|
Net income attributable to Huntsman International LLC
|
|
$
|
629
|
|
$
|
323
|
|
$
|
94
|
See accompanying notes to consolidated financial statements.
HUNTSMAN INTERNATIONAL LLC AND SUBSIDIARIES
CONSOLIDATED STATEMENTS OF COMPREHENSIVE INCOME (LOSS)
(In Millions)
|
|
|
|
|
|
|
|
|
|
|
|
|
|
|
|
|
|
|
|
|
|
|
|
|
|
Year ended December 31,
|
|
|
|
2017
|
|
2016
|
|
2015
|
|
Net income
|
|
$
|
734
|
|
$
|
354
|
|
$
|
127
|
|
Other comprehensive income (loss), net of tax:
|
|
|
|
|
|
|
|
|
|
|
Foreign currency translations adjustment
|
|
|
210
|
|
|
(170)
|
|
|
(314)
|
|
Pension and other postretirement benefits adjustments
|
|
|
112
|
|
|
(212)
|
|
|
73
|
|
Other, net
|
|
|
(1)
|
|
|
(1)
|
|
|
7
|
|
Other comprehensive income (loss), net of tax
|
|
|
321
|
|
|
(383)
|
|
|
(234)
|
|
Comprehensive income (loss)
|
|
|
1,055
|
|
|
(29)
|
|
|
(107)
|
|
Comprehensive income attributable to noncontrolling interests
|
|
|
(127)
|
|
|
(23)
|
|
|
(28)
|
|
Comprehensive income (loss) attributable to Huntsman International LLC
|
|
$
|
928
|
|
$
|
(52)
|
|
$
|
(135)
|
See accompanying notes to consolidated financial statements.
HUNTSMAN INTERNATIONAL LLC AND SUBSIDIARIES
CONSOLIDATED STATEMENTS OF EQUITY
(In Millions, Except Unit Amounts)
|
|
|
|
|
|
|
|
|
|
|
|
|
|
|
|
|
|
|
|
|
|
Huntsman International LLC Members
|
|
|
|
|
|
|
|
|
|
|
|
|
|
|
|
|
|
Accumulated
|
|
|
|
|
|
|
|
|
|
|
|
|
|
|
|
|
|
other
|
|
Noncontrolling
|
|
|
|
|
|
|
Members’ equity
|
|
Accumulated
|
|
comprehensive
|
|
interests in
|
|
Total
|
|
|
|
Units
|
|
Amount
|
|
deficit
|
|
loss
|
|
subsidiaries
|
|
equity
|
|
Beginning balance, January 1, 2015
|
|
2,728
|
|
$
|
3,166
|
|
$
|
(956)
|
|
$
|
(1,087)
|
|
$
|
173
|
|
$
|
1,296
|
|
Net income
|
|
—
|
|
|
—
|
|
|
94
|
|
|
—
|
|
|
33
|
|
|
127
|
|
Dividends paid to parent
|
|
—
|
|
|
—
|
|
|
(121)
|
|
|
—
|
|
|
—
|
|
|
(121)
|
|
Other comprehensive income
|
|
—
|
|
|
—
|
|
|
—
|
|
|
(229)
|
|
|
(5)
|
|
|
(234)
|
|
Contribution from parent
|
|
—
|
|
|
29
|
|
|
—
|
|
|
—
|
|
|
—
|
|
|
29
|
|
Dividends paid to noncontrolling interests
|
|
—
|
|
|
—
|
|
|
—
|
|
|
—
|
|
|
(14)
|
|
|
(14)
|
|
Excess tax benefit related to stock‑based compensation
|
|
—
|
|
|
1
|
|
|
—
|
|
|
—
|
|
|
—
|
|
|
1
|
|
Balance, December 31, 2015
|
|
2,728
|
|
|
3,196
|
|
|
(983)
|
|
|
(1,316)
|
|
|
187
|
|
|
1,084
|
|
Net income
|
|
—
|
|
|
—
|
|
|
323
|
|
|
—
|
|
|
31
|
|
|
354
|
|
Dividends paid to parent
|
|
—
|
|
|
—
|
|
|
(119)
|
|
|
—
|
|
|
—
|
|
|
(119)
|
|
Other comprehensive income
|
|
—
|
|
|
—
|
|
|
—
|
|
|
(375)
|
|
|
(8)
|
|
|
(383)
|
|
Contribution from parent
|
|
—
|
|
|
33
|
|
|
—
|
|
|
—
|
|
|
—
|
|
|
33
|
|
Dividends paid to noncontrolling interests
|
|
—
|
|
|
—
|
|
|
—
|
|
|
—
|
|
|
(30)
|
|
|
(30)
|
|
Excess tax benefit related to stock‑based compensation
|
|
—
|
|
|
(3)
|
|
|
—
|
|
|
—
|
|
|
—
|
|
|
(3)
|
|
Balance, December 31, 2016
|
|
2,728
|
|
|
3,226
|
|
|
(779)
|
|
|
(1,691)
|
|
|
180
|
|
|
936
|
|
Net income
|
|
—
|
|
|
—
|
|
|
629
|
|
|
—
|
|
|
105
|
|
|
734
|
|
Dividends paid to parent
|
|
—
|
|
|
—
|
|
|
(120)
|
|
|
—
|
|
|
—
|
|
|
(120)
|
|
Other comprehensive income
|
|
—
|
|
|
—
|
|
|
—
|
|
|
428
|
|
|
(107)
|
|
|
321
|
|
Contribution from parent
|
|
—
|
|
|
35
|
|
|
—
|
|
|
—
|
|
|
—
|
|
|
35
|
|
Contribution from noncontrolling interests
|
|
—
|
|
|
—
|
|
|
—
|
|
|
—
|
|
|
5
|
|
|
5
|
|
Dividends paid to noncontrolling interests
|
|
—
|
|
|
—
|
|
|
—
|
|
|
—
|
|
|
(34)
|
|
|
(34)
|
|
Disposition of a portion of P&A Business
|
|
—
|
|
|
413
|
|
|
—
|
|
|
—
|
|
|
—
|
|
|
413
|
|
Costs of the IPO and secondary offering of the P&A Business
|
|
—
|
|
|
(58)
|
|
|
—
|
|
|
—
|
|
|
—
|
|
|
(58)
|
|
Noncontrolling interest from partial disposal of P&A Business
|
|
—
|
|
|
—
|
|
|
—
|
|
|
—
|
|
|
602
|
|
|
602
|
|
Balance, December 31, 2017
|
|
2,728
|
|
$
|
3,616
|
|
$
|
(270)
|
|
$
|
(1,263)
|
|
$
|
751
|
|
$
|
2,834
|
See accompanying notes to consolidated financial statements.
HUNTSMAN INTERNATIONAL LLC AND SUBSIDIARIES
CONSOLIDATED STATEMENTS OF CASH FLOWS
(In Millions)
|
|
|
|
|
|
|
|
|
|
|
|
|
|
|
|
|
|
|
|
|
|
|
|
|
|
|
|
Year ended December 31,
|
|
|
|
2017
|
|
2016
|
|
2015
|
|
Operating Activities:
|
|
|
|
|
|
|
|
|
|
|
Net income
|
|
$
|
734
|
|
$
|
354
|
|
$
|
127
|
|
Less: (Income) loss from discontinued operations
|
|
|
(155)
|
|
|
13
|
|
|
307
|
|
Income from continuing operations
|
|
|
579
|
|
|
367
|
|
|
434
|
|
Adjustments to reconcile income from continuing operations to net cash provided by operating activities from continuing operations:
|
|
|
|
|
|
|
|
|
|
|
Equity in income of investment in unconsolidated affiliates
|
|
|
(13)
|
|
|
(5)
|
|
|
(6)
|
|
Depreciation and amortization
|
|
|
311
|
|
|
306
|
|
|
286
|
|
(Gain) loss on disposal of businesses/assets, net
|
|
|
(6)
|
|
|
(94)
|
|
|
5
|
|
Loss on early extinguishment of debt
|
|
|
54
|
|
|
3
|
|
|
31
|
|
Noncash interest expense
|
|
|
25
|
|
|
27
|
|
|
22
|
|
Noncash restructuring and impairment charges (credits)
|
|
|
1
|
|
|
(4)
|
|
|
7
|
|
Deferred income taxes
|
|
|
(50)
|
|
|
3
|
|
|
(17)
|
|
Noncash (gain) loss on foreign currency transactions
|
|
|
(5)
|
|
|
(2)
|
|
|
10
|
|
Noncash compensation
|
|
|
35
|
|
|
31
|
|
|
28
|
|
Other, net
|
|
|
7
|
|
|
1
|
|
|
2
|
|
Changes in operating assets and liabilities:
|
|
|
|
|
|
|
|
|
|
|
Accounts and notes receivable
|
|
|
(181)
|
|
|
(25)
|
|
|
87
|
|
Inventories
|
|
|
(104)
|
|
|
177
|
|
|
84
|
|
Prepaid expenses
|
|
|
(10)
|
|
|
5
|
|
|
(10)
|
|
Other current assets
|
|
|
21
|
|
|
12
|
|
|
(76)
|
|
Other noncurrent assets
|
|
|
(60)
|
|
|
44
|
|
|
(100)
|
|
Accounts payable
|
|
|
138
|
|
|
35
|
|
|
(138)
|
|
Accrued liabilities
|
|
|
57
|
|
|
123
|
|
|
(35)
|
|
Other noncurrent liabilities
|
|
|
37
|
|
|
(36)
|
|
|
—
|
|
Net cash provided by operating activities from continuing operations
|
|
|
836
|
|
|
968
|
|
|
614
|
|
Net cash provided by (used in) operating activities from discontinued operations
|
|
|
372
|
|
|
110
|
|
|
(44)
|
|
Net cash provided by operating activities
|
|
|
1,208
|
|
|
1,078
|
|
|
570
|
|
|
|
|
|
|
|
|
|
|
|
|
Investing Activities:
|
|
|
|
|
|
|
|
|
|
|
Capital expenditures
|
|
|
(282)
|
|
|
(318)
|
|
|
(461)
|
|
Investment in unconsolidated affiliates
|
|
|
—
|
|
|
(1)
|
|
|
(12)
|
|
Acquisition of business, net of cash acquired
|
|
|
(14)
|
|
|
—
|
|
|
(14)
|
|
Proceeds from sale of businesses/assets
|
|
|
25
|
|
|
199
|
|
|
1
|
|
(Increase) decrease in receivable from affiliate
|
|
|
(15)
|
|
|
6
|
|
|
1
|
|
Cash received from purchase price adjustment for business acquired
|
|
|
—
|
|
|
—
|
|
|
18
|
|
Cash received from termination of cross-currency interest rate contracts
|
|
|
7
|
|
|
—
|
|
|
66
|
|
Change in restricted cash
|
|
|
—
|
|
|
1
|
|
|
(3)
|
|
Other, net
|
|
|
—
|
|
|
1
|
|
|
1
|
|
Net cash used in investing activities from continuing operations
|
|
|
(279)
|
|
|
(112)
|
|
|
(403)
|
|
Net cash used in investing activities from discontinued operations
|
|
|
(159)
|
|
|
(83)
|
|
|
(196)
|
|
Net cash used in investing activities
|
|
|
(438)
|
|
|
(195)
|
|
|
(599)
|
(continued)
HUNTSMAN INTERNATIONAL LLC AND SUBSIDIARIES
CONSOLIDATED STATEMENTS OF CASH FLOWS (Continued)
(In Millions)
|
|
|
|
|
|
|
|
|
|
|
|
|
|
|
|
|
|
|
|
|
|
|
|
|
|
|
|
Year ended December 31,
|
|
|
|
2017
|
|
2016
|
|
2015
|
|
Financing Activities:
|
|
|
|
|
|
|
|
|
|
|
Net repayments under revolving loan facilities
|
|
$
|
(41)
|
|
$
|
—
|
|
$
|
(1)
|
|
Net borrowings (repayments) on overdraft facilities
|
|
|
1
|
|
|
(1)
|
|
|
(8)
|
|
Repayments of short-term debt
|
|
|
(15)
|
|
|
(56)
|
|
|
—
|
|
Borrowings on short-term debt
|
|
|
8
|
|
|
10
|
|
|
12
|
|
Repayments of long-term debt
|
|
|
(2,058)
|
|
|
(1,070)
|
|
|
(604)
|
|
Proceeds from long-term debt of P&A Business
|
|
|
750
|
|
|
—
|
|
|
—
|
|
Proceeds from issuance of long-term debt
|
|
|
24
|
|
|
559
|
|
|
326
|
|
Repayments of notes payable to affiliate
|
|
|
—
|
|
|
(1)
|
|
|
(148)
|
|
Proceeds from issuance of notes payable to affiliate
|
|
|
47
|
|
|
—
|
|
|
195
|
|
Repayments of notes payable
|
|
|
(27)
|
|
|
(33)
|
|
|
(33)
|
|
Borrowings on notes payable
|
|
|
31
|
|
|
31
|
|
|
34
|
|
Debt issuance costs paid
|
|
|
(21)
|
|
|
(9)
|
|
|
(8)
|
|
Call premiums related to early extinguishment of debt
|
|
|
—
|
|
|
(1)
|
|
|
(35)
|
|
Contingent consideration paid for acquisition
|
|
|
—
|
|
|
—
|
|
|
(4)
|
|
Dividends paid to noncontrolling interests
|
|
|
(34)
|
|
|
(30)
|
|
|
(14)
|
|
Contribution from noncontrolling interests
|
|
|
5
|
|
|
—
|
|
|
—
|
|
Dividends paid to parent
|
|
|
(120)
|
|
|
(119)
|
|
|
(121)
|
|
Proceeds from the IPO and secondary offering of P&A Business
|
|
|
1,012
|
|
|
—
|
|
|
—
|
|
Cash paid for expenses of the IPO and secondary offering of P&A Business
|
|
|
(58)
|
|
|
—
|
|
|
—
|
|
Other, net
|
|
|
1
|
|
|
(1)
|
|
|
1
|
|
Net cash used in financing activities
|
|
|
(495)
|
|
|
(721)
|
|
|
(408)
|
|
Effect of exchange rate changes on cash
|
|
|
18
|
|
|
(6)
|
|
|
(16)
|
|
Increase in cash and cash equivalents
|
|
|
293
|
|
|
156
|
|
|
(453)
|
|
Cash and cash equivalents from continuing operations at beginning of period
|
|
|
384
|
|
|
236
|
|
|
675
|
|
Cash and cash equivalents from discontinued operations at beginning of period
|
|
|
29
|
|
|
21
|
|
|
35
|
|
Cash and cash equivalents at end of period
|
|
$
|
706
|
|
$
|
413
|
|
$
|
257
|
|
|
|
|
|
|
|
|
|
|
|
|
Supplemental cash flow information:
|
|
|
|
|
|
|
|
|
|
|
Cash paid for interest
|
|
$
|
175
|
|
$
|
139
|
|
$
|
225
|
|
Cash paid for income taxes
|
|
|
25
|
|
|
40
|
|
|
126
|
As of December 31, 2017, 2016 and 2015, the amount of capital expenditures in accounts payable was $51 million, $61 million and $53 million, respectively. During the years ended 2017, 2016 and 2015, Huntsman Corporation contributed $35 million, $31 million and $28 million, respectively, related to stock-based compensation for continuing operations. In addition, as of December 31, 2017, the amount of cash interest and cash income taxes included in our supplemental cash flow information related to cash paid for interest and cash paid for income taxes that was paid by our former P&A Business after the IPO date was $6 million and $16 million, respectively.
See accompanying notes to consolidated financial statements.
Table of Contents
HUNTSMAN CORPORATION AND SUBSIDIARIES
HUNTSMAN INTERNATIONAL LLC AND SUBSIDIARIES
NOTES TO CONSOLIDATED FINANCIAL STATEMENTS
1. GENERAL
Definitions
For convenience in this report, the terms “Company,” “our” or “we” may be used to refer to Huntsman Corporation and, unless the context otherwise requires, its subsidiaries and predecessors. Any references to the “Company” “we” “us” or “our” as of a date prior to October 19, 2004 (the date of our Company’s formation) are to Huntsman Holdings, LLC and its subsidiaries (including their respective predecessors). In this report, “Huntsman International” refers to Huntsman International LLC (our 100% owned subsidiary) and, unless the context otherwise requires, its subsidiaries; “AAC” refers to Arabian Amines Company, our consolidated manufacturing joint venture with the Zamil Group; “HPS” refers to Huntsman Polyurethanes Shanghai Ltd. (our consolidated splitting joint venture with Shanghai Chlor-Alkali Chemical Company, Ltd); “Sasol-Huntsman” refers to Sasol-Huntsman GmbH and Co. KG (our consolidated joint venture with Sasol that owns and operates a maleic anhydride facility in Moers, Germany); and “SLIC” refers to Shanghai Liengheng Isocyanate Company (our unconsolidated manufacturing joint venture with BASF and three Chinese chemical companies).
In this report, we may use, without definition, the common names of competitors or other industry participants. We may also use the common names or abbreviations for certain chemicals or products.
Description of Business
We are a global manufacturer of differentiated organic chemical products. Our products comprise a broad range of chemicals and formulations, which we market globally to a diversified group of consumer and industrial customers. Our products are used in a wide range of applications, including those in the adhesives, aerospace, automotive, construction products, personal care and hygiene, durable and non‑durable consumer products, digital inks, electronics, medical, packaging, coatings and construction, power generation, refining, synthetic fiber, textile chemicals and dye industries. We are a leading global producer in many of our key product lines, including MDI, amines, surfactants, maleic anhydride, epoxy‑based polymer formulations, textile chemicals and dyes.
We operate in four segments: Polyurethanes, Performance Products, Advanced Materials and Textile Effects. In August 2017, we separated the P&A Business through an IPO of ordinary shares of Venator. Beginning in the third quarter of 2017, we reported the results of the former P&A Business as discontinued operations. See “Note 3. Discontinued Operations and Business Dispositions—Separation of P&A Business.” In a series of transactions beginning in 2006, we sold or shutdown substantially all of our Australian styrenics operations and our North American polymers and base chemicals operations. We also report the results of these businesses as discontinued operations.
Company
Our Company, a Delaware corporation, was formed in 2004 to hold the Huntsman businesses, which were founded by Jon M. Huntsman. Mr. Huntsman founded the predecessor to our Company in 1970 as a small polystyrene plastics packaging company. Since then, we have grown through a series of significant acquisitions and now own a global portfolio of businesses. Jon M. Huntsman served as the Executive Chairman of our Company until December 31, 2017, at which time Peter Huntsman, our Chief Executive Officer, was appointed to the role of Chairman of the Board. Jon M. Huntsman served as Director and Chairman Emeritus until his passing on February 2, 2018.
Currently, we operate all of our businesses through Huntsman International, our 100% owned subsidiary. Huntsman International is a Delaware limited liability company and was formed in 1999.
Recent Developments
Separation of the P&A Business
In August 2017, we separated the P&A Business and conducted an IPO of ordinary shares of Venator, formerly a wholly-owned subsidiary of Huntsman. Additionally, in December 2017, we conducted a secondary offering of Venator ordinary shares. All of such ordinary shares were sold by Huntsman, and Venator did not receive any proceeds
Table of Contents
HUNTSMAN CORPORATION AND SUBSIDIARIES
HUNTSMAN INTERNATIONAL LLC AND SUBSIDIARIES
NOTES TO CONSOLIDATED FINANCIAL STATEMENTS (Continued)
from the offerings. Venator’s ordinary shares began trading on The New York Stock Exchange under the symbol “VNTR” on August 3, 2017. As of December 31, 2017, Huntsman retained approximately 55% ownership in Venator. On January 3, 2018, the underwriters purchased an additional 1,948,955 Venator ordinary shares pursuant to their over-allotment option, which reduced Huntsman’s ownership interest in Venator to approximately 53%. Beginning in the third quarter of 2017, we reported the results of operations of the P&A Business as discontinued operations. For more information, see “Note 3. Discontinued Operations and Business Dispositions—Separation of P&A Business.”
Prepayment of Debt
In August 2017, we made early prepayments of $1,207 million on our Senior Credit Facilities, of which $106 million was paid on our 2015 Extended Term Loan B, $347 million was paid on our 2021 Term Loan B, and $754 million was paid on our 2023 Term Loan B. The funds used to pay down the debt included $732 million received from Venator ($750 million of debt raised by Venator, net of $18 million of debt issuance costs), upon its payment of intercompany debt obligations owed to Huntsman, and $475 million from proceeds of the Venator IPO. In connection with the $1,207 million prepayments of our term loans, we recognized a loss on early extinguishment of debt of $34 million. Additionally, in December 2017, we repaid in full the remaining $511 million on our 2023 Term Loan B using the funds raised from the secondary offering and existing cash and recognized a loss on early extinguishment of debt of $15 million. See “Note 13. Debt—Direct and Subsidiary Debt—Senior Credit Facilities.”
With available free cash flow, the net proceeds from the sale of our investment in the P&A business and cash from the repayment of related intercompany indebtedness as described above, we repaid $2.1 billion of debt during the full year 2017 and believe we achieved investment grade-type leverage metrics at year end. See “Note 13. Debt—Direct and Subsidiary Debt—Senior Credit Facilities.”
Termination of Huntsman and Clariant Merger Agreement
As previously disclosed, on May 21, 2017, Huntsman and Clariant entered into a merger agreement. On October 26, 2017, Huntsman and Clariant entered into a termination agreement pursuant to which the parties mutually terminated the merger agreement. No fees are payable under the terms of the termination agreement at this time. Huntsman and Clariant also agreed to release each other from claims and liabilities arising out of or related to the merger agreement or the transactions contemplated thereby. Pursuant to the termination agreement, each party agreed to bear its own costs, fees and expenses in connection with the merger agreement and the transaction costs contemplated thereby, except for specified joint filing fees and related expenses as set forth in the merger agreement. During the years ended December 31, 2017, 2016 and 2015, we incurred merger-related costs of $28 million, nil and nil, respectively.
U.S. Tax Reform Act
On December 22, 2017, the U.S. Tax Reform Act was signed into law. The U.S.Tax Reform Act significantly revised the U.S. corporate income tax regime by, among other things, lowering the U.S. corporate tax rate from 35% to 21%, effective January 1, 2018, repealing the deduction for domestic production activities and imposing a repatriation tax on deemed repatriated earnings of foreign subsidiaries.
As a result of the U.S. Tax Reform Act, the Company recorded a provisional tax benefit of $137 million due to a remeasurement of deferred tax assets and liabilities and a provisional tax expense of $85 million due to the transition tax on deemed repatriation of deferred foreign income. Absent the Venator offering and certain tax related restructuring transactions, our provisional transition tax liability on deemed repatriation of deferred foreign income would have been $12 million.
Share Repurchase Program
On February 7, 2018, our Board of Directors authorized our Company to repurchase up to $400 million in shares of our common stock in addition to the $50 million remaining under our September 2015 share repurchase authorization. Repurchases may be made through the open market or in privately negotiated transactions, and repurchases may be commenced or suspended from time to time without prior notice. Shares of common stock acquired through the repurchase program are held in treasury at cost.
Table of Contents
HUNTSMAN CORPORATION AND SUBSIDIARIES
HUNTSMAN INTERNATIONAL LLC AND SUBSIDIARIES
NOTES TO CONSOLIDATED FINANCIAL STATEMENTS (Continued)
Huntsman Coproration and Huntsman International Financial Statements
Except where otherwise indicated, these notes relate to the consolidated financial statements for both our Company and Huntsman International. The differences between our consolidated financial statements and Huntsman International’s consolidated financial statements relate primarily to the following:
|
·
| |
purchase accounting recorded at our Company for the 2003 step‑acquisition of Huntsman International Holdings LLC, the former parent company of Huntsman International that was merged into Huntsman International in 2005; |
|
·
| |
the different capital structures; and |
|
·
| |
a note payable from Huntsman International to us. |
2. SUMMARY OF SIGNIFICANT ACCOUNTING POLICIES
Asset Retirement Obligations
We accrue for asset retirement obligations, which consist primarily of landfill capping, closure and post‑closure costs, asbestos abatement costs, demolition and removal costs and leasehold remediation costs, in the period in which the obligations are incurred. Asset retirement obligations are accrued at estimated fair value. When the liability is initially recorded, we capitalize the cost by increasing the carrying amount of the related long‑lived asset. Over time, the liability is accreted to its estimated settlement value and the capitalized cost is depreciated over the useful life of the related asset. Upon settlement of the liability, we will recognize a gain or loss for any difference between the settlement amount and the liability recorded. Asset retirement obligations were $9 million and $8 million at December 31, 2017 and 2016, respectively.
Carrying Value of Long‑Lived Assets
We review long‑lived assets and all amortizable intangible assets for impairment whenever events or changes in circumstances indicate that the carrying amount of these assets may not be recoverable. Recoverability is based upon current and anticipated undiscounted cash flows, and we recognize an impairment when such estimated cash flows are less than the carrying value of the asset. Measurement of the amount of impairment, if any, is based upon the difference between carrying value and fair value. Fair value is generally estimated by discounting estimated future cash flows using a discount rate commensurate with the risks involved or selling price of assets held for sale. See “Note 11. Restructuring, Impairment and Plant Closing Costs.”
Cash and Cash Equivalents
We consider cash in checking accounts and cash in short‑term highly liquid investments with remaining maturities of three months or less at the date of purchase, to be cash and cash equivalents. Cash flows from financing activities from discontinued operations are not presented separately in our consolidated statements of cash flows.
Cost of Goods Sold
We classify the costs of manufacturing and distributing our products as cost of goods sold. Manufacturing costs include variable costs, primarily raw materials and energy, and fixed expenses directly associated with production. Manufacturing costs also include, among other things, plant site operating costs and overhead (including depreciation), production planning and logistics costs, repair and maintenance costs, plant site purchasing costs, and engineering and technical support costs. Distribution, freight and warehousing costs are also included in cost of goods sold.
Derivatives and Hedging Activities
All derivatives, whether designated in hedging relationships or not, are recorded on our balance sheet at fair value. If the derivative is designated as a fair value hedge, the changes in the fair value of the derivative and the hedged items are recognized in earnings. If the derivative is designated as a cash flow hedge, changes in the fair value of the
Table of Contents
HUNTSMAN CORPORATION AND SUBSIDIARIES
HUNTSMAN INTERNATIONAL LLC AND SUBSIDIARIES
NOTES TO CONSOLIDATED FINANCIAL STATEMENTS (Continued)
derivative are recorded in accumulated other comprehensive loss, to the extent effective, and will be recognized in the income statement when the hedged item affects earnings. Changes in the fair value of the hedge in the net investment of certain international operations are recorded in other comprehensive income (loss), to the extent effective. The effectiveness of a cash flow hedging relationship is established at the inception of the hedge, and after inception we perform effectiveness assessments at least every three months. A derivative designated as a cash flow hedge is determined to be effective if the change in value of the hedge divided by the change in value of the hedged item is within a range of 80% to 125%. Hedge ineffectiveness in a cash flow hedge occurs only if the cumulative gain or loss on the derivative hedging instrument exceeds the cumulative change in the expected future cash flows on the hedged transaction. For a derivative that does not qualify or has not been designated as a hedge, changes in fair value are recognized in earnings.
Environmental Expenditures
Environmental related restoration and remediation costs are recorded as liabilities when site restoration and environmental remediation and clean‑up obligations are either known or considered probable and the related costs can be reasonably estimated. Other environmental expenditures that are principally maintenance or preventative in nature are recorded when expended and incurred and are expensed or capitalized as appropriate. See “Note 19. Environmental, Health and Safety Matters.”
Foreign Currency Translation
The accounts of our operating subsidiaries outside of the U.S., unless they are operating in highly inflationary economic environments, consider the functional currency to be the currency of the economic environment in which they operate. Accordingly, assets and liabilities are translated at rates prevailing at the balance sheet date. Revenues, expenses, gains and losses are translated at a weighted average rate for the period. Cumulative translation adjustments are recorded to equity as a component of accumulated other comprehensive loss.
If a subsidiary operates in an economic environment that is considered to be highly inflationary (100% cumulative inflation over a three-year period), the U.S. dollar is considered to be the functional currency and gains and losses from remeasurement to the U.S. dollar from the local currency are included in the statement of operations. Where a subsidiary’s operations are effectively run, managed, financed and contracted in U.S. dollars, such as certain finance subsidiaries outside of the U.S., the U.S. dollar is considered to be the functional currency.
Foreign currency transaction gains and losses are recorded in other operating (income) expense, net in our consolidated statements of operations and were (gains) losses of $(5) million, $(2) million and $10 million for the years ended December 31, 2017, 2016 and 2015, respectively.
Income Taxes
We use the asset and liability method of accounting for income taxes. Deferred income taxes reflect the net tax effects of temporary differences between the carrying amounts of assets and liabilities for financial and tax reporting purposes. We evaluate deferred tax assets to determine whether it is more likely than not that they will be realized. Valuation allowances are reviewed on a tax jurisdiction basis to analyze whether there is sufficient positive or negative evidence to support a change in judgment about the realizability of the related deferred tax assets for each jurisdiction. These conclusions require significant judgment. In evaluating the objective evidence that historical results provide, we consider the cyclicality of businesses and cumulative income or losses during the applicable period. Cumulative losses incurred over the period limits our ability to consider other subjective evidence such as our projections for the future. Changes in expected future income in applicable jurisdictions could affect the realization of deferred tax assets in those jurisdictions.
On December 22, 2017, the U.S. Tax Reform Act was signed into law. The U.S. Tax Reform Act significantly revised the U.S. corporate income tax regime by, among other things, lowering the U.S. corporate tax rate from 35% to 21%, effective January 1, 2018, repealing the deduction for domestic production activities and imposing a repatriation tax on deemed repatriated earnings of foreign subsidiaries.
Table of Contents
HUNTSMAN CORPORATION AND SUBSIDIARIES
HUNTSMAN INTERNATIONAL LLC AND SUBSIDIARIES
NOTES TO CONSOLIDATED FINANCIAL STATEMENTS (Continued)
As a result of the U.S. Tax Reform Act, the Company recorded a provisional tax benefit of $137 million due to a remeasurement of deferred tax assets and liabilities and a provisional tax expense of $85 million due to the transition tax on deemed repatriation of deferred foreign income. Absent the Venator offering and certain tax related restructuring transactions, our provisional transition tax liability on deemed repatriation of deferred foreign income would have been $12 million.
Both the tax benefit and the tax charge represent provisional amounts and our current best estimates. Any adjustments recorded to the provisional amounts through calendar year 2018 will be included in income as an adjustment to tax expense in the period of the adjustment. The provisional amounts incorporate assumptions made based upon available information and our current interpretation of the U.S. Tax Reform Act and may change as we receive additional implementation guidance and as we further refine our calculations with additional information.
Accounting for uncertainty in income taxes prescribes a recognition threshold and measurement attribute for the financial statement recognition and measurement of a tax position taken or expected to be taken in a tax return. The application of income tax law is inherently complex. We are required to determine if an income tax position meets the criteria of more‑likely‑than‑not to be realized based on the merits of the position under tax law, in order to recognize an income tax benefit. This requires us to make significant judgments regarding the merits of income tax positions and the application of income tax law. Additionally, if a tax position meets the recognition criteria of more‑likely‑than‑not we are required to make judgments and apply assumptions to measure the amount of the tax benefits to recognize. These judgments are based on the probability of the amount of tax benefits that would be realized if the tax position was challenged by the taxing authorities. Interpretations and guidance surrounding income tax laws and regulations change over time. As a consequence, changes in assumptions and judgments can materially affect amounts recognized in our consolidated financial statements. We have not determined the need for, or change in, any unrecognized tax positions due to the U.S. Tax Reform Act. For further information concerning taxes, see “Note 17. Income Taxes.”
Intangible Assets and Goodwill
Intangible assets are stated at cost (fair value at the time of acquisition) and are amortized using the straight‑line method over the estimated useful lives or the life of the related agreement as follows:
|
|
|
|
Patents and technology
|
5 ‑ 30 years
|
|
Trademarks
|
9 ‑ 30 years
|
|
Licenses and other agreements
|
5 ‑ 15 years
|
|
Other intangibles
|
5 ‑ 15 years
|
Goodwill represents costs in excess of fair values assigned to the underlying net assets of acquired businesses. Goodwill is not subject to any method of amortization, but is tested for impairment annually (at the beginning of the third quarter) and when events and circumstances change that would more likely than not reduce the fair value of a reporting unit below its carrying amount. When the fair value is less than the carrying value of the related reporting unit, we are required to reduce the amount of goodwill through a charge to earnings. Fair value is estimated using the market approach, as well as the income approach based on discounted cash flow projections. Goodwill has been assigned to reporting units for purposes of impairment testing. The net change to goodwill in response to changes in foreign currency exchange rates during 2017 was $3 million.
Inventories
Inventories are stated at the lower of cost or market, with cost determined using LIFO, first‑in first‑out, and average costs methods for different components of inventory.
Legal Costs
We expense legal costs, including those legal costs incurred in connection with a loss contingency, as incurred.
Table of Contents
HUNTSMAN CORPORATION AND SUBSIDIARIES
HUNTSMAN INTERNATIONAL LLC AND SUBSIDIARIES
NOTES TO CONSOLIDATED FINANCIAL STATEMENTS (Continued)
Net Income Per Share Attributable to Huntsman Corporation
Basic income per share excludes dilution and is computed by dividing net income attributable to Huntsman Corporation common stockholders by the weighted average number of shares outstanding during the period. Diluted income per share reflects all potential dilutive common shares outstanding during the period and is computed by dividing net income available to Huntsman Corporation common stockholders by the weighted average number of shares outstanding during the period increased by the number of additional shares that would have been outstanding as dilutive securities.
Basic and diluted income per share is determined using the following information (in millions):
|
|
|
|
|
|
|
|
|
|
|
|
|
|
|
|
|
|
|
|
Year ended December 31,
|
|
|
|
|
|
|
2017
|
|
2016
|
|
2015
|
|
Numerator:
|
|
|
|
|
|
|
|
|
|
|
|
|
|
Basic and diluted income from continuing operations:
|
|
|
|
|
|
|
|
|
|
|
|
|
|
Income from continuing operations attributable to Huntsman Corporation
|
|
|
|
|
$
|
478
|
|
$
|
334
|
|
$
|
395
|
|
Basic and diluted net income:
|
|
|
|
|
|
|
|
|
|
|
|
|
|
Net income attributable to Huntsman Corporation
|
|
|
|
|
$
|
636
|
|
$
|
326
|
|
$
|
93
|
|
Denominator:
|
|
|
|
|
|
|
|
|
|
|
|
|
|
Weighted average shares outstanding
|
|
|
|
|
|
238.4
|
|
|
236.3
|
|
|
242.8
|
|
Dilutive shares:
|
|
|
|
|
|
|
|
|
|
|
|
|
|
Stock-based awards
|
|
|
|
|
|
5.5
|
|
|
3.3
|
|
|
2.6
|
|
Total weighted average shares outstanding, including dilutive shares
|
|
|
|
|
|
243.9
|
|
|
239.6
|
|
|
245.4
|
Additional stock‑based awards of 0.8 million, 5.7 million and 6.1 million weighted average equivalent shares of stock were outstanding during the years ended December 31, 2017, 2016 and 2015, respectively. However, these stock‑based awards were not included in the computation of diluted earnings per share for the respective periods mentioned because the effect would be anti‑dilutive.
Other Noncurrent Assets
Other noncurrent assets consist primarily of spare parts, the overfunded portion related to defined benefit plans for employees and capitalized turnaround costs. Periodic maintenance and repairs applicable to major units of manufacturing facilities (a “turnaround”) are accounted for on the deferral basis by capitalizing the costs of the turnaround and amortizing the costs over the estimated period until the next turnaround.
Principles of Consolidation
Our consolidated financial statements include the accounts of our wholly owned and majority owned subsidiaries and any variable interest entities for which we are the primary beneficiary. All intercompany accounts and transactions have been eliminated.
Property, Plant and Equipment
Property, plant and equipment is stated at cost less accumulated depreciation. Depreciation is computed using the straight‑line method over the estimated useful lives or lease term as follows:
|
|
|
|
Buildings and equipment
|
5 ‑ 50 years
|
|
Plant and equipment
|
3 ‑ 30 years
|
|
Furniture, fixtures and leasehold improvements
|
5 ‑ 20 years
|
Interest expense capitalized as part of plant and equipment was $9 million, $12 million and $14 million for the years ended December 31, 2017, 2016 and 2015, respectively.
Table of Contents
HUNTSMAN CORPORATION AND SUBSIDIARIES
HUNTSMAN INTERNATIONAL LLC AND SUBSIDIARIES
NOTES TO CONSOLIDATED FINANCIAL STATEMENTS (Continued)
Normal maintenance and repairs of plant and equipment are charged to expense as incurred. Renewals, betterments and major repairs that materially extend the useful life of the assets are capitalized, and the assets replaced, if any, are retired.
Reclassifications
Certain amounts in the consolidated financial statements for prior periods have been reclassified to conform with the current presentation. These reclassifications were to record the assets and liabilities as held for sale and results of operations of the former P&A Business to discontinued operations. See “Note 3. Discontinued Operations and Business Dispositions—Separation of P&A Business.” In connection with the separation of the P&A Business, certain entities were removed from the debt guarantor structure. The condensed consolidating financial information included in “Note 25. Condensed Consolidating Financial Information of Huntsman International LLC” has been presented as if the new debt guarantor structure existed for all periods presented.
Revenue Recognition
We generate substantially all of our revenues through sales in the open market and long‑term supply agreements. We recognize revenue when it is realized or realizable and earned. Revenue for product sales is recognized when a sales arrangement exists, risk and title to the product transfer to the customer, collectability is reasonably assured and pricing is fixed or determinable. The transfer of risk and title to the product to the customer usually occurs at the time shipment is made.
Securitization of Accounts Receivable
Under our A/R Programs, we grant an undivided interest in certain of our trade receivables to the U.S. SPE and the EU SPE. This undivided interest serves as security for the issuance of debt. The A/R Programs provide for financing in both U.S. dollars and euros. The amounts outstanding under our A/R Programs are accounted for as secured borrowings. See “Note 13. Debt—Direct and Subsidiary Debt—A/R Programs.”
Stock‑Based Compensation
We measure the cost of employee services received in exchange for an award of equity instruments based on the grant‑date fair value of the award. That cost, net of estimated forfeitures, will be recognized over the period during which the employee is required to provide services in exchange for the award. See “Note 21. Stock‑Based Compensation Plan.”
Use of Estimates
The preparation of financial statements in conformity with GAAP requires management to make estimates and assumptions that affect the reported amounts of assets and liabilities and disclosure of contingent assets and liabilities at the date of the financial statements and the reported amounts of revenues and expenses during the reporting period. Actual results could differ from those estimates.
Recently Issued Accounting Pronouncements
Accounting Pronouncements Adopted During 2017
In July 2015, the Financial Accounting Standards Board (“FASB”) issued Accounting Standards Update (“ASU”) No. 2015-11, Inventory (Topic 330): Simplifying the Measurement of Inventory. The amendments in this ASU do not apply to inventory that is measured using last-in first-out (“LIFO”) or the retail inventory method, but rather does apply to all other inventory, which includes inventory that is measured using first-in first-out or average cost. An entity should measure in scope inventory at the lower of cost and net realizable value. Net realizable value is the estimated selling prices in the ordinary course of business, less reasonably predictable costs of completion, disposal, and transportation. Subsequent measurement is unchanged for inventory measured using LIFO or the retail inventory method. The amendments in this ASU are effective for fiscal years, and interim periods within those fiscal years, beginning after December 15, 2016. The amendments in this ASU should be applied prospectively. We adopted the
Table of Contents
HUNTSMAN CORPORATION AND SUBSIDIARIES
HUNTSMAN INTERNATIONAL LLC AND SUBSIDIARIES
NOTES TO CONSOLIDATED FINANCIAL STATEMENTS (Continued)
amendments in this ASU effective January 1, 2017, and the initial adoption of the amendment in this ASU did not have a significant impact on our consolidated financial statements.
In October 2016, the FASB issued ASU No. 2016-16, Income Taxes (Topic 740): Intra-Entity Transfers of Assets Other Than Inventory. The amendments in this ASU require entities to recognize the current and deferred income taxes for an intra-entity transfer of an asset other than inventory when the transfer occurs, as opposed to deferring the recognition of the income tax consequences until the asset has been sold to an outside party. The amendments in this ASU are effective for annual reporting periods beginning after December 31, 2017, including interim reporting periods within those annual reporting periods. Early adoption is permitted for all entities as of the beginning of an annual reporting period for which financial statements (interim or annual) have not been issued or made available for issuance. The amendments in this ASU should be applied on a modified retrospective basis through a cumulative-effect adjustment directly to retained earnings as of the beginning of the period of adoption. We early adopted the amendments of this ASU effective January 1, 2017 and the initial adoption of amendments in this ASU did not have a significant impact on our consolidated financial statements.
In March 2016, the FASB issued ASU No. 2016‑09, Compensation—Stock Compensation (Topic 718): Improvements to Employee Share‑Based Payment Accounting. The amendments in this ASU simplify several aspects of the accounting for share‑based payment transactions, including the income tax consequences, classification of awards as either equity or liabilities, and classification on the statement of cash flows. The amendments in this ASU are effective for fiscal years, and interim periods within those fiscal years, beginning after December 15, 2016. We adopted the amendments in this ASU effective January 1, 2017, and the initial adoption of the amendment in this ASU did not have a significant impact on our consolidated financial statements.
In January 2017, the FASB issued ASU No. 2017‑04, Intangibles—Goodwill and Other (Topic 350): Simplifying the Test for Goodwill Impairment. The amendments in this ASU simplify the subsequent measurement of goodwill by eliminating Step 2 from the goodwill impairment test. Under the amendments in this ASU, an entity should perform its annual, or interim, goodwill impairment test by comparing the fair value of a reporting unit with its carrying value, which eliminates the current requirement to calculate a goodwill impairment charge by comparing the implied fair value of goodwill with its carrying amount. The amendments in this ASU are effective for annual or any interim goodwill impairment tests in fiscal years beginning after December 15, 2019. Early adoption is permitted for interim or annual goodwill impairment tests performed on testing dates after January 1, 2017. The amendments in this ASU should be applied on a prospective basis. We adopted the amendments in this ASU effective January 1, 2017 and the initial adoption of the amendments in this ASU did not have a significant impact on our consolidated financial statements.
Accounting Pronouncements Pending Adoption in Future Periods
In May 2014, the FASB issued ASU No. 2014‑09, Revenue from Contracts with Customers (Topic 606), outlining a single comprehensive model for entities to use in accounting for revenues arising from contracts with customers and supersedes most current revenue recognition guidance. In August 2015, the FASB issued ASU No. 2015‑14, Revenue from Contracts with Customers (Topic 606): Deferral of the Effective Date, deferring the effective date of ASU No. 2014‑09 for all entities by one year. Further, in March 2016, the FASB issued ASU No. 2016‑08, Revenue from Contracts with Customers (Topic 606): Principal versus Agent Considerations (Reporting Revenue Gross versus Net), clarifying the implementation guidance on principal versus agent considerations, in April 2016, the FASB issued ASU No. 2016‑10, Revenue from Contracts with Customers (Topic 606): Identifying Performance Obligations and Licensing, clarifying the implementation guidance on identifying performance obligations in a contract and determining whether an entity’s promise to grant a license provides a customer with either a right to use the entity’s intellectual property (which is satisfied at a point in time) or a right to access the entity’s intellectual property (which is satisfied over time), in May 2016, the FASB issued ASU No. 2016‑12, Revenue from Customers (Topic 606): Narrow‑Scope Improvements and Practical Expedients, providing clarifications and practical expedients for certain narrow aspects in Topic 606, and in December 2016, the FASB issued ASU 2016‑20, Technical Corrections and Improvements to Topic 606, Revenue from Contracts with Customers. The amendments in these ASUs are effective for annual reporting periods beginning after December 15, 2017, including interim periods within that reporting period. The amendments in ASU No. 2014‑09, ASU No. 2016‑08, ASU No. 2016‑10, ASU No. 2016‑12 and ASU No. 2016‑20 should be applied retrospectively, and early application is permitted. We are complete with our analysis to identify areas in our consolidated financial statements that will be impacted by the adoption of the amendments in ASU No. 2014‑09,
Table of Contents
HUNTSMAN CORPORATION AND SUBSIDIARIES
HUNTSMAN INTERNATIONAL LLC AND SUBSIDIARIES
NOTES TO CONSOLIDATED FINANCIAL STATEMENTS (Continued)
ASU No. 2016‑08, ASU No. 2016‑10, ASU No. 2016‑12 and ASU No. 2016‑20. Other than additional required disclosures, we do not expect the adoption of the amendments in these ASUs to have a significant impact on our consolidated financial statements. The standard will be adopted in our fiscal year 2018, and we have elected the modified retrospective approach as the transition method.
In February 2016, the FASB issued ASU No. 2016-02, Leases (Topic 842). The amendments in this ASU will increase transparency and comparability among entities by recognizing lease assets and lease liabilities on the balance sheet and disclosing key information about leasing arrangements. The amendments in this ASU will require lessees to recognize in the statement of financial position a liability to make lease payments (the lease liability) and a right-of-use asset representing its right to use the underlying asset for the lease term. The amendments in this ASU are effective for fiscal years, and interim periods within those fiscal years, beginning after December 15, 2018. Early application of the amendments in this ASU is permitted for all entities. Reporting entities are required to recognize and measure leases under these amendments at the beginning of the earliest period presented using a modified retrospective approach. We are currently evaluating the impact of the adoption of the amendments in this ASU on our consolidated financial statements and believe, based on our preliminary assessment, that we will record significant additional right-to-use assets and lease obligations.
In August 2016, the FASB issued ASU No. 2016-15, Statement of Cash Flows (Topic 230): Classification of Certain Cash Receipts and Cash Payments. The amendments in this ASU clarify and include specific guidance to address diversity in how certain cash receipts and cash payments are presented and classified in the statement of cash flows. The amendments in this ASU are effective for fiscal years, and interim periods within those fiscal years, beginning after December 15, 2017. Early adoption is permitted, including adoption in an interim period. The amendments in this ASU should be applied using a retrospective transition method to each period presented. We do not expect the adoption of the amendments in this ASU to have a significant impact on our consolidated financial statements.
In November 2016, the FASB issued ASU No. 2016‑18, Statement of Cash Flows (Topic 230): Restricted Cash. The amendments in this ASU require that a statement of cash flows explain the change during the period in the total of cash, cash equivalents, and amounts generally described as restricted cash or restricted cash equivalents. Therefore, amounts generally described as restricted cash and restricted cash equivalents should be included with cash and cash equivalents when reconciling the beginning‑of‑period and end‑of‑period total amounts shown on the statement of cash flows. The amendments in this ASU are effective for fiscal years beginning after December 15, 2017, and interim period within those fiscal years. Early adoption is permitted, including adoption in an interim period. The amendments in this ASU should be applied using a retrospective transition method to each period presented. We do not expect the adoption of the amendments in this ASU to have a significant impact on our consolidated financial statements.
In January 2017, the FASB issued ASU No. 2017‑01, Business Combinations (Topic 805): Clarifying the Definition of a Business. The amendments in this ASU clarify the definition of a business with the objective of adding guidance to assist entities with evaluating whether transactions should be accounted for as acquisitions or disposals of assets or businesses. The amendments in this ASU are effective for fiscal years beginning after December 15, 2017, including interim periods within those fiscal years. Early application is permitted. The amendments in this ASU should be applied prospectively on or after the effective date. No disclosures are required at transition. We do not expect the adoption of the amendments in this ASU to have a significant impact on our consolidated financial statements.
In March 2017, the FASB issued ASU No. 2017-07, Compensation—Retirement Benefits (Topic 715): Improving the Presentation of Net Periodic Pension Cost and Net Periodic Postretirement Benefit Cost. The amendments in this ASU require that an employer report the service cost component of net periodic pension cost and net periodic postretirement benefit cost in the same line items as other compensation costs arising from services rendered by the pertinent employees during the period. The other components of net benefit cost are required to be presented in the income statement separately from the service cost component and outside of income from operations. The amendments in this ASU also allow only the service cost component to be eligible for capitalization when applicable (for example, as a cost of internally manufactured inventory or a self-constructed asset). The amendments in this ASU are effective for fiscal years beginning after December 15, 2017, including interim periods within those fiscal years. The amendments in this ASU should be applied retrospectively for the presentation of the service cost component and the other components of net periodic pension cost and net periodic postretirement benefit cost in the income statement and prospectively, on and after the effective date, for the capitalization of the service cost component of net periodic pension cost and net
Table of Contents
HUNTSMAN CORPORATION AND SUBSIDIARIES
HUNTSMAN INTERNATIONAL LLC AND SUBSIDIARIES
NOTES TO CONSOLIDATED FINANCIAL STATEMENTS (Continued)
periodic postretirement benefit cost in assets. The amendments in this ASU will impact the presentation of our consolidated financial statements. Our current presentation of service cost components is consistent with the amendments in this ASU. Upon adoption of the amendments in this ASU, we expect to present the other components within other nonoperating income, whereas we currently present these within cost of goods sold and selling, general and administrative expenses.
In August 2017, the FASB issued ASU No. 2017‑12, Derivatives and Hedging (Topic 815): Targeted Improvements to Accounting for Hedging Activities. The amendments in this ASU better align an entity’s risk management activities and financial reporting for hedging relationships through changes to both the designation and measurement guidance for qualifying hedging relationships as well as the recognition and presentation of the effects of the hedging instrument and the hedged item in the financial statements to increase the understandability of the results of an entity’s intended hedging strategies. The amendments in this ASU also include certain targeted improvements to ease the application of current guidance related to the assessment of hedge effectiveness. The amendments in this ASU are effective for fiscal years beginning after December 15, 2018, including interim periods within those fiscal years. Early application is permitted in any interim period after the issuance of this ASU. Transition requirements and elections should be applied to hedging relationships existing on the date of adoption. For cash flow and net investment hedges, an entity should apply a cumulative-effect adjustment related to eliminating the separate measurement of ineffectiveness, and the amended presentation and disclosure guidance is required only prospectively. We do not expect the adoption of the amendments in this ASU to have a significant impact on our consolidated financial statements.
3. DISCONTINUED OPERATIONS AND BUSINESS DISPOSITIONS
Separation of P&A Business
In August 2017, we separated the P&A Business and conducted an IPO of ordinary shares of Venator, formerly a wholly-owned subsidiary of Huntsman, and have presented the former P&A Business as discontinued operations in the accompanying financial statements. Additionally, in December 2017, we completed a secondary offering of Venator ordinary shares. As of December 31, 2017, Huntsman retained approximately 55% ownership in Venator. On January 3, 2018, the underwriters purchased an additional 1,948,955 Venator ordinary shares pursuant to their over-allotment option, which reduced Huntsman’s ownership interest in Venator to approximately 53%. We intend to monetize our retained ownership in Venator at prevailing market conditions and expect to implement multiple follow-on capital market or block transactions to permit the orderly distribution of our retained shares.
In August 2017, we entered into a separation agreement, a transition services agreement (“TSA”) and a registration rights agreement with Venator to effect the Separation and provide a framework for a short term set of transition services as well as a tax matters agreement and an employee matters agreement. Pursuant to the TSA, we will, for a limited time following the Separation, provide Venator with certain services and functions that the parties have historically shared, including administrative, payroll, human resources, data processing, environmental, health and safety, financial audit support, financial transaction support, marketing support, information technology systems and various other corporate and support services. We may also provide Venator with additional services that Venator and Huntsman may identify from time to time in the future. In general, the services began following the Separation and cover a period not expected to exceed 24 months; however, Venator may terminate individual services provided by us under the TSA early, as it becomes able to operate its business without such services.
Table of Contents
HUNTSMAN CORPORATION AND SUBSIDIARIES
HUNTSMAN INTERNATIONAL LLC AND SUBSIDIARIES
NOTES TO CONSOLIDATED FINANCIAL STATEMENTS (Continued)
The following table summarizes the major classes of assets and liabilities constituting assets and liabilities held for sale:
|
|
|
|
|
|
|
|
|
|
|
December 31,
|
|
December 31,
|
|
|
|
2017
|
|
2016
|
|
Carrying amounts of major classes of assets held for sale:
|
|
|
|
|
|
|
|
Accounts receivable
|
|
$
|
380
|
|
$
|
234
|
|
Inventories
|
|
|
454
|
|
|
426
|
|
Other current assets
|
|
|
318
|
|
|
117
|
|
Total current assets(1)
|
|
|
|
|
|
777
|
|
Property, plant and equipment, net
|
|
|
1,424
|
|
|
1,178
|
|
Deferred income taxes
|
|
|
158
|
|
|
143
|
|
Other noncurrent assets
|
|
|
146
|
|
|
142
|
|
Total noncurrent assets(1)
|
|
|
|
|
|
1,463
|
|
Total assets held for sale
|
|
$
|
2,880
|
|
$
|
2,240
|
|
Carrying amounts of major classes of liabilities in held for sale:
|
|
|
|
|
|
|
|
Accounts payable
|
|
$
|
385
|
|
$
|
297
|
|
Accrued liabilities
|
|
|
236
|
|
|
145
|
|
Other current liabilities
|
|
|
25
|
|
|
25
|
|
Total current liabilities(1)
|
|
|
|
|
|
467
|
|
Deferred income taxes
|
|
|
—
|
|
|
56
|
|
Long term debt
|
|
|
746
|
|
|
—
|
|
Other noncurrent liabilities
|
|
|
300
|
|
|
337
|
|
Total noncurrent liabilities(1)
|
|
|
|
|
|
393
|
|
Total liabilities held for sale
|
|
$
|
1,692
|
|
$
|
860
|
(1) The assets and liabilities held for sale are classified as current as of December 31, 2017 because it is probable that the sale of our remaining ownership interest in Venator ordinary shares will occur and proceeds will be collected within one year.
The following table summarizes major classes of line items constituting pretax and after-tax income of discontinued operations.
Huntsman Corporation
|
|
|
|
|
|
|
|
|
|
|
|
|
Year ended December 31,
|
|
|
|
2017
|
|
2016
|
|
2015
|
|
|
Major classes of line items constituting pretax income (loss) of discontinued operations:
|
|
|
|
|
|
|
|
|
|
|
Trade sales, services and fees, net
|
$
|
2,234
|
|
$
|
2,168
|
|
$
|
2,193
|
|
|
Cost of goods sold
|
|
1,840
|
|
|
2,012
|
|
|
2,077
|
|
|
Selling, general and administrative
|
|
187
|
|
|
174
|
|
|
214
|
|
|
Restructuring, impairment and plant closing costs
|
|
56
|
|
|
36
|
|
|
220
|
|
|
Business separation expenses
|
|
40
|
|
|
18
|
|
|
—
|
|
|
Interest expense (income)
|
|
19
|
|
|
(1)
|
|
|
—
|
|
|
Other operating income, net
|
|
(134)
|
|
|
(38)
|
|
|
(1)
|
|
|
Other loss (income), net
|
|
1
|
|
|
(1)
|
|
|
1
|
|
|
Income (loss) from discontinued operations before income taxes
|
|
225
|
|
|
(32)
|
|
|
(318)
|
|
|
Income tax (expense) benefit
|
|
(67)
|
|
|
24
|
|
|
16
|
|
|
Income (loss) from discontinued operations, net of tax
|
|
158
|
|
|
(8)
|
|
|
(302)
|
|
|
Net income attributable to noncontrolling interests
|
|
(10)
|
|
|
(10)
|
|
|
(7)
|
|
|
Net income (loss) attributable to discontinued operations
|
$
|
148
|
|
$
|
(18)
|
|
$
|
(309)
|
|
Table of Contents
HUNTSMAN CORPORATION AND SUBSIDIARIES
HUNTSMAN INTERNATIONAL LLC AND SUBSIDIARIES
NOTES TO CONSOLIDATED FINANCIAL STATEMENTS (Continued)
Huntsman International
|
|
|
|
|
|
|
|
|
|
|
|
|
Year ended December 31,
|
|
|
|
2017
|
|
2016
|
|
2015
|
|
|
Major classes of line items constituting pretax income (loss) of discontinued operations:
|
|
|
|
|
|
|
|
|
|
|
Trade sales, services and fees, net
|
$
|
2,234
|
|
$
|
2,168
|
|
|
2,193
|
|
|
Cost of goods sold
|
|
1,843
|
|
|
2,017
|
|
|
2,082
|
|
|
Selling, general and administrative
|
|
187
|
|
|
174
|
|
|
214
|
|
|
Restructuring, impairment and plant closing costs
|
|
56
|
|
|
36
|
|
|
220
|
|
|
Business separation expenses
|
|
40
|
|
|
18
|
|
|
—
|
|
|
Interest expense
|
|
19
|
|
|
(1)
|
|
|
—
|
|
|
Other operating income, net
|
|
(134)
|
|
|
(38)
|
|
|
(1)
|
|
|
Other loss (income), net
|
|
1
|
|
|
(1)
|
|
|
1
|
|
|
Income (loss) from discontinued operations before income taxes
|
|
222
|
|
|
(37)
|
|
|
(323)
|
|
|
Income tax (expense) benefit
|
|
(67)
|
|
|
24
|
|
|
16
|
|
|
Income (loss) from discontinued operations, net of tax
|
|
155
|
|
|
(13)
|
|
|
(307)
|
|
|
Net income attributable to noncontrolling interests
|
|
(10)
|
|
|
(10)
|
|
|
(7)
|
|
|
Net income (loss) attributable to discontinued operations
|
$
|
145
|
|
$
|
(23)
|
|
$
|
(314)
|
|
Sale of European Surfactants Manufacturing Facilities
On December 30, 2016, our Performance Products segment completed the sale of its European surfactants business to Innospec Inc. for $199 million in cash plus our retention of trade receivables and payables for an enterprise value of $225 million. Under the terms of the transaction, Innospec acquired our manufacturing facilities located in Saint-Mihiel, France; Castiglione delle Stiviere, Italy; and Barcelona, Spain. We remain committed to our global surfactants business, including in the U.S. and Australia, where our differentiated surfactants businesses are backward integrated into essential feedstocks. Upon closing the transaction, we entered into supply and long-term tolling arrangements with Innospec in order to continue marketing certain core products strategic to our global agrochemicals, lubes and certain other businesses. In connection with this sale, we recognized a pre-tax gain in the fourth quarter of 2016 of $98 million which was reflected in other operating income, net on the consolidated statements of operations. This business is not presented as discontinued operations as it was not considered a strategic shift in our operations.
4. INVENTORIES
Inventories consisted of the following (dollars in millions):
|
|
|
|
|
|
|
|
|
|
|
December 31,
|
|
December 31,
|
|
|
|
2017
|
|
2016
|
|
Raw materials and supplies
|
|
$
|
189
|
|
$
|
157
|
|
Work in progress
|
|
|
48
|
|
|
45
|
|
Finished goods
|
|
|
897
|
|
|
771
|
|
Total
|
|
|
1,134
|
|
|
973
|
|
LIFO reserves
|
|
|
(61)
|
|
|
(55)
|
|
Net inventories
|
|
$
|
1,073
|
|
$
|
918
|
For December 31, 2017 and 2016, approximately 12% and 13% of inventories were recorded using the LIFO cost method, respectively.
Table of Contents
HUNTSMAN CORPORATION AND SUBSIDIARIES
HUNTSMAN INTERNATIONAL LLC AND SUBSIDIARIES
NOTES TO CONSOLIDATED FINANCIAL STATEMENTS (Continued)
5. PROPERTY, PLANT AND EQUIPMENT
The cost and accumulated depreciation of property, plant and equipment were as follows (dollars in millions):
Huntsman Corporation
|
|
|
|
|
|
|
|
|
|
|
December 31,
|
|
|
|
2017
|
|
2016
|
|
Land
|
|
$
|
150
|
|
$
|
133
|
|
Buildings
|
|
|
644
|
|
|
607
|
|
Plant and equipment
|
|
|
5,929
|
|
|
5,369
|
|
Construction in progress
|
|
|
360
|
|
|
381
|
|
Total
|
|
|
7,083
|
|
|
6,490
|
|
Less accumulated depreciation
|
|
|
(3,985)
|
|
|
(3,456)
|
|
Net
|
|
$
|
3,098
|
|
$
|
3,034
|
Depreciation expense for 2017, 2016 and 2015 was $298 million, $289 million and $278 million, respectively.
Huntsman International
|
|
|
|
|
|
|
|
|
|
|
December 31,
|
|
|
|
2017
|
|
2016
|
|
Land
|
|
$
|
150
|
|
$
|
133
|
|
Buildings
|
|
|
644
|
|
|
607
|
|
Plant and equipment
|
|
|
5,982
|
|
|
5,411
|
|
Construction in progress
|
|
|
360
|
|
|
381
|
|
Total
|
|
|
7,136
|
|
|
6,532
|
|
Less accumulated depreciation
|
|
|
(4,041)
|
|
|
(3,520)
|
|
Net
|
|
$
|
3,095
|
|
$
|
3,012
|
Depreciation expense for 2017, 2016 and 2015 was $289 million, $277 million and $266 million, respectively.
6. INVESTMENT IN UNCONSOLIDATED AFFILIATES
Investments in companies in which we exercise significant influence, but do not control, are accounted for using the equity method. Investments in companies in which we do not exercise significant influence are accounted for using the cost method.
Our ownership percentage and investment in unconsolidated affiliates were as follows (dollars in millions):
|
|
|
|
|
|
|
|
|
|
|
December 31,
|
|
|
|
2017
|
|
2016
|
|
Equity Method:
|
|
|
|
|
|
|
|
BASF Huntsman Shanghai Isocyanate Investment BV (50%)(1)
|
|
$
|
116
|
|
$
|
112
|
|
Nanjing Jinling Huntsman New Material Co., Ltd. (49%)
|
|
|
124
|
|
|
112
|
|
Jurong Ningwu New Material Development Co., Ltd. (30%)
|
|
|
21
|
|
|
19
|
|
Total equity method investments
|
|
|
261
|
|
|
243
|
|
Cost Method:
|
|
|
|
|
|
|
|
International Diol Company (4%)
|
|
|
5
|
|
|
5
|
|
Total investments
|
|
$
|
266
|
|
$
|
248
|
|
|
(1) We own 50% of BASF Huntsman Shanghai Isocyanate Investment BV. BASF Huntsman Shanghai Isocyanate Investment BV owns a 70% interest in SLIC, thus giving us an indirect 35% interest in SLIC.
|
Table of Contents
HUNTSMAN CORPORATION AND SUBSIDIARIES
HUNTSMAN INTERNATIONAL LLC AND SUBSIDIARIES
NOTES TO CONSOLIDATED FINANCIAL STATEMENTS (Continued)
In November 2012, we entered into an agreement to form a joint venture with Sinopec (Nanjing Jingling). The joint venture involves the construction and operation of a PO/MTBE facility in China. Under the joint venture agreement, we hold a 49% interest in the joint venture and Sinopec holds a 51% interest. Our total equity investment is anticipated to be approximately $76 million, net of license fees from the joint venture. At the end of 2017, cumulative capital contributions were approximately $83 million, net of license fees from the joint venture. We expect to receive additional license fees of $7 million during 2018. Beneficial commercial operations began during the second half of 2017.
We are in the process of expanding our SLIC capacity in Caojing, China by 530 million pounds per year of MDI. In addition, we are also expanding our HPS splitting capacity. Mechanical completion was achieved at the end of 2017. We are currently in the process of starting up these units and expect beneficial commercial operations to begin during the first quarter of 2018.
7. VARIABLE INTEREST ENTITIES
We evaluate our investments and transactions to identify variable interest entities for which we are the primary beneficiary. We hold a variable interest in the following joint ventures for which we are the primary beneficiary:
|
·
| |
Rubicon LLC is our 50%-owned joint venture with Lanxess that manufactures products for our Polyurethanes and Performance Products segments. The structure of the joint venture is such that the total equity investment at risk is not sufficient to permit the joint venture to finance its activities without additional financial support. By virtue of the operating agreement with this joint venture, we purchase a majority of the output, absorb a majority of the operating costs and provide a majority of the additional funding. |
|
·
| |
AAC is our 50%-owned joint venture with Zamil group that manufactures products for our Performance Products segment. As required in the operating agreement governing this joint venture, we purchase all of AAC’s production and sell it to our customers. Substantially all of the joint venture’s activities are conducted on our behalf. |
|
·
| |
Sasol‑Huntsman is our 50%‑owned joint venture with Sasol that owns and operates a maleic anhydride facility in Moers, Germany. This joint venture manufactures products for our Performance Products segment. The joint venture uses our technology and expertise, and we bear a disproportionate amount of risk of loss due to a related‑party loan to Sasol‑Huntsman for which we bear the default risk. |
Creditors of these entities have no recourse to our general credit. See “Note 13. Debt—Direct and Subsidiary Debt.” As the primary beneficiary of these variable interest entities at December 31, 2017, the joint ventures’ assets, liabilities and results of operations are included in our consolidated financial statements.
The following table summarizes the carrying amount of our variable interest entities’ assets and liabilities included in our consolidated balance sheets as of December 31, 2017 and 2016 (dollars in millions):
|
|
|
|
|
|
|
|
|
|
|
December 31,
|
|
December 31,
|
|
|
|
2017
|
|
2016
|
|
Current assets
|
|
$
|
114
|
|
$
|
103
|
|
Property, plant and equipment, net
|
|
|
283
|
|
|
279
|
|
Other noncurrent assets
|
|
|
116
|
|
|
99
|
|
Deferred income taxes
|
|
|
33
|
|
|
43
|
|
Intangible assets
|
|
|
10
|
|
|
10
|
|
Goodwill
|
|
|
14
|
|
|
12
|
|
Total assets
|
|
$
|
570
|
|
$
|
546
|
|
Current liabilities
|
|
$
|
163
|
|
$
|
131
|
|
Long-term debt
|
|
|
86
|
|
|
114
|
|
Deferred income taxes
|
|
|
12
|
|
|
10
|
|
Other noncurrent liabilities
|
|
|
98
|
|
|
76
|
|
Total liabilities
|
|
$
|
359
|
|
$
|
331
|
Table of Contents
HUNTSMAN CORPORATION AND SUBSIDIARIES
HUNTSMAN INTERNATIONAL LLC AND SUBSIDIARIES
NOTES TO CONSOLIDATED FINANCIAL STATEMENTS (Continued)
The revenues, income from continuing operations before income taxes and net cash provided by operating activities for our variable interest entities are as follows (dollars in millions):
|
|
|
|
|
|
|
|
|
|
|
|
|
|
Year ended December 31,
|
|
|
|
2017
|
|
2016
|
|
2015
|
|
Revenues
|
|
$
|
132
|
|
$
|
97
|
|
$
|
130
|
|
Income from continuing operations before income taxes
|
|
|
25
|
|
|
15
|
|
|
36
|
|
Net cash provided by operating activities
|
|
|
51
|
|
|
50
|
|
|
66
|
Prior to the Separation, we held variable interests in two additional joint ventures for which we were the primary beneficiary: Pacific Iron Products Sdn Bhd and Viance, LLC. In connection with the Separation, these variable interests are now held by Venator. As such, the assets and liabilities of these variable interest entities are now included as part of assets and liabilities held for sale. See “Note 3. Discontinued Operations and Business Dispositions—Separation of P&A Business.”
8. INTANGIBLE ASSETS
The gross carrying amount and accumulated amortization of intangible assets were as follows (dollars in millions):
Huntsman Corporation
|
|
|
|
|
|
|
|
|
|
|
|
|
|
|
|
|
|
|
|
|
|
|
December 31, 2017
|
|
December 31, 2016
|
|
|
|
Carrying
|
|
Accumulated
|
|
|
|
Carrying
|
|
Accumulated
|
|
|
|
|
|
Amount
|
|
Amortization
|
|
Net
|
|
Amount
|
|
Amortization
|
|
Net
|
|
Patents, trademarks and technology
|
|
$
|
350
|
|
$
|
332
|
|
$
|
18
|
|
$
|
349
|
|
$
|
327
|
|
$
|
22
|
|
Licenses and other agreements
|
|
|
40
|
|
|
25
|
|
|
15
|
|
|
37
|
|
|
23
|
|
|
14
|
|
Non-compete agreements
|
|
|
4
|
|
|
2
|
|
|
2
|
|
|
3
|
|
|
2
|
|
|
1
|
|
Other intangibles
|
|
|
82
|
|
|
61
|
|
|
21
|
|
|
62
|
|
|
56
|
|
|
6
|
|
Total
|
|
$
|
476
|
|
$
|
420
|
|
$
|
56
|
|
$
|
451
|
|
$
|
408
|
|
$
|
43
|
Amortization expense was $6 million, $12 million and $6 million for the years ended December 31, 2017, 2016 and 2015, respectively.
Huntsman International
|
|
|
|
|
|
|
|
|
|
|
|
|
|
|
|
|
|
|
|
|
|
|
December 31, 2017
|
|
December 31, 2016
|
|
|
|
Carrying
|
|
Accumulated
|
|
|
|
Carrying
|
|
Accumulated
|
|
|
|
|
|
Amount
|
|
Amortization
|
|
Net
|
|
Amount
|
|
Amortization
|
|
Net
|
|
Patents, trademarks and technology
|
|
$
|
350
|
|
$
|
332
|
|
$
|
18
|
|
$
|
349
|
|
$
|
327
|
|
$
|
22
|
|
Licenses and other agreements
|
|
|
40
|
|
|
25
|
|
|
15
|
|
|
37
|
|
|
23
|
|
|
14
|
|
Non-compete agreements
|
|
|
4
|
|
|
2
|
|
|
2
|
|
|
3
|
|
|
2
|
|
|
1
|
|
Other intangibles
|
|
|
90
|
|
|
69
|
|
|
21
|
|
|
70
|
|
|
64
|
|
|
6
|
|
Total
|
|
$
|
484
|
|
$
|
428
|
|
$
|
56
|
|
$
|
459
|
|
$
|
416
|
|
$
|
43
|
Amortization expense was $7 million, $12 million and $6 million for the years ended December 31, 2017, 2016 and 2015, respectively.
Table of Contents
HUNTSMAN CORPORATION AND SUBSIDIARIES
HUNTSMAN INTERNATIONAL LLC AND SUBSIDIARIES
NOTES TO CONSOLIDATED FINANCIAL STATEMENTS (Continued)
Our and Huntsman International’s estimated future amortization expense for intangible assets over the next five years is as follows (dollars in millions):
|
|
|
|
|
|
Year ending December 31,
|
|
|
|
|
2018
|
|
$
|
6
|
|
2019
|
|
|
6
|
|
2020
|
|
|
6
|
|
2021
|
|
|
5
|
|
2022
|
|
|
4
|
9. OTHER NONCURRENT ASSETS
Other noncurrent assets consisted of the following (dollars in millions):
|
|
|
|
|
|
|
|
|
|
|
December 31,
|
|
|
|
2017
|
|
2016
|
|
Capitalized turnaround costs, net
|
|
$
|
233
|
|
$
|
214
|
|
Spare parts inventory
|
|
|
91
|
|
|
79
|
|
Deposits
|
|
|
52
|
|
|
46
|
|
Catalyst assets, net
|
|
|
46
|
|
|
43
|
|
Investment in available-for-sale securities
|
|
|
—
|
|
|
18
|
|
Pension assets
|
|
|
22
|
|
|
1
|
|
Other
|
|
|
53
|
|
|
71
|
|
Total
|
|
$
|
497
|
|
$
|
472
|
Amortization expense of catalyst assets for the years ended December 31, 2017, 2016 and 2015 was $15 million, $17 million and $14 million, respectively.
10. ACCRUED LIABILITIES
Accrued liabilities consisted of the following (dollars in millions):
Huntsman Corporation
|
|
|
|
|
|
|
|
|
|
|
December 31,
|
|
|
|
2017
|
|
2016
|
|
Payroll and related accruals
|
|
$
|
172
|
|
$
|
135
|
|
Volume and rebate accruals
|
|
|
58
|
|
|
48
|
|
Taxes other than income taxes
|
|
|
77
|
|
|
60
|
|
Income taxes
|
|
|
62
|
|
|
28
|
|
Restructuring and plant closing reserves
|
|
|
15
|
|
|
28
|
|
Interest
|
|
|
20
|
|
|
21
|
|
Pension liabilities
|
|
|
15
|
|
|
11
|
|
Other postretirement benefits
|
|
|
7
|
|
|
8
|
|
Environmental accruals
|
|
|
6
|
|
|
7
|
|
Other miscellaneous accruals
|
|
|
137
|
|
|
125
|
|
Total
|
|
$
|
569
|
|
$
|
471
|
Table of Contents
HUNTSMAN CORPORATION AND SUBSIDIARIES
HUNTSMAN INTERNATIONAL LLC AND SUBSIDIARIES
NOTES TO CONSOLIDATED FINANCIAL STATEMENTS (Continued)
Huntsman International
|
|
|
|
|
|
|
|
|
|
|
December 31,
|
|
|
|
2017
|
|
2016
|
|
Payroll and related accruals
|
|
$
|
172
|
|
$
|
135
|
|
Volume and rebate accruals
|
|
|
58
|
|
|
48
|
|
Taxes other than income taxes
|
|
|
77
|
|
|
60
|
|
Income taxes
|
|
|
62
|
|
|
28
|
|
Restructuring and plant closing reserves
|
|
|
15
|
|
|
28
|
|
Interest
|
|
|
20
|
|
|
21
|
|
Pension liabilities
|
|
|
15
|
|
|
11
|
|
Other postretirement benefits
|
|
|
7
|
|
|
8
|
|
Environmental accruals
|
|
|
6
|
|
|
7
|
|
Other miscellaneous accruals
|
|
|
134
|
|
|
122
|
|
Total
|
|
$
|
566
|
|
$
|
468
|
11. RESTRUCTURING, IMPAIRMENT AND PLANT CLOSING COSTS
As of December 31, 2017, 2016 and 2015, accrued restructuring costs of continuing operations by type of cost and initiative consisted of the following (dollars in millions):
|
|
|
|
|
|
|
|
|
|
|
|
|
|
|
|
|
|
|
|
|
|
|
|
Non-cancelable
|
|
Other
|
|
|
|
|
|
Workforce
|
|
Demolition and
|
|
lease and contract
|
|
restructuring
|
|
|
|
|
|
reductions(1)
|
|
decommissioning
|
|
termination costs
|
|
costs
|
|
Total(2)
|
|
Accrued liabilities as of January 1, 2015
|
|
$
|
28
|
|
$
|
—
|
|
$
|
47
|
|
$
|
3
|
|
$
|
78
|
|
2015 charges for 2014 and prior initiatives
|
|
|
8
|
|
|
24
|
|
|
15
|
|
|
9
|
|
|
56
|
|
2015 charges for 2015 initiatives
|
|
|
30
|
|
|
—
|
|
|
—
|
|
|
3
|
|
|
33
|
|
Reversal of reserves no longer required
|
|
|
(7)
|
|
|
—
|
|
|
(6)
|
|
|
—
|
|
|
(13)
|
|
2015 payments for 2014 and prior initiatives
|
|
|
(23)
|
|
|
(8)
|
|
|
(17)
|
|
|
(7)
|
|
|
(55)
|
|
2015 payments for 2015 initiatives
|
|
|
(16)
|
|
|
—
|
|
|
—
|
|
|
(3)
|
|
|
(19)
|
|
Foreign currency effect on liability balance
|
|
|
(1)
|
|
|
—
|
|
|
(2)
|
|
|
—
|
|
|
(3)
|
|
Accrued liabilities as of December 31, 2015
|
|
|
19
|
|
|
16
|
|
|
37
|
|
|
5
|
|
|
77
|
|
2016 charges for 2015 and prior initiatives
|
|
|
1
|
|
|
24
|
|
|
9
|
|
|
13
|
|
|
47
|
|
2016 charges for 2016 initiatives
|
|
|
1
|
|
|
—
|
|
|
—
|
|
|
5
|
|
|
6
|
|
Reversal of reserves no longer required
|
|
|
(2)
|
|
|
—
|
|
|
—
|
|
|
—
|
|
|
(2)
|
|
Distribution of prefunded restructuring costs
|
|
|
(5)
|
|
|
(5)
|
|
|
—
|
|
|
(1)
|
|
|
(11)
|
|
2016 payments for 2015 and prior initiatives
|
|
|
(8)
|
|
|
(15)
|
|
|
(4)
|
|
|
(13)
|
|
|
(40)
|
|
2016 payments for 2016 initiatives
|
|
|
(1)
|
|
|
—
|
|
|
—
|
|
|
(4)
|
|
|
(5)
|
|
Foreign currency effect on liability balance
|
|
|
(1)
|
|
|
(1)
|
|
|
(2)
|
|
|
—
|
|
|
(4)
|
|
Accrued liabilities as of December 31, 2016
|
|
|
4
|
|
|
19
|
|
|
40
|
|
|
5
|
|
|
68
|
|
2017 (credits) charges for 2016 and prior initiatives
|
|
|
(1)
|
|
|
3
|
|
|
2
|
|
|
2
|
|
|
6
|
|
2017 charges for 2017 initiatives
|
|
|
10
|
|
|
—
|
|
|
—
|
|
|
2
|
|
|
12
|
|
2017 payments for 2016 and prior initiatives
|
|
|
(1)
|
|
|
(21)
|
|
|
(2)
|
|
|
(2)
|
|
|
(26)
|
|
2017 payments for 2017 initiatives
|
|
|
(8)
|
|
|
—
|
|
|
—
|
|
|
(2)
|
|
|
(10)
|
|
Foreign currency effect on liability balance
|
|
|
1
|
|
|
1
|
|
|
1
|
|
|
—
|
|
|
3
|
|
Accrued liabilities as of December 31, 2017
|
|
$
|
5
|
|
$
|
2
|
|
$
|
41
|
|
$
|
5
|
|
$
|
53
|
|
(1)
| |
The total workforce reduction reserves of $5 million relate to the termination of 130 positions, of which 82 positions had not been terminated as of December 31, 2017. |
|
(2)
| |
In December 2015, we prepaid $9 million of severance and other restructuring costs related to restructuring programs in our Textile Effects and Performance Products segments. Certain of the severance costs were prepaid to a third party who distributed the severance payments to affected employees when they were terminated in 2016. |
Table of Contents
HUNTSMAN CORPORATION AND SUBSIDIARIES
HUNTSMAN INTERNATIONAL LLC AND SUBSIDIARIES
NOTES TO CONSOLIDATED FINANCIAL STATEMENTS (Continued)
|
(3)
| |
Accrued liabilities remaining at December 31, 2017 and 2016 by year of initiatives were as follows (dollars in millions): |
|
|
|
|
|
|
|
|
|
|
|
December 31,
|
|
|
|
2017
|
|
2016
|
|
2015 initiatives
|
|
$
|
50
|
|
$
|
67
|
|
2016 initiatives
|
|
|
1
|
|
|
1
|
|
2017 initiatives
|
|
|
2
|
|
|
—
|
|
Total
|
|
$
|
53
|
|
$
|
68
|
Details with respect to our reserves for restructuring, impairment and plant closing costs are provided below by segment and initiative (dollars in millions):
|
|
|
|
|
|
|
|
|
|
|
|
|
|
|
|
|
|
|
|
|
|
|
|
|
|
Performance
|
|
Advanced
|
|
Textile
|
|
Corporate
|
|
|
|
|
|
|
Polyurethanes
|
|
Products
|
|
Materials
|
|
Effects
|
|
and other
|
|
Total
|
|
|
Accrued liabilities as of January 1, 2015
|
|
$
|
6
|
|
$
|
9
|
|
$
|
5
|
|
$
|
54
|
|
$
|
4
|
|
$
|
78
|
|
|
2015 charges for 2014 and prior initiatives
|
|
|
2
|
|
|
3
|
|
|
1
|
|
|
42
|
|
|
8
|
|
|
56
|
|
|
2015 charges for 2015 initiatives
|
|
|
17
|
|
|
8
|
|
|
5
|
|
|
2
|
|
|
1
|
|
|
33
|
|
|
Reversal of reserves no longer required
|
|
|
(4)
|
|
|
(1)
|
|
|
—
|
|
|
(7)
|
|
|
(1)
|
|
|
(13)
|
|
|
2015 payments for 2014 and prior initiatives
|
|
|
(4)
|
|
|
(8)
|
|
|
(2)
|
|
|
(34)
|
|
|
(7)
|
|
|
(55)
|
|
|
2015 payments for 2015 initiatives
|
|
|
(11)
|
|
|
(1)
|
|
|
(5)
|
|
|
(1)
|
|
|
(1)
|
|
|
(19)
|
|
|
Foreign currency effect on liability balance
|
|
|
(1)
|
|
|
(1)
|
|
|
—
|
|
|
(1)
|
|
|
—
|
|
|
(3)
|
|
|
Accrued liabilities as of December 31, 2015
|
|
|
5
|
|
|
9
|
|
|
4
|
|
|
55
|
|
|
4
|
|
|
77
|
|
|
2016 charges for 2015 and prior initiatives
|
|
|
—
|
|
|
16
|
|
|
—
|
|
|
28
|
|
|
3
|
|
|
47
|
|
|
2016 charges for 2016 initiatives
|
|
|
4
|
|
|
—
|
|
|
—
|
|
|
1
|
|
|
1
|
|
|
6
|
|
|
Reversal of reserves no longer required
|
|
|
(1)
|
|
|
—
|
|
|
—
|
|
|
—
|
|
|
(1)
|
|
|
(2)
|
|
|
Distribution of prefunded restructuring costs
|
|
|
—
|
|
|
(6)
|
|
|
—
|
|
|
(5)
|
|
|
—
|
|
|
(11)
|
|
|
2016 payments for 2015 and prior initiatives
|
|
|
(3)
|
|
|
(19)
|
|
|
—
|
|
|
(14)
|
|
|
(4)
|
|
|
(40)
|
|
|
2016 payments for 2016 initiatives
|
|
|
(3)
|
|
|
—
|
|
|
—
|
|
|
(1)
|
|
|
(1)
|
|
|
(5)
|
|
|
Foreign currency effect on liability balance
|
|
|
—
|
|
|
—
|
|
|
(1)
|
|
|
(3)
|
|
|
—
|
|
|
(4)
|
|
|
Accrued liabilities as of December 31, 2016
|
|
|
2
|
|
|
—
|
|
|
3
|
|
|
61
|
|
|
2
|
|
|
68
|
|
|
2017 charges for 2016 and prior initiatives
|
|
|
—
|
|
|
—
|
|
|
—
|
|
|
6
|
|
|
—
|
|
|
6
|
|
|
2017 charges for 2017 initiatives
|
|
|
—
|
|
|
1
|
|
|
—
|
|
|
7
|
|
|
4
|
|
|
12
|
|
|
2017 payments for 2016 and prior initiatives
|
|
|
(1)
|
|
|
—
|
|
|
—
|
|
|
(25)
|
|
|
—
|
|
|
(26)
|
|
|
2017 payments for 2017 initiatives
|
|
|
—
|
|
|
—
|
|
|
—
|
|
|
(5)
|
|
|
(5)
|
|
|
(10)
|
|
|
Foreign currency effect on liability balance
|
|
|
—
|
|
|
—
|
|
|
—
|
|
|
3
|
|
|
—
|
|
|
3
|
|
|
Accrued liabilities as of December 31, 2017
|
|
$
|
1
|
|
$
|
1
|
|
$
|
3
|
|
|
47
|
|
$
|
1
|
|
$
|
53
|
|
|
|
|
|
|
|
|
|
|
|
|
|
|
|
|
|
|
|
|
|
|
|
Current portion of restructuring reserves
|
|
$
|
1
|
|
$
|
1
|
|
$
|
3
|
|
$
|
9
|
|
$
|
1
|
|
$
|
15
|
|
|
Long-term portion of restructuring reserves
|
|
|
—
|
|
|
—
|
|
|
—
|
|
|
38
|
|
|
—
|
|
|
38
|
|
|
|
|
|
|
|
|
|
|
|
|
|
|
|
|
|
|
|
|
|
|
Details with respect to cash and noncash restructuring charges for the years ended December 31, 2017, 2016 and 2015 by initiative are provided below (dollars in millions):
|
|
|
|
|
|
|
Cash charges:
|
|
|
|
|
|
2017 charges for 2016 and prior initiatives
|
|
|
$
|
6
|
|
2017 charges for 2017 initiatives
|
|
|
|
12
|
|
Pension-related charges
|
|
|
|
1
|
|
Noncash charges:
|
|
|
|
|
|
Accelerated depreciation
|
|
|
|
2
|
|
Other noncash credits
|
|
|
|
(1)
|
|
Total 2017 Restructuring, Impairment and Plant Closing Costs
|
|
|
$
|
20
|
Table of Contents
HUNTSMAN CORPORATION AND SUBSIDIARIES
HUNTSMAN INTERNATIONAL LLC AND SUBSIDIARIES
NOTES TO CONSOLIDATED FINANCIAL STATEMENTS (Continued)
|
|
|
|
|
|
|
Cash charges:
|
|
|
|
|
|
2016 charges for 2015 and prior initiatives
|
|
|
$
|
47
|
|
2016 charges for 2016 initiatives
|
|
|
|
6
|
|
Reversal of reserves no longer required
|
|
|
|
(2)
|
|
Noncash charges:
|
|
|
|
|
|
Gain on sale of land
|
|
|
|
(4)
|
|
Total 2016 Restructuring, Impairment and Plant Closing Costs
|
|
|
$
|
47
|
|
|
|
|
|
|
|
Cash charges:
|
|
|
|
|
|
2015 charges for 2014 and prior initiatives
|
|
|
$
|
56
|
|
2015 charges for 2015 initiatives
|
|
|
|
33
|
|
Reversal of reserves no longer required
|
|
|
|
(13)
|
|
Noncash charges:
|
|
|
|
|
|
Accelerated depreciation
|
|
|
|
6
|
|
Other noncash charges
|
|
|
|
1
|
|
Total 2015 Restructuring, Impairment and Plant Closing Costs
|
|
|
$
|
83
|
2017 Restructuring Activities
In September 2011, we implemented the Textile Effects Restructuring Plan, including the closure of our production facilities and business support offices in Basel, Switzerland. In connection with this restructuring plan, during the year ended December 31, 2017, our Textile Effects segment recorded restructuring expense of approximately $6 million associated with this initiative, including $2 million for non-cancelable long-term contract termination costs and $4 million for decommissioning.
During the first quarter of 2017, we implemented a restructuring program to improve competitiveness in our Textile Effects segment. In connection with this restructuring program, we recorded restructuring expense of $7 million in the year ended December 31, 2017 related primarily to workforce reductions. We expect to incur additional charges of approximately $1 million through the fourth quarter of 2018.
2016 Restructuring Activities
In December 2015, our Performance Products segment announced plans for a reorganization of its commercial and technical functions and a refocused divisional business strategy to better position the segment for growth in coming years. In addition, a program was launched to capture growth opportunities, improve manufacturing cost efficiency and reduce inventories. In connection with this restructuring program, we recorded restructuring expense of $16 million in 2016. All expected charges have been incurred as of the end of 2016.
In connection with the Textile Effects Restructuring Plan during 2016, our Textile Effects segment recorded charges of $9 million for non-cancelable long-term contract termination costs and $20 million for decommissioning associated with this initiative.
2015 Restructuring Activities
In June 2015, our Polyurethanes segment initiated a restructuring program in Europe. In connection with this restructuring program, we recorded restructuring expense of $13 million during 2015 related primarily to workforce reductions. All expected charges have been incurred as of the end of 2015.
During 2013, our Performance Products segment initiated a restructuring program to refocus its surfactants business in Europe (the “Performance Products Restructuring Plan”). As part of our Performance Products Restructuring Plan, we recorded cash charges of $8 million primarily related to workforce reductions in 2015.
In June 2015, our Advanced Materials segment initiated a restructuring program in Europe. In connection with this restructuring program, we recorded restructuring expense of $11 million during 2015 related primarily to workforce reductions and accelerated depreciation recorded as restructuring, impairment and plant closing costs.
Table of Contents
HUNTSMAN CORPORATION AND SUBSIDIARIES
HUNTSMAN INTERNATIONAL LLC AND SUBSIDIARIES
NOTES TO CONSOLIDATED FINANCIAL STATEMENTS (Continued)
In connection with the Textile Effects Restructuring Plan, during 2015, we recorded charges of $9 million for non-cancelable long-term contract termination costs, $21 million for decommissioning and $1 million of other restructuring charges associated with this initiative. During the fourth quarter of 2015, we settled certain of our obligations under these long-term contracts and recorded a restructuring charge of $14 million. In addition, we recorded charges of $6 million associated with other initiatives.
During 2015, our Corporate and other segment recorded charges of $8 million primarily related to a reorganization of our global information technology organization.
12. OTHER NONCURRENT LIABILITIES
Other noncurrent liabilities consisted of the following (dollars in millions):
Huntsman Corporation
|
|
|
|
|
|
|
|
|
|
|
December 31,
|
|
|
|
2017
|
|
2016
|
|
Pension liabilities
|
|
$
|
715
|
|
$
|
743
|
|
Other postretirement benefits
|
|
|
73
|
|
|
85
|
|
Environmental accruals
|
|
|
15
|
|
|
15
|
|
Restructuring and plant closing reserves
|
|
|
38
|
|
|
40
|
|
Employee benefit accrual
|
|
|
34
|
|
|
27
|
|
Asset retirement obligations
|
|
|
9
|
|
|
8
|
|
Other
|
|
|
202
|
|
|
139
|
|
Total
|
|
$
|
1,086
|
|
$
|
1,057
|
Huntsman International
|
|
|
|
|
|
|
|
|
|
|
December 31,
|
|
|
|
2017
|
|
2016
|
|
Pension liabilities
|
|
$
|
715
|
|
$
|
743
|
|
Other postretirement benefits
|
|
|
73
|
|
|
85
|
|
Environmental accruals
|
|
|
15
|
|
|
15
|
|
Restructuring and plant closing reserves
|
|
|
38
|
|
|
40
|
|
Employee benefit accrual
|
|
|
34
|
|
|
27
|
|
Asset retirement obligations
|
|
|
9
|
|
|
8
|
|
Other
|
|
|
188
|
|
|
133
|
|
Total
|
|
$
|
1,072
|
|
$
|
1,051
|
Table of Contents
HUNTSMAN CORPORATION AND SUBSIDIARIES
HUNTSMAN INTERNATIONAL LLC AND SUBSIDIARIES
NOTES TO CONSOLIDATED FINANCIAL STATEMENTS (Continued)
13. DEBT
Outstanding debt, net of debt issuance costs, of consolidated entities consisted of the following (dollars in millions):
Huntsman Corporation
|
|
|
|
|
|
|
|
|
|
|
December 31,
|
|
|
|
2017
|
|
2016
|
|
Senior Credit Facilities:
|
|
|
|
|
|
|
|
Term loans
|
|
$
|
—
|
|
$
|
1,967
|
|
Amounts outstanding under A/R programs
|
|
|
180
|
|
|
208
|
|
Senior notes
|
|
|
1,927
|
|
|
1,812
|
|
Variable interest entities
|
|
|
107
|
|
|
126
|
|
Other
|
|
|
84
|
|
|
59
|
|
Total debt—excluding debt to affiliates
|
|
$
|
2,298
|
|
$
|
4,172
|
|
Total current portion of debt
|
|
$
|
40
|
|
$
|
50
|
|
Long-term portion
|
|
|
2,258
|
|
|
4,122
|
|
Total debt—excluding debt to affiliates
|
|
$
|
2,298
|
|
$
|
4,172
|
|
Total debt—excluding debt to affiliates
|
|
$
|
2,298
|
|
$
|
4,172
|
|
Notes payable to affiliates-noncurrent
|
|
|
—
|
|
|
1
|
|
Total debt
|
|
$
|
2,298
|
|
$
|
4,173
|
Huntsman International
|
|
|
|
|
|
|
|
|
|
|
December 31,
|
|
|
|
2017
|
|
2016
|
|
Senior Credit Facilities:
|
|
|
|
|
|
|
|
Term loans
|
|
$
|
—
|
|
$
|
1,967
|
|
Amounts outstanding under A/R programs
|
|
|
180
|
|
|
208
|
|
Senior notes
|
|
|
1,927
|
|
|
1,812
|
|
Variable interest entities
|
|
|
107
|
|
|
126
|
|
Other
|
|
|
84
|
|
|
59
|
|
Total debt—excluding debt to affiliates
|
|
$
|
2,298
|
|
$
|
4,172
|
|
Total current portion of debt
|
|
$
|
40
|
|
$
|
50
|
|
Long-term portion
|
|
|
2,258
|
|
|
4,122
|
|
Total debt—excluding debt to affiliates
|
|
$
|
2,298
|
|
$
|
4,172
|
|
Total debt—excluding debt to affiliates
|
|
$
|
2,298
|
|
$
|
4,172
|
|
Notes payable to affiliates-current
|
|
|
100
|
|
|
100
|
|
Notes payable to affiliates-noncurrent
|
|
|
742
|
|
|
697
|
|
Total debt
|
|
$
|
3,140
|
|
$
|
4,969
|
Direct and Subsidiary Debt
Huntsman Corporation’s direct debt and guarantee obligations consist of a guarantee of certain indebtedness incurred from time to time to finance certain insurance premiums. Substantially all of our other debt, including the facilities described below, has been incurred by our subsidiaries (primarily Huntsman International); Huntsman Corporation is not a guarantor of such subsidiary debt.
Certain of our subsidiaries are designated as nonguarantor subsidiaries and have third‑party debt agreements. These debt agreements contain certain restrictions with regard to dividends, distributions, loans or advances. In certain circumstances, the consent of a third party would be required prior to the transfer of any cash or assets from these subsidiaries to us.
Table of Contents
HUNTSMAN CORPORATION AND SUBSIDIARIES
HUNTSMAN INTERNATIONAL LLC AND SUBSIDIARIES
NOTES TO CONSOLIDATED FINANCIAL STATEMENTS (Continued)
Debt Issuance Costs
We record debt issuance costs related to a debt liability on the balance sheet as a reduction in the face amount of that debt liability. As of December 31, 2017 and 2016, the amount of debt issuance costs directly reducing the debt liability was $11 million and $57 million, respectively. We record the amortization of debt issuance costs as interest expense.
Senior Credit Facilities
As of December 31, 2017, our Senior Credit Facilities consisted of a Revolving Facility as follows (dollars in millions):
|
|
|
|
|
|
|
|
|
|
|
|
|
|
|
|
|
|
|
|
|
|
|
|
|
Unamortized
|
|
|
|
|
|
|
|
|
|
|
|
|
|
Discounts and
|
|
|
|
|
|
|
|
|
|
Committed
|
|
Principal
|
|
Debt Issuance
|
|
Carrying
|
|
|
|
|
|
Facility
|
|
Amount
|
|
Outstanding
|
|
Costs
|
|
Value
|
|
Interest Rate(2)
|
|
Maturity
|
|
Revolving Facility
|
|
$
|
650
|
|
$
|
—
|
(1)
|
$
|
—
|
(1)
|
$
|
—
|
(1)
|
USD LIBOR plus 2.50%
|
|
2021
|
|
(1)
| |
We had no borrowings outstanding under our Revolving Facility; we had approximately $9 million (U.S. dollar equivalents) of letters of credit and bank guarantees issued and outstanding under our Revolving Facility. |
|
(2)
| |
The applicable interest rate of the Revolving Facility is subject to certain secured leverage ratio thresholds. |
Our obligations under the Senior Credit Facilities are guaranteed by substantially all of our domestic subsidiaries (collectively, the “Guarantors”), and are secured by a first priority lien on substantially all of our domestic property, plant and equipment (other than property, plant and equipment held by Venator and its subsidiaries), the stock of all of our material domestic subsidiaries (other than Venator and its subsidiaries) and certain foreign subsidiaries, and pledges of intercompany notes between certain of our subsidiaries.
Repayment of Senior Secured Term Loans
During 2017, we repaid in full our 2015 Extended Term Loan B, our 2021 Term Loan B, and our 2023 Term Loan B as follows:
|
·
| |
In December 2017, we repaid in full the remaining $511 million on our 2023 Term Loan B using the funds raised from the secondary offering of Venator and existing cash and recognized a loss on early extinguishment of debt of $15 million. See “Note 3. Discontinued Operations and Business Dispositions—Separation of P&A Business.” |
|
·
| |
In August 2017, we made early prepayments of $1,207 million ($450 million of which constituted a mandatory repayment as described in the seventeenth amendment to the Senior Credit Facilities) on our Senior Credit Facilities, of which $106 million was paid on our 2015 Extended Term Loan B, $347 million was paid on our 2021 Term Loan B, and $754 million was paid on our 2023 Term Loan B. The funds used to pay down the debt included $732 million received from Venator ($750 million of debt raised by Venator net of $18 million of debt issuance costs), upon its payment of intercompany debt obligations owed to Huntsman and $475 million from proceeds of the Venator IPO. In connection with the $1,207 million prepayments of our term loans, we recognized a loss on early extinguishment of debt of $34 million. See “Note 3. Discontinued Operations and Business Dispositions—Separation of P&A Business.” |
In connection with the Separation, Venator raised $750 million of new financing, which included (i) $375 million of senior unsecured notes and (ii) $375 million under a new senior secured term loan facility. In addition, Venator entered into a new undrawn asset-based revolving lending facility in aggregate principal amount of up to $300 million. The Venator senior unsecured notes are guaranteed on a general unsecured senior basis by Venator and certain Venator subsidiaries. The Venator senior credit facilities are unconditionally guaranteed, jointly and severally, on a senior secured basis by Venator and certain of its subsidiaries. At Separation, the Venator debt facilities were recorded within current liabilities held for sale.
Table of Contents
HUNTSMAN CORPORATION AND SUBSIDIARIES
HUNTSMAN INTERNATIONAL LLC AND SUBSIDIARIES
NOTES TO CONSOLIDATED FINANCIAL STATEMENTS (Continued)
Huntsman Corporation and its direct and indirect subsidiaries (other than Venator and its subsidiaries) do not provide any direct or indirect guarantee for the Venator debt obligations described above and they are non recourse to Huntsman Corporation and its subsidiaries.
|
·
| |
In addition, on October 25, 2017, we made an early repayment of $100 million on our 2023 Term Loan B from existing cash, and on both July 26, 2017 and April 25, 2017, we made early repayments of $100 million each on our 2015 Extended Term Loan B from existing cash. In connection with the $300 million prepayments on our term loans, we recognized a loss on early extinguishment of debt of $3 million. |
Seventeenth Amendment to Credit Agreement
On June 15, 2017, Huntsman International entered into a seventeenth amendment to the agreement governing the Senior Credit Facilities. The amendment permitted us to complete the Separation. In connection with the Separation, the amendment permitted the incurrence of certain indebtedness of Venator and the internal restructuring of the P&A Business assets. With the completion of the Separation, Venator and its subsidiaries were designated as unrestricted subsidiaries.
A/R Programs
Our A/R Programs are structured so that we grant a participating undivided interest in certain of our trade receivables to the U.S. SPE and the EU SPE. We retain the servicing rights and a retained interest in the securitized receivables. Information regarding our A/R Programs as of December 31, 2017 was as follows (monetary amounts in millions):
|
|
|
|
|
|
|
|
|
|
|
|
|
|
|
|
|
Maximum Funding
|
|
Amount
|
|
|
|
Facility
|
|
Maturity
|
|
Availability(1)
|
|
Outstanding
|
|
Interest Rate(2)
|
|
U.S. A/R Program
|
|
April 2020
|
|
$
|
250
|
|
$
|
90
|
(3)
|
Applicable rate plus 0.95%
|
|
EU A/R Program
|
|
April 2020
|
|
€
|
150
|
|
€
|
76
|
|
Applicable rate plus 1.30%
|
|
|
|
|
|
|
(approximately $179)
|
|
|
(approximately $90)
|
|
|
|
(1)
| |
The amount of actual availability under our A/R Programs may be lower based on the level of eligible receivables sold, changes in the credit ratings of our customers, customer concentration levels and certain characteristics of the accounts receivable being transferred, as defined in the applicable agreements. |
|
(2)
| |
Applicable rate for our U.S. A/R Program is defined by the lender as USD LIBOR. Applicable rate for our EU A/R Program is either GBP LIBOR, USD LIBOR or EURIBOR. |
|
(3)
| |
As of December 31, 2017, we had approximately $5 million (U.S. dollar equivalents) of letters of credit issued and outstanding under our U.S. A/R Program. |
On April 21, 2017, we entered into amendments to our A/R Programs that, among other things, extend the scheduled termination dates to April 2020. As of December 31, 2017 and December 31, 2016, $334 million and $328 million, respectively, of accounts receivable were pledged as collateral under our A/R Programs from continuing operations.
Notes
As of December 31, 2017, we had outstanding the following notes (monetary amounts in millions):
|
|
|
|
|
|
|
|
|
|
|
|
|
|
|
|
|
|
|
|
Unamortized
|
|
|
|
|
|
|
|
|
|
Discounts
|
|
|
|
|
|
|
|
|
|
and Debt
|
|
Notes
|
|
Maturity
|
|
Interest Rate
|
|
Amount Outstanding
|
|
Issuance Costs
|
|
2020 Senior Notes
|
|
November 2020
|
|
4.875
|
%
|
$650 ($647 carrying value)
|
|
$
|
(3)
|
|
2021 Senior Notes
|
|
April 2021
|
|
5.125
|
%
|
€445 (€444 carrying value $(529))
|
|
|
(1)
|
|
2022 Senior Notes
|
|
November 2022
|
|
5.125
|
%
|
$400 ($397 carrying value)
|
|
|
(3)
|
|
2025 Senior Notes
|
|
April 2025
|
|
4.250
|
%
|
€300 (€297 carrying value $(354))
|
|
|
(3)
|
Table of Contents
HUNTSMAN CORPORATION AND SUBSIDIARIES
HUNTSMAN INTERNATIONAL LLC AND SUBSIDIARIES
NOTES TO CONSOLIDATED FINANCIAL STATEMENTS (Continued)
The 2020, 2021, 2022 and 2025 Senior Notes are general unsecured senior obligations of Huntsman International and are guaranteed on a general unsecured senior basis by the Guarantors. The indentures impose certain limitations on the ability of Huntsman International and its subsidiaries to, among other things, incur additional indebtedness secured by any principal properties, incur indebtedness of nonguarantor subsidiaries, enter into sale and leaseback transactions with respect to any principal properties and consolidate or merge with or into any other person or lease, sell or transfer all or substantially all of its properties and assets. Upon the occurrence of certain change of control events, holders of the 2020, 2021, 2022 and 2025 Senior Notes will have the right to require that Huntsman International purchase all or a portion of such holder’s notes in cash at a purchase price equal to 101% of the principal amount thereof plus accrued and unpaid interest to the date of repurchase.
Redemption of Notes and Loss on Early Extinguishment of Debt
During the year ended December 31, 2015, we redeemed or repurchased the following notes (dollars in millions):
|
|
|
|
|
|
|
|
|
|
|
|
|
|
|
|
|
|
|
|
|
Amount Paid
|
|
Loss on Early
|
|
|
|
|
|
Principal Amount of
|
|
(Excluding Accrued
|
|
Extinguishment
|
|
Date of Redemption
|
|
Notes
|
|
Notes Redeemed
|
|
Interest)
|
|
of Debt
|
|
September 2015
|
|
2021 Senior Subordinated Notes
|
|
$
|
195
|
|
$
|
204
|
|
$
|
7
|
|
April 2015
|
|
2021 Senior Subordinated Notes
|
|
|
289
|
|
|
311
|
|
|
20
|
|
January 2015
|
|
2021 Senior Subordinated Notes
|
|
|
37
|
|
|
40
|
|
|
3
|
Variable Interest Entity Debt
As of December 31, 2017, AAC, our consolidated 50%-owned joint venture, had $107 million outstanding under its loan commitments and debt financing arrangements. As of December 31, 2017, we have $21 million classified as current debt and $86 million as long-term debt on our consolidated balance sheets. We do not guarantee these loan commitments, and AAC is not a guarantor of any of our other debt obligations.
Other Debt
On July 24, 2015, HPS entered into a financing arrangement to fund the construction of our MDI plant in China. As part of the financing, HPS has secured commitments of a RMB 669 million (approximately $102 million) term loan and a RMB 423 million (approximately $65 million) working capital facility. These facilities are unsecured, and we do not provide a guarantee of these loan commitments. As of December 31, 2017, we had term loan borrowings of RMB 277 million (approximately $42 million) and no borrowings under the working capital facility. The interest rate on the facilities is 90% of the Peoples Bank of China rate. As of December 31, 2017, the interest rate was approximately 4%.
Note Payable from Huntsman International to Huntsman Corporation
As of December 31, 2017, we have a loan of $842 million to our subsidiary, Huntsman International. The Intercompany Note is unsecured and $100 million of the outstanding amount is classified as current as of December 31, 2017 on our consolidated balance sheets. As of December 31, 2017, under the terms of the Intercompany Note, Huntsman International promises to pay us interest on the unpaid principal amount at a rate per annum based on the previous monthly average borrowing rate obtained under our U.S. A/R Program, less 10 basis points (provided that the rate shall not exceed an amount that is 25 basis points less than the monthly average borrowing rate obtained for the U.S. LIBOR‑based borrowings under our Revolving Facility).
Compliance With Covenants
We believe that we are in compliance with the covenants contained in the agreements governing our material debt instruments, including our Senior Credit Facilities, our A/R Programs and our notes.
Our material financing arrangements contain certain covenants with which we must comply. A failure to comply with a covenant could result in a default under a financing arrangement unless we obtained an appropriate waiver or forbearance (as to which we can provide no assurance). A default under these material financing arrangements
Table of Contents
HUNTSMAN CORPORATION AND SUBSIDIARIES
HUNTSMAN INTERNATIONAL LLC AND SUBSIDIARIES
NOTES TO CONSOLIDATED FINANCIAL STATEMENTS (Continued)
generally allows debt holders the option to declare the underlying debt obligations immediately due and payable. Furthermore, certain of our material financing arrangements contain cross‑default and cross-acceleration provisions under which a failure to comply with the covenants in one financing arrangement may result in an event of default under another financing arrangement.
Our Senior Credit Facilities have the Leverage Covenant which applies only to the Revolving Facility and is calculated at the Huntsman International level. The Leverage Covenant is applicable only if borrowings, letters of credit or guarantees are outstanding under the Revolving Facility (cash collateralized letters of credit or guarantees are not deemed outstanding). The Leverage Covenant is a net senior secured leverage ratio covenant which requires that Huntsman International’s ratio of senior secured debt to EBITDA (as defined in the applicable agreement) is not more than 3.75 to 1.
If in the future Huntsman International fails to comply with the Leverage Covenant, then we may not have access to liquidity under our Revolving Facility. If Huntsman International failed to comply with the Leverage Covenant at a time when we had uncollateralized loans or letters of credit outstanding under the Revolving Facility, Huntsman International would be in default under the Senior Credit Facilities, and, unless Huntsman International obtained a waiver or forbearance with respect to such default (as to which we can provide no assurance), Huntsman International could be required to pay off the balance of the Senior Credit Facilities in full, and we may not have further access to such facilities.
The agreements governing our A/R Programs also contain certain receivable performance metrics. Any material failure to meet the applicable A/R Programs’ metrics in the future could lead to an early termination event under the A/R Programs, which could require us to cease our use of such facilities, prohibiting us from additional borrowings against our receivables or, at the discretion of the lenders, requiring that we repay the A/R Programs in full. An early termination event under the A/R Programs would also constitute an event of default under our Senior Credit Facilities, which could require us to pay off the balance of the Senior Credit Facilities in full and could result in the loss of our Senior Credit Facilities.
Maturities
The scheduled maturities of our debt (excluding debt to affiliates) by year as of December 31, 2017 are as follows (dollars in millions):
|
|
|
|
|
|
Year ending December 31,
|
|
|
|
|
2018
|
|
$
|
40
|
|
2019
|
|
|
27
|
|
2020
|
|
|
865
|
|
2021
|
|
|
560
|
|
2022
|
|
|
409
|
|
Thereafter
|
|
|
397
|
|
|
|
$
|
2,298
|
14. DERIVATIVE INSTRUMENTS AND HEDGING ACTIVITIES
We are exposed to market risks, such as changes in interest rates, foreign exchange rates and commodity prices. From time to time, we enter into transactions, including transactions involving derivative instruments, to manage certain of these exposures. We also hedge our net investment in certain European operations. Changes in the fair value of the hedge in the net investment of certain European operations are recorded in accumulated other comprehensive loss.
Interest Rate Risk
Through our borrowing activities, we are exposed to interest rate risk. Such risk arises due to the structure of our debt portfolio, including the mix of fixed and floating interest rates. Actions taken to reduce interest rate risk include managing the mix and rate characteristics of various interest bearing liabilities, as well as entering into interest rate derivative instruments.
Table of Contents
HUNTSMAN CORPORATION AND SUBSIDIARIES
HUNTSMAN INTERNATIONAL LLC AND SUBSIDIARIES
NOTES TO CONSOLIDATED FINANCIAL STATEMENTS (Continued)
From time to time, we may purchase interest rate swaps and/or other derivative instruments to reduce the impact of changes in interest rates on our floating-rate long-term debt. Under interest rate swaps, we agree with other parties to exchange, at specified intervals, the difference between fixed-rate and floating-rate interest amounts calculated by reference to an agreed notional principal amount.
Huntsman International had entered into several interest rate contracts to hedge the variability caused by monthly changes in cash flow due to associated changes in LIBOR under our Senior Credit Facilities. These swaps were designated as cash flow hedges and the effective portion of the changes in the fair value of the swaps were recorded in other comprehensive income (loss). These swaps expired in April 2017.
Beginning in 2009, AAC entered into a 12-year floating to fixed interest rate contract providing for a receipt of LIBOR interest payments for a fixed payment of 5.02%. In connection with the consolidation of AAC as of July 1, 2010, the interest rate contract is now included in our consolidated results. See “Note 7. Variable Interest Entities.” The notional amount of the swap as of December 31, 2017 was $14 million, and the interest rate contract is not designated as a cash flow hedge. As of both December 31, 2017 and 2016, the fair value of the swap was $1 million, and was recorded as other noncurrent liabilities on our consolidated balance sheets. For 2017 and 2016, we recorded a reduction of interest expense of nil each due to changes in fair value of the swap.
During 2017, accumulated other comprehensive loss of nil was reclassified to earnings. The actual amount that will be reclassified to earnings over the next twelve months may vary from this amount due to changing market conditions. We would be exposed to credit losses in the event of nonperformance by a counterparty to our derivative financial instruments. We anticipate, however, that the counterparties will be able to fully satisfy their obligations under the contracts. Market risk arises from changes in interest rates.
Foreign Exchange Rate Risk
Our cash flows and earnings are subject to fluctuations due to exchange rate variation. Our revenues and expenses are denominated in various currencies. We enter into foreign currency derivative instruments to minimize the short-term impact of movements in foreign currency rates. Where practicable, we generally net multicurrency cash balances among our subsidiaries to help reduce exposure to foreign currency exchange rates. Certain other exposures may be managed from time to time through financial market transactions, principally through the purchase of spot or forward foreign exchange contracts (generally with maturities of three months or less). We do not hedge our currency exposures in a manner that would eliminate the effect of changes in exchange rates on our cash flows and earnings. As of December 31, 2017 and 2016, we had approximately $93 million and $176 million, respectively, notional amount (in U.S. dollar equivalents) outstanding in foreign currency contracts with a term of approximately one month, of which nil and $88 million, respectively, were on behalf of our former P&A Business.
In November 2014, we entered into two five year cross-currency interest rate contracts and one eight year cross-currency interest rate contract to swap an aggregate notional $200 million for an aggregate notional €161 million. The swap was designated as a hedge of net investment for financial reporting purposes. In August 2017, we terminated these cross-currency interest rate contracts and received $7 million from the counterparties.
In March 2010, we entered into three five year cross-currency interest rate contracts to swap an aggregate notional $350 million for an aggregate notional €255 million. This swap was designated as a hedge of net investment for financial reporting purposes. During the three months ended March 31, 2015, we terminated these cross-currency interest rate contracts and received $66 million in payments from the counterparties.
A portion of our debt is denominated in euros. We also finance certain of our non-U.S. subsidiaries with intercompany loans that are, in many cases, denominated in currencies other than the entities’ functional currency. We manage the net foreign currency exposure created by this debt through various means, including cross-currency swaps, the designation of certain intercompany loans as permanent loans because they are not expected to be repaid in the foreseeable future and the designation of certain debt and swaps as net investment hedges.
Foreign currency transaction gains and losses on intercompany loans that are not designated as permanent loans are recorded in earnings. Foreign currency transaction gains and losses on intercompany loans that are designated as permanent loans are recorded in other comprehensive income (loss). From time to time, we review such designation of intercompany loans.
Table of Contents
HUNTSMAN CORPORATION AND SUBSIDIARIES
HUNTSMAN INTERNATIONAL LLC AND SUBSIDIARIES
NOTES TO CONSOLIDATED FINANCIAL STATEMENTS (Continued)
We review our non‑U.S. dollar denominated debt and derivative instruments to determine the appropriate amounts designated as hedges. As of December 31, 2017, for our continuing operations, we have designated approximately €470 million (approximately $559 million) of euro‑denominated debt and cross‑currency interest rate contracts as a hedge of our net investment. For the years ended December 31, 2017, 2016 and 2015, for our continuing operations, the amounts recognized on the hedge of our net investment was a loss of $96 million, and gains of $27 million and $68 million, respectively, and were recorded in other comprehensive income (loss).
Commodity Prices Risk
Inherent in our business is exposure to price changes for several commodities. However, our exposure to changing commodity prices is somewhat limited since the majority of our raw materials are acquired at posted or market related prices, and sales prices for many of our finished products are at market related prices which are largely set on a monthly or quarterly basis in line with industry practice. Consequently, we do not generally hedge our commodity exposures.
15. FAIR VALUE
The fair values of our financial instruments were as follows (dollars in millions):
|
|
|
|
|
|
|
|
|
|
|
|
|
|
|
December 31, 2017
|
|
December 31, 2016
|
|
|
Carrying
|
|
Estimated
|
|
Carrying
|
|
Estimated
|
|
|
Value
|
|
Fair Value
|
|
Value
|
|
Fair Value
|
|
Non-qualified employee benefit plan investments
|
$
|
33
|
|
$
|
33
|
|
|
27
|
|
$
|
27
|
|
Investments in equity securities
|
|
—
|
|
|
—
|
|
|
18
|
|
|
18
|
|
Cross-currency interest rate contracts
|
|
—
|
|
|
—
|
|
|
29
|
|
|
29
|
|
Interest rate contracts
|
|
(1)
|
|
|
(1)
|
|
|
(2)
|
|
|
(2)
|
|
Long-term debt (including current portion)
|
|
(2,298)
|
|
|
(2,483)
|
|
|
(4,172)
|
|
|
(4,345)
|
The carrying amounts reported in the balance sheets of cash and cash equivalents, accounts receivable and accounts payable approximate fair value because of the immediate or short‑term maturity of these financial instruments. The fair values of non‑qualified employee benefit plan investments and investments in equity securities are obtained through market observable pricing using prevailing market prices. The estimated fair values of our long‑term debt are based on quoted market prices for the identical liability when traded as an asset in an active market (Level 1).
The fair value estimates presented herein are based on pertinent information available to management as of December 31, 2017 and 2016. Although management is not aware of any factors that would significantly affect the estimated fair value amounts, such amounts have not been comprehensively revalued for purposes of these financial statements since December 31, 2017, and current estimates of fair value may differ significantly from the amounts presented herein.
The following assets and liabilities are measured at fair value on a recurring basis (dollars in millions):
|
|
|
|
|
|
|
|
|
|
|
|
|
|
|
|
|
|
|
|
Fair Value Amounts Using
|
|
|
|
|
|
|
Quoted prices
|
|
Significant other
|
|
Significant
|
|
|
|
|
|
|
in active markets
|
|
observable
|
|
unobservable
|
|
|
|
December 31,
|
|
for identical
|
|
inputs
|
|
inputs
|
|
Description
|
|
2017
|
|
assets (Level 1)(3)
|
|
(Level 2)(3)
|
|
(Level 3)
|
|
Assets:
|
|
|
|
|
|
|
|
|
|
|
|
|
|
Available-for sale equity securities:
|
|
|
|
|
|
|
|
|
|
|
|
|
|
Non-qualified employee benefit plan investments
|
|
$
|
33
|
|
$
|
33
|
|
$
|
—
|
|
$
|
—
|
|
|
|
|
|
|
|
|
|
|
|
|
|
|
|
Liabilities:
|
|
|
|
|
|
|
|
|
|
|
|
|
|
Derivatives:
|
|
|
|
|
|
|
|
|
|
|
|
|
|
Interest rate contracts(1)
|
|
$
|
(1)
|
|
$
|
—
|
|
$
|
(1)
|
|
$
|
—
|
Table of Contents
HUNTSMAN CORPORATION AND SUBSIDIARIES
HUNTSMAN INTERNATIONAL LLC AND SUBSIDIARIES
NOTES TO CONSOLIDATED FINANCIAL STATEMENTS (Continued)
|
|
|
|
|
|
|
|
|
|
|
|
|
|
|
|
|
|
|
|
Fair Value Amounts Using
|
|
|
|
|
|
|
Quoted prices
|
|
Significant other
|
|
Significant
|
|
|
|
|
|
in active markets
|
|
observable
|
|
unobservable
|
|
|
|
December 31,
|
|
for identical
|
|
inputs
|
|
inputs
|
|
Description
|
|
2016
|
|
assets (Level 1)(3)
|
|
(Level 2)(3)
|
|
(Level 3)
|
|
Assets:
|
|
|
|
|
|
|
|
|
|
|
|
|
|
Available-for sale equity securities:
|
|
|
|
|
|
|
|
|
|
|
|
|
|
Non-qualified employee benefit plan investments
|
|
$
|
27
|
|
$
|
27
|
|
$
|
—
|
|
$
|
—
|
|
Investments in equity securities
|
|
|
18
|
|
|
18
|
|
|
—
|
|
|
—
|
|
Derivatives:
|
|
|
|
|
|
|
|
|
|
|
|
|
|
Cross-currency interest rate contracts(2)
|
|
|
29
|
|
|
—
|
|
|
—
|
|
|
29
|
|
Total assets
|
|
$
|
74
|
|
$
|
45
|
|
$
|
—
|
|
$
|
29
|
|
|
|
|
|
|
|
|
|
|
|
|
|
|
|
Liabilities:
|
|
|
|
|
|
|
|
|
|
|
|
|
|
Derivatives:
|
|
|
|
|
|
|
|
|
|
|
|
|
|
Interest rate contracts(1)
|
|
$
|
(2)
|
|
$
|
—
|
|
$
|
(2)
|
|
$
|
—
|
|
(1)
| |
The income approach is used to calculate the fair value of these instruments. Fair value represents the present value of estimated future cash flows, calculated using relevant interest rates and yield curves at stated intervals. There were no material changes to the valuation methods or assumptions used to determine the fair value during the current period. |
|
(2)
| |
The income approach is used to calculate the fair value of these instruments. Fair value represents the present value of estimated future cash flows, calculated using relevant interest rates, exchange rates, and yield curves at stated intervals. There were no material changes to the valuation methods or assumptions used to determine the fair value during the current period. |
In November 2014, we entered into two five year cross-currency interest rate contracts and one eight year cross-currency interest rate contract. These instruments had been categorized by us as Level 3 within the fair value hierarchy due to unobservable inputs associated with the credit valuation adjustment, which we deemed to be significant inputs to the overall measurement of fair value at inception. In August 2017, we terminated these cross-currency interest rate contracts and received $7 million in payments from the counterparties.
|
(3)
| |
There were no transfers between Levels 1 and 2 within the fair value hierarchy for the years ended December 31, 2017 and 2016. |
The following tables show reconciliations of beginning and ending balances for the years ended December 31, 2017 and 2016 for instruments measured at fair value on a recurring basis using significant unobservable inputs (Level 3) (dollars in millions).
|
|
|
|
|
|
|
|
Cross-Currency
|
|
|
|
Interest
|
|
|
|
Rate Contracts
|
|
Fair Value Measurements Using Significant Unobservable Inputs (Level 3)
|
|
|
|
Beginning balance
|
|
$
|
29
|
|
Transfers into Level 3
|
|
|
—
|
|
Transfers out of Level 3
|
|
|
—
|
|
Total (losses) gains:
|
|
|
|
|
Included in earnings
|
|
|
—
|
|
Included in other comprehensive income (loss)
|
|
|
(22)
|
|
Purchases, sales, issuances and settlements
|
|
|
(7)
|
|
Ending balance, December 31, 2017
|
|
$
|
—
|
|
The amount of total gains (losses) for the period included in earnings attributable to the change in unrealized gains (losses) relating to assets still held at December 31, 2017
|
|
$
|
—
|
Table of Contents
HUNTSMAN CORPORATION AND SUBSIDIARIES
HUNTSMAN INTERNATIONAL LLC AND SUBSIDIARIES
NOTES TO CONSOLIDATED FINANCIAL STATEMENTS (Continued)
|
|
|
|
|
|
|
|
Cross-Currency
|
|
|
|
Interest
|
|
|
|
Rate Contracts
|
|
Fair Value Measurements Using Significant Unobservable Inputs (Level 3)
|
|
|
|
Beginning balance
|
|
$
|
28
|
|
Transfers into Level 3
|
|
|
—
|
|
Transfers out of Level 3
|
|
|
—
|
|
Total (losses) gains:
|
|
|
|
|
Included in earnings
|
|
|
—
|
|
Included in other comprehensive income (loss)
|
|
|
1
|
|
Purchases, sales, issuances and settlements
|
|
|
—
|
|
Ending balance, December 31, 2016
|
|
$
|
29
|
|
The amount of total gains (losses) for the period included in earnings attributable to the change in unrealized gains (losses) relating to assets still held at December 31, 2016
|
|
$
|
—
|
Gains and losses (realized and unrealized) included in earnings for instruments measured at fair value on a recurring basis using significant unobservable inputs (Level 3) are reported in interest expense and other comprehensive income (loss) as follows (dollars in millions):
|
|
|
|
|
|
|
|
|
|
|
|
|
|
Other
|
|
|
|
Interest
|
|
comprehensive
|
|
2017
|
|
expense
|
|
income (loss)
|
|
Total net gains included in earnings
|
|
$
|
—
|
|
$
|
—
|
|
Changes in unrealized losses
|
|
|
—
|
|
|
(22)
|
|
|
|
|
|
|
|
|
|
|
|
|
|
|
Other
|
|
|
|
Interest
|
|
comprehensive
|
|
2016
|
|
expense
|
|
income (loss)
|
|
Total net gains included in earnings
|
|
$
|
—
|
|
$
|
—
|
|
Changes in unrealized gains related to assets still held at December 31, 2016
|
|
|
—
|
|
|
1
|
We also have assets that under certain conditions are subject to measurement at fair value on a non-recurring basis. These assets include property, plant and equipment and those associated with acquired businesses, including goodwill and intangible assets. For these assets, measurement at fair value in periods subsequent to their initial recognition is applicable if one or more is determined to be impaired. During both 2017 and 2016, there were no charges recorded for the impairment of long-lived assets.
16. EMPLOYEE BENEFIT PLANS
Defined Benefit and Other Postretirement Benefit
We provide a trusteed, non contributory defined benefit pension plan (the “Plan”) that covers the majority of our U.S. employees. Effective July 1, 2004, the Plan formula for employees not covered by a collective bargaining agreement was converted to a cash balance design. For represented employees, participation in the cash balance design was subject to the terms of negotiated contracts. For participating employees, benefits accrued under the prior formula were converted to opening cash balance accounts. The cash balance benefit formula provides annual pay credits from 6% to 12% of eligible pay, depending on age and service, plus accrued interest. The conversion to the cash balance plan did not have a significant impact on the accrued benefit liability, the funded status or ongoing pension expense.
Beginning July 1, 2014, the Huntsman Defined Benefit Pension Plan was closed to new non-union entrants and as of April 1, 2015, it was closed to new union entrants. In addition, as of January 1, 2015, Rubicon LLC closed its defined benefit plan to new entrants. Following the closure of these plans, new hires have been provided with a defined contribution plan with a non-discretionary employer contribution of 6% of pay and a company match of up to 4% of pay,
Table of Contents
HUNTSMAN CORPORATION AND SUBSIDIARIES
HUNTSMAN INTERNATIONAL LLC AND SUBSIDIARIES
NOTES TO CONSOLIDATED FINANCIAL STATEMENTS (Continued)
for a total company contribution of up to 10% of pay. We also sponsor unfunded postretirement benefit plans other than pensions, which provide medical and life insurance benefits. Effective August 1, 2015, the post retirement benefit plans were closed to new entrants.
Our postretirement benefit plans provide access to two fully insured Medicare Part D plans including prescription drug benefits affected by the Medicare Prescription Drug, Improvement and Modernization Act of 2003 (the “Act”). We cannot determine whether the medical benefits provided by our postretirement benefit plans are actuarially equivalent to those provided by the Act. We do not collect a subsidy and our net periodic postretirement benefits cost, and related benefit obligation, do not reflect an amount associated with the subsidy. We do not subsidize the premium cost of these plans; the premiums are entirely paid by the retirees.
We sponsor defined benefit plans in a number of countries outside of the U.S. The availability of these plans, and their specific design provisions, are consistent with local competitive practices and regulations.
Table of Contents
HUNTSMAN CORPORATION AND SUBSIDIARIES
HUNTSMAN INTERNATIONAL LLC AND SUBSIDIARIES
NOTES TO CONSOLIDATED FINANCIAL STATEMENTS (Continued)
The following table sets forth the funded status of the plans for us and Huntsman International and the amounts recognized in our consolidated balance sheets at December 31, 2017 and 2016 (dollars in millions):
|
|
|
|
|
|
|
|
|
|
|
|
|
|
|
|
|
|
|
|
|
|
|
|
|
|
|
|
|
Defined Benefit Plans
|
|
Other Postretirement Benefit Plans
|
|
|
|
2017
|
|
2016
|
|
2017
|
|
2016
|
|
|
|
U.S.
|
|
Non-U.S.
|
|
U.S.
|
|
Non-U.S.
|
|
U.S.
|
|
Non-U.S.
|
|
U.S.
|
|
Non-U.S.
|
|
|
|
Plans
|
|
Plans
|
|
Plans
|
|
Plans
|
|
Plans
|
|
Plans
|
|
Plans
|
|
Plans
|
|
Change in benefit obligation
|
|
|
|
|
|
|
|
|
|
|
|
|
|
|
|
|
|
|
|
|
|
|
|
|
|
Benefit obligation at beginning of year
|
|
$
|
1,049
|
|
$
|
2,064
|
|
$
|
953
|
|
$
|
1,986
|
|
$
|
93
|
|
$
|
—
|
|
$
|
87
|
|
$
|
—
|
|
Service cost
|
|
|
30
|
|
|
33
|
|
|
30
|
|
|
29
|
|
|
3
|
|
|
—
|
|
|
2
|
|
|
—
|
|
Interest cost
|
|
|
44
|
|
|
35
|
|
|
47
|
|
|
41
|
|
|
3
|
|
|
—
|
|
|
4
|
|
|
—
|
|
Participant contributions
|
|
|
—
|
|
|
5
|
|
|
—
|
|
|
5
|
|
|
2
|
|
|
—
|
|
|
3
|
|
|
—
|
|
Plan amendments
|
|
|
—
|
|
|
(1)
|
|
|
—
|
|
|
—
|
|
|
—
|
|
|
—
|
|
|
—
|
|
|
—
|
|
Foreign currency exchange rate changes
|
|
|
—
|
|
|
207
|
|
|
—
|
|
|
(165)
|
|
|
—
|
|
|
—
|
|
|
—
|
|
|
—
|
|
Special termination benefits
|
|
|
—
|
|
|
1
|
|
|
—
|
|
|
—
|
|
|
—
|
|
|
—
|
|
|
—
|
|
|
—
|
|
Settlements/transfers/divestitures
|
|
|
—
|
|
|
—
|
|
|
—
|
|
|
(2)
|
|
|
—
|
|
|
—
|
|
|
—
|
|
|
—
|
|
Curtailments
|
|
|
—
|
|
|
—
|
|
|
—
|
|
|
(1)
|
|
|
—
|
|
|
—
|
|
|
—
|
|
|
—
|
|
Actuarial (gain) loss
|
|
|
91
|
|
|
(10)
|
|
|
73
|
|
|
242
|
|
|
(12)
|
|
|
—
|
|
|
8
|
|
|
—
|
|
Benefits paid
|
|
|
(61)
|
|
|
(75)
|
|
|
(54)
|
|
|
(71)
|
|
|
(9)
|
|
|
—
|
|
|
(11)
|
|
|
—
|
|
Benefit obligation at end of year
|
|
$
|
1,153
|
|
$
|
2,259
|
|
$
|
1,049
|
|
$
|
2,064
|
|
$
|
80
|
|
$
|
—
|
|
$
|
93
|
|
$
|
—
|
|
|
|
|
|
|
|
|
|
|
|
|
|
|
|
|
|
|
|
|
|
|
|
|
|
|
|
Change in plan assets
|
|
|
|
|
|
|
|
|
|
|
|
|
|
|
|
|
|
|
|
|
|
|
|
|
|
Fair value of plan assets at beginning of year
|
|
$
|
721
|
|
$
|
1,639
|
|
$
|
716
|
|
$
|
1,637
|
|
$
|
—
|
|
$
|
—
|
|
$
|
—
|
|
$
|
—
|
|
Actual return on plan assets
|
|
|
104
|
|
|
109
|
|
|
53
|
|
|
175
|
|
|
—
|
|
|
—
|
|
|
—
|
|
|
—
|
|
Foreign currency exchange rate changes
|
|
|
—
|
|
|
166
|
|
|
—
|
|
|
(143)
|
|
|
—
|
|
|
—
|
|
|
—
|
|
|
—
|
|
Participant contributions
|
|
|
—
|
|
|
5
|
|
|
—
|
|
|
5
|
|
|
2
|
|
|
—
|
|
|
3
|
|
|
—
|
|
Acquisitions/divestitures
|
|
|
—
|
|
|
—
|
|
|
—
|
|
|
—
|
|
|
—
|
|
|
—
|
|
|
—
|
|
|
—
|
|
Company contributions
|
|
|
57
|
|
|
39
|
|
|
6
|
|
|
36
|
|
|
7
|
|
|
—
|
|
|
8
|
|
|
—
|
|
Benefits paid
|
|
|
(61)
|
|
|
(75)
|
|
|
(54)
|
|
|
(71)
|
|
|
(9)
|
|
|
—
|
|
|
(11)
|
|
|
—
|
|
Fair value of plan assets at end of year
|
|
$
|
821
|
|
$
|
1,883
|
|
$
|
721
|
|
$
|
1,639
|
|
$
|
—
|
|
$
|
—
|
|
$
|
—
|
|
$
|
—
|
|
|
|
|
|
|
|
|
|
|
|
|
|
|
|
|
|
|
|
|
|
|
|
|
|
|
|
Funded status
|
|
|
|
|
|
|
|
|
|
|
|
|
|
|
|
|
|
|
|
|
|
|
|
|
|
Fair value of plan assets
|
|
$
|
821
|
|
$
|
1,883
|
|
$
|
721
|
|
$
|
1,639
|
|
$
|
—
|
|
$
|
—
|
|
$
|
—
|
|
$
|
—
|
|
Benefit obligation
|
|
|
1,153
|
|
|
2,259
|
|
|
1,049
|
|
|
2,064
|
|
|
80
|
|
|
—
|
|
|
93
|
|
|
—
|
|
Accrued benefit cost
|
|
$
|
(332)
|
|
$
|
(376)
|
|
$
|
(328)
|
|
$
|
(425)
|
|
$
|
(80)
|
|
$
|
—
|
|
$
|
(93)
|
|
$
|
—
|
|
|
|
|
|
|
|
|
|
|
|
|
|
|
|
|
|
|
|
|
|
|
|
|
|
|
|
Amounts recognized in balance sheet:
|
|
|
|
|
|
|
|
|
|
|
|
|
|
|
|
|
|
|
|
|
|
|
|
|
|
Noncurrent asset
|
|
$
|
—
|
|
$
|
22
|
|
$
|
—
|
|
$
|
1
|
|
$
|
—
|
|
$
|
—
|
|
$
|
—
|
|
$
|
—
|
|
Current liability
|
|
|
(10)
|
|
|
(5)
|
|
|
(6)
|
|
|
(5)
|
|
|
(7)
|
|
|
—
|
|
|
(8)
|
|
|
—
|
|
Noncurrent liability
|
|
|
(322)
|
|
|
(393)
|
|
|
(322)
|
|
|
(421)
|
|
|
(73)
|
|
|
—
|
|
|
(85)
|
|
|
—
|
|
|
|
$
|
(332)
|
|
$
|
(376)
|
|
$
|
(328)
|
|
$
|
(425)
|
|
$
|
(80)
|
|
$
|
—
|
|
$
|
(93)
|
|
$
|
—
|
Table of Contents
HUNTSMAN CORPORATION AND SUBSIDIARIES
HUNTSMAN INTERNATIONAL LLC AND SUBSIDIARIES
NOTES TO CONSOLIDATED FINANCIAL STATEMENTS (Continued)
Huntsman Corporation
|
|
|
|
|
|
|
|
|
|
|
|
|
|
|
|
|
|
|
|
|
|
|
|
|
|
|
|
|
Defined Benefit Plans
|
|
Other Postretirement Benefit Plans
|
|
|
|
2017
|
|
2016
|
|
2017
|
|
2016
|
|
|
|
U.S.
|
|
Non-U.S.
|
|
U.S.
|
|
Non-U.S.
|
|
U.S.
|
|
Non-U.S.
|
|
U.S.
|
|
Non-U.S.
|
|
|
|
Plans
|
|
Plans
|
|
Plans
|
|
Plans
|
|
Plans
|
|
Plans
|
|
Plans
|
|
Plans
|
|
Amounts recognized in accumulated other comprehensive loss:
|
|
|
|
|
|
|
|
|
|
|
|
|
|
|
|
|
|
|
|
|
|
|
|
|
|
Net actuarial loss
|
|
$
|
419
|
|
$
|
1,000
|
|
$
|
407
|
|
$
|
1,100
|
|
$
|
30
|
|
$
|
—
|
|
$
|
45
|
|
$
|
1
|
|
Prior service credit
|
|
|
(15)
|
|
|
(29)
|
|
|
(17)
|
|
|
(31)
|
|
|
(45)
|
|
|
—
|
|
|
(51)
|
|
|
(2)
|
|
|
|
$
|
404
|
|
$
|
971
|
|
$
|
390
|
|
$
|
1,069
|
|
$
|
(15)
|
|
$
|
—
|
|
$
|
(6)
|
|
$
|
(1)
|
Huntsman International
|
|
|
|
|
|
|
|
|
|
|
|
|
|
|
|
|
|
|
|
|
|
|
|
|
|
|
|
|
Defined Benefit Plans
|
|
Other Postretirement Benefit Plans
|
|
|
|
2017
|
|
2016
|
|
2017
|
|
2016
|
|
|
|
U.S.
|
|
Non-U.S.
|
|
U.S.
|
|
Non-U.S.
|
|
U.S.
|
|
Non-U.S.
|
|
U.S.
|
|
Non-U.S.
|
|
|
|
Plans
|
|
Plans
|
|
Plans
|
|
Plans
|
|
Plans
|
|
Plans
|
|
Plans
|
|
Plans
|
|
Amounts recognized in accumulated other comprehensive loss:
|
|
|
|
|
|
|
|
|
|
|
|
|
|
|
|
|
|
|
|
|
|
|
|
|
|
Net actuarial loss
|
|
$
|
420
|
|
$
|
1,030
|
|
$
|
408
|
|
$
|
1,137
|
|
$
|
30
|
|
$
|
—
|
|
$
|
45
|
|
$
|
1
|
|
Prior service credit
|
|
|
(15)
|
|
|
(29)
|
|
|
(17)
|
|
|
(31)
|
|
|
(45)
|
|
|
—
|
|
|
(51)
|
|
|
(2)
|
|
|
|
$
|
405
|
|
$
|
1,001
|
|
$
|
391
|
|
$
|
1,106
|
|
$
|
(15)
|
|
$
|
—
|
|
$
|
(6)
|
|
$
|
(1)
|
The amounts in accumulated other comprehensive loss that are expected to be recognized as components of net periodic benefit cost of continuing operations during the next fiscal year are as follows (dollars in millions):
Huntsman Corporation
|
|
|
|
|
|
|
|
|
|
|
|
|
|
|
|
|
|
|
|
|
|
|
Other Postretirement
|
|
|
|
Defined Benefit Plans
|
|
Benefit Plans
|
|
|
|
|
|
|
Non-U.S.
|
|
|
|
|
Non-U.S.
|
|
|
|
U.S. Plans
|
|
Plans
|
|
U.S. Plans
|
|
Plans
|
|
Actuarial loss
|
|
$
|
33
|
|
$
|
38
|
|
$
|
2
|
|
$
|
—
|
|
Prior service credit
|
|
|
(2)
|
|
|
(5)
|
|
|
(6)
|
|
|
—
|
|
Total
|
|
$
|
31
|
|
$
|
33
|
|
$
|
(4)
|
|
$
|
—
|
Huntsman International
|
|
|
|
|
|
|
|
|
|
|
|
|
|
|
|
|
|
|
|
|
|
|
Other Postretirement
|
|
|
|
Defined Benefit Plans
|
|
Benefit Plans
|
|
|
|
|
|
|
Non-U.S.
|
|
|
|
|
Non-U.S.
|
|
|
|
U.S. Plans
|
|
Plans
|
|
U.S. Plans
|
|
Plans
|
|
Actuarial loss
|
|
$
|
33
|
|
$
|
41
|
|
$
|
2
|
|
$
|
—
|
|
Prior service credit
|
|
|
(2)
|
|
|
(5)
|
|
|
(6)
|
|
|
—
|
|
Total
|
|
$
|
31
|
|
$
|
36
|
|
$
|
(4)
|
|
$
|
—
|
Table of Contents
HUNTSMAN CORPORATION AND SUBSIDIARIES
HUNTSMAN INTERNATIONAL LLC AND SUBSIDIARIES
NOTES TO CONSOLIDATED FINANCIAL STATEMENTS (Continued)
Components of net periodic benefit costs of continuing operations for the years ended December 31, 2017, 2016 and 2015 were as follows (dollars in millions):
Huntsman Corporation
|
|
|
|
|
|
|
|
|
|
|
|
|
|
|
|
|
|
|
|
|
|
|
Defined Benefit Plans
|
|
|
|
U.S. plans
|
|
Non-U.S. plans
|
|
|
|
2017
|
|
2016
|
|
2015
|
|
2017
|
|
2016
|
|
2015
|
|
Service cost
|
|
$
|
30
|
|
$
|
30
|
|
$
|
32
|
|
$
|
33
|
|
$
|
29
|
|
$
|
34
|
|
Interest cost
|
|
|
44
|
|
|
47
|
|
|
42
|
|
|
35
|
|
|
41
|
|
|
45
|
|
Expected return on plan assets
|
|
|
(55)
|
|
|
(54)
|
|
|
(56)
|
|
|
(100)
|
|
|
(93)
|
|
|
(93)
|
|
Amortization of prior service credit
|
|
|
(2)
|
|
|
(5)
|
|
|
(6)
|
|
|
(5)
|
|
|
(4)
|
|
|
(1)
|
|
Amortization of actuarial loss
|
|
|
30
|
|
|
25
|
|
|
32
|
|
|
45
|
|
|
31
|
|
|
34
|
|
Special termination benefits
|
|
|
—
|
|
|
—
|
|
|
—
|
|
|
1
|
|
|
—
|
|
|
1
|
|
Net periodic benefit cost
|
|
$
|
47
|
|
$
|
43
|
|
$
|
44
|
|
$
|
9
|
|
$
|
4
|
|
$
|
20
|
|
|
|
|
|
|
|
|
|
|
|
|
|
|
|
|
|
|
|
|
|
|
|
Other Postretirement Benefit Plans
|
|
|
|
U.S. plans
|
|
Non-U.S. plans
|
|
|
|
2017
|
|
2016
|
|
2015
|
|
2017
|
|
2016
|
|
2015
|
|
Service cost
|
|
$
|
3
|
|
$
|
2
|
|
$
|
4
|
|
$
|
—
|
|
$
|
—
|
|
$
|
—
|
|
Interest cost
|
|
|
3
|
|
|
4
|
|
|
5
|
|
|
—
|
|
|
—
|
|
|
—
|
|
Amortization of prior service credit
|
|
|
(6)
|
|
|
(7)
|
|
|
(5)
|
|
|
—
|
|
|
—
|
|
|
—
|
|
Amortization of actuarial loss
|
|
|
3
|
|
|
2
|
|
|
3
|
|
|
—
|
|
|
—
|
|
|
—
|
|
Net periodic benefit cost
|
|
$
|
3
|
|
$
|
1
|
|
$
|
7
|
|
$
|
—
|
|
$
|
—
|
|
$
|
—
|
Huntsman International
|
|
|
|
|
|
|
|
|
|
|
|
|
|
|
|
|
|
|
|
|
|
|
Defined Benefit Plans
|
|
|
|
U.S. plans
|
|
Non-U.S. plans
|
|
|
|
2017
|
|
2016
|
|
2015
|
|
2017
|
|
2016
|
|
2015
|
|
Service cost
|
|
$
|
30
|
|
$
|
30
|
|
$
|
32
|
|
$
|
33
|
|
$
|
29
|
|
$
|
34
|
|
Interest cost
|
|
|
44
|
|
|
47
|
|
|
42
|
|
|
35
|
|
|
41
|
|
|
45
|
|
Expected return on plan assets
|
|
|
(55)
|
|
|
(54)
|
|
|
(56)
|
|
|
(100)
|
|
|
(93)
|
|
|
(93)
|
|
Amortization of prior service credit
|
|
|
(2)
|
|
|
(5)
|
|
|
(6)
|
|
|
(5)
|
|
|
(4)
|
|
|
(1)
|
|
Amortization of actuarial loss
|
|
|
30
|
|
|
25
|
|
|
32
|
|
|
48
|
|
|
34
|
|
|
37
|
|
Special termination benefits
|
|
|
—
|
|
|
—
|
|
|
—
|
|
|
1
|
|
|
—
|
|
|
1
|
|
Net periodic benefit cost
|
|
$
|
47
|
|
$
|
43
|
|
$
|
44
|
|
$
|
12
|
|
$
|
7
|
|
$
|
23
|
|
|
|
|
|
|
|
|
|
|
|
|
|
|
|
|
|
|
|
|
|
|
|
Other Postretirement Benefit Plans
|
|
|
|
U.S. plans
|
|
Non-U.S. plans
|
|
|
|
2017
|
|
2016
|
|
2015
|
|
2017
|
|
2016
|
|
2015
|
|
Service cost
|
|
$
|
3
|
|
$
|
2
|
|
$
|
4
|
|
$
|
—
|
|
$
|
—
|
|
$
|
—
|
|
Interest cost
|
|
|
3
|
|
|
4
|
|
|
5
|
|
|
—
|
|
|
—
|
|
|
—
|
|
Amortization of prior service credit
|
|
|
(6)
|
|
|
(7)
|
|
|
(5)
|
|
|
—
|
|
|
—
|
|
|
—
|
|
Amortization of actuarial loss
|
|
|
3
|
|
|
2
|
|
|
3
|
|
|
—
|
|
|
—
|
|
|
—
|
|
Net periodic benefit cost
|
|
$
|
3
|
|
$
|
1
|
|
$
|
7
|
|
$
|
—
|
|
$
|
—
|
|
$
|
—
|
Table of Contents
HUNTSMAN CORPORATION AND SUBSIDIARIES
HUNTSMAN INTERNATIONAL LLC AND SUBSIDIARIES
NOTES TO CONSOLIDATED FINANCIAL STATEMENTS (Continued)
The amounts recognized in net periodic benefit cost and other comprehensive income (loss) as of December 31, 2017, 2016 and 2015 were as follows (dollars in millions):
Huntsman Corporation
|
|
|
|
|
|
|
|
|
|
|
|
|
|
|
|
|
|
|
|
|
|
|
Defined Benefit Plans
|
|
|
|
U.S. plans
|
|
Non-U.S. plans
|
|
|
|
2017
|
|
2016
|
|
2015
|
|
2017
|
|
2016
|
|
2015
|
|
Current year actuarial loss (gain)
|
|
$
|
42
|
|
$
|
74
|
|
$
|
2
|
|
$
|
(42)
|
|
$
|
235
|
|
$
|
33
|
|
Amortization of actuarial loss
|
|
|
(30)
|
|
|
(25)
|
|
|
(32)
|
|
|
(61)
|
|
|
(42)
|
|
|
(43)
|
|
Current year prior service (credits) cost
|
|
|
—
|
|
|
—
|
|
|
—
|
|
|
(2)
|
|
|
—
|
|
|
(32)
|
|
Amortization of prior service credit
|
|
|
2
|
|
|
5
|
|
|
6
|
|
|
4
|
|
|
4
|
|
|
—
|
|
Curtailment (gain)/loss
|
|
|
—
|
|
|
—
|
|
|
—
|
|
|
3
|
|
|
—
|
|
|
—
|
|
Total recognized in other comprehensive income (loss)
|
|
|
14
|
|
|
54
|
|
|
(24)
|
|
|
(98)
|
|
|
197
|
|
|
(42)
|
|
Amounts related to discontinued operations
|
|
|
3
|
|
|
—
|
|
|
1
|
|
|
37
|
|
|
(65)
|
|
|
(13)
|
|
Total recognized in other comprehensive income (loss) in continuing operations
|
|
|
17
|
|
|
54
|
|
|
(23)
|
|
|
(61)
|
|
|
132
|
|
|
(55)
|
|
Net periodic benefit cost
|
|
|
47
|
|
|
43
|
|
|
44
|
|
|
9
|
|
|
4
|
|
|
20
|
|
Total recognized in net periodic benefit cost and other comprehensive income (loss)
|
|
$
|
64
|
|
$
|
97
|
|
$
|
21
|
|
$
|
(52)
|
|
$
|
136
|
|
$
|
(35)
|
|
|
|
|
|
|
|
|
|
|
|
|
|
|
|
|
|
|
|
|
|
|
|
Other Postretirement Benefit Plans
|
|
|
|
U.S. plans
|
|
Non-U.S. plans
|
|
|
|
2017
|
|
2016
|
|
2015
|
|
2017
|
|
2016
|
|
2015
|
|
Current year actuarial loss (gain)
|
|
$
|
(12)
|
|
$
|
9
|
|
$
|
(9)
|
|
$
|
—
|
|
$
|
—
|
|
$
|
—
|
|
Amortization of actuarial loss
|
|
|
(3)
|
|
|
(2)
|
|
|
(3)
|
|
|
(1)
|
|
|
—
|
|
|
—
|
|
Current year prior service credit
|
|
|
—
|
|
|
—
|
|
|
(40)
|
|
|
—
|
|
|
(2)
|
|
|
—
|
|
Amortization of prior service credit
|
|
|
6
|
|
|
7
|
|
|
5
|
|
|
2
|
|
|
—
|
|
|
—
|
|
Total recognized in other comprehensive income (loss)
|
|
|
(9)
|
|
|
14
|
|
|
(47)
|
|
|
1
|
|
|
(2)
|
|
|
—
|
|
Amounts related to discontinued operations
|
|
|
—
|
|
|
(1)
|
|
|
1
|
|
|
(1)
|
|
|
3
|
|
|
—
|
|
Total recognized in other comprehensive income (loss) in continuing operations
|
|
|
(9)
|
|
|
13
|
|
|
(46)
|
|
|
—
|
|
|
1
|
|
|
—
|
|
Net periodic benefit cost
|
|
|
3
|
|
|
1
|
|
|
7
|
|
|
—
|
|
|
—
|
|
|
—
|
|
Total recognized in net periodic benefit cost and other comprehensive income (loss)
|
|
$
|
(6)
|
|
$
|
14
|
|
$
|
(39)
|
|
$
|
—
|
|
$
|
1
|
|
$
|
—
|
Huntsman International
|
|
|
|
|
|
|
|
|
|
|
|
|
|
|
|
|
|
|
|
|
|
|
Defined Benefit Plans
|
|
|
|
U.S. plans
|
|
Non-U.S. plans
|
|
|
|
2017
|
|
2016
|
|
2015
|
|
2017
|
|
2016
|
|
2015
|
|
Current year actuarial loss
|
|
$
|
42
|
|
$
|
74
|
|
$
|
2
|
|
$
|
(42)
|
|
$
|
235
|
|
$
|
33
|
|
Amortization of actuarial loss
|
|
|
(30)
|
|
|
(25)
|
|
|
(32)
|
|
|
(68)
|
|
|
(49)
|
|
|
(51)
|
|
Current year prior service credit
|
|
|
—
|
|
|
—
|
|
|
—
|
|
|
(2)
|
|
|
—
|
|
|
(32)
|
|
Amortization of prior service credit
|
|
|
2
|
|
|
5
|
|
|
6
|
|
|
4
|
|
|
4
|
|
|
—
|
|
Curtailment (gain)/loss
|
|
|
—
|
|
|
—
|
|
|
—
|
|
|
3
|
|
|
—
|
|
|
—
|
|
Total recognized in other comprehensive income (loss)
|
|
|
14
|
|
|
54
|
|
|
(24)
|
|
|
(105)
|
|
|
190
|
|
|
(50)
|
|
Amounts related to discontinued operations
|
|
|
3
|
|
|
—
|
|
|
1
|
|
|
42
|
|
|
(61)
|
|
|
(8)
|
|
Total recognized in other comprehensive income (loss) in continuing operations
|
|
|
17
|
|
|
54
|
|
|
(23)
|
|
|
(63)
|
|
|
129
|
|
|
(58)
|
|
Net periodic benefit cost
|
|
|
47
|
|
|
43
|
|
|
44
|
|
|
12
|
|
|
7
|
|
|
23
|
|
Total recognized in net periodic benefit cost and other comprehensive income (loss)
|
|
$
|
64
|
|
$
|
97
|
|
$
|
21
|
|
$
|
(51)
|
|
$
|
136
|
|
$
|
(35)
|
Table of Contents
HUNTSMAN CORPORATION AND SUBSIDIARIES
HUNTSMAN INTERNATIONAL LLC AND SUBSIDIARIES
NOTES TO CONSOLIDATED FINANCIAL STATEMENTS (Continued)
|
|
|
|
|
|
|
|
|
|
|
|
|
|
|
|
|
|
|
|
|
|
|
Other Postretirement Benefit Plans
|
|
|
|
U.S. plans
|
|
Non-U.S. plans
|
|
|
|
2017
|
|
2016
|
|
2015
|
|
2017
|
|
2016
|
|
2015
|
|
Current year actuarial loss (gain)
|
|
$
|
(12)
|
|
$
|
9
|
|
$
|
(9)
|
|
$
|
—
|
|
$
|
—
|
|
$
|
—
|
|
Amortization of actuarial loss
|
|
|
(3)
|
|
|
(2)
|
|
|
(3)
|
|
|
(1)
|
|
|
—
|
|
|
—
|
|
Current year prior service credit
|
|
|
—
|
|
|
—
|
|
|
(40)
|
|
|
—
|
|
|
(2)
|
|
|
—
|
|
Amortization of prior service credit
|
|
|
6
|
|
|
7
|
|
|
5
|
|
|
2
|
|
|
—
|
|
|
—
|
|
Total recognized in other comprehensive income (loss)
|
|
|
(9)
|
|
|
14
|
|
|
(47)
|
|
|
1
|
|
|
(2)
|
|
|
—
|
|
Amounts related to discontinued operations
|
|
|
—
|
|
|
(1)
|
|
|
1
|
|
|
(1)
|
|
|
3
|
|
|
—
|
|
Total recognized in other comprehensive income (loss) in continuing operations
|
|
|
(9)
|
|
|
13
|
|
|
(46)
|
|
|
—
|
|
|
1
|
|
|
—
|
|
Net periodic benefit cost
|
|
|
3
|
|
|
1
|
|
|
7
|
|
|
—
|
|
|
—
|
|
|
—
|
|
Total recognized in net periodic benefit cost and other comprehensive income (loss)
|
|
$
|
(6)
|
|
$
|
14
|
|
$
|
(39)
|
|
$
|
—
|
|
$
|
1
|
|
$
|
—
|
The following weighted‑average assumptions were used to determine the projected benefit obligation at the measurement date and the net periodic pension cost for the year:
|
|
|
|
|
|
|
|
|
|
|
|
|
|
|
|
|
|
Defined Benefit Plans
|
|
|
|
|
U.S. plans
|
|
Non-U.S. plans
|
|
|
|
|
2017
|
|
2016
|
|
2015
|
|
2017
|
|
2016
|
|
2015
|
|
|
Projected benefit obligation
|
|
|
|
|
|
|
|
|
|
|
|
|
|
|
Discount rate
|
|
3.74
|
%
|
4.24
|
%
|
4.90
|
%
|
1.65
|
%
|
1.61
|
%
|
2.15
|
%
|
|
Rate of compensation increase
|
|
4.13
|
%
|
4.17
|
%
|
4.17
|
%
|
3.38
|
%
|
3.37
|
%
|
3.28
|
%
|
|
Net periodic pension cost
|
|
|
|
|
|
|
|
|
|
|
|
|
|
|
Discount rate
|
|
4.24
|
%
|
4.90
|
%
|
4.25
|
%
|
1.61
|
%
|
2.15
|
%
|
2.15
|
%
|
|
Rate of compensation increase
|
|
4.17
|
%
|
4.17
|
%
|
4.19
|
%
|
3.37
|
%
|
3.28
|
%
|
3.35
|
%
|
|
Expected return on plan assets
|
|
7.55
|
%
|
7.54
|
%
|
7.75
|
%
|
5.68
|
%
|
5.91
|
%
|
5.69
|
%
|
|
|
|
|
|
|
|
|
|
|
|
|
|
|
|
|
|
|
Other Postretirement Benefit Plans
|
|
|
|
|
U.S. plans
|
|
Non-U.S. plans
|
|
|
|
|
2017
|
|
2016
|
|
2015
|
|
2017
|
|
2016
|
|
2015
|
|
|
Projected benefit obligation
|
|
|
|
|
|
|
|
|
|
|
|
|
|
|
Discount rate
|
|
3.57
|
%
|
4.03
|
%
|
4.68
|
%
|
3.30
|
%
|
3.50
|
%
|
3.70
|
%
|
|
Net periodic pension cost
|
|
|
|
|
|
|
|
|
|
|
|
|
|
|
Discount rate
|
|
4.03
|
%
|
4.68
|
%
|
4.37
|
%
|
3.50
|
%
|
3.70
|
%
|
3.80
|
%
|
At both December 31, 2017 and 2016 the health care trend rate used to measure the expected increase in the cost of benefits was assumed to be 7.0%, decreasing to 5% after 2025. Assumed health care cost trend rates can have a significant effect on the amounts reported for the postretirement benefit plans. A one-percent point change in assumed health care cost trend rates would have the following effects (dollars in millions):
|
|
|
|
|
|
|
|
|
|
|
Increase
|
|
Decrease
|
|
Asset category
|
|
|
|
|
|
|
|
Effect on total of service and interest cost
|
|
$
|
—
|
|
$
|
—
|
|
Effect on postretirement benefit obligation
|
|
|
—
|
|
|
—
|
Table of Contents
HUNTSMAN CORPORATION AND SUBSIDIARIES
HUNTSMAN INTERNATIONAL LLC AND SUBSIDIARIES
NOTES TO CONSOLIDATED FINANCIAL STATEMENTS (Continued)
The projected benefit obligation and fair value of plan assets for the defined benefit plans with projected benefit obligations in excess of plan assets as of December 31, 2017 and 2016 were as follows (dollars in millions):
|
|
|
|
|
|
|
|
|
|
|
|
|
|
|
|
|
U.S. plans
|
|
Non-U.S. plans
|
|
|
|
2017
|
|
2016
|
|
2017
|
|
2016
|
|
Projected benefit obligation in excess of plan assets
|
|
|
|
|
|
|
|
|
|
|
|
|
|
Projected benefit obligation
|
|
$
|
1,153
|
|
$
|
1,049
|
|
$
|
1,213
|
|
$
|
2,050
|
|
Fair value of plan assets
|
|
|
821
|
|
|
721
|
|
|
815
|
|
|
1,623
|
The projected benefit obligation, accumulated benefit obligation and fair value of plan assets for the defined benefit plans with an accumulated benefit obligation in excess of plan assets as of December 31, 2017 and 2016 were as follows (dollars in millions):
|
|
|
|
|
|
|
|
|
|
|
|
|
|
|
|
|
U.S. plans
|
|
Non-U.S. plans
|
|
|
|
2017
|
|
2016
|
|
2017
|
|
2016
|
|
Accumulated benefit obligation in excess of plan assets
|
|
|
|
|
|
|
|
|
|
|
|
|
|
Projected benefit obligation
|
|
$
|
1,153
|
|
$
|
1,049
|
|
$
|
1,026
|
|
$
|
1,121
|
|
Accumulated benefit obligation
|
|
|
1,127
|
|
|
1,022
|
|
|
957
|
|
|
1,043
|
|
Fair value of plan assets
|
|
|
821
|
|
|
721
|
|
|
638
|
|
|
721
|
Expected future contributions and benefit payments related to continuing operations are as follows (dollars in millions):
|
|
|
|
|
|
|
|
|
|
|
|
|
|
|
|
|
U.S. Plans
|
|
Non-U.S. Plans
|
|
|
|
|
|
|
Other
|
|
|
|
|
Other
|
|
|
|
Defined
|
|
Postretirement
|
|
Defined
|
|
Postretirement
|
|
|
|
Benefit
|
|
Benefit
|
|
Benefit
|
|
Benefit
|
|
|
|
Plans
|
|
Plans
|
|
Plans
|
|
Plans
|
|
2018 expected employer contributions
|
|
|
|
|
|
|
|
|
|
|
|
|
|
To plan trusts
|
|
$
|
51
|
|
$
|
7
|
|
$
|
38
|
|
$
|
—
|
|
Expected benefit payments
|
|
|
|
|
|
|
|
|
|
|
|
|
|
2018
|
|
|
72
|
|
|
7
|
|
|
71
|
|
|
—
|
|
2019
|
|
|
61
|
|
|
7
|
|
|
71
|
|
|
—
|
|
2020
|
|
|
62
|
|
|
6
|
|
|
74
|
|
|
—
|
|
2021
|
|
|
62
|
|
|
6
|
|
|
78
|
|
|
—
|
|
2022
|
|
|
107
|
|
|
6
|
|
|
79
|
|
|
—
|
|
2023 - 2027
|
|
|
370
|
|
|
31
|
|
|
428
|
|
|
—
|
Our investment strategy with respect to pension assets is to pursue an investment plan that, over the long term, is expected to protect the funded status of the plan, enhance the real purchasing power of plan assets, and not threaten the plan’s ability to meet currently committed obligations. Additionally, our investment strategy is to achieve returns on plan assets, subject to a prudent level of portfolio risk. Plan assets are invested in a broad range of investments. These investments are diversified in terms of domestic and international equities, both growth and value funds, including small, mid and large capitalization equities; short‑term and long‑term debt securities; real estate; and cash and cash equivalents. The investments are further diversified within each asset category. The portfolio diversification provides protection against a single investment or asset category having a disproportionate impact on the aggregate performance of the plan assets.
Our pension plan assets are managed by outside investment managers. The investment managers value our plan assets using quoted market prices, other observable inputs or unobservable inputs. For certain assets, the investment managers obtain third‑party appraisals at least annually, which use valuation techniques and inputs specific to the applicable property, market, or geographic location. During 2017, there were no transfers into or out of Level 3 assets.
Table of Contents
HUNTSMAN CORPORATION AND SUBSIDIARIES
HUNTSMAN INTERNATIONAL LLC AND SUBSIDIARIES
NOTES TO CONSOLIDATED FINANCIAL STATEMENTS (Continued)
We have established target allocations for each asset category. Our pension plan assets are periodically rebalanced based upon our target allocations.
The fair value of plan assets for the pension plans was $2.7 billion and $2.4 billion at December 31, 2017 and 2016, respectively. The following plan assets are measured at fair value on a recurring basis (dollars in millions):
|
|
|
|
|
|
|
|
|
|
|
|
|
|
|
|
|
|
|
|
Fair Value Amounts Using
|
|
|
|
|
|
|
Quoted prices in active
|
|
Significant other
|
|
Significant
|
|
|
|
December 31,
|
|
markets for identical
|
|
observable inputs
|
|
unobservable inputs
|
|
Asset category
|
|
2017
|
|
assets (Level 1)
|
|
(Level 2)
|
|
(Level 3)
|
|
U.S. pension plans:
|
|
|
|
|
|
|
|
|
|
|
|
|
|
Equities
|
|
$
|
440
|
|
$
|
318
|
|
$
|
122
|
|
$
|
—
|
|
Fixed income
|
|
|
311
|
|
|
239
|
|
|
72
|
|
|
—
|
|
Real estate/other
|
|
|
70
|
|
|
—
|
|
|
—
|
|
|
70
|
|
Cash
|
|
|
—
|
|
|
—
|
|
|
—
|
|
|
—
|
|
Total U.S. pension plan assets
|
|
$
|
821
|
|
$
|
557
|
|
$
|
194
|
|
$
|
70
|
|
Non-U.S. pension plans:
|
|
|
|
|
|
|
|
|
|
|
|
|
|
Equities
|
|
$
|
602
|
|
$
|
230
|
|
$
|
372
|
|
$
|
—
|
|
Fixed income
|
|
|
739
|
|
|
477
|
|
|
262
|
|
|
—
|
|
Real estate/other
|
|
|
508
|
|
|
104
|
|
|
349
|
|
|
55
|
|
Cash
|
|
|
34
|
|
|
33
|
|
|
1
|
|
|
—
|
|
Total Non-U.S. pension plan assets
|
|
$
|
1,883
|
|
$
|
844
|
|
$
|
984
|
|
$
|
55
|
|
|
|
|
|
|
|
|
|
|
|
|
|
|
|
|
|
|
|
|
Fair Value Amounts Using
|
|
|
|
|
|
|
Quoted prices in active
|
|
Significant other
|
|
Significant
|
|
|
|
December 31,
|
|
Markets for identical
|
|
Observable inputs
|
|
Unobservable inputs
|
|
Asset category
|
|
2016
|
|
assets (Level 1)
|
|
(Level 2)
|
|
(Level 3)
|
|
U.S. pension plans:
|
|
|
|
|
|
|
|
|
|
|
|
|
|
Equities
|
|
$
|
383
|
|
$
|
272
|
|
$
|
111
|
|
$
|
—
|
|
Fixed income
|
|
|
274
|
|
|
210
|
|
|
64
|
|
|
—
|
|
Real estate/other
|
|
|
64
|
|
|
—
|
|
|
—
|
|
|
64
|
|
Cash
|
|
|
—
|
|
|
—
|
|
|
—
|
|
|
—
|
|
Total U.S. pension plan assets
|
|
$
|
721
|
|
$
|
482
|
|
$
|
175
|
|
$
|
64
|
|
Non-U.S. pension plans:
|
|
|
|
|
|
|
|
|
|
|
|
|
|
Equities
|
|
$
|
594
|
|
$
|
245
|
|
$
|
349
|
|
$
|
—
|
|
Fixed income
|
|
|
599
|
|
|
509
|
|
|
90
|
|
|
—
|
|
Real estate/other
|
|
|
430
|
|
|
66
|
|
|
322
|
|
|
42
|
|
Cash
|
|
|
16
|
|
|
16
|
|
|
—
|
|
|
—
|
|
Total Non-U.S. pension plan assets
|
|
$
|
1,639
|
|
$
|
836
|
|
$
|
761
|
|
$
|
42
|
The following table reconciles the beginning and ending balances of plan assets measured at fair value using unobservable inputs (Level 3) (dollars in millions):
|
|
|
|
|
|
|
|
|
|
|
Real Estate/Other
|
|
|
|
Year ended December 31,
|
|
|
|
2017
|
|
2016
|
|
Fair Value Measurements of Plan Assets Using Significant Unobservable Inputs (Level 3)
|
|
|
|
|
|
|
|
Balance at beginning of period
|
|
$
|
106
|
|
$
|
104
|
|
Return on pension plan assets
|
|
|
14
|
|
|
4
|
|
Purchases, sales and settlements
|
|
|
5
|
|
|
(2)
|
|
Transfers into (out of) Level 3
|
|
|
—
|
|
|
—
|
|
Balance at end of period
|
|
$
|
125
|
|
$
|
106
|
Table of Contents
HUNTSMAN CORPORATION AND SUBSIDIARIES
HUNTSMAN INTERNATIONAL LLC AND SUBSIDIARIES
NOTES TO CONSOLIDATED FINANCIAL STATEMENTS (Continued)
Based upon historical returns, the expectations of our investment committee and outside advisors, the expected long‑term rate of return on the pension assets is estimated to be between 5.68% and 7.75%. The asset allocation for our pension plans at December 31, 2017 and 2016 and the target allocation for 2015, by asset category are as follows:
|
|
|
|
|
|
|
|
|
|
|
|
Target
|
|
|
|
|
|
|
Allocation
|
|
Allocation at December 31,
|
|
|
Asset category
|
|
2018
|
|
2017
|
|
2016
|
|
|
U.S. pension plans:
|
|
|
|
|
|
|
|
|
Equities
|
|
53
|
%
|
54
|
%
|
53
|
%
|
|
Fixed income
|
|
39
|
%
|
38
|
%
|
38
|
%
|
|
Real estate/other
|
|
8
|
%
|
8
|
%
|
9
|
%
|
|
Cash
|
|
—
|
%
|
—
|
%
|
—
|
|
|
Total U.S. pension plans
|
|
100
|
%
|
100
|
%
|
100
|
%
|
|
Non-U.S. pension plans:
|
|
|
|
|
|
|
|
|
Equities
|
|
38
|
%
|
32
|
%
|
36
|
%
|
|
Fixed income
|
|
37
|
%
|
39
|
%
|
37
|
%
|
|
Real estate/other
|
|
24
|
%
|
27
|
%
|
26
|
%
|
|
Cash
|
|
1
|
%
|
2
|
%
|
1
|
%
|
|
Total non-U.S. pension plans
|
|
100
|
%
|
100
|
%
|
100
|
%
|
Equity securities in our pension plans did not include any direct investments in equity securities of our Company or our affiliates at the end of 2017.
Defined Contribution Plans—U.S.
We had a money purchase pension plan that covered substantially all of our domestic employees who were hired prior to January 1, 2004. Employer contributions were made based on a percentage of employees’ earnings (ranging up to 8%). During 2014, we closed this plan to non-union participants, and in 2015, we closed this plan to union associates. We continue to provide equivalent benefits to those who were covered under this plan into their salary deferral account.
We have a salary deferral plan covering substantially all U.S. employees. Plan participants may elect to make voluntary contributions to this plan up to a specified amount of their compensation. We contribute an amount equal to the participant’s contribution, not to exceed 4 % of the participant’s compensation. For new hires who are not eligible for the cash balance plan, and associates who were covered by the money purchase pension plan prior to its closure, we contribute an additional amount into their salary deferral accounts, not to exceed 6% of the participant’s compensation.
Our total combined expense for the above defined contribution plans for each of the years ended December 31, 2017, 2016 and 2015 was $22 million, $20 million and $20 million, respectively.
Defined Contribution Plans—Non-U.S.
We have defined contribution plans in a variety of non-U.S. locations.
Our total combined expense for these defined contribution plans for the years ended December 31, 2017, 2016 and 2015 was $5 million, $4 million and $5 million, respectively, primarily related to the Huntsman UK Pension Plan.
All UK associates are eligible to participate in the Huntsman UK Pension Plan, a contract-based arrangement with a third party. Company contributions vary by business during a five year transition period. Plan participants elect to make voluntary contributions to this plan up to a specified amount of their compensation. We contribute a matching amount not to exceed 12% of the participant’s salary for new hires and 15% of the participant’s salary for all other participants.
Supplemental Salary Deferral Plan and Supplemental Executive Retirement Plan
The Huntsman Supplemental Savings Plan (the “SSP”) is a non-qualified plan covering key management employees and allows participants to defer amounts that would otherwise be paid as compensation. The participant can
Table of Contents
HUNTSMAN CORPORATION AND SUBSIDIARIES
HUNTSMAN INTERNATIONAL LLC AND SUBSIDIARIES
NOTES TO CONSOLIDATED FINANCIAL STATEMENTS (Continued)
defer up to 75% of their salary and bonus each year. This plan also provides benefits that would be provided under the Huntsman Salary Deferral Plan if that plan were not subject to legal limits on the amount of contributions that can be allocated to an individual in a single year. The SSP was amended and restated effective as of January 1, 2005 to allow eligible executive employees to comply with Section 409A of the Internal Revenue Code of 1986.
The Huntsman Supplemental Executive Retirement Plan (the “SERP”) is an unfunded non-qualified pension plan established to provide certain executive employees with benefits that could not be provided, due to legal limitations, under the Huntsman Defined Benefit Pension Plan, a qualified defined benefit pension plan, and the Huntsman Money Purchase Pension Plan, a qualified money purchase pension plan.
Assets of these plans are included in other noncurrent assets and as of December 31, 2017 and 2016 were $33 million and $27 million, respectively. During each of the years ended December 31, 2017, 2016 and 2015, we expensed a total of $1 million as contributions to the SSP and the SERP.
Stock-Based Incentive Plan
On May 5, 2016, our stockholders approved a new Huntsman Corporation 2016 Stock Incentive Plan (the “2016 Stock Incentive Plan”), which reserved 8.2 million shares for issuance. The Huntsman Corporation Stock Incentive Plan, as amended and restated (the “Prior Plan”), remains in effect for outstanding awards granted pursuant to the Prior Plan, but no further awards may be granted under the Prior Plan. Under the 2016 Stock Incentive Plan, we may grant nonqualified stock options, incentive stock options, stock appreciation rights, restricted stock, phantom stock, performance share units and other stock-based awards to our employees, directors and consultants and to employees and consultants of our subsidiaries, provided that incentive stock options may be granted solely to employees. The terms of the grants under both the 2016 Stock Incentive Plan and the Prior Plan are fixed at the grant date. As of December 31, 2017, we had approximately 8 million shares remaining under the 2017 Stock Incentive Plan available for grant. See “Note 21. Stock-Based Compensation Plan.”
International Plans
International employees are covered by various post‑employment arrangements consistent with local practices and regulations. Such obligations are included in other long‑term liabilities in our consolidated balance sheets.
17. INCOME TAXES
The following is a summary of U.S. and non‑U.S. provisions for current and deferred income taxes (dollars in millions):
Huntsman Corporation
|
|
|
|
|
|
|
|
|
|
|
|
|
|
Year ended December 31,
|
|
|
|
2017
|
|
2016
|
|
2015
|
|
Income tax expense (benefit):
|
|
|
|
|
|
|
|
|
|
|
U.S.
|
|
|
|
|
|
|
|
|
|
|
Current
|
|
$
|
23
|
|
$
|
50
|
|
$
|
54
|
|
Deferred
|
|
|
(95)
|
|
|
(15)
|
|
|
17
|
|
Non-U.S.
|
|
|
|
|
|
|
|
|
|
|
Current
|
|
|
94
|
|
|
55
|
|
|
26
|
|
Deferred
|
|
|
42
|
|
|
19
|
|
|
(37)
|
|
Total
|
|
$
|
64
|
|
$
|
109
|
|
$
|
60
|
Table of Contents
HUNTSMAN CORPORATION AND SUBSIDIARIES
HUNTSMAN INTERNATIONAL LLC AND SUBSIDIARIES
NOTES TO CONSOLIDATED FINANCIAL STATEMENTS (Continued)
Huntsman International
|
|
|
|
|
|
|
|
|
|
|
|
|
|
Year ended December 31,
|
|
|
|
2017
|
|
2016
|
|
2015
|
|
Income tax expense (benefit):
|
|
|
|
|
|
|
|
|
|
|
U.S.
|
|
|
|
|
|
|
|
|
|
|
Current
|
|
$
|
16
|
|
$
|
50
|
|
$
|
52
|
|
Deferred
|
|
|
(92)
|
|
|
(16)
|
|
|
17
|
|
Non-U.S.
|
|
|
|
|
|
|
|
|
|
|
Current
|
|
|
94
|
|
|
55
|
|
|
25
|
|
Deferred
|
|
|
43
|
|
|
19
|
|
|
(35)
|
|
Total
|
|
$
|
61
|
|
$
|
108
|
|
$
|
59
|
The following schedule reconciles the differences between the U.S. federal income taxes at the U.S. statutory rate to our provision for income taxes (dollars in millions):
Huntsman Corporation
|
|
|
|
|
|
|
|
|
|
|
|
|
|
Year ended December 31,
|
|
|
|
2017
|
|
2016
|
|
2015
|
|
Income from continuing operations before income taxes
|
|
$
|
647
|
|
$
|
474
|
|
$
|
488
|
|
Expected tax expense at U.S. statutory rate of 35%
|
|
$
|
227
|
|
$
|
166
|
|
$
|
171
|
|
Change resulting from:
|
|
|
|
|
|
|
|
|
|
|
State tax expense net of federal benefit
|
|
|
(2)
|
|
|
(1)
|
|
|
(3)
|
|
Non-U.S. tax rate differentials
|
|
|
(64)
|
|
|
(32)
|
|
|
(2)
|
|
Non-taxable portion of gain on sale of European surfactants business
|
|
|
—
|
|
|
(23)
|
|
|
—
|
|
U.S. Tax Reform Act impact
|
|
|
(52)
|
|
|
—
|
|
|
—
|
|
U.S. domestic manufacturing deduction
|
|
|
—
|
|
|
—
|
|
|
(7)
|
|
Currency exchange gains and losses
|
|
|
15
|
|
|
(5)
|
|
|
(38)
|
|
Effect of tax holidays
|
|
|
—
|
|
|
—
|
|
|
(6)
|
|
U.S. foreign tax credits, net of associated income and taxes
|
|
|
—
|
|
|
—
|
|
|
(22)
|
|
Tax benefit of losses with valuation allowances as a result of other comprehensive income
|
|
|
—
|
|
|
—
|
|
|
(2)
|
|
Tax authority audits and dispute resolutions
|
|
|
9
|
|
|
2
|
|
|
1
|
|
Change in valuation allowance
|
|
|
(72)
|
|
|
(38)
|
|
|
(13)
|
|
Other non-U.S. tax effects, including nondeductible expenses, tax effect of rate changes, transfer pricing adjustments and various withholding taxes
|
|
|
3
|
|
|
30
|
|
|
(20)
|
|
Other U.S. tax effects, including nondeductible expenses and other credits
|
|
|
—
|
|
|
10
|
|
|
1
|
|
Total income tax expense
|
|
$
|
64
|
|
$
|
109
|
|
$
|
60
|
Table of Contents
HUNTSMAN CORPORATION AND SUBSIDIARIES
HUNTSMAN INTERNATIONAL LLC AND SUBSIDIARIES
NOTES TO CONSOLIDATED FINANCIAL STATEMENTS (Continued)
Huntsman International
|
|
|
|
|
|
|
|
|
|
|
|
|
|
Year ended December 31,
|
|
|
|
2017
|
|
2016
|
|
2015
|
|
Income from continuing operations before income taxes
|
|
$
|
640
|
|
$
|
475
|
|
$
|
493
|
|
Expected tax expense at U.S. statutory rate of 35%
|
|
$
|
224
|
|
$
|
165
|
|
$
|
170
|
|
Change resulting from:
|
|
|
|
|
|
|
|
|
|
|
State tax expense net of federal benefit
|
|
|
(2)
|
|
|
(1)
|
|
|
(3)
|
|
Non-U.S. tax rate differentials
|
|
|
(64)
|
|
|
(32)
|
|
|
(2)
|
|
Non-taxable portion of gain on sale of European surfactants business
|
|
|
—
|
|
|
(23)
|
|
|
—
|
|
U.S. Tax Reform Act impact
|
|
|
(53)
|
|
|
—
|
|
|
—
|
|
U.S. domestic manufacturing deduction
|
|
|
—
|
|
|
—
|
|
|
(7)
|
|
Currency exchange gains and losses
|
|
|
15
|
|
|
(5)
|
|
|
(38)
|
|
Effect of tax holidays
|
|
|
—
|
|
|
—
|
|
|
(6)
|
|
U.S. foreign tax credits, net of associated income and taxes
|
|
|
—
|
|
|
—
|
|
|
(22)
|
|
Tax benefit of losses with valuation allowances as a result of other comprehensive income
|
|
|
—
|
|
|
—
|
|
|
(2)
|
|
Tax authority audits and dispute resolutions
|
|
|
9
|
|
|
2
|
|
|
1
|
|
Change in valuation allowance
|
|
|
(72)
|
|
|
(39)
|
|
|
(13)
|
|
Other non-U.S. tax effects, including nondeductible expenses, tax effect of rate changes, transfer pricing adjustments and various withholding taxes
|
|
|
4
|
|
|
32
|
|
|
(18)
|
|
Other U.S. tax effects, including nondeductible expenses and other credits
|
|
|
—
|
|
|
9
|
|
|
(1)
|
|
Total income tax expense
|
|
$
|
61
|
|
$
|
108
|
|
$
|
59
|
We operate in many non-U.S. tax jurisdictions with no specific country earning a predominant amount of our off-shore earnings. The vast majority of these countries have income tax rates that are lower than the U.S. statutory rate. During 2017, 2016 and 2015, the average statutory rate for countries with pre-tax income was lower than the average statutory rate for countries with pre-tax losses, almost all of which had statutory rates lower than the U.S., resulting in net benefits as compared to the U.S. statutory rate of $64 million, $32 million and $2 million, respectively, reflected in the reconciliation above. In 2017, the $64 million net benefit relates primarily to our Polyurethanes business in The Netherlands, China and the U.K., as well as our Advanced Materials business in Switzerland and our Corporate function in Luxembourg. In 2016, the $32 million net benefit relates primarily to our Polyurethanes business in The Netherlands and China and our Advanced Materials business in Switzerland.
In certain non-U.S. tax jurisdictions, our U.S. GAAP functional currency is different than the local tax currency. As a result, foreign exchange gains and losses will impact our effective tax rate. For 2017, this resulted in a $15 million tax expense and for 2016, this resulted in a $5 million tax benefit. For 2015, this resulted in a $23 million tax benefit ($38 million, net of $15 million of contingent liabilities and valuation allowances).
During 2015, we declared a dividend from our non-U.S. operations to the U.S. which included bringing onshore certain U.S. foreign tax credits. The foreign tax credits brought onshore exceeded the amount needed to offset the cash tax impact of the dividend, as well as enough to allow us to carry $14 million of foreign tax credits back to a prior year and claim a refund.
Table of Contents
HUNTSMAN CORPORATION AND SUBSIDIARIES
HUNTSMAN INTERNATIONAL LLC AND SUBSIDIARIES
NOTES TO CONSOLIDATED FINANCIAL STATEMENTS (Continued)
The components of income (loss) from continuing operations before income taxes were as follows (dollars in millions):
Huntsman Corporation
|
|
|
|
|
|
|
|
|
|
|
|
|
|
Year ended December 31,
|
|
|
|
2017
|
|
2016
|
|
2015
|
|
U.S.
|
|
$
|
(39)
|
|
$
|
91
|
|
$
|
265
|
|
Non-U.S.
|
|
|
686
|
|
|
383
|
|
|
223
|
|
Total
|
|
$
|
647
|
|
$
|
474
|
|
$
|
488
|
Huntsman International
|
|
|
|
|
|
|
|
|
|
|
|
|
|
Year ended December 31,
|
|
|
|
2017
|
|
2016
|
|
2015
|
|
U.S.
|
|
$
|
(46)
|
|
$
|
92
|
|
$
|
268
|
|
Non-U.S.
|
|
|
686
|
|
|
383
|
|
|
225
|
|
Total
|
|
$
|
640
|
|
$
|
475
|
|
$
|
493
|
Components of deferred income tax assets and liabilities were as follows (dollars in millions):
Huntsman Corporation
|
|
|
|
|
|
|
|
|
|
|
December 31,
|
|
|
|
2017
|
|
2016
|
|
Deferred income tax assets:
|
|
|
|
|
|
|
|
Net operating loss carryforwards
|
|
$
|
411
|
|
$
|
539
|
|
Pension and other employee compensation
|
|
|
204
|
|
|
271
|
|
Property, plant and equipment
|
|
|
39
|
|
|
28
|
|
Intangible assets
|
|
|
93
|
|
|
99
|
|
Foreign tax credits
|
|
|
—
|
|
|
5
|
|
Other, net
|
|
|
49
|
|
|
60
|
|
Total
|
|
$
|
796
|
|
$
|
1,002
|
|
Deferred income tax liabilities:
|
|
|
|
|
|
|
|
Property, plant and equipment
|
|
$
|
(363)
|
|
$
|
(489)
|
|
Pension and other employee compensation
|
|
|
(5)
|
|
|
(1)
|
|
Intangible assets
|
|
|
(11)
|
|
|
(9)
|
|
Other, net
|
|
|
(49)
|
|
|
(125)
|
|
Total
|
|
$
|
(428)
|
|
$
|
(624)
|
|
Net deferred tax asset before valuation allowance
|
|
$
|
368
|
|
$
|
378
|
|
Valuation allowance—net operating losses and other
|
|
|
(424)
|
|
|
(496)
|
|
Net deferred tax liability
|
|
$
|
(56)
|
|
$
|
(118)
|
|
Non-current deferred tax asset
|
|
|
208
|
|
|
253
|
|
Non-current deferred tax liability
|
|
|
(264)
|
|
|
(371)
|
|
Net deferred tax liability
|
|
$
|
(56)
|
|
$
|
(118)
|
Table of Contents
HUNTSMAN CORPORATION AND SUBSIDIARIES
HUNTSMAN INTERNATIONAL LLC AND SUBSIDIARIES
NOTES TO CONSOLIDATED FINANCIAL STATEMENTS (Continued)
Huntsman International
|
|
|
|
|
|
|
|
|
|
|
December 31,
|
|
|
|
2017
|
|
2016
|
|
Deferred income tax assets:
|
|
|
|
|
|
|
|
Net operating loss carryforwards
|
|
$
|
411
|
|
$
|
542
|
|
Pension and other employee compensation
|
|
|
203
|
|
|
269
|
|
Property, plant and equipment
|
|
|
39
|
|
|
32
|
|
Intangible assets
|
|
|
93
|
|
|
99
|
|
Foreign tax credits
|
|
|
—
|
|
|
5
|
|
Other, net
|
|
|
49
|
|
|
59
|
|
Total
|
|
$
|
795
|
|
$
|
1,006
|
|
Deferred income tax liabilities:
|
|
|
|
|
|
|
|
Property, plant and equipment
|
|
$
|
(362)
|
|
$
|
(486)
|
|
Pension and other employee compensation
|
|
|
(5)
|
|
|
(1)
|
|
Intangible assets
|
|
|
(11)
|
|
|
(9)
|
|
Other, net
|
|
|
(50)
|
|
|
(125)
|
|
Total
|
|
$
|
(428)
|
|
$
|
(621)
|
|
Net deferred tax asset before valuation allowance
|
|
$
|
367
|
|
$
|
385
|
|
Valuation allowance—net operating losses and other
|
|
|
(424)
|
|
|
(499)
|
|
Net deferred tax liability
|
|
$
|
(57)
|
|
$
|
(114)
|
|
Non-current deferred tax asset
|
|
|
208
|
|
|
253
|
|
Non-current deferred tax liability
|
|
|
(265)
|
|
|
(367)
|
|
Net deferred tax liability
|
|
$
|
(57)
|
|
$
|
(114)
|
We have gross NOLs of $1,615 million in various non‑U.S. jurisdictions. While the majority of the non‑U.S. NOLs have no expiration date, $479 million have a limited life (of which $461 million are subject to a valuation allowance) and $133 million are scheduled to expire in 2018 (all of which are subject to a valuation allowance). We had no NOLs expire unused in 2017.
Included in the $1,615 million of gross non‑U.S. NOLs is $707 million attributable to our Luxembourg entities. As of December 31, 2017, due to the uncertainty surrounding the realization of the benefits of these losses, there is a valuation allowance of $144 million against these net tax‑effected NOLs of $184 million.
We evaluate deferred tax assets to determine whether it is more likely than not that they will be realized. Valuation allowances are reviewed each period on a tax jurisdiction by jurisdiction basis to analyze whether there is sufficient positive or negative evidence to support a change in judgment about the realizability of the related deferred tax assets. These conclusions require significant judgment. In evaluating the objective evidence that historical results provide, we consider the cyclicality of businesses and cumulative income or losses during the applicable period. Cumulative losses incurred over the period limits our ability to consider other subjective evidence such as our projections for the future. Our judgments regarding valuation allowances are also influenced by the costs and risks associated with any tax planning idea associated with utilizing a deferred tax asset.
During 2017, we released valuation allowances of $22 million. In Italy, we released valuation allowances of $7 million on certain net deferred assets of our Polyurethanes business. On March 1, 2017 and April 1, 2017, we de-merged the Italian legal entities containing our Polyurethanes business from our combined Italian tax group. The historical and expected continued profitability of those Polyurethanes businesses resulted in the release of the associated valuation allowance. In Luxembourg, we released valuation allowances of $15 million as a result of changes in estimated future taxable income resulting from increased intercompany receivables and, therefore, increased income in Luxembourg, our primary treasury center outside of the U.S.
During 2016, we established valuation allowances of $12 million and released valuation allowances of $19 million. In Italy we established $9 million of valuation allowances on certain net deferred tax assets as a result of the sale of our European surfactants business, and in China we established $3 million of valuation allowances as a result of
Table of Contents
HUNTSMAN CORPORATION AND SUBSIDIARIES
HUNTSMAN INTERNATIONAL LLC AND SUBSIDIARIES
NOTES TO CONSOLIDATED FINANCIAL STATEMENTS (Continued)
the closure of our Qingdao, China plant. We released valuation allowances of $12 million in Spain as a result of cumulative profitability and $7 million in The Netherlands as a result of tax planning to utilize losses that would have otherwise expired.
During 2015, we established valuation allowances of $21 million and released valuation allowances of $3 million. In the U.S., we established $14 million of valuation allowance on U.S. foreign tax credits due to the application of specific foreign tax credit limitations and in The Netherlands we established $7 million of valuation allowance on losses which are scheduled to expire after 2016.
Uncertainties regarding expected future income in certain jurisdictions could affect the realization of deferred tax assets in those jurisdictions and result in additional valuation allowances in future periods, or, in the case of unexpected pre-tax earnings, the release of valuation allowances in future periods.
The following is a summary of changes in the valuation allowance (dollars in millions):
Huntsman Corporation
|
|
|
|
|
|
|
|
|
|
|
|
|
|
2017
|
|
2016
|
|
2015
|
|
Valuation allowance as of January 1
|
|
$
|
496
|
|
$
|
526
|
|
$
|
518
|
|
Valuation allowance as of December 31
|
|
|
424
|
|
|
496
|
|
|
526
|
|
Net (increase) decrease
|
|
|
72
|
|
|
30
|
|
|
(8)
|
|
Foreign currency movements
|
|
|
11
|
|
|
(11)
|
|
|
(4)
|
|
(Decrease) increase to deferred tax assets with no impact on operating tax expense, including an offsetting (decrease) increase to valuation allowances
|
|
|
(11)
|
|
|
19
|
|
|
25
|
|
Change in valuation allowance per rate reconciliation
|
|
$
|
72
|
|
$
|
38
|
|
$
|
13
|
|
Components of change in valuation allowance affecting tax expense:
|
|
|
|
|
|
|
|
|
|
|
Pre-tax income and losses in jurisdictions with valuation allowances resulting in no tax expense or benefit
|
|
$
|
50
|
|
$
|
31
|
|
$
|
31
|
|
Releases of valuation allowances in various jurisdictions
|
|
|
22
|
|
|
19
|
|
|
3
|
|
Establishments of valuation allowances in various jurisdictions
|
|
|
—
|
|
|
(12)
|
|
|
(21)
|
|
Change in valuation allowance per rate reconciliation
|
|
$
|
72
|
|
$
|
38
|
|
$
|
13
|
Huntsman International
|
|
|
|
|
|
|
|
|
|
|
|
|
|
2017
|
|
2016
|
|
2015
|
|
Valuation allowance as of January 1
|
|
$
|
499
|
|
$
|
530
|
|
$
|
522
|
|
Valuation allowance as of December 31
|
|
|
424
|
|
|
499
|
|
|
530
|
|
Net (increase) decrease
|
|
|
75
|
|
|
31
|
|
|
(8)
|
|
Foreign currency movements
|
|
|
11
|
|
|
(11)
|
|
|
(4)
|
|
(Decrease) increase to deferred tax assets with no impact on operating tax expense, including an offsetting (decrease) increase to valuation allowances
|
|
|
(14)
|
|
|
19
|
|
|
25
|
|
Change in valuation allowance per rate reconciliation
|
|
$
|
72
|
|
$
|
39
|
|
$
|
13
|
|
Components of change in valuation allowance affecting tax expense:
|
|
|
|
|
|
|
|
|
|
|
Pre-tax income and losses in jurisdictions with valuation allowances resulting in no tax expense or benefit
|
|
$
|
49
|
|
$
|
32
|
|
$
|
31
|
|
Releases of valuation allowances in various jurisdictions
|
|
|
23
|
|
|
19
|
|
|
3
|
|
Establishments of valuation allowances in various jurisdictions
|
|
|
—
|
|
|
(12)
|
|
|
(21)
|
|
Change in valuation allowance per rate reconciliation
|
|
$
|
72
|
|
$
|
39
|
|
$
|
13
|
Table of Contents
HUNTSMAN CORPORATION AND SUBSIDIARIES
HUNTSMAN INTERNATIONAL LLC AND SUBSIDIARIES
NOTES TO CONSOLIDATED FINANCIAL STATEMENTS (Continued)
The following is a reconciliation of our unrecognized tax benefits (dollars in millions):
|
|
|
|
|
|
|
|
|
|
|
2017
|
|
2016
|
|
Unrecognized tax benefits as of January 1
|
|
$
|
17
|
|
$
|
37
|
|
Gross increases and decreases—tax positions taken during a prior period
|
|
|
3
|
|
|
1
|
|
Gross increases and decreases—tax positions taken during the current period
|
|
|
4
|
|
|
3
|
|
Decreases related to settlements of amounts due to tax authorities
|
|
|
—
|
|
|
(21)
|
|
Reductions resulting from the lapse of statutes of limitation
|
|
|
(2)
|
|
|
(1)
|
|
Foreign currency movements
|
|
|
1
|
|
|
(2)
|
|
Unrecognized tax benefits as of December 31
|
|
$
|
23
|
|
$
|
17
|
As of December 31, 2017 and 2016, the amount of unrecognized tax benefits which, if recognized, would affect the effective tax rate is $19 million and $9 million, respectively.
During 2017, we concluded and settled tax examinations in various jurisdictions, including, but not limited to, China and the U.S. (various states). During 2016, we concluded and settled tax examinations in various non-U.S. jurisdictions including, but not limited to, China, Germany, Indonesia, The Netherlands, Spain and the U.K. During 2015, we concluded and effectively settled tax examinations in the U.S. (both federal and various states) and various non-U.S. jurisdictions, including, but not limited to, China and France.
During 2017, for unrecognized tax benefits that impact tax expense, we recorded a net increase in unrecognized tax benefits with a corresponding income tax expense (not including interest and penalty expense) of $9 million. During 2016 and 2015, we recorded a net increase in unrecognized tax benefits with a corresponding income tax expense (not including interest and penalty expense) of $2 million and $1 million, respectively. Additional decreases in unrecognized tax benefits were offset by cash settlements or by a decrease in net deferred tax assets and, therefore, did not affect income tax expense.
In accordance with our accounting policy, we continue to recognize interest and penalties accrued related to unrecognized tax benefits in income tax expense.
|
|
|
|
|
|
|
|
|
|
|
|
|
|
Year ended December 31,
|
|
|
|
2017
|
|
2016
|
|
2015
|
|
Interest expense included in tax expense
|
|
$
|
—
|
|
$
|
1
|
|
$
|
—
|
|
Penalties expense included in tax expense
|
|
|
—
|
|
|
—
|
|
|
—
|
|
|
|
|
|
|
|
|
|
|
|
December 31,
|
|
|
|
2017
|
|
2016
|
|
Accrued liability for interest
|
|
$
|
3
|
|
$
|
3
|
|
Accrued liability for penalties
|
|
|
—
|
|
|
—
|
Table of Contents
HUNTSMAN CORPORATION AND SUBSIDIARIES
HUNTSMAN INTERNATIONAL LLC AND SUBSIDIARIES
NOTES TO CONSOLIDATED FINANCIAL STATEMENTS (Continued)
We conduct business globally and, as a result, we file income tax returns in U.S. federal, various U.S. state and various non‑U.S. jurisdictions. The following table summarizes the tax years that remain subject to examination by major tax jurisdictions:
|
|
|
|
|
Tax Jurisdiction
|
|
Open Tax Years
|
|
China
|
|
2012 and later
|
|
France
|
|
2004 and later
|
|
Germany
|
|
2011 and later
|
|
India
|
|
2004 and later
|
|
Italy
|
|
2013 and later
|
|
Malaysia
|
|
2015 and later
|
|
Switzerland
|
|
2011 and later
|
|
The Netherlands
|
|
2015 and later
|
|
United Kingdom
|
|
2016 and later
|
|
United States federal
|
|
2009 and later
|
Certain of our U.S. and non-U.S. income tax returns are currently under various stages of audit by applicable tax authorities and the amounts ultimately agreed upon in resolution of the issues raised may differ materially from the amounts accrued.
We estimate that it is reasonably possible that certain of our non-U.S. unrecognized tax benefits could change within 12 months of the reporting date with a resulting decrease in the unrecognized tax benefits within a reasonably possible range of nil to $9 million. For the 12‑month period from the reporting date, we would expect that a substantial portion of the decrease in our unrecognized tax benefits would result in a corresponding benefit to our income tax expense.
On December 22, 2017, the U.S. government enacted the U.S. Tax Reform Act. The U.S. Tax Reform Act makes broad and complex changes to the U.S. tax code that will affect 2017, including, but not limited to, requiring a one-time transition tax on certain unrepatriated earnings of foreign subsidiaries which is payable over eight years. Because of the complexity of these new laws, we are continuing to evaluate the application of ASC 740 to the U.S. Tax Reform Act and have, therefore, recorded only provisional amounts.
The SEC staff issued SAB 118, which provides guidance on accounting for the tax effects of the U.S. Tax Reform Act. SAB 118 provides a measurement period that should not extend beyond one year from the U.S. Tax Reform Act enactment date for companies to complete the accounting under ASC 740. In accordance with SAB 118, a company must reflect the income tax effects of those aspects of the U.S. Tax Reform Act for which the accounting under ASC 740 is complete. To the extent that a company’s accounting for certain income tax effects of the U.S. Tax Reform Act is incomplete but it is able to determine a reasonable estimate, it should record a provisional estimate in the financial statements. If a company cannot determine a provisional estimate to be included in the financial statements, it should continue to apply ASC 740 on the basis of the provisions of the tax laws that were in effect immediately before the enactment of the U.S. Tax Reform Act.
For various reasons that are discussed more fully below, we have not completed our accounting for the income tax effects of certain elements of the U.S. Tax Reform Act. If we were able to make reasonable estimates of the effects of elements for which our analysis is not yet complete, we recorded provisional adjustments. If we were not yet able to make reasonable estimates of the impact of certain elements, we have not recorded any adjustments related to those elements and have continued accounting for them in accordance with ASC 740 on the basis of the tax laws in effect before the U.S. Tax Reform Act.
The U.S. Tax Reform Act establishes new tax laws that will affect 2018, including, but not limited to, (1) reduction of the U.S. federal corporate tax rate; (2) the creation of the base erosion anti-abuse tax (BEAT), a new minimum tax; (3) a general elimination of U.S. federal income taxes on dividends from foreign subsidiaries; (4) a new provision designed to tax global intangible low-taxed income (“GILTI”); (5) a new limitation on deductible interest expense; and (6) the repeal of the domestic production activity deduction.
Table of Contents
HUNTSMAN CORPORATION AND SUBSIDIARIES
HUNTSMAN INTERNATIONAL LLC AND SUBSIDIARIES
NOTES TO CONSOLIDATED FINANCIAL STATEMENTS (Continued)
The U.S. Tax Reform Act reduces the corporate tax rate to 21%, effective January 1, 2018. For our net deferred tax assets and liabilities, we have recorded a provisional decrease of $12 million and $149 million, respectively, with a corresponding provisional net deferred tax benefit of $137 million for the year ended December 31, 2017. The provisional $12 million decrease in net deferred tax assets, with a corresponding net deferred tax expense of $12 million, relates to our consolidated variable interest entity, Rubicon LLC, which is a 50%-owned joint venture. Therefore, $6 million of this provisional tax expense is offset in net income attributable to noncontrolling interests. While we are able to make a reasonable estimate of the impact of the reduction in corporate rate, it may be affected by other analyses related to the U.S. Tax Reform Act, including, but not limited to, our calculation of deemed repatriation of deferred foreign income, return to accrual adjustments including completion of computations and analysis of 2017 expenditures that qualify for immediate expensing, and the state tax effect of adjustments made to federal temporary differences.
The Deemed Repatriation Transition Tax is a tax on previously untaxed accumulated and current earnings and profits of certain of our foreign subsidiaries. To determine the amount of the transition tax, we must determine, in addition to other factors, the amount of post-1986 earnings and profits of the relevant subsidiaries, as well as the amount of non-U.S. income taxes paid on such earnings. We are able to make a reasonable estimate of the transition tax and recorded a provisional transition tax expense of $85 million. However, we are continuing to gather and analyze additional information to more precisely compute the amount of the transition tax. As required by U.S. GAAP, we have recognized the provisional $85 million of transition taxes in our income from continuing operations. Absent the Venator offering and certain tax related restructuring transactions, our provisional transition tax liability would have been $12 million. As required by U.S. GAAP, the impact of the U.S. Tax Reform Act is included in continuing operations, even for transactions associated with the Venator offering. Because of the complexity of the associated multistate tax considerations and limited specific guidance from state tax authorities, we have not determined or recorded any impact of the federal deemed repatriation of foreign earnings on our state tax expense or state deferred tax assets and liabilities.
Under U.S. GAAP, we are allowed to make an accounting policy choice of either (1) treating taxes due on future U.S. inclusions in taxable income related to GILTI as a current-period expense when incurred (the “period cost method”) or (2) factoring such amounts into our measurement of our deferred taxes (the “deferred method”). Our selection of an accounting policy with respect to the new GILTI tax rules will depend, in part, on analyzing our global income to determine whether we expect to have future U.S. inclusions in taxable income related to GILTI and, if so, what the impact is expected to be. Because whether we expect to have future U.S. inclusions in taxable income related to GILTI depends on not only our current structure and estimated future results of global operations but also our intent and ability to modify our structure and/or our business, we are not yet able to reasonably estimate the effect of this provision of the U.S. Tax Reform Act. Therefore, we have not made any adjustments related to potential GILTI tax in our financial statements and have not made a policy decision regarding whether to record deferred taxes on GILTI.
We must assess whether our valuation allowance analyses are affected by various aspects of the U.S. Tax Reform Act (e.g., deemed repatriation of deferred foreign income, GILTI inclusions, new categories of foreign tax credits). Since, as discussed, we have recorded provisional amounts related to certain portions of the U.S. Tax Reform Act, any corresponding determination of the need for or change in any valuation allowances is also provisional.
We must also assess whether our uncertain tax positions are affected by various aspects of the U.S Tax Reform Act (e.g., deemed repatriation of deferred foreign income, GILTI inclusions, new categories of foreign tax credits). Since, as discussed, we have not made any adjustments related to certain portions of the U.S. Tax Reform Act, and have recorded only provisional amounts related to other portions of the U.S. Tax Reform Act, we have not determined the need for or change in any unrecognized tax positions.
The U.S. Tax Reform Act includes a mandatory one-time tax on accumulated earnings of foreign subsidiaries, and as a result, all previously unremitted earnings for which no U.S. deferred tax liability had been accrued have now been subject to U.S. tax. For subsidiaries with local withholding taxes, we intend to continue to invest most or all of these earnings indefinitely within the local country and do not expect to incur any significant, additional taxes related to such amounts.
Table of Contents
HUNTSMAN CORPORATION AND SUBSIDIARIES
HUNTSMAN INTERNATIONAL LLC AND SUBSIDIARIES
NOTES TO CONSOLIDATED FINANCIAL STATEMENTS (Continued)
18. COMMITMENTS AND CONTINGENCIES
Purchase Commitments
We have various purchase commitments extending through 2039 for materials, supplies and services entered into in the ordinary course of business. Included in the purchase commitments table below are contracts which require minimum volume purchases that extend beyond one year or are renewable annually and have been renewed for 2017. Certain contracts allow for changes in minimum required purchase volumes in the event of a temporary or permanent shutdown of a facility. To the extent the contract requires a minimum notice period, such notice period has been included in the table below. The contractual purchase prices for substantially all of these contracts are variable based upon market prices, subject to annual negotiations. We have estimated our contractual obligations by using the terms of our current pricing for each contract. We also have a limited number of contracts which require a minimum payment even if no volume is purchased. We believe that all of our purchase obligations will be utilized in our normal operations. We made minimum payments of nil, $1 million and nil for the years ended December 31, 2017, 2016 and 2015, respectively, under such take or pay contracts without taking the product.
Total purchase commitments as of December 31, 2017 are as follows (dollars in millions):
|
|
|
|
|
|
Year ending December 31,
|
|
|
|
|
2018
|
|
$
|
1,299
|
|
2019
|
|
|
1,285
|
|
2020
|
|
|
701
|
|
2021
|
|
|
499
|
|
2022
|
|
|
495
|
|
Thereafter
|
|
|
2,087
|
|
|
|
$
|
6,366
|
Operating Leases
We lease certain railcars, aircraft, equipment and facilities under long-term lease agreements. The total expense recorded under operating lease agreements in our consolidated statements of operations is approximately $80 million, $81 million and $86 million for 2017, 2016 and 2015, respectively, net of sublease rentals of approximately $2 million each for the years ended December 31, 2017, 2016 and 2015.
Future minimum lease payments under operating leases as of December 31, 2017 are as follows (dollars in millions):
|
|
|
|
|
|
Year ending December 31,
|
|
|
|
|
2018
|
|
$
|
74
|
|
2019
|
|
|
67
|
|
2020
|
|
|
60
|
|
2021
|
|
|
54
|
|
2022
|
|
|
49
|
|
Thereafter
|
|
|
134
|
|
|
|
$
|
438
|
Future minimum lease payments have not been reduced by minimum sublease rentals of $2 million due in the future under noncancelable subleases.
Legal Matters
Indemnification Matters
On July 3, 2012, Deutsche Bank Securities Inc. and Credit Suisse Securities (USA) LLC (“the Banks”) demanded that we indemnify them for claims brought against them by certain MatlinPatterson entities that were formerly
Table of Contents
HUNTSMAN CORPORATION AND SUBSIDIARIES
HUNTSMAN INTERNATIONAL LLC AND SUBSIDIARIES
NOTES TO CONSOLIDATED FINANCIAL STATEMENTS (Continued)
our stockholders (“MatlinPatterson”) in litigation filed by MatlinPatterson on June 19, 2012 in the 9th District Court in Montgomery County, Texas (the “Texas Litigation”). We denied the Banks’ indemnification demand for the Texas Litigation. These claims allegedly arose from the failed acquisition by and merger with Hexion. The Texas Litigation was dismissed, which was upheld by the Ninth Court of Appeals and the Texas Supreme Court denied review by final order entered January 7, 2016.
On July 14, 2014, the Banks demanded that we indemnify them for additional claims brought against them by certain other former Company stockholders in litigation filed June 14, 2014 in the United States District Court for the Eastern District of Wisconsin (the “Wisconsin Litigation”). We denied the Banks’ indemnification demand for the Wisconsin Litigation and have made no accrual with respect to this matter. The stockholders in the Wisconsin Litigation have made essentially the same factual allegations as MatlinPatterson made in the Texas Litigation and, additionally, have named Apollo Global Management LLC and Apollo Management Holdings, L.P. as defendants. Stockholder plaintiffs in the Wisconsin Litigation assert claims for misrepresentation and conspiracy to defraud. On June 30, 2016, the plaintiffs voluntarily dismissed the Apollo defendants and on December 5, 2016, the court dismissed Deutsche Bank for lack of personal jurisdiction, but denied Credit Suisse's motion to dismiss. Subsequently, Credit Suisse asked the court to reconsider its decision or certify its judgment to the Seventh Circuit Court of Appeals for an immediate appeal, which remains pending. Subsequent to discovery, Credit Suisse filed a motion for summary judgment on August 25, 2017 and a decision is pending. The court has suspended the current scheduling order, including the trial date. We denied the Banks’ indemnification demand for both the Texas Litigation and the Wisconsin Litigation.
Other Proceedings
We are a party to various other proceedings instituted by private plaintiffs, governmental authorities and others arising under provisions of applicable laws, including various environmental, products liability and other laws. Except as otherwise disclosed in this report, we do not believe that the outcome of any of these matters will have a material effect on our financial condition, results of operations or liquidity.
19. ENVIRONMENTAL, HEALTH AND SAFETY MATTERS
EHS Capital Expenditures
We may incur future costs for capital improvements and general compliance under EHS laws, including costs to acquire, maintain and repair pollution control equipment. For the years ended December 31, 2017, 2016 and 2015, our capital expenditures for EHS matters totaled $47 million, $55 million, and $121 million, respectively. Because capital expenditures for these matters are subject to evolving regulatory requirements and depend, in part, on the timing, promulgation and enforcement of specific requirements, our capital expenditures for EHS matters have varied significantly from year to year and we cannot provide assurance that our recent expenditures are indicative of future amounts we may spend related to EHS and other applicable laws.
Environmental Reserves
We have accrued liabilities relating to anticipated environmental cleanup obligations, site reclamation and closure costs and known penalties. Liabilities are recorded when potential liabilities are either known or considered probable and can be reasonably estimated. Our liability estimates are calculated using present value techniques as appropriate and are based upon requirements placed upon us by regulators, available facts, existing technology and past experience. The environmental liabilities do not include amounts recorded as asset retirement obligations. We had accrued $21 million and $22 million for environmental liabilities as of December 31, 2017 and 2016, respectively. Of these amounts, $6 million and $7 million were classified as accrued liabilities in our consolidated balance sheets as of December 31, 2017 and 2016, respectively, and $15 million each were classified as other noncurrent liabilities in our consolidated balance sheets as of December 31, 2017 and 2016. In certain cases, our remediation liabilities may be payable over periods of up to 30 years. We may incur losses for environmental remediation in excess of the amounts accrued; however, we are not able to estimate the amount or range of such potential excess.
Table of Contents
HUNTSMAN CORPORATION AND SUBSIDIARIES
HUNTSMAN INTERNATIONAL LLC AND SUBSIDIARIES
NOTES TO CONSOLIDATED FINANCIAL STATEMENTS (Continued)
Environmental Matters
Under the Comprehensive Environmental Response, Compensation, and Liability Act (“CERCLA”) and similar state laws, a current or former owner or operator of real property in the U.S. may be liable for remediation costs regardless of whether the release or disposal of hazardous substances was in compliance with law at the time it occurred, and a current owner or operator may be liable regardless of whether it owned or operated the facility at the time of the release. Outside the U.S., analogous contaminated property laws, such as those in effect in France and Australia, can hold past owners and/or operators liable for remediation at former facilities. Currently, there are approximately six former facilities or third‑party sites in the U.S. for which we have been notified of potential claims against us for cleanup liabilities, including, but not limited to, sites listed under CERCLA. Based on current information and past experiences at other CERCLA sites, we do not expect these third‑party claims to have a material impact on our consolidated financial statements.
Under the Resource Conservation and Recovery Act (“RCRA”) in the U.S. and similar state laws, we may be required to remediate contamination originating from our properties as a condition to our hazardous waste permit. Some of our manufacturing sites have an extended history of industrial chemical manufacturing and use, including on-site waste disposal. We are aware of soil, groundwater or surface contamination from past operations at some of our sites, and we may find contamination at other sites in the future. For example, our Port Neches, Texas, and Geismar, Louisiana, facilities are the subject of ongoing remediation requirements imposed under RCRA. Similar laws exist in a number of locations in which we currently operate, or previously operated, manufacturing facilities, such as Australia, India, France, Hungary and Italy.
West Footscray Remediation
By letter dated March 7, 2006, our former Base Chemicals and Polymers facility in West Footscray, Australia was issued a cleanup notice by the Environmental Protection Authority Victoria (“EPA Victoria”) due to concerns about soil and groundwater contamination emanating from the site. On August 23, 2010, EPA Victoria revoked a second cleanup notice and issued a revised notice that included a requirement for financial assurance for the remediation. As of December 31, 2017, we had an accrued liability of approximately $14 million related to estimated environmental remediation costs at this site. We can provide no assurance that the authority will not seek to institute additional requirements for the site or that additional costs will not be required for the cleanup.
North Maybe Mine Remediation
The North Maybe Canyon Mine site is a CERCLA site and involves a former phosphorous mine near Soda Springs, Idaho, which is believed to have been operated by several companies, including a predecessor company to us. In 2004, the U.S. Forest Service notified us that we are a CERCLA potentially responsible party (“PRP”) for contamination originating from the site. In February 2010, we and Wells Cargo (another PRP) agreed to conduct a Remedial Investigation/Feasibility Study of a portion of the site and are currently engaged in that process. At this time, we are unable to reasonably estimate our potential liabilities at this site.
20. HUNTSMAN CORPORATION STOCKHOLDERS’ EQUITY
Share Repurchase Program
On September 29, 2015, our Board of Directors authorized our Company to repurchase up to $150 million in shares of our common stock. Repurchases under this program may be made through open market transactions, in privately negotiated transactions, accelerated share repurchase programs or by other means. The timing and actual number of any shares repurchased depends on a variety of factors, including market conditions. The share repurchase authorization does not have an expiration date and repurchases may be commenced, suspended or discontinued from time to time without prior notice. On October 27, 2015, we entered into and funded an accelerated share repurchase agreement with Citibank, N.A. to repurchase $100 million of our common stock. Citibank, N.A. made an initial delivery of approximately 7.1 million shares of Huntsman Corporation common stock based on the closing price of $11.94 on October 27, 2015. The accelerated share repurchase agreement was completed in January 2016 with the delivery of an
Table of Contents
HUNTSMAN CORPORATION AND SUBSIDIARIES
HUNTSMAN INTERNATIONAL LLC AND SUBSIDIARIES
NOTES TO CONSOLIDATED FINANCIAL STATEMENTS (Continued)
additional approximately 1.5 million shares of Huntsman Corporation common stock. The final number of shares repurchased and the aggregate cost per share was based on the Company’s daily volume-weighted average stock price during the term of the transaction, less a discount. As of December 31, 2017, we had $50 million remaining under this authorization to be used to purchase additional shares. On February 7, 2018, our Board of Directors authorized our Company to repurchase up to an additional $400 million in shares of our common stock. Repurchases may be made through the open market or in privately negotiated transactions, and repurchases may be commenced or suspended from time to time without prior notice. Shares of common stock acquired through the repurchase program are held in treasury at cost.
Dividends on Common Stock
The following tables represent dividends on common stock for our Company for the years ended December 31, 2017 and 2016 (dollars in millions, except per share payment amounts):
|
|
|
|
|
|
|
|
|
|
|
2017
|
|
|
|
|
|
|
Approximate
|
|
|
|
Per share
|
|
amount
|
|
Quarter ended
|
|
payment amount
|
|
paid
|
|
March 31, 2017
|
|
$
|
0.125
|
|
$
|
30
|
|
June 30, 2017
|
|
|
0.125
|
|
|
30
|
|
September 30, 2017
|
|
|
0.125
|
|
|
30
|
|
December 31, 2017
|
|
|
0.125
|
|
|
30
|
|
|
|
|
|
|
|
|
|
|
|
2016
|
|
|
|
|
|
|
Approximate
|
|
|
|
Per share
|
|
amount
|
|
Quarter ended
|
|
payment amount
|
|
paid
|
|
March 31, 2016
|
|
$
|
0.125
|
|
$
|
30
|
|
June 30, 2016
|
|
|
0.125
|
|
|
30
|
|
September 30, 2016
|
|
|
0.125
|
|
|
30
|
|
December 31, 2016
|
|
|
0.125
|
|
|
30
|
On February 7, 2018, the Board of Directors approved an increase to the quarterly cash dividend to $0.6125 per share of common stock beginning with the March 30, 2018 quarterly dividend.
21. STOCK‑BASED COMPENSATION PLAN
Under the 2016 Stock Incentive Plan, we may grant nonqualified stock options, incentive stock options, stock appreciation rights, restricted stock, phantom stock, performance share units and other stock-based awards to our employees, directors and consultants and to employees and consultants of our subsidiaries, provided that incentive stock options may be granted solely to employees. The terms of the grants under both the 2016 Stock Incentive Plan and the Prior Plan are fixed at the grant date. As of December 31, 2017, we were authorized to grant up to 8.2 million shares under the 2016 Stock Incentive Plan. As of December 31, 2017, we had approximately 8 million shares remaining under the 2016 Stock Incentive Plan available for grant. Option awards have a maximum contractual term of 10 years and generally must have an exercise price at least equal to the market price of our common stock on the date the option award is granted. Outstanding stock-based awards generally vest over a three‑year period; certain performance share unit awards vest over a two-year period.
The compensation cost from continuing operations under the 2016 Stock Incentive Plan and the Prior Plan for our Company and Huntsman International were as follows (dollars in millions):
|
|
|
|
|
|
|
|
|
|
|
|
|
|
Year ended December 31,
|
|
|
|
2017
|
|
2016
|
|
|
2015
|
|
Huntsman Corporation compensation cost
|
|
$
|
36
|
|
$
|
32
|
|
$
|
29
|
|
Huntsman International compensation cost
|
|
|
35
|
|
|
31
|
|
|
28
|
Table of Contents
HUNTSMAN CORPORATION AND SUBSIDIARIES
HUNTSMAN INTERNATIONAL LLC AND SUBSIDIARIES
NOTES TO CONSOLIDATED FINANCIAL STATEMENTS (Continued)
The total income tax benefit recognized in the statement of operations for stock-based compensation arrangements was $18 million, $7 million and $6 million for the years ended December 31, 2017, 2016 and 2015, respectively.
Stock Options
The fair value of each stock option award is estimated on the date of grant using the Black-Scholes valuation model that uses the assumptions noted in the following table. Expected volatilities are based on the historical volatility of our common stock through the grant date. The expected term of options granted was estimated based on the contractual term of the instruments and employees’ expected exercise and post‑vesting employment termination behavior. The risk‑free rate for periods within the contractual life of the option was based on the U.S. Treasury yield curve in effect at the time of grant. The assumptions noted below represent the weighted averages of the assumptions utilized for all stock options granted during the year.
|
|
|
|
|
|
|
|
|
|
|
|
|
|
|
|
Year ended December 31,
|
|
|
|
|
2017
|
|
2016
|
|
2015
|
|
Dividend yield
|
|
|
2.4
|
%
|
|
5.6
|
%
|
|
2.3
|
%
|
|
Expected volatility
|
|
|
56.9
|
%
|
|
57.9
|
%
|
|
57.6
|
%
|
|
Risk-free interest rate
|
|
|
2.0
|
%
|
|
1.4
|
%
|
|
1.4
|
%
|
|
Expected life of stock options granted during the period
|
|
|
5.9
|
years
|
|
5.9
|
years
|
|
5.9
|
years
|
A summary of stock option activity under the 2016 Stock Incentive Plan and the Prior Plan as of December 31, 2017 and changes during the year then ended is presented below:
|
|
|
|
|
|
|
|
|
|
|
|
|
|
|
|
|
|
|
|
|
|
|
Weighted
|
|
|
|
|
|
|
|
|
|
Weighted
|
|
Average
|
|
|
|
|
|
|
|
|
|
Average
|
|
Remaining
|
|
Aggregate
|
|
|
|
|
|
|
Exercise
|
|
Contractual
|
|
Intrinsic
|
|
Option Awards
|
|
Shares
|
|
Price
|
|
Term
|
|
Value
|
|
|
|
(in thousands)
|
|
|
|
|
(years)
|
|
(in millions)
|
|
Outstanding at January 1, 2017
|
|
|
11,245
|
|
$
|
13.37
|
|
|
|
|
|
|
|
Granted
|
|
|
997
|
|
|
21.04
|
|
|
|
|
|
|
|
Exercised
|
|
|
(3,772)
|
|
|
13.90
|
|
|
|
|
|
|
|
Forfeited
|
|
|
(65)
|
|
|
17.67
|
|
|
|
|
|
|
|
Converted to Venator awards
|
|
|
(417)
|
|
|
5.00
|
|
|
|
|
|
|
|
Outstanding at December 31, 2017
|
|
|
7,988
|
|
|
13.99
|
|
|
6.0
|
|
$
|
154
|
|
Exercisable at December 31, 2017
|
|
|
5,403
|
|
|
14.05
|
|
|
4.9
|
|
|
104
|
The weighted‑average grant‑date fair value of stock options granted during 2017, 2016 and 2015 was $9.26, $3.15 and $9.81 per option, respectively. As of December 31, 2017, there was $8 million of total unrecognized compensation cost related to nonvested stock option arrangements granted under the 2016 Stock Incentive Plan and the Prior Plan. That cost is expected to be recognized over a weighted-average period of approximately 1.7 years.
During the years ended December 31, 2017, 2016 and 2015, the total intrinsic value of stock options exercised was approximately $48 million, $1 million and nil, respectively. Cash received from stock options exercised during the years ended December 31, 2017, 2016 and 2015 was approximately $35 million, $1 million and $1 million, respectively. The cash tax benefit from stock options exercised during the years ended December 31, 2017, 2016 and 2015 was approximately $15 million, nil and nil, respectively.
Nonvested Shares
Nonvested shares granted under the 2016 Stock Incentive Plan and the Prior Plan consist of restricted stock and performance share unit awards, which are accounted for as equity awards, and phantom stock, which is accounted for as a liability award because it can be settled in either stock or cash.
Table of Contents
HUNTSMAN CORPORATION AND SUBSIDIARIES
HUNTSMAN INTERNATIONAL LLC AND SUBSIDIARIES
NOTES TO CONSOLIDATED FINANCIAL STATEMENTS (Continued)
The fair value of each performance share unit award is estimated using a Monte Carlo simulation model that uses various assumptions, including an expected volatility rate and a risk-free interest rate. For the years ended December 31, 2017, 2016 and 2015, the weighted-average expected volatility rate was 45.0%, 39.3% and 30.0%, respectively, and the weighted average risk-free interest rate was 1.5%, 0.9% and 0.7%, respectively. For the performance share unit awards granted during the years ended December 31, 2017, 2016 and 2015, the number of shares earned varies based upon the Company achieving certain performance criteria over two-year and three-year performance periods. The performance criteria are total stockholder return of our common stock relative to the total stockholder return of a specified industry peer group for the two-year and three-year performance periods.
A summary of the status of our nonvested shares as of December 31, 2017 and changes during the year then ended is presented below:
|
|
|
|
|
|
|
|
|
|
|
|
|
|
|
|
|
Equity Awards
|
|
Liability Awards
|
|
|
|
|
|
|
Weighted
|
|
|
|
|
Weighted
|
|
|
|
|
|
|
Average
|
|
|
|
|
Average
|
|
|
|
|
|
|
Grant- Date
|
|
|
|
|
Grant-Date
|
|
|
|
Shares
|
|
Fair Value
|
|
Shares
|
|
Fair Value
|
|
|
|
(in thousands)
|
|
|
|
|
(in thousands)
|
|
|
|
|
Nonvested at January 1, 2017
|
|
|
2,996
|
|
$
|
13.36
|
|
|
912
|
|
$
|
12.27
|
|
Granted
|
|
|
779
|
|
|
22.60
|
|
|
285
|
|
|
21.01
|
|
Vested
|
|
|
(1,052)
|
(1)
|
|
16.11
|
|
|
(372)
|
|
|
14.11
|
|
Forfeited
|
|
|
(29)
|
|
|
15.61
|
|
|
(36)
|
|
|
12.22
|
|
Converted to Venator awards
|
|
|
(237)
|
|
|
11.81
|
|
|
(93)
|
|
|
13.72
|
|
Nonvested at December 31, 2017
|
|
|
2,457
|
|
|
14.93
|
|
|
696
|
|
|
14.69
|
|
(1)
| |
As of December 31, 2017, a total of 460,750 restricted stock units were vested but not yet issued, of which 25,704 vested during 2017. These shares have not been reflected as vested shares in this table because, in accordance with the restricted stock unit agreements, shares of common stock are not issued for vested restricted stock units until termination of employment. |
As of December 31, 2017, there was $28 million of total unrecognized compensation cost related to nonvested share compensation arrangements granted under the Stock Incentive Plan and the Prior Plan. That cost is expected to be recognized over a weighted-average period of approximately 1.7 years. The value of share awards that vested during the years ended December 31, 2017, 2016 and 2015 was $22 million, $16 million and $20 million, respectively.
Table of Contents
HUNTSMAN CORPORATION AND SUBSIDIARIES
HUNTSMAN INTERNATIONAL LLC AND SUBSIDIARIES
NOTES TO CONSOLIDATED FINANCIAL STATEMENTS (Continued)
22. OTHER COMPREHENSIVE INCOME (LOSS)
Other comprehensive loss consisted of the following (dollars in millions):
Huntsman Corporation
|
|
|
|
|
|
|
|
|
|
|
|
|
|
|
|
|
|
|
|
|
|
|
|
|
|
|
|
Pension and
|
|
Other
|
|
|
|
|
|
|
|
|
|
|
|
Foreign
|
|
other
|
|
comprehensive
|
|
|
|
|
|
|
|
Amounts
|
|
Amounts
|
|
|
|
currency
|
|
postretirement
|
|
income of
|
|
|
|
|
|
|
|
attributable to
|
|
attributable to
|
|
|
|
translation
|
|
benefits
|
|
unconsolidated
|
|
|
|
|
|
|
|
noncontrolling
|
|
Huntsman
|
|
|
|
adjustment(a)
|
|
adjustments(b)
|
|
affiliates
|
|
Other, net
|
|
Total
|
|
interests
|
|
Corporation
|
|
Beginning balance, January 1, 2017
|
|
$
|
(459)
|
|
$
|
(1,275)
|
|
$
|
4
|
|
$
|
23
|
|
$
|
(1,707)
|
|
$
|
36
|
|
$
|
(1,671)
|
|
Other comprehensive income before reclassifications, gross
|
|
|
175
|
|
|
11
|
|
|
(1)
|
|
|
9
|
|
|
194
|
|
|
(22)
|
|
|
172
|
|
Tax benefit
|
|
|
35
|
|
|
9
|
|
|
—
|
|
|
2
|
|
|
46
|
|
|
—
|
|
|
46
|
|
Amounts reclassified from accumulated other comprehensive loss, gross(c)
|
|
|
—
|
|
|
80
|
|
|
—
|
|
|
(10)
|
|
|
70
|
|
|
—
|
|
|
70
|
|
Tax expense
|
|
|
—
|
|
|
(14)
|
|
|
—
|
|
|
—
|
|
|
(14)
|
|
|
—
|
|
|
(14)
|
|
Net current-period other comprehensive income (loss)
|
|
|
210
|
|
|
86
|
|
|
(1)
|
|
|
1
|
|
|
296
|
|
|
(22)
|
|
|
274
|
|
Disposition of a portion of P&A Business
|
|
|
—
|
|
|
—
|
|
|
—
|
|
|
—
|
|
|
—
|
|
|
129
|
|
|
129
|
|
Ending balance, December 31, 2017
|
|
$
|
(249)
|
|
$
|
(1,189)
|
|
$
|
3
|
|
$
|
24
|
|
$
|
(1,411)
|
|
$
|
143
|
|
$
|
(1,268)
|
|
(a)
| |
Amounts are net of tax of $65 and $100 as of December 31, 2017 and January 1, 2017, respectively. |
|
(b)
| |
Amounts are net of tax of $172 and $177 as of December 31, 2017 and January 1, 2017, respectively. |
|
(c)
| |
See table below for details about these reclassifications. |
|
|
|
|
|
|
|
|
|
|
|
|
|
|
|
|
|
|
|
|
|
|
|
|
|
|
|
|
Pension and
|
|
Other
|
|
|
|
|
|
|
|
|
|
|
|
|
|
|
|
Foreign
|
|
other
|
|
comprehensive
|
|
|
|
|
|
Amounts
|
|
Amounts
|
|
|
|
currency
|
|
postretirement
|
|
income of
|
|
|
|
|
|
attributable to
|
|
attributable to
|
|
|
|
translation
|
|
benefits
|
|
unconsolidated
|
|
|
|
|
|
noncontrolling
|
|
Huntsman
|
|
|
|
adjustment(a)
|
|
adjustments(b)
|
|
affiliates
|
|
Other, net
|
|
Total
|
|
interests
|
|
Corporation
|
|
Beginning balance, January 1, 2016
|
|
$
|
(288)
|
|
$
|
(1,056)
|
|
$
|
11
|
|
$
|
17
|
|
$
|
(1,316)
|
|
$
|
28
|
|
$
|
(1,288)
|
|
Other comprehensive (loss) income before reclassifications, gross
|
|
|
(162)
|
|
|
(315)
|
|
|
(7)
|
|
|
5
|
|
|
(479)
|
|
|
8
|
|
|
(471)
|
|
Tax benefit
|
|
|
(10)
|
|
|
58
|
|
|
—
|
|
|
1
|
|
|
49
|
|
|
—
|
|
|
49
|
|
Amounts reclassified from accumulated other comprehensive loss, gross(c)
|
|
|
1
|
|
|
53
|
|
|
—
|
|
|
—
|
|
|
54
|
|
|
—
|
|
|
54
|
|
Tax expense
|
|
|
—
|
|
|
(15)
|
|
|
—
|
|
|
—
|
|
|
(15)
|
|
|
—
|
|
|
(15)
|
|
Net current-period other comprehensive (loss) income
|
|
|
(171)
|
|
|
(219)
|
|
|
(7)
|
|
|
6
|
|
|
(391)
|
|
|
8
|
|
|
(383)
|
|
Ending balance, December 31, 2016
|
|
$
|
(459)
|
|
$
|
(1,275)
|
|
$
|
4
|
|
$
|
23
|
|
$
|
(1,707)
|
|
$
|
36
|
|
$
|
(1,671)
|
|
(a)
| |
Amounts are net of tax of $100 and $90 as of December 31, 2016 and January 1, 2016, respectively. |
|
(b)
| |
Amounts are net of tax of $177 and $135 as of December 31, 2016 and January 1, 2016, respectively. |
|
(c)
| |
See table below for details about these reclassifications. |
|
|
|
|
|
|
|
|
|
|
|
|
|
|
|
|
Year ended December 31,
|
|
|
|
|
|
2017
|
|
2016
|
|
2015
|
|
|
|
|
|
Amount reclassified
|
|
Amount reclassified
|
|
Amount reclassified
|
|
Affected line item in
|
|
|
|
from accumulated
|
|
from accumulated
|
|
from accumulated
|
|
the statement
|
|
Details about Accumulated Other
|
|
other
|
|
other
|
|
other
|
|
where net income
|
|
Comprehensive Loss Components(a):
|
|
comprehensive loss
|
|
comprehensive loss
|
|
comprehensive loss
|
|
is presented
|
|
Amortization of pension and other postretirement benefits:
|
|
|
|
|
|
|
|
|
|
|
|
|
Prior service credit
|
|
$
|
15
|
|
$
|
16
|
|
$
|
10
|
|
(b)
|
|
Actuarial loss
|
|
|
(95)
|
|
|
(69)
|
|
|
(79)
|
|
(b)(c)
|
|
|
|
|
(80)
|
|
|
(53)
|
|
|
(69)
|
|
Total before tax
|
|
|
|
|
14
|
|
|
15
|
|
|
14
|
|
Income tax expense
|
|
Total reclassifications for the period
|
|
$
|
(66)
|
|
$
|
(38)
|
|
$
|
(55)
|
|
Net of tax
|
(a)Pension and other postretirement benefits amounts in parentheses indicate credits on our consolidated statements of operations.
(b)These accumulated other comprehensive loss components are included in the computation of net periodic pension costs. See “Note 16. Employee Benefit Plans.”
Table of Contents
HUNTSMAN CORPORATION AND SUBSIDIARIES
HUNTSMAN INTERNATIONAL LLC AND SUBSIDIARIES
NOTES TO CONSOLIDATED FINANCIAL STATEMENTS (Continued)
(c)Amounts contain approximately $19 million, $14 million and $15 million of prior service credit and actuarial loss related to discontinued operations for the years ended December 31, 2017, 2016 and 2015, respectively.
Huntsman International
|
|
|
|
|
|
|
|
|
|
|
|
|
|
|
|
|
|
|
|
|
|
|
|
|
|
Foreign
currency
translation
adjustment(a)
|
|
Pension
and other
postretirement
benefits
adjustments(b)
|
|
Other
comprehensive
income of
unconsolidated
affiliates
|
|
Other, net
|
|
Total
|
|
Amounts
attributable to
noncontrolling
interests
|
|
Amounts
attributable to
Huntsman
International
|
|
Beginning balance, January 1, 2017
|
|
$
|
(462)
|
|
$
|
(1,286)
|
|
$
|
4
|
|
$
|
17
|
|
$
|
(1,727)
|
|
$
|
36
|
|
$
|
(1,691)
|
|
Other comprehensive income before reclassifications, gross
|
|
|
175
|
|
|
12
|
|
|
(1)
|
|
|
8
|
|
|
194
|
|
|
(22)
|
|
|
172
|
|
Tax benefit
|
|
|
35
|
|
|
9
|
|
|
—
|
|
|
2
|
|
|
46
|
|
|
—
|
|
|
46
|
|
Amounts reclassified from accumulated other comprehensive loss, gross(c)
|
|
|
—
|
|
|
86
|
|
|
—
|
|
|
(10)
|
|
|
76
|
|
|
—
|
|
|
76
|
|
Contribution of other comprehensive income from Parent
|
|
|
—
|
|
|
20
|
|
|
—
|
|
|
—
|
|
|
20
|
|
|
—
|
|
|
20
|
|
Tax expense
|
|
|
—
|
|
|
(15)
|
|
|
—
|
|
|
—
|
|
|
(15)
|
|
|
—
|
|
|
(15)
|
|
Net current-period other comprehensive income (loss)
|
|
|
210
|
|
|
112
|
|
|
(1)
|
|
|
—
|
|
|
321
|
|
|
(22)
|
|
|
299
|
|
Disposition of a portion of P&A Business
|
|
|
—
|
|
|
—
|
|
|
—
|
|
|
—
|
|
|
—
|
|
|
129
|
|
|
129
|
|
Ending balance, December 31, 2017
|
|
$
|
(252)
|
|
$
|
(1,174)
|
|
$
|
3
|
|
$
|
17
|
|
$
|
(1,406)
|
|
$
|
143
|
|
$
|
(1,263)
|
|
(a)
| |
Amounts are net of tax of $51 and $86 as of December 31, 2017 and January 1, 2017, respectively. |
|
(b)
| |
Amounts are net of tax of $199 and $205 as of December 31, 2017 and January 1, 2017, respectively. |
|
(c)
| |
See table below for details about these reclassifications. |
|
|
|
|
|
|
|
|
|
|
|
|
|
|
|
|
|
|
|
|
|
|
|
|
|
|
Foreign
currency
translation
adjustment(a)
|
|
Pension
and other
postretirement
benefits
adjustments(b)
|
|
Other
comprehensive
income of
unconsolidated
affiliates
|
|
Other, net
|
|
Total
|
|
Amounts
attributable to
noncontrolling
interests
|
|
Amounts
attributable to
Huntsman
International
|
|
Beginning balance, January 1, 2016
|
|
$
|
(292)
|
|
$
|
(1,074)
|
|
$
|
11
|
|
$
|
11
|
|
$
|
(1,344)
|
|
$
|
28
|
|
$
|
(1,316)
|
|
Other comprehensive (loss) income before reclassifications, gross
|
|
|
(161)
|
|
|
(315)
|
|
|
(7)
|
|
|
5
|
|
|
(478)
|
|
|
8
|
|
|
(470)
|
|
Tax benefit
|
|
|
(10)
|
|
|
58
|
|
|
—
|
|
|
1
|
|
|
49
|
|
|
—
|
|
|
49
|
|
Amounts reclassified from accumulated other comprehensive loss, gross(c)
|
|
|
1
|
|
|
61
|
|
|
—
|
|
|
—
|
|
|
62
|
|
|
—
|
|
|
62
|
|
Tax expense
|
|
|
—
|
|
|
(16)
|
|
|
—
|
|
|
—
|
|
|
(16)
|
|
|
—
|
|
|
(16)
|
|
Net current-period other comprehensive income (loss)
|
|
|
(170)
|
|
|
(212)
|
|
|
(7)
|
|
|
6
|
|
|
(383)
|
|
|
8
|
|
|
(375)
|
|
Ending balance, December 31, 2016
|
|
$
|
(462)
|
|
$
|
(1,286)
|
|
$
|
4
|
|
$
|
17
|
|
$
|
(1,727)
|
|
$
|
36
|
|
$
|
(1,691)
|
|
(a)
| |
Amounts are net of tax of $86 and $76 as of December 31, 2016 and January 1, 2016, respectively. |
|
(b)
| |
Amounts are net of tax of $205 and $163 as of December 31, 2016 and January 1, 2016, respectively. |
|
(c)
| |
See table below for details about these reclassifications. |
|
|
|
|
|
|
|
|
|
|
|
|
|
|
|
|
Year ended December 31,
|
|
|
|
|
|
2017
|
|
2016
|
|
2015
|
|
|
|
|
|
Amount
|
|
Amount
|
|
Amount
|
|
|
|
|
|
reclassified
|
|
reclassified
|
|
reclassified
|
|
Affected
|
|
|
|
from
|
|
from
|
|
from
|
|
line item in
|
|
|
|
accumulated
|
|
accumulated
|
|
accumulated
|
|
the statement
|
|
|
|
other
|
|
other
|
|
other
|
|
where
|
|
Details about Accumulated Other
|
|
comprehensive
|
|
comprehensive
|
|
comprehensive
|
|
net income is
|
|
Comprehensive Loss Components(a):
|
|
loss
|
|
loss
|
|
loss
|
|
presented
|
|
Amortization of pension and other postretirement benefits:
|
|
|
|
|
|
|
|
|
|
|
|
|
Prior service credit
|
|
$
|
15
|
|
$
|
16
|
|
$
|
10
|
|
(b)
|
|
Actuarial loss
|
|
|
(101)
|
|
|
(77)
|
|
|
(87)
|
|
(b)(c)
|
|
|
|
|
(86)
|
|
|
(61)
|
|
|
(77)
|
|
Total before tax
|
|
|
|
|
15
|
|
|
16
|
|
|
15
|
|
Income tax expense
|
|
Total reclassifications for the period
|
|
$
|
(71)
|
|
$
|
(45)
|
|
$
|
(62)
|
|
Net of tax
|
|
(a)
| |
Pension and other postretirement benefits amounts in parentheses indicate credits on our consolidated statements of operations. |
Table of Contents
HUNTSMAN CORPORATION AND SUBSIDIARIES
HUNTSMAN INTERNATIONAL LLC AND SUBSIDIARIES
NOTES TO CONSOLIDATED FINANCIAL STATEMENTS (Continued)
|
(b)
| |
These accumulated other comprehensive loss components are included in the computation of net periodic pension costs. See “Note 16. Employee Benefit Plans.” |
|
(c)
| |
Amounts contain approximately $24 million and $18 million and $20 million of prior service credit and actuarial loss related to discontinued operations for the years ended December 31, 2017, 2016 and 2015, respectively. |
Items of other comprehensive income (loss) of our Company and our consolidated affiliates have been recorded net of tax, with the exception of the foreign currency translation adjustments related to subsidiaries with earnings permanently reinvested. The tax effect is determined based upon the jurisdiction where the income or loss was recognized and is net of valuation allowances.
23. RELATED PARTY TRANSACTIONS
Our consolidated financial statements include the following transactions with our affiliates not otherwise disclosed (dollars in millions):
|
|
|
|
|
|
|
|
|
|
|
|
|
|
Year ended December 31,
|
|
|
|
2017
|
|
2016
|
|
2015
|
|
Sales to:
|
|
|
|
|
|
|
|
|
|
|
Unconsolidated affiliates
|
|
$
|
150
|
|
$
|
131
|
|
$
|
131
|
|
Inventory purchases from:
|
|
|
|
|
|
|
|
|
|
|
Unconsolidated affiliates
|
|
|
280
|
|
|
243
|
|
|
325
|
24. OPERATING SEGMENT INFORMATION
We derive our revenues, earnings and cash flows from the manufacture and sale of a wide variety of differentiated and commodity chemical products. We have four operating segments, which are also our reportable segments: Polyurethanes, Performance Products, Advanced Materials and Textile Effects. We have organized our business and derived our operating segments around differences in product lines. In connection with the Venator IPO in August 2017, we separated the P&A Business and, beginning in the third quarter of 2017, we reported the results of operations of the P&A Business as discontinued operations in our consolidated financial statements for all periods presented. See “Note 3. Discontinued Operations and Business Dispositions—Separation of P&A Business.”
The major products of each reportable operating segment are as follows:
|
|
|
|
|
Segment
|
|
Products
|
|
Polyurethanes
|
|
MDI, PO, polyols, PG, TPU, aniline and MTBE
|
|
Performance Products
|
|
Amines, surfactants, LAB, maleic anhydride, other performance chemicals, EG, olefins and technology licenses
|
|
Advanced Materials
|
|
Technologically advanced epoxy, acrylic and polyurethane-based polymers formulations; high performance thermoset resins and curing agents; base liquid and solid resins
|
|
Textile Effects
|
|
Textile chemicals, dyes and digital inks
|
Sales between segments are generally recognized at external market prices and are eliminated in consolidation. We use adjusted EBITDA to measure the financial performance of our global business units and for reporting the results of our operating segments. This measure includes all operating items relating to the businesses. The adjusted EBITDA of
Table of Contents
HUNTSMAN CORPORATION AND SUBSIDIARIES
HUNTSMAN INTERNATIONAL LLC AND SUBSIDIARIES
NOTES TO CONSOLIDATED FINANCIAL STATEMENTS (Continued)
operating segments excludes items that principally apply to our Company as a whole. The revenues and adjusted EBITDA for each of our reportable operating segments are as follows (dollars in millions):
|
|
|
|
|
|
|
|
|
|
|
|
|
|
Year ended December 31,
|
|
|
|
2017
|
|
2016
|
|
2015
|
|
Revenues:
|
|
|
|
|
|
|
|
|
|
|
Polyurethanes
|
|
$
|
4,399
|
|
$
|
3,667
|
|
$
|
3,811
|
|
Performance Products
|
|
|
2,109
|
|
|
2,126
|
|
|
2,501
|
|
Advanced Materials
|
|
|
1,040
|
|
|
1,020
|
|
|
1,103
|
|
Textile Effects
|
|
|
776
|
|
|
751
|
|
|
804
|
|
Corporate and eliminations
|
|
|
34
|
|
|
(46)
|
|
|
(80)
|
|
Total
|
|
$
|
8,358
|
|
$
|
7,518
|
|
$
|
8,139
|
|
|
|
|
|
|
|
|
|
|
|
|
Huntsman Corporation:
|
|
|
|
|
|
|
|
|
|
|
Segment adjusted EBITDA(1):
|
|
|
|
|
|
|
|
|
|
|
Polyurethanes
|
|
$
|
850
|
|
$
|
569
|
|
$
|
573
|
|
Performance Products
|
|
|
296
|
|
|
316
|
|
|
460
|
|
Advanced Materials
|
|
|
219
|
|
|
223
|
|
|
220
|
|
Textile Effects
|
|
|
83
|
|
|
73
|
|
|
63
|
|
Corporate and other(2)
|
|
|
(189)
|
|
|
(184)
|
|
|
(156)
|
|
Total
|
|
|
1,259
|
|
|
997
|
|
|
1,160
|
|
Reconciliation of adjusted EBITDA to net income:
|
|
|
|
|
|
|
|
|
|
|
Interest expense—continuing operations
|
|
|
(165)
|
|
|
(203)
|
|
|
(205)
|
|
Interest (expense) income—discontinued operations
|
|
|
(19)
|
|
|
1
|
|
|
—
|
|
Income tax expense—continuing operations
|
|
|
(64)
|
|
|
(109)
|
|
|
(60)
|
|
Income tax (expense) benefit—discontinued operations
|
|
|
(67)
|
|
|
24
|
|
|
16
|
|
Depreciation and amortization—continuing operations
|
|
|
(319)
|
|
|
(318)
|
|
|
(298)
|
|
Depreciation and amortization—discontinued operations
|
|
|
(68)
|
|
|
(114)
|
|
|
(101)
|
|
Net income attributable to noncontrolling interests
|
|
|
105
|
|
|
31
|
|
|
33
|
|
Other adjustments:
|
|
|
|
|
|
|
|
|
|
|
Business acquisition and integration expenses
|
|
|
(19)
|
|
|
(12)
|
|
|
(9)
|
|
Merger costs
|
|
|
(28)
|
|
|
—
|
|
|
—
|
|
EBITDA from discontinued operations
|
|
|
312
|
|
|
81
|
|
|
(217)
|
|
Minority interest of discontinued operations
|
|
|
(49)
|
|
|
(11)
|
|
|
(7)
|
|
Loss on early extinguishment of debt
|
|
|
(54)
|
|
|
(3)
|
|
|
(31)
|
|
Certain legal settlements and related income (expenses)
|
|
|
11
|
|
|
(1)
|
|
|
(1)
|
|
Gain (loss) on sale of assets
|
|
|
9
|
|
|
97
|
|
|
(1)
|
|
Amortization of pension and postretirement actuarial losses
|
|
|
(73)
|
|
|
(55)
|
|
|
(66)
|
|
Plant incident remediation costs
|
|
|
(16)
|
|
|
—
|
|
|
—
|
|
U.S. Tax Reform Act impact on minority interest
|
|
|
6
|
|
|
—
|
|
|
—
|
|
Restructuring, impairment and plant closing and transition costs
|
|
|
(20)
|
|
|
(48)
|
|
|
(87)
|
|
Net income
|
|
$
|
741
|
|
$
|
357
|
|
$
|
126
|
|
|
|
|
|
|
|
|
|
|
|
|
|
|
Year ended December 31,
|
|
|
|
2017
|
|
2016
|
|
2015
|
|
Depreciation and Amortization:
|
|
|
|
|
|
|
|
|
|
|
Polyurethanes
|
|
$
|
116
|
|
$
|
114
|
|
$
|
100
|
|
Performance Products
|
|
|
137
|
|
|
132
|
|
|
119
|
|
Advanced Materials
|
|
|
33
|
|
|
35
|
|
|
38
|
|
Textile Effects
|
|
|
14
|
|
|
15
|
|
|
17
|
|
Corporate and other
|
|
|
19
|
|
|
22
|
|
|
24
|
|
Total
|
|
$
|
319
|
|
$
|
318
|
|
$
|
298
|
Table of Contents
HUNTSMAN CORPORATION AND SUBSIDIARIES
HUNTSMAN INTERNATIONAL LLC AND SUBSIDIARIES
NOTES TO CONSOLIDATED FINANCIAL STATEMENTS (Continued)
|
|
|
|
|
|
|
|
|
|
|
|
|
|
Year ended December 31,
|
|
|
|
2017
|
|
2016
|
|
2015
|
|
Capital Expenditures:
|
|
|
|
|
|
|
|
|
|
|
Polyurethanes
|
|
$
|
162
|
|
$
|
143
|
|
$
|
181
|
|
Performance Products
|
|
|
79
|
|
|
131
|
|
|
205
|
|
Advanced Materials
|
|
|
21
|
|
|
16
|
|
|
25
|
|
Textile Effects
|
|
|
16
|
|
|
19
|
|
|
24
|
|
Corporate and other
|
|
|
4
|
|
|
9
|
|
|
26
|
|
Total
|
|
$
|
282
|
|
$
|
318
|
|
$
|
461
|
|
|
|
|
|
|
|
|
|
|
|
|
|
|
December 31,
|
|
|
|
2017
|
|
2016
|
|
2015
|
|
Total Assets:
|
|
|
|
|
|
|
|
|
|
|
Polyurethanes
|
|
$
|
3,112
|
|
$
|
2,677
|
|
$
|
2,779
|
|
Performance Products
|
|
|
2,069
|
|
|
2,046
|
|
|
2,264
|
|
Advanced Materials
|
|
|
796
|
|
|
728
|
|
|
822
|
|
Textile Effects
|
|
|
564
|
|
|
523
|
|
|
562
|
|
Corporate and other
|
|
|
823
|
|
|
975
|
|
|
904
|
|
Total
|
|
$
|
7,364
|
|
$
|
6,949
|
|
$
|
7,331
|
|
|
|
|
|
|
|
|
|
|
|
|
|
|
Year ended December 31,
|
|
|
|
2017
|
|
2016
|
|
2015
|
|
Huntsman International:
|
|
|
|
|
|
|
|
|
|
|
Segment adjusted EBITDA(1):
|
|
|
|
|
|
|
|
|
|
|
Polyurethanes
|
|
$
|
850
|
|
$
|
569
|
|
$
|
573
|
|
Performance Products
|
|
|
296
|
|
|
316
|
|
|
460
|
|
Advanced Materials
|
|
|
219
|
|
|
223
|
|
|
220
|
|
Textile Effects
|
|
|
83
|
|
|
73
|
|
|
63
|
|
Corporate and other(2)
|
|
|
(185)
|
|
|
(180)
|
|
|
(151)
|
|
Total
|
|
|
1,263
|
|
|
1,001
|
|
|
1,165
|
|
Reconciliation of adjusted EBITDA to net income:
|
|
|
|
|
|
|
|
|
|
|
Interest expense—continuing operations
|
|
|
(181)
|
|
|
(215)
|
|
|
(214)
|
|
Interest (expense) income—discontinued operations
|
|
|
(19)
|
|
|
1
|
|
|
—
|
|
Income tax expense—continuing operations
|
|
|
(61)
|
|
|
(108)
|
|
|
(59)
|
|
Income tax (expense) benefit—discontinued operations
|
|
|
(67)
|
|
|
24
|
|
|
16
|
|
Depreciation and amortization—continuing operations
|
|
|
(311)
|
|
|
(306)
|
|
|
(286)
|
|
Depreciation and amortization—discontinued operations
|
|
|
(68)
|
|
|
(114)
|
|
|
(101)
|
|
Net income attributable to noncontrolling interests
|
|
|
105
|
|
|
31
|
|
|
33
|
|
Other adjustments:
|
|
|
|
|
|
|
|
|
|
|
Business acquisition and integration expenses
|
|
|
(19)
|
|
|
(12)
|
|
|
(9)
|
|
Merger costs
|
|
|
(28)
|
|
|
—
|
|
|
—
|
|
EBITDA from discontinued operations
|
|
|
309
|
|
|
76
|
|
|
(223)
|
|
Minority interest of discontinued operations
|
|
|
(49)
|
|
|
(11)
|
|
|
(7)
|
|
Loss on early extinguishment of debt
|
|
|
(54)
|
|
|
(3)
|
|
|
(31)
|
|
Certain legal settlements and related income (expenses)
|
|
|
11
|
|
|
(1)
|
|
|
(1)
|
|
Gain (loss) on sale of assets
|
|
|
9
|
|
|
97
|
|
|
(1)
|
|
Amortization of pension and postretirement actuarial losses
|
|
|
(76)
|
|
|
(58)
|
|
|
(68)
|
|
Plant incident remediation costs
|
|
|
(16)
|
|
|
—
|
|
|
—
|
|
U.S. Tax Reform Act impact on minority interest
|
|
|
6
|
|
|
—
|
|
|
—
|
|
Restructuring, impairment and plant closing and transition costs
|
|
|
(20)
|
|
|
(48)
|
|
|
(87)
|
|
Net income
|
|
$
|
734
|
|
$
|
354
|
|
$
|
127
|
Table of Contents
HUNTSMAN CORPORATION AND SUBSIDIARIES
HUNTSMAN INTERNATIONAL LLC AND SUBSIDIARIES
NOTES TO CONSOLIDATED FINANCIAL STATEMENTS (Continued)
|
|
|
|
|
|
|
|
|
|
|
|
|
|
Year ended December 31,
|
|
|
|
2017
|
|
2016
|
|
2015
|
|
Depreciation and Amortization:
|
|
|
|
|
|
|
|
|
|
|
Polyurethanes
|
|
$
|
116
|
|
$
|
114
|
|
$
|
100
|
|
Performance Products
|
|
|
137
|
|
|
132
|
|
|
119
|
|
Advanced Materials
|
|
|
33
|
|
|
35
|
|
|
38
|
|
Textile Effects
|
|
|
14
|
|
|
15
|
|
|
17
|
|
Corporate and other
|
|
|
11
|
|
|
10
|
|
|
12
|
|
Total
|
|
$
|
311
|
|
$
|
306
|
|
$
|
286
|
|
|
|
|
|
|
|
|
|
|
|
|
|
|
Year ended December 31,
|
|
|
|
2017
|
|
2016
|
|
2015
|
|
Capital Expenditures:
|
|
|
|
|
|
|
|
|
|
|
Polyurethanes
|
|
$
|
162
|
|
$
|
143
|
|
$
|
181
|
|
Performance Products
|
|
|
79
|
|
|
131
|
|
|
205
|
|
Advanced Materials
|
|
|
21
|
|
|
16
|
|
|
25
|
|
Textile Effects
|
|
|
16
|
|
|
19
|
|
|
24
|
|
Corporate and other
|
|
|
4
|
|
|
9
|
|
|
26
|
|
Total
|
|
$
|
282
|
|
$
|
318
|
|
$
|
461
|
|
|
|
|
|
|
|
|
|
|
|
|
|
|
December 31,
|
|
|
|
2017
|
|
2016
|
|
2015
|
|
Total Assets:
|
|
|
|
|
|
|
|
|
|
|
Polyurethanes
|
|
$
|
3,109
|
|
$
|
2,665
|
|
$
|
2,760
|
|
Performance Products
|
|
|
2,069
|
|
|
2,045
|
|
|
2,262
|
|
Advanced Materials
|
|
|
796
|
|
|
728
|
|
|
822
|
|
Textile Effects
|
|
|
564
|
|
|
523
|
|
|
562
|
|
Corporate and other
|
|
|
1,167
|
|
|
1,274
|
|
|
1,193
|
|
Total
|
|
$
|
7,705
|
|
$
|
7,235
|
|
$
|
7,599
|
|
|
(1)
We use segment adjusted EBITDA as the measure of each segment’s profit or loss. We believe that segment adjusted EBITDA more accurately reflects what management uses to make decisions about resources to be allocated to the segments and assess their financial performance. Segment adjusted EBITDA is defined as net income of Huntsman Corporation or Huntsman International, as appropriate, before interest, income tax, depreciation and amortization, net income attributable to noncontrolling interests and certain Corporate and other items, as well as eliminating the following adjustments: (a) business acquisition and integration expenses; (b) merger costs; (c) EBITDA from discontinued operations; (d) minority interest of discontinued operations; (e) loss on early extinguishment of debt; (f) certain legal settlements and related income (expenses); (g) gain (loss) on sale of assets; (h) amortization of pension and postretirement actuarial losses; (i) plant incident remediation costs; (j) U.S. Tax Reform Act impact on minority interest; and (k) restructuring, impairment, plant closing and transition costs.
(2)
Corporate and other includes unallocated corporate overhead, unallocated foreign exchange gains and losses, LIFO inventory valuation reserve adjustments, nonoperating income and expense, benzene sales and gains and losses on the disposition of corporate assets.
|
Table of Contents
HUNTSMAN CORPORATION AND SUBSIDIARIES
HUNTSMAN INTERNATIONAL LLC AND SUBSIDIARIES
NOTES TO CONSOLIDATED FINANCIAL STATEMENTS (Continued)
|
|
|
|
|
|
|
|
|
|
|
|
|
|
Year ended December 31,
|
|
|
|
2017
|
|
2016
|
|
2015
|
|
By Geographic Area
|
|
|
|
|
|
|
|
|
|
|
Revenues(1):
|
|
|
|
|
|
|
|
|
|
|
United States
|
|
$
|
2,729
|
|
$
|
2,514
|
|
$
|
2,727
|
|
China
|
|
|
1,147
|
|
|
908
|
|
|
1,013
|
|
Germany
|
|
|
508
|
|
|
466
|
|
|
479
|
|
Mexico
|
|
|
481
|
|
|
433
|
|
|
455
|
|
Other nations
|
|
|
3,493
|
|
|
3,197
|
|
|
3,465
|
|
Total
|
|
$
|
8,358
|
|
$
|
7,518
|
|
$
|
8,139
|
|
|
|
|
|
|
|
|
|
|
|
|
|
|
December 31,
|
|
|
|
2017
|
|
2016
|
|
2015
|
|
Long-lived assets(2):
|
|
|
|
|
|
|
|
|
|
|
Huntsman Corporation
|
|
|
|
|
|
|
|
|
|
|
United States
|
|
$
|
1,597
|
|
$
|
1,570
|
|
$
|
1,677
|
|
The Netherlands
|
|
|
343
|
|
|
294
|
|
|
304
|
|
China
|
|
|
268
|
|
|
235
|
|
|
208
|
|
Saudi Arabia
|
|
|
172
|
|
|
185
|
|
|
196
|
|
Germany
|
|
|
163
|
|
|
136
|
|
|
147
|
|
Switzerland
|
|
|
112
|
|
|
110
|
|
|
120
|
|
Singapore
|
|
|
100
|
|
|
110
|
|
|
76
|
|
Other nations
|
|
|
343
|
|
|
394
|
|
|
442
|
|
Total
|
|
$
|
3,098
|
|
$
|
3,034
|
|
$
|
3,170
|
|
|
|
|
|
|
|
|
|
|
|
|
Huntsman International
|
|
|
|
|
|
|
|
|
|
|
United States
|
|
$
|
1,594
|
|
$
|
1,548
|
|
$
|
1,641
|
|
The Netherlands
|
|
|
343
|
|
|
294
|
|
|
304
|
|
China
|
|
|
268
|
|
|
235
|
|
|
208
|
|
Saudi Arabia
|
|
|
172
|
|
|
185
|
|
|
196
|
|
Germany
|
|
|
163
|
|
|
136
|
|
|
147
|
|
Switzerland
|
|
|
112
|
|
|
110
|
|
|
120
|
|
Singapore
|
|
|
100
|
|
|
110
|
|
|
76
|
|
Other nations
|
|
|
343
|
|
|
394
|
|
|
442
|
|
Total
|
|
$
|
3,095
|
|
$
|
3,012
|
|
$
|
3,134
|
|
|
(1) Geographic information for revenues is based upon countries into which product is sold.
|
|
|
|
(2) Long‑lived assets consist of property, plant and equipment, net.
|
25. CONDENSED CONSOLIDATING FINANCIAL INFORMATION—HUNTSMAN INTERNATIONAL
The following condensed consolidating financial statements present, in separate columns, financial information for the following: Huntsman International (on a parent only basis), with its investment in subsidiaries recorded under the equity method; the Guarantors on a combined, and where appropriate, consolidated basis; and the nonguarantors on a combined, and where appropriate, consolidated basis. Additional columns present eliminating adjustments and consolidated totals as of December 31, 2017 and 2016 and for the years ended December 31, 2017, 2016 and 2015. There are no contractual restrictions limiting transfers of cash from Guarantor subsidiaries to Huntsman International. Each of the Guarantors is 100% owned by Huntsman International and has fully and unconditionally guaranteed Huntsman International’s outstanding notes on a joint and several basis.
In connection with the separation of the P&A Business in the third quarter of 2017 (see “Note 3. Discontinued Operations and Business Dispositions—Separation of P&A Business”), certain entities were removed from the debt guarantor structure. The following condensed consolidating financial statements have been presented as if the new debt structure existed for all periods presented.
Table of Contents
HUNTSMAN CORPORATION AND SUBSIDIARIES
HUNTSMAN INTERNATIONAL LLC AND SUBSIDIARIES
NOTES TO CONSOLIDATED FINANCIAL STATEMENTS (Continued)
HUNTSMAN INTERNATIONAL LLC AND SUBSIDIARIES
CONDENSED CONSOLIDATING BALANCE SHEETS
AS OF DECEMBER 31, 2017
(In Millions)
Table of Contents
HUNTSMAN CORPORATION AND SUBSIDIARIES
HUNTSMAN INTERNATIONAL LLC AND SUBSIDIARIES
NOTES TO CONSOLIDATED FINANCIAL STATEMENTS (Continued)
|
|
|
|
|
|
|
|
|
|
|
|
|
|
|
|
|
|
|
|
|
|
|
|
|
|
|
|
|
|
|
|
Consolidated
|
|
|
|
Parent
|
|
|
|
|
|
|
|
|
|
|
Huntsman
|
|
|
|
Company
|
|
Guarantors
|
|
Nonguarantors
|
|
Eliminations
|
|
International LLC
|
|
ASSETS
|
|
|
|
|
|
|
|
|
|
|
|
|
|
|
|
|
Current assets:
|
|
|
|
|
|
|
|
|
|
|
|
|
|
|
|
|
Cash and cash equivalents
|
|
$
|
74
|
|
$
|
—
|
|
$
|
394
|
|
$
|
—
|
|
$
|
468
|
|
Restricted cash
|
|
|
—
|
|
|
—
|
|
|
11
|
|
|
—
|
|
|
11
|
|
Accounts and notes receivable, net
|
|
|
36
|
|
|
94
|
|
|
1,120
|
|
|
5
|
|
|
1,255
|
|
Accounts receivable from affiliates
|
|
|
983
|
|
|
4,130
|
|
|
391
|
|
|
(5,131)
|
|
|
373
|
|
Inventories
|
|
|
101
|
|
|
210
|
|
|
767
|
|
|
(5)
|
|
|
1,073
|
|
Prepaid expenses
|
|
|
21
|
|
|
10
|
|
|
39
|
|
|
(11)
|
|
|
59
|
|
Other current assets
|
|
|
783
|
|
|
3
|
|
|
170
|
|
|
(752)
|
|
|
204
|
|
Current assets held for sale
|
|
|
—
|
|
|
—
|
|
|
2,880
|
|
|
—
|
|
|
2,880
|
|
Total current assets
|
|
|
1,998
|
|
|
4,447
|
|
|
5,772
|
|
|
(5,894)
|
|
|
6,323
|
|
Property, plant and equipment, net
|
|
|
461
|
|
|
1,119
|
|
|
1,515
|
|
|
—
|
|
|
3,095
|
|
Investment in unconsolidated affiliates
|
|
|
6,364
|
|
|
2,268
|
|
|
266
|
|
|
(8,632)
|
|
|
266
|
|
Intangible assets, net
|
|
|
25
|
|
|
—
|
|
|
31
|
|
|
—
|
|
|
56
|
|
Goodwill
|
|
|
(14)
|
|
|
82
|
|
|
72
|
|
|
—
|
|
|
140
|
|
Deferred income taxes
|
|
|
323
|
|
|
—
|
|
|
208
|
|
|
(323)
|
|
|
208
|
|
Notes receivable from affiliates
|
|
|
72
|
|
|
569
|
|
|
—
|
|
|
(641)
|
|
|
—
|
|
Other noncurrent assets
|
|
|
52
|
|
|
189
|
|
|
257
|
|
|
(1)
|
|
|
497
|
|
Total assets
|
|
$
|
9,281
|
|
$
|
8,674
|
|
$
|
8,121
|
|
$
|
(15,491)
|
|
$
|
10,585
|
|
LIABILITIES AND EQUITY
|
|
|
|
|
|
|
|
|
|
|
|
|
|
|
|
|
Current liabilities:
|
|
|
|
|
|
|
|
|
|
|
|
|
|
|
|
|
Accounts payable
|
|
$
|
74
|
|
$
|
214
|
|
$
|
652
|
|
$
|
6
|
|
$
|
946
|
|
Accounts payable to affiliates
|
|
|
4,019
|
|
|
485
|
|
|
697
|
|
|
(5,131)
|
|
|
70
|
|
Accrued liabilities
|
|
|
89
|
|
|
826
|
|
|
413
|
|
|
(762)
|
|
|
566
|
|
Note payable to affiliate
|
|
|
100
|
|
|
—
|
|
|
—
|
|
|
—
|
|
|
100
|
|
Current portion of debt
|
|
|
17
|
|
|
—
|
|
|
23
|
|
|
—
|
|
|
40
|
|
Current liabilities held for sale
|
|
|
—
|
|
|
—
|
|
|
1,692
|
|
|
—
|
|
|
1,692
|
|
Total current liabilities
|
|
|
4,299
|
|
|
1,525
|
|
|
3,477
|
|
|
(5,887)
|
|
|
3,414
|
|
Long-term debt
|
|
|
1,927
|
|
|
—
|
|
|
331
|
|
|
—
|
|
|
2,258
|
|
Notes payable to affiliates
|
|
|
742
|
|
|
—
|
|
|
642
|
|
|
(642)
|
|
|
742
|
|
Deferred income taxes
|
|
|
12
|
|
|
179
|
|
|
33
|
|
|
41
|
|
|
265
|
|
Other noncurrent liabilities
|
|
|
218
|
|
|
278
|
|
|
576
|
|
|
—
|
|
|
1,072
|
|
Total liabilities
|
|
|
7,198
|
|
|
1,982
|
|
|
5,059
|
|
|
(6,488)
|
|
|
7,751
|
|
Equity
|
|
|
|
|
|
|
|
|
|
|
|
|
|
|
|
|
Huntsman International LLC members’ equity
|
|
|
|
|
|
|
|
|
|
|
|
|
|
|
|
|
Members’ equity
|
|
|
3,616
|
|
|
2,216
|
|
|
3,641
|
|
|
(5,857)
|
|
|
3,616
|
|
Accumulated (deficit) retained earnings
|
|
|
(270)
|
|
|
2,749
|
|
|
(116)
|
|
|
(2,633)
|
|
|
(270)
|
|
Accumulated other comprehensive (loss) income
|
|
|
(1,263)
|
|
|
1,727
|
|
|
(1,211)
|
|
|
(516)
|
|
|
(1,263)
|
|
Total Huntsman International LLC members’ equity
|
|
|
2,083
|
|
|
6,692
|
|
|
2,314
|
|
|
(9,006)
|
|
|
2,083
|
|
Noncontrolling interests in subsidiaries
|
|
|
—
|
|
|
—
|
|
|
748
|
|
|
3
|
|
|
751
|
|
Total equity
|
|
|
2,083
|
|
|
6,692
|
|
|
3,062
|
|
|
(9,003)
|
|
|
2,834
|
|
Total liabilities and equity
|
|
$
|
9,281
|
|
$
|
8,674
|
|
$
|
8,121
|
|
$
|
(15,491)
|
|
$
|
10,585
|
Table of Contents
HUNTSMAN CORPORATION AND SUBSIDIARIES
HUNTSMAN INTERNATIONAL LLC AND SUBSIDIARIES
NOTES TO CONSOLIDATED FINANCIAL STATEMENTS (Continued)
HUNTSMAN INTERNATIONAL LLC AND SUBSIDIARIES
CONDENSED CONSOLIDATING BALANCE SHEETS
AS OF DECEMBER 31, 2016
(In Millions)
|
|
|
|
|
|
|
|
|
|
|
|
|
|
|
|
|
|
|
|
|
|
|
|
|
|
|
|
|
|
|
|
Consolidated
|
|
|
|
Parent
|
|
|
|
|
|
|
|
|
|
|
Huntsman
|
|
|
|
Company
|
|
Guarantors
|
|
Nonguarantors
|
|
Eliminations
|
|
International LLC
|
|
ASSETS
|
|
|
|
|
|
|
|
|
|
|
|
|
|
|
|
|
Current assets:
|
|
|
|
|
|
|
|
|
|
|
|
|
|
|
|
|
Cash and cash equivalents
|
|
$
|
37
|
|
$
|
—
|
|
$
|
347
|
|
$
|
—
|
|
$
|
384
|
|
Restricted cash
|
|
|
—
|
|
|
—
|
|
|
11
|
|
|
—
|
|
|
11
|
|
Accounts and notes receivable, net
|
|
|
22
|
|
|
88
|
|
|
1,053
|
|
|
5
|
|
|
1,168
|
|
Accounts receivable from affiliates
|
|
|
1,351
|
|
|
4,589
|
|
|
149
|
|
|
(5,760)
|
|
|
329
|
|
Inventories
|
|
|
85
|
|
|
183
|
|
|
652
|
|
|
(2)
|
|
|
918
|
|
Prepaid expenses
|
|
|
68
|
|
|
46
|
|
|
36
|
|
|
(101)
|
|
|
49
|
|
Other current assets
|
|
|
820
|
|
|
3
|
|
|
129
|
|
|
(725)
|
|
|
227
|
|
Current assets held for sale
|
|
|
—
|
|
|
—
|
|
|
777
|
|
|
—
|
|
|
777
|
|
Total current assets
|
|
|
2,383
|
|
|
4,909
|
|
|
3,154
|
|
|
(6,583)
|
|
|
3,863
|
|
Property, plant and equipment, net
|
|
|
463
|
|
|
1,163
|
|
|
1,385
|
|
|
1
|
|
|
3,012
|
|
Investment in unconsolidated affiliates
|
|
|
5,870
|
|
|
1,458
|
|
|
245
|
|
|
(7,325)
|
|
|
248
|
|
Intangible assets, net
|
|
|
28
|
|
|
—
|
|
|
15
|
|
|
—
|
|
|
43
|
|
Goodwill
|
|
|
(12)
|
|
|
82
|
|
|
51
|
|
|
—
|
|
|
121
|
|
Deferred income taxes
|
|
|
515
|
|
|
—
|
|
|
265
|
|
|
(527)
|
|
|
253
|
|
Notes receivable from affiliates
|
|
|
37
|
|
|
620
|
|
|
—
|
|
|
(657)
|
|
|
—
|
|
Other noncurrent assets
|
|
|
74
|
|
|
188
|
|
|
210
|
|
|
—
|
|
|
472
|
|
Noncurrent assets held for sale
|
|
|
—
|
|
|
—
|
|
|
1,463
|
|
|
—
|
|
|
1,463
|
|
Total assets
|
|
$
|
9,358
|
|
$
|
8,420
|
|
$
|
6,788
|
|
$
|
(15,091)
|
|
$
|
9,475
|
|
LIABILITIES AND EQUITY
|
|
|
|
|
|
|
|
|
|
|
|
|
|
|
|
|
Current liabilities:
|
|
|
|
|
|
|
|
|
|
|
|
|
|
|
|
|
Accounts payable
|
|
$
|
63
|
|
$
|
152
|
|
$
|
553
|
|
$
|
5
|
|
$
|
773
|
|
Accounts payable to affiliates
|
|
|
3,667
|
|
|
645
|
|
|
1,499
|
|
|
(5,760)
|
|
|
51
|
|
Accrued liabilities
|
|
|
87
|
|
|
787
|
|
|
420
|
|
|
(826)
|
|
|
468
|
|
Note payable to affiliate
|
|
|
100
|
|
|
—
|
|
|
—
|
|
|
—
|
|
|
100
|
|
Current portion of debt
|
|
|
30
|
|
|
—
|
|
|
20
|
|
|
—
|
|
|
50
|
|
Current liabilities held for sale
|
|
|
—
|
|
|
—
|
|
|
467
|
|
|
—
|
|
|
467
|
|
Total current liabilities
|
|
|
3,947
|
|
|
1,584
|
|
|
2,959
|
|
|
(6,581)
|
|
|
1,909
|
|
Long-term debt
|
|
|
3,763
|
|
|
—
|
|
|
359
|
|
|
—
|
|
|
4,122
|
|
Notes payable to affiliates
|
|
|
696
|
|
|
—
|
|
|
658
|
|
|
(657)
|
|
|
697
|
|
Deferred income taxes
|
|
|
22
|
|
|
257
|
|
|
19
|
|
|
69
|
|
|
367
|
|
Other noncurrent liabilities
|
|
|
174
|
|
|
300
|
|
|
577
|
|
|
—
|
|
|
1,051
|
|
Noncurrent liabilities held for sale
|
|
|
—
|
|
|
—
|
|
|
393
|
|
|
—
|
|
|
393
|
|
Total liabilities
|
|
|
8,602
|
|
|
2,141
|
|
|
4,965
|
|
|
(7,169)
|
|
|
8,539
|
|
Equity
|
|
|
|
|
|
|
|
|
|
|
|
|
|
|
|
|
Huntsman International LLC members’ equity
|
|
|
|
|
|
|
|
|
|
|
|
|
|
|
|
|
Members’ equity
|
|
|
3,226
|
|
|
2,949
|
|
|
5,019
|
|
|
(7,968)
|
|
|
3,226
|
|
Accumulated (deficit) retained earnings
|
|
|
(779)
|
|
|
2,332
|
|
|
(1,713)
|
|
|
(619)
|
|
|
(779)
|
|
Accumulated other comprehensive (loss) income
|
|
|
(1,691)
|
|
|
998
|
|
|
(1,652)
|
|
|
654
|
|
|
(1,691)
|
|
Total Huntsman International LLC members' equity
|
|
|
756
|
|
|
6,279
|
|
|
1,654
|
|
|
(7,933)
|
|
|
756
|
|
Noncontrolling interests in subsidiaries
|
|
|
—
|
|
|
—
|
|
|
169
|
|
|
11
|
|
|
180
|
|
Total equity
|
|
|
756
|
|
|
6,279
|
|
|
1,823
|
|
|
(7,922)
|
|
|
936
|
|
Total liabilities and equity
|
|
$
|
9,358
|
|
$
|
8,420
|
|
$
|
6,788
|
|
$
|
(15,091)
|
|
$
|
9,475
|
Table of Contents
HUNTSMAN CORPORATION AND SUBSIDIARIES
HUNTSMAN INTERNATIONAL LLC AND SUBSIDIARIES
NOTES TO CONSOLIDATED FINANCIAL STATEMENTS (Continued)
HUNTSMAN INTERNATIONAL LLC AND SUBSIDIARIES
CONDENSED CONSOLIDATING STATEMENTS OF OPERATIONS
AND COMPREHENSIVE INCOME
YEAR ENDED DECEMBER 31, 2017
(In Millions)
|
|
|
|
|
|
|
|
|
|
|
|
|
|
|
|
|
|
|
|
|
|
|
|
|
|
|
|
|
|
|
|
Consolidated
|
|
|
|
|
|
|
|
|
|
|
|
|
|
|
|
Huntsman
|
|
|
|
Parent
|
|
|
|
|
|
|
|
|
|
|
International
|
|
|
|
Company
|
|
Guarantors
|
|
Nonguarantors
|
|
Eliminations
|
|
LLC
|
|
Revenues:
|
|
|
|
|
|
|
|
|
|
|
|
|
|
|
|
|
Trade sales, services and fees, net
|
|
$
|
1,116
|
|
$
|
2,028
|
|
$
|
5,064
|
|
$
|
—
|
|
$
|
8,208
|
|
Related party sales
|
|
|
230
|
|
|
329
|
|
|
1,051
|
|
|
(1,460)
|
|
|
150
|
|
Total revenues
|
|
|
1,346
|
|
|
2,357
|
|
|
6,115
|
|
|
(1,460)
|
|
|
8,358
|
|
Cost of goods sold
|
|
|
1,050
|
|
|
2,069
|
|
|
4,880
|
|
|
(1,456)
|
|
|
6,543
|
|
Gross profit
|
|
|
296
|
|
|
288
|
|
|
1,235
|
|
|
(4)
|
|
|
1,815
|
|
Selling, general and administrative
|
|
|
171
|
|
|
132
|
|
|
490
|
|
|
—
|
|
|
793
|
|
Research and development
|
|
|
50
|
|
|
43
|
|
|
45
|
|
|
—
|
|
|
138
|
|
Restructuring, impairment and plant closing costs
|
|
|
8
|
|
|
—
|
|
|
12
|
|
|
—
|
|
|
20
|
|
Merger costs
|
|
|
28
|
|
|
—
|
|
|
—
|
|
|
—
|
|
|
28
|
|
Other operating expense (income), net
|
|
|
30
|
|
|
(37)
|
|
|
(16)
|
|
|
—
|
|
|
(23)
|
|
Operating income
|
|
|
9
|
|
|
150
|
|
|
704
|
|
|
(4)
|
|
|
859
|
|
Interest (expense) income
|
|
|
(179)
|
|
|
27
|
|
|
(29)
|
|
|
—
|
|
|
(181)
|
|
Equity in income of investment in affiliates and subsidiaries
|
|
|
614
|
|
|
641
|
|
|
15
|
|
|
(1,257)
|
|
|
13
|
|
Loss on early extinguishment of debt
|
|
|
(54)
|
|
|
—
|
|
|
—
|
|
|
—
|
|
|
(54)
|
|
Dividend income
|
|
|
473
|
|
|
—
|
|
|
—
|
|
|
(473)
|
|
|
—
|
|
Other income, net
|
|
|
1
|
|
|
—
|
|
|
2
|
|
|
—
|
|
|
3
|
|
Income from continuing operations before income taxes
|
|
|
864
|
|
|
818
|
|
|
692
|
|
|
(1,734)
|
|
|
640
|
|
Income tax (expense) benefit
|
|
|
(192)
|
|
|
59
|
|
|
(161)
|
|
|
233
|
|
|
(61)
|
|
Income from continuing operations
|
|
|
672
|
|
|
877
|
|
|
531
|
|
|
(1,501)
|
|
|
579
|
|
(Loss) income from discontinued operations, net of tax
|
|
|
(43)
|
|
|
(4)
|
|
|
202
|
|
|
—
|
|
|
155
|
|
Net income
|
|
|
629
|
|
|
873
|
|
|
733
|
|
|
(1,501)
|
|
|
734
|
|
Net income attributable to noncontrolling interests
|
|
|
—
|
|
|
—
|
|
|
(111)
|
|
|
6
|
|
|
(105)
|
|
Net income attributable to Huntsman International LLC
|
|
$
|
629
|
|
$
|
873
|
|
$
|
622
|
|
$
|
(1,495)
|
|
$
|
629
|
|
Net income
|
|
$
|
629
|
|
$
|
873
|
|
$
|
733
|
|
$
|
(1,501)
|
|
$
|
734
|
|
Other comprehensive income
|
|
|
428
|
|
|
728
|
|
|
336
|
|
|
(1,171)
|
|
|
321
|
|
Comprehensive income attributable to noncontrolling interests
|
|
|
—
|
|
|
—
|
|
|
(130)
|
|
|
3
|
|
|
(127)
|
|
Comprehensive income attributable to Huntsman International LLC
|
|
$
|
1,057
|
|
$
|
1,601
|
|
$
|
939
|
|
$
|
(2,669)
|
|
$
|
928
|
Table of Contents
HUNTSMAN CORPORATION AND SUBSIDIARIES
HUNTSMAN INTERNATIONAL LLC AND SUBSIDIARIES
NOTES TO CONSOLIDATED FINANCIAL STATEMENTS (Continued)
HUNTSMAN INTERNATIONAL LLC AND SUBSIDIARIES
CONDENSED CONSOLIDATING STATEMENTS OF OPERATIONS
AND COMPREHENSIVE (LOSS) INCOME
YEAR ENDED DECEMBER 31, 2016
(In Millions)
|
|
|
|
|
|
|
|
|
|
|
|
|
|
|
|
|
|
|
|
|
|
|
|
|
|
|
|
|
|
|
|
Consolidated
|
|
|
|
|
|
|
|
|
|
|
|
|
|
|
|
Huntsman
|
|
|
|
Parent
|
|
|
|
|
|
|
|
|
|
|
International
|
|
|
|
Company
|
|
Guarantors
|
|
Nonguarantors
|
|
Eliminations
|
|
LLC
|
|
Revenues:
|
|
|
|
|
|
|
|
|
|
|
|
|
|
|
|
|
Trade sales, services and fees, net
|
|
$
|
1,048
|
|
$
|
1,862
|
|
$
|
4,477
|
|
$
|
—
|
|
$
|
7,387
|
|
Related party sales
|
|
|
201
|
|
|
286
|
|
|
946
|
|
|
(1,302)
|
|
|
131
|
|
Total revenues
|
|
|
1,249
|
|
|
2,148
|
|
|
5,423
|
|
|
(1,302)
|
|
|
7,518
|
|
Cost of goods sold
|
|
|
984
|
|
|
1,823
|
|
|
4,486
|
|
|
(1,305)
|
|
|
5,988
|
|
Gross profit
|
|
|
265
|
|
|
325
|
|
|
937
|
|
|
3
|
|
|
1,530
|
|
Selling, general and administrative
|
|
|
156
|
|
|
111
|
|
|
497
|
|
|
—
|
|
|
764
|
|
Research and development
|
|
|
48
|
|
|
42
|
|
|
47
|
|
|
—
|
|
|
137
|
|
Restructuring, impairment and plant closing costs
|
|
|
6
|
|
|
16
|
|
|
25
|
|
|
—
|
|
|
47
|
|
Other operating income, net
|
|
|
(24)
|
|
|
(31)
|
|
|
(46)
|
|
|
—
|
|
|
(101)
|
|
Operating income
|
|
|
79
|
|
|
187
|
|
|
414
|
|
|
3
|
|
|
683
|
|
Interest (expense) income
|
|
|
(218)
|
|
|
31
|
|
|
(28)
|
|
|
—
|
|
|
(215)
|
|
Equity in income of investment in affiliates and subsidiaries
|
|
|
183
|
|
|
320
|
|
|
6
|
|
|
(504)
|
|
|
5
|
|
(Loss) income on early extinguishment of debt
|
|
|
(4)
|
|
|
—
|
|
|
1
|
|
|
—
|
|
|
(3)
|
|
Dividends received (paid)
|
|
|
217
|
|
|
(430)
|
|
|
430
|
|
|
(217)
|
|
|
—
|
|
Other income, net
|
|
|
—
|
|
|
—
|
|
|
5
|
|
|
—
|
|
|
5
|
|
Income from continuing operations before income taxes
|
|
|
257
|
|
|
108
|
|
|
828
|
|
|
(718)
|
|
|
475
|
|
Income tax benefit (expense)
|
|
|
76
|
|
|
(78)
|
|
|
(78)
|
|
|
(28)
|
|
|
(108)
|
|
Income from continuing operations
|
|
|
333
|
|
|
30
|
|
|
750
|
|
|
(746)
|
|
|
367
|
|
(Loss) income from discontinued operations, net of tax
|
|
|
(10)
|
|
|
(2)
|
|
|
(1)
|
|
|
—
|
|
|
(13)
|
|
Net income
|
|
|
323
|
|
|
28
|
|
|
749
|
|
|
(746)
|
|
|
354
|
|
Net income attributable to noncontrolling interests
|
|
|
—
|
|
|
—
|
|
|
(28)
|
|
|
(3)
|
|
|
(31)
|
|
Net income attributable to Huntsman International LLC
|
|
$
|
323
|
|
$
|
28
|
|
$
|
721
|
|
$
|
(749)
|
|
$
|
323
|
|
Net income
|
|
$
|
323
|
|
$
|
28
|
|
$
|
749
|
|
$
|
(746)
|
|
$
|
354
|
|
Other comprehensive loss
|
|
|
(374)
|
|
|
(365)
|
|
|
(347)
|
|
|
703
|
|
|
(383)
|
|
Comprehensive income attributable to noncontrolling interests
|
|
|
—
|
|
|
—
|
|
|
(11)
|
|
|
(12)
|
|
|
(23)
|
|
Comprehensive (loss) income attributable to Huntsman International LLC
|
|
$
|
(51)
|
|
$
|
(337)
|
|
$
|
391
|
|
$
|
(55)
|
|
$
|
(52)
|
Table of Contents
HUNTSMAN CORPORATION AND SUBSIDIARIES
HUNTSMAN INTERNATIONAL LLC AND SUBSIDIARIES
NOTES TO CONSOLIDATED FINANCIAL STATEMENTS (Continued)
HUNTSMAN INTERNATIONAL LLC AND SUBSIDIARIES
CONDENSED CONSOLIDATING STATEMENTS OF OPERATIONS
AND COMPREHENSIVE (LOSS) INCOME
YEAR ENDED DECEMBER 31, 2015
(In Millions)
|
|
|
|
|
|
|
|
|
|
|
|
|
|
|
|
|
|
|
|
|
|
|
|
|
|
|
|
|
|
|
|
Consolidated
|
|
|
|
|
|
|
|
|
|
|
|
|
|
|
|
Huntsman
|
|
|
|
Parent
|
|
|
|
|
|
|
|
|
|
|
International
|
|
|
|
Company
|
|
Guarantors
|
|
Nonguarantors
|
|
Eliminations
|
|
LLC
|
|
Revenues:
|
|
|
|
|
|
|
|
|
|
|
|
|
|
|
|
|
Trade sales, services and fees, net
|
|
$
|
1,054
|
|
$
|
2,121
|
|
$
|
4,833
|
|
$
|
—
|
|
$
|
8,008
|
|
Related party sales
|
|
|
238
|
|
|
365
|
|
|
969
|
|
|
(1,441)
|
|
|
131
|
|
Total revenues
|
|
|
1,292
|
|
|
2,486
|
|
|
5,802
|
|
|
(1,441)
|
|
|
8,139
|
|
Cost of goods sold
|
|
|
1,026
|
|
|
1,925
|
|
|
4,889
|
|
|
(1,439)
|
|
|
6,401
|
|
Gross profit
|
|
|
266
|
|
|
561
|
|
|
913
|
|
|
(2)
|
|
|
1,738
|
|
Selling, general and administrative
|
|
|
172
|
|
|
113
|
|
|
501
|
|
|
—
|
|
|
786
|
|
Research and development
|
|
|
54
|
|
|
44
|
|
|
45
|
|
|
—
|
|
|
143
|
|
Restructuring, impairment and plant closing costs
|
|
|
7
|
|
|
5
|
|
|
71
|
|
|
—
|
|
|
83
|
|
Other operating (income) expense, net
|
|
|
(27)
|
|
|
(25)
|
|
|
53
|
|
|
—
|
|
|
1
|
|
Operating income
|
|
|
60
|
|
|
424
|
|
|
243
|
|
|
(2)
|
|
|
725
|
|
Interest (expense) income
|
|
|
(220)
|
|
|
33
|
|
|
(27)
|
|
|
—
|
|
|
(214)
|
|
Equity in income (loss) of investment in affiliates and subsidiaries
|
|
|
169
|
|
|
(58)
|
|
|
7
|
|
|
(112)
|
|
|
6
|
|
Loss on early extinguishment of debt
|
|
|
(31)
|
|
|
—
|
|
|
—
|
|
|
—
|
|
|
(31)
|
|
Other income, net
|
|
|
2
|
|
|
—
|
|
|
7
|
|
|
(2)
|
|
|
7
|
|
(Loss) income from continuing operations before income taxes
|
|
|
(20)
|
|
|
399
|
|
|
230
|
|
|
(116)
|
|
|
493
|
|
Income tax benefit (expense)
|
|
|
113
|
|
|
(125)
|
|
|
13
|
|
|
(60)
|
|
|
(59)
|
|
Income from continuing operations
|
|
|
93
|
|
|
274
|
|
|
243
|
|
|
(176)
|
|
|
434
|
|
Income (loss) from discontinued operations, net of tax
|
|
|
1
|
|
|
(2)
|
|
|
(306)
|
|
|
—
|
|
|
(307)
|
|
Net income (loss)
|
|
|
94
|
|
|
272
|
|
|
(63)
|
|
|
(176)
|
|
|
127
|
|
Net income attributable to noncontrolling interests
|
|
|
—
|
|
|
—
|
|
|
(28)
|
|
|
(5)
|
|
|
(33)
|
|
Net income (loss) attributable to Huntsman International LLC
|
|
$
|
94
|
|
$
|
272
|
|
$
|
(91)
|
|
$
|
(181)
|
|
$
|
94
|
|
Net income (loss)
|
|
$
|
94
|
|
$
|
272
|
|
$
|
(63)
|
|
$
|
(176)
|
|
$
|
127
|
|
Other comprehensive loss
|
|
|
(229)
|
|
|
(37)
|
|
|
(246)
|
|
|
278
|
|
|
(234)
|
|
Comprehensive income attributable to noncontrolling interests
|
|
|
—
|
|
|
—
|
|
|
(13)
|
|
|
(15)
|
|
|
(28)
|
|
Comprehensive (loss) income attributable to Huntsman International LLC
|
|
$
|
(135)
|
|
$
|
235
|
|
$
|
(322)
|
|
$
|
87
|
|
$
|
(135)
|
Table of Contents
HUNTSMAN CORPORATION AND SUBSIDIARIES
HUNTSMAN INTERNATIONAL LLC AND SUBSIDIARIES
NOTES TO CONSOLIDATED FINANCIAL STATEMENTS (Continued)
HUNTSMAN INTERNATIONAL LLC AND SUBSIDIARIES
CONDENSED CONSOLIDATING STATEMENTS OF CASH FLOWS
YEAR ENDED DECEMBER 31, 2017
(In Millions)
|
|
|
|
|
|
|
|
|
|
|
|
|
|
|
|
|
|
|
|
|
|
|
|
|
|
|
|
Consolidated
|
|
|
|
Parent
|
|
|
|
|
|
|
|
Huntsman
|
|
|
|
Company
|
|
Guarantors
|
|
Nonguarantors
|
|
Eliminations
|
|
International LLC
|
|
Net cash provided by (used in) operating activities from continuing operations
|
|
$
|
859
|
|
$
|
587
|
|
$
|
(137)
|
|
$
|
(473)
|
|
$
|
836
|
|
Net cash (used in) provided by operating activities from discontinued operations
|
|
|
(19)
|
|
|
(2)
|
|
|
393
|
|
|
—
|
|
|
372
|
|
Net cash provided by (used in) operating activities
|
|
|
840
|
|
|
585
|
|
|
256
|
|
|
(473)
|
|
|
1,208
|
|
|
|
|
|
|
|
|
|
|
|
|
|
|
|
|
|
|
Investing activities:
|
|
|
|
|
|
|
|
|
|
|
|
|
|
|
|
|
Capital expenditures
|
|
|
(49)
|
|
|
(69)
|
|
|
(164)
|
|
|
—
|
|
|
(282)
|
|
Cash received from (paid for) consolidated affiliates
|
|
|
870
|
|
|
(2)
|
|
|
(276)
|
|
|
(592)
|
|
|
—
|
|
Acquisition of business, net of cash acquired
|
|
|
—
|
|
|
—
|
|
|
(14)
|
|
|
—
|
|
|
(14)
|
|
Proceeds from sale of businesses/assets
|
|
|
—
|
|
|
—
|
|
|
25
|
|
|
—
|
|
|
25
|
|
Increase in receivable from affiliate
|
|
|
(15)
|
|
|
—
|
|
|
—
|
|
|
—
|
|
|
(15)
|
|
Cash received from termination of cross-currency interest rate contracts
|
|
|
7
|
|
|
—
|
|
|
—
|
|
|
—
|
|
|
7
|
|
Net cash provided by (used in) investing activities from continuing operations
|
|
|
813
|
|
|
(71)
|
|
|
(429)
|
|
|
(592)
|
|
|
(279)
|
|
Net cash used in investing activities from discontinued operations
|
|
|
—
|
|
|
—
|
|
|
(159)
|
|
|
—
|
|
|
(159)
|
|
Net cash provided by (used in) investing activities
|
|
|
813
|
|
|
(71)
|
|
|
(588)
|
|
|
(592)
|
|
|
(438)
|
|
|
|
|
|
|
|
|
|
|
|
|
|
|
|
|
|
|
Financing activities:
|
|
|
|
|
|
|
|
|
|
|
|
|
|
|
|
|
Net repayments under revolving loan facilities
|
|
|
—
|
|
|
—
|
|
|
(41)
|
|
|
—
|
|
|
(41)
|
|
Net borrowings on overdraft facilities
|
|
|
—
|
|
|
—
|
|
|
1
|
|
|
—
|
|
|
1
|
|
Repayments of short-term debt
|
|
|
—
|
|
|
—
|
|
|
(15)
|
|
|
—
|
|
|
(15)
|
|
Borrowings on short-term debt
|
|
|
—
|
|
|
—
|
|
|
8
|
|
|
—
|
|
|
8
|
|
Repayments of long-term debt
|
|
|
(2,026)
|
|
|
—
|
|
|
(32)
|
|
|
—
|
|
|
(2,058)
|
|
Proceeds from long-term debt of P&A Business
|
|
|
—
|
|
|
—
|
|
|
750
|
|
|
—
|
|
|
750
|
|
Proceeds from issuance of long-term debt
|
|
|
—
|
|
|
—
|
|
|
24
|
|
|
—
|
|
|
24
|
|
Proceeds from issuance of notes payable from affiliate
|
|
|
47
|
|
|
—
|
|
|
—
|
|
|
—
|
|
|
47
|
|
Repayments of notes payable
|
|
|
(27)
|
|
|
—
|
|
|
—
|
|
|
—
|
|
|
(27)
|
|
Borrowings on notes payable
|
|
|
31
|
|
|
—
|
|
|
—
|
|
|
—
|
|
|
31
|
|
Debt issuance costs paid
|
|
|
(3)
|
|
|
—
|
|
|
(18)
|
|
|
—
|
|
|
(21)
|
|
Dividends paid to noncontrolling interests
|
|
|
—
|
|
|
—
|
|
|
(34)
|
|
|
—
|
|
|
(34)
|
|
Contribution from noncontrolling interests
|
|
|
—
|
|
|
—
|
|
|
5
|
|
|
—
|
|
|
5
|
|
Distribution to parent
|
|
|
—
|
|
|
(511)
|
|
|
(81)
|
|
|
592
|
|
|
—
|
|
Dividends paid to parent
|
|
|
(120)
|
|
|
(1)
|
|
|
(472)
|
|
|
473
|
|
|
(120)
|
|
Proceeds from the IPO and secondary offering of P&A Business
|
|
|
522
|
|
|
—
|
|
|
490
|
|
|
—
|
|
|
1,012
|
|
Cash paid for expenses of the IPO and secondary offering of P&A Business
|
|
|
(40)
|
|
|
—
|
|
|
(18)
|
|
|
—
|
|
|
(58)
|
|
Other, net
|
|
|
—
|
|
|
(2)
|
|
|
3
|
|
|
—
|
|
|
1
|
|
Net cash (used in) provided by financing activities
|
|
|
(1,616)
|
|
|
(514)
|
|
|
570
|
|
|
1,065
|
|
|
(495)
|
|
Effect of exchange rate changes on cash
|
|
|
—
|
|
|
—
|
|
|
18
|
|
|
—
|
|
|
18
|
|
Increase in cash and cash equivalents
|
|
|
37
|
|
|
—
|
|
|
256
|
|
|
—
|
|
|
293
|
|
Cash and cash equivalents from continuing operations at beginning of period
|
|
|
37
|
|
|
—
|
|
|
347
|
|
|
—
|
|
|
384
|
|
Cash and cash equivalents from discontinued operations at beginning of period
|
|
|
—
|
|
|
—
|
|
|
29
|
|
|
—
|
|
|
29
|
|
Cash and cash equivalents at end of period
|
|
$
|
74
|
|
$
|
—
|
|
$
|
632
|
|
$
|
—
|
|
$
|
706
|
During the year ended December 31, 2017, we made a noncash capital contribution of approximately $50 million between Parent Company and Guarantor entities.
Table of Contents
HUNTSMAN CORPORATION AND SUBSIDIARIES
HUNTSMAN INTERNATIONAL LLC AND SUBSIDIARIES
NOTES TO CONSOLIDATED FINANCIAL STATEMENTS (Continued)
HUNTSMAN INTERNATIONAL LLC AND SUBSIDIARIES
CONDENSED CONSOLIDATING STATEMENTS OF CASH FLOWS
YEAR ENDED DECEMBER 31, 2016
(In Millions)
|
|
|
|
|
|
|
|
|
|
|
|
|
|
|
|
|
|
|
|
|
|
|
|
|
|
|
|
Consolidated
|
|
|
|
Parent
|
|
|
|
|
|
|
|
Huntsman
|
|
|
|
Company
|
|
Guarantors
|
|
Nonguarantors
|
|
Eliminations
|
|
International LLC
|
|
Net cash provided by operating activities from continuing operations
|
|
$
|
457
|
|
$
|
120
|
|
$
|
391
|
|
$
|
—
|
|
$
|
968
|
|
Net cash (used in) provided by operating activities from discontinued operations
|
|
|
(11)
|
|
|
—
|
|
|
121
|
|
|
—
|
|
|
110
|
|
Net cash provided by operating activities
|
|
|
446
|
|
|
120
|
|
|
512
|
|
|
—
|
|
|
1,078
|
|
|
|
|
|
|
|
|
|
|
|
|
|
|
|
|
|
|
Investing activities:
|
|
|
|
|
|
|
|
|
|
|
|
|
|
|
|
|
Capital expenditures
|
|
|
(42)
|
|
|
(92)
|
|
|
(184)
|
|
|
—
|
|
|
(318)
|
|
Cash received from consolidated affiliates
|
|
|
203
|
|
|
—
|
|
|
—
|
|
|
(203)
|
|
|
—
|
|
Investment in affiliate
|
|
|
—
|
|
|
(3)
|
|
|
—
|
|
|
3
|
|
|
—
|
|
Investment in unconsolidated affiliate
|
|
|
—
|
|
|
—
|
|
|
(1)
|
|
|
—
|
|
|
(1)
|
|
Proceeds from sale of businesses/assets
|
|
|
12
|
|
|
—
|
|
|
187
|
|
|
—
|
|
|
199
|
|
Decrease in receivable in affiliate
|
|
|
6
|
|
|
—
|
|
|
6
|
|
|
(6)
|
|
|
6
|
|
Change in restricted cash
|
|
|
—
|
|
|
—
|
|
|
1
|
|
|
—
|
|
|
1
|
|
Other, net
|
|
|
—
|
|
|
—
|
|
|
1
|
|
|
—
|
|
|
1
|
|
Net cash provided by (used in) investing activities from continuing operations
|
|
|
179
|
|
|
(95)
|
|
|
10
|
|
|
(206)
|
|
|
(112)
|
|
Net cash used in investing activities from discontinued operations
|
|
|
—
|
|
|
—
|
|
|
(83)
|
|
|
—
|
|
|
(83)
|
|
Net cash provided by (used in) investing activities
|
|
|
179
|
|
|
(95)
|
|
|
(73)
|
|
|
(206)
|
|
|
(195)
|
|
|
|
|
|
|
|
|
|
|
|
|
|
|
|
|
|
|
Financing activities:
|
|
|
|
|
|
|
|
|
|
|
|
|
|
|
|
|
Net repayments on overdraft facilities
|
|
$
|
—
|
|
$
|
—
|
|
$
|
(1)
|
|
$
|
—
|
|
$
|
(1)
|
|
Repayments of short-term debt
|
|
|
—
|
|
|
—
|
|
|
(56)
|
|
|
—
|
|
|
(56)
|
|
Borrowings on short-term debt
|
|
|
—
|
|
|
—
|
|
|
10
|
|
|
—
|
|
|
10
|
|
Repayments of long-term debt
|
|
|
(1,039)
|
|
|
—
|
|
|
(31)
|
|
|
—
|
|
|
(1,070)
|
|
Proceeds from issuance of long-term debt
|
|
|
543
|
|
|
—
|
|
|
16
|
|
|
—
|
|
|
559
|
|
Repayments of notes payable to affiliate
|
|
|
(7)
|
|
|
—
|
|
|
—
|
|
|
6
|
|
|
(1)
|
|
Repayments of notes payable
|
|
|
(31)
|
|
|
—
|
|
|
(2)
|
|
|
—
|
|
|
(33)
|
|
Borrowings on notes payable
|
|
|
29
|
|
|
—
|
|
|
2
|
|
|
—
|
|
|
31
|
|
Debt issuance costs paid
|
|
|
(9)
|
|
|
—
|
|
|
—
|
|
|
—
|
|
|
(9)
|
|
Call premiums related to early extinguishment of debt
|
|
|
(1)
|
|
|
—
|
|
|
—
|
|
|
—
|
|
|
(1)
|
|
Dividends paid to noncontrolling interests
|
|
|
—
|
|
|
—
|
|
|
(45)
|
|
|
15
|
|
|
(30)
|
|
Contribution from parent
|
|
|
—
|
|
|
3
|
|
|
11
|
|
|
(14)
|
|
|
—
|
|
Distribution to parent
|
|
|
—
|
|
|
(27)
|
|
|
(171)
|
|
|
198
|
|
|
—
|
|
Dividends paid to parent
|
|
|
(119)
|
|
|
(1)
|
|
|
—
|
|
|
1
|
|
|
(119)
|
|
Other, net
|
|
|
2
|
|
|
—
|
|
|
(3)
|
|
|
—
|
|
|
(1)
|
|
Net cash used in financing activities
|
|
|
(632)
|
|
|
(25)
|
|
|
(270)
|
|
|
206
|
|
|
(721)
|
|
Effect of exchange rate changes on cash from continuing operations
|
|
|
—
|
|
|
—
|
|
|
(6)
|
|
|
—
|
|
|
(6)
|
|
(Decrease) increase in cash and cash equivalents
|
|
|
(7)
|
|
|
—
|
|
|
163
|
|
|
—
|
|
|
156
|
|
Cash and cash equivalents from continuing operations at beginning of period
|
|
|
44
|
|
|
—
|
|
|
192
|
|
|
—
|
|
|
236
|
|
Cash and cash equivalents from discontinued operations at beginning of period
|
|
|
—
|
|
|
—
|
|
|
21
|
|
|
—
|
|
|
21
|
|
Cash and cash equivalents at end of period
|
|
$
|
37
|
|
$
|
—
|
|
$
|
376
|
|
$
|
—
|
|
$
|
413
|
During the second quarter of 2016 and the fourth quarter of 2016, we made noncash capital contributions of approximately $215 million and approximately $75 million, respectively, between Parent and certain Nonguarantors.
Table of Contents
HUNTSMAN CORPORATION AND SUBSIDIARIES
HUNTSMAN INTERNATIONAL LLC AND SUBSIDIARIES
NOTES TO CONSOLIDATED FINANCIAL STATEMENTS (Continued)
HUNTSMAN INTERNATIONAL LLC AND SUBSIDIARIES
CONDENSED CONSOLIDATING STATEMENTS OF CASH FLOWS
YEAR ENDED DECEMBER 31, 2015
(In Millions)
|
|
|
|
|
|
|
|
|
|
|
|
|
|
|
|
|
|
|
|
|
|
|
|
|
|
|
|
|
|
|
|
Consolidated
|
|
|
|
|
|
|
|
|
|
|
|
|
|
|
|
Huntsman
|
|
|
|
Parent
|
|
|
|
|
|
|
|
|
|
|
International
|
|
|
|
Company
|
|
Guarantors
|
|
Nonguarantors
|
|
Eliminations
|
|
LLC
|
|
Net cash provided by operating activities from continuing operations
|
|
$
|
(23)
|
|
$
|
229
|
|
$
|
410
|
|
$
|
(2)
|
|
$
|
614
|
|
Net cash used in operating activities from discontinued operations
|
|
|
—
|
|
|
—
|
|
|
(44)
|
|
|
—
|
|
|
(44)
|
|
Net cash provided by operating activities
|
|
|
(23)
|
|
|
229
|
|
|
366
|
|
|
(2)
|
|
|
570
|
|
Investing activities:
|
|
|
|
|
|
|
|
|
|
|
|
|
|
|
|
|
Capital expenditures
|
|
|
(70)
|
|
|
(200)
|
|
|
(191)
|
|
|
—
|
|
|
(461)
|
|
Investment in affiliate
|
|
|
34
|
|
|
(5)
|
|
|
(6)
|
|
|
(23)
|
|
|
—
|
|
Investment in unconsolidated affiliates
|
|
|
—
|
|
|
—
|
|
|
(12)
|
|
|
—
|
|
|
(12)
|
|
Acquisition of businesses, net of cash acquired
|
|
|
—
|
|
|
—
|
|
|
(14)
|
|
|
—
|
|
|
(14)
|
|
Proceeds from sale of businesses/assets
|
|
|
—
|
|
|
—
|
|
|
1
|
|
|
—
|
|
|
1
|
|
Decrease in receivable from affiliate
|
|
|
1
|
|
|
—
|
|
|
—
|
|
|
—
|
|
|
1
|
|
Cash received from purchase price adjustment for business acquired
|
|
|
18
|
|
|
—
|
|
|
—
|
|
|
—
|
|
|
18
|
|
Cash received from termination of cross-currency interest rate contracts
|
|
|
66
|
|
|
—
|
|
|
—
|
|
|
—
|
|
|
66
|
|
Change in restricted cash
|
|
|
—
|
|
|
—
|
|
|
(3)
|
|
|
—
|
|
|
(3)
|
|
Other, net
|
|
|
1
|
|
|
—
|
|
|
—
|
|
|
—
|
|
|
1
|
|
Net cash provided by (used in) investing activities from continuing operations
|
|
|
50
|
|
|
(205)
|
|
|
(225)
|
|
|
(23)
|
|
|
(403)
|
|
Net cash used in investing activities from discontinued operations
|
|
|
—
|
|
|
—
|
|
|
(196)
|
|
|
—
|
|
|
(196)
|
|
Net cash provided by (used in) investing activities
|
|
|
50
|
|
|
(205)
|
|
|
(421)
|
|
|
(23)
|
|
|
(599)
|
|
Financing activities:
|
|
|
|
|
|
|
|
|
|
|
|
|
|
|
|
|
Net repayments under revolving loan facilities
|
|
|
—
|
|
|
—
|
|
|
(1)
|
|
|
—
|
|
|
(1)
|
|
Net repayments on overdraft facilities
|
|
|
—
|
|
|
—
|
|
|
(8)
|
|
|
—
|
|
|
(8)
|
|
Borrowings on short-term debt
|
|
|
—
|
|
|
—
|
|
|
12
|
|
|
—
|
|
|
12
|
|
Repayments of long-term debt
|
|
|
(548)
|
|
|
—
|
|
|
(56)
|
|
|
—
|
|
|
(604)
|
|
Proceeds from issuance of long-term debt
|
|
|
326
|
|
|
—
|
|
|
—
|
|
|
—
|
|
|
326
|
|
Repayments of notes payable to affiliate
|
|
|
(148)
|
|
|
—
|
|
|
—
|
|
|
—
|
|
|
(148)
|
|
Proceeds from notes payable to affiliate
|
|
|
201
|
|
|
—
|
|
|
—
|
|
|
(6)
|
|
|
195
|
|
Repayments of notes payable
|
|
|
(32)
|
|
|
—
|
|
|
(1)
|
|
|
—
|
|
|
(33)
|
|
Borrowings on notes payable
|
|
|
32
|
|
|
—
|
|
|
2
|
|
|
—
|
|
|
34
|
|
Debt issuance costs paid
|
|
|
(8)
|
|
|
—
|
|
|
—
|
|
|
—
|
|
|
(8)
|
|
Call premiums related to early extinguishment of debt
|
|
|
(35)
|
|
|
—
|
|
|
—
|
|
|
—
|
|
|
(35)
|
|
Contingent consideration paid for acquisition
|
|
|
(4)
|
|
|
—
|
|
|
—
|
|
|
—
|
|
|
(4)
|
|
Dividends paid to noncontrolling interests
|
|
|
—
|
|
|
—
|
|
|
(20)
|
|
|
6
|
|
|
(14)
|
|
Contribution from parent
|
|
|
—
|
|
|
5
|
|
|
6
|
|
|
(11)
|
|
|
—
|
|
Distribution to parent
|
|
|
—
|
|
|
(27)
|
|
|
(7)
|
|
|
34
|
|
|
—
|
|
Dividends paid to parent
|
|
|
(121)
|
|
|
(2)
|
|
|
—
|
|
|
2
|
|
|
(121)
|
|
Other, net
|
|
|
1
|
|
|
—
|
|
|
—
|
|
|
—
|
|
|
1
|
|
Net cash used in financing activities
|
|
|
(336)
|
|
|
(24)
|
|
|
(73)
|
|
|
25
|
|
|
(408)
|
|
Effect of exchange rate changes on cash
|
|
|
—
|
|
|
—
|
|
|
(16)
|
|
|
—
|
|
|
(16)
|
|
Decrease in cash and cash equivalents
|
|
|
(309)
|
|
|
—
|
|
|
(144)
|
|
|
—
|
|
|
(453)
|
|
Cash and cash equivalents from continuing operations at beginning of period
|
|
|
353
|
|
|
—
|
|
|
322
|
|
|
—
|
|
|
675
|
|
Cash and cash equivalents from discontinued operations at beginning of period
|
|
|
—
|
|
|
—
|
|
|
35
|
|
|
—
|
|
|
35
|
|
Cash and cash equivalents at end of period
|
|
$
|
44
|
|
$
|
—
|
|
$
|
213
|
|
$
|
—
|
|
$
|
257
|
During the first quarter of 2015, we made a noncash capital contribution of approximately $284 million between Guarantor entities and Nonguarantor entities and a noncash capital contribution of approximately $123 million between Parent Company and Guarantor entities.
Table of Contents
HUNTSMAN CORPORATION AND SUBSIDIARIES
HUNTSMAN INTERNATIONAL LLC AND SUBSIDIARIES
NOTES TO CONSOLIDATED FINANCIAL STATEMENTS (Continued)
26. SELECTED UNAUDITED QUARTERLY FINANCIAL DATA
A summary of selected unaudited quarterly financial data for the years ended December 31, 2017 and 2016 is as follows (dollars in millions, except per share amounts):
Huntsman Corporation
|
|
|
|
|
|
|
|
|
|
|
|
|
|
|
|
|
Three months ended
|
|
|
|
March 31,
|
|
June 30,
|
|
September 30,
|
|
December 31,
|
|
|
|
2017
|
|
2017
|
|
2017
|
|
2017(1)
|
|
Revenues
|
|
$
|
1,932
|
|
$
|
2,054
|
|
$
|
2,169
|
|
$
|
2,203
|
|
Gross profit
|
|
|
392
|
|
|
437
|
|
|
474
|
|
|
509
|
|
Restructuring, impairment and plant closing costs
|
|
|
9
|
|
|
3
|
|
|
1
|
|
|
7
|
|
Income from continuing operations
|
|
|
99
|
|
|
138
|
|
|
116
|
|
|
230
|
|
Net income
|
|
|
92
|
|
|
183
|
|
|
179
|
|
|
287
|
|
Net income attributable to noncontrolling interests(2)
|
|
|
16
|
|
|
16
|
|
|
32
|
|
|
41
|
|
Net income attributable to Huntsman Corporation
|
|
|
76
|
|
|
167
|
|
|
147
|
|
|
246
|
|
Basic income per share(3):
|
|
|
|
|
|
|
|
|
|
|
|
|
|
Income from continuing operations attributable to Huntsman Corporation common stockholders
|
|
|
0.35
|
|
|
0.51
|
|
|
0.36
|
|
|
0.79
|
|
Net income attributable to Huntsman Corporation common stockholders
|
|
|
0.32
|
|
|
0.70
|
|
|
0.62
|
|
|
1.03
|
|
Diluted income per share(3):
|
|
|
|
|
|
|
|
|
|
|
|
|
|
Income from continuing operations attributable to Huntsman Corporation common stockholders
|
|
|
0.34
|
|
|
0.50
|
|
|
0.34
|
|
|
0.77
|
|
Net income attributable to Huntsman Corporation common stockholders
|
|
|
0.31
|
|
|
0.69
|
|
|
0.60
|
|
|
1.00
|
|
|
|
|
|
|
|
|
|
|
|
|
|
|
|
|
|
Three months ended
|
|
|
|
March 31,
|
|
June 30,
|
|
September 30,
|
|
December 31,
|
|
|
|
2016
|
|
2016
|
|
2016
|
|
2016(4)
|
|
Revenues
|
|
$
|
1,815
|
|
$
|
1,968
|
|
$
|
1,831
|
|
$
|
1,904
|
|
Gross profit
|
|
|
390
|
|
|
424
|
|
|
356
|
|
|
356
|
|
Restructuring, impairment and plant closing costs (credits)
|
|
|
2
|
|
|
16
|
|
|
38
|
|
|
(9)
|
|
Income from continuing operations
|
|
|
85
|
|
|
107
|
|
|
40
|
|
|
133
|
|
Net income
|
|
|
62
|
|
|
94
|
|
|
64
|
|
|
137
|
|
Net income attributable to noncontrolling interests(2)
|
|
|
6
|
|
|
7
|
|
|
9
|
|
|
9
|
|
Net income attributable to Huntsman Corporation
|
|
|
56
|
|
|
87
|
|
|
55
|
|
|
128
|
|
Basic income per share(3):
|
|
|
|
|
|
|
|
|
|
|
|
|
|
Income from continuing operations attributable to Huntsman Corporation common stockholders
|
|
|
0.33
|
|
|
0.42
|
|
|
0.13
|
|
|
0.52
|
|
Net income attributable to Huntsman Corporation common stockholders
|
|
|
0.24
|
|
|
0.37
|
|
|
0.23
|
|
|
0.54
|
|
Diluted income per share(3):
|
|
|
|
|
|
|
|
|
|
|
|
|
|
Income from continuing operations attributable to Huntsman Corporation common stockholders
|
|
|
0.33
|
|
|
0.42
|
|
|
0.13
|
|
|
0.51
|
|
Net income attributable to Huntsman Corporation common stockholders
|
|
|
0.24
|
|
|
0.36
|
|
|
0.23
|
|
|
0.53
|
Table of Contents
HUNTSMAN CORPORATION AND SUBSIDIARIES
HUNTSMAN INTERNATIONAL LLC AND SUBSIDIARIES
NOTES TO CONSOLIDATED FINANCIAL STATEMENTS (Continued)
Huntsman International
|
|
|
|
|
|
|
|
|
|
|
|
|
|
|
|
|
Three months ended
|
|
|
|
March 31,
|
|
June 30,
|
|
September 30,
|
|
December 31,
|
|
|
|
2017
|
|
2017
|
|
2017
|
|
2017(1)
|
|
Revenues
|
|
$
|
1,932
|
|
$
|
2,054
|
|
$
|
2,169
|
|
$
|
2,203
|
|
Gross profit
|
|
|
393
|
|
|
438
|
|
|
475
|
|
|
509
|
|
Restructuring, impairment and plant closing costs
|
|
|
9
|
|
|
3
|
|
|
1
|
|
|
7
|
|
Income from continuing operations
|
|
|
98
|
|
|
139
|
|
|
115
|
|
|
227
|
|
Net income
|
|
|
91
|
|
|
182
|
|
|
177
|
|
|
284
|
|
Net income attributable to noncontrolling interests(2)
|
|
|
16
|
|
|
16
|
|
|
32
|
|
|
41
|
|
Net income attributable to Huntsman International
|
|
|
75
|
|
|
166
|
|
|
145
|
|
|
243
|
|
|
|
|
|
|
|
|
|
|
|
|
|
|
|
|
|
Three months ended
|
|
|
|
March 31,
|
|
June 30,
|
|
September 30,
|
|
December 31,
|
|
|
|
2016
|
|
2016
|
|
2016
|
|
2016(4)
|
|
Revenues
|
|
$
|
1,815
|
|
$
|
1,968
|
|
$
|
1,831
|
|
$
|
1,904
|
|
Gross profit
|
|
|
391
|
|
|
425
|
|
|
357
|
|
|
357
|
|
Restructuring, impairment and plant closing costs (credits)
|
|
|
2
|
|
|
16
|
|
|
38
|
|
|
(9)
|
|
Income from continuing operations
|
|
|
85
|
|
|
109
|
|
|
41
|
|
|
132
|
|
Net income
|
|
|
62
|
|
|
93
|
|
|
63
|
|
|
136
|
|
Net income attributable to noncontrolling interests(2)
|
|
|
6
|
|
|
7
|
|
|
9
|
|
|
9
|
|
Net income attributable to Huntsman International
|
|
|
56
|
|
|
86
|
|
|
54
|
|
|
127
|
|
(1)
| |
On December 22, 2017, the U.S. enacted the U.S. Tax Reform Act. During the fourth quarter of 2017, we and Huntsman International recorded the impact of the U.S. Tax Reform Act which resulted in a net $52 million and $53 million, respectively, income tax benefit. |
|
(2)
| |
In connection with the Venator IPO in August 2017, we separated the P&A Business and, beginning in the third quarter of 2017, we reported the results of operations of the P&A Business as discontinued operations in our consolidated financial statements for all periods presented. See “Note 3. Discontinued Operations and Business Dispositions—Separation of P&A Business.” |
|
(3)
| |
Basic and diluted income per share are computed independently for each of the quarters presented based on the weighted average number of common shares outstanding during that period. Therefore, the sum of quarterly basic and diluted per share information may not equal annual basic and diluted earnings per share. |
|
(4)
| |
On December 30, 2016, our Performance Products segment completed the sale of its European surfactants business to Innospec Inc. for $199 million in cash plus our retention of trade receivables and payables for an enterprise value of $225 million. For further information, see “Note 3. Discontinued Operations and Business Dispositions—Sale of European Surfactants Manufacturing Facilities.” |
HUNTSMAN CORPORATION (PARENT ONLY)
Schedule I—Condensed Financial Information of Registrant
HUNTSMAN CORPORATION (Parent Only)
BALANCE SHEETS
(In Millions, Except Share and Per Share Amounts)
|
|
|
|
|
|
|
|
|
|
|
December 31,
|
|
|
|
2017
|
|
2016
|
|
ASSETS
|
|
|
|
|
|
|
|
Cash and cash equivalents
|
|
$
|
2
|
|
$
|
1
|
|
Prepaid assets
|
|
|
1
|
|
|
—
|
|
Receivable from affiliate
|
|
|
54
|
|
|
36
|
|
Note receivable from affiliate
|
|
|
100
|
|
|
100
|
|
Total current assets
|
|
|
157
|
|
|
137
|
|
Note receivable from affiliate-long-term
|
|
|
742
|
|
|
696
|
|
Investment in and advances to affiliates
|
|
|
2,082
|
|
|
781
|
|
Total assets
|
|
$
|
2,981
|
|
$
|
1,614
|
|
LIABILITIES AND STOCKHOLDERS’ EQUITY
|
|
|
|
|
|
|
|
Payable to affiliate
|
|
$
|
346
|
|
$
|
315
|
|
Accrued liabilities
|
|
|
3
|
|
|
2
|
|
Total current liabilities
|
|
|
349
|
|
|
317
|
|
Other long-term liabilities
|
|
|
12
|
|
|
10
|
|
Total liabilities
|
|
|
361
|
|
|
327
|
|
STOCKHOLDERS’ EQUITY
|
|
|
|
|
|
|
|
Common stock $0.01 par value, 1,200,000,000 shares authorized, 252,759,715 and 250,802,175 shares issued and 240,213,606 and 236,370,347 shares outstanding, respectively
|
|
|
3
|
|
|
3
|
|
Additional paid-in capital
|
|
|
3,889
|
|
|
3,447
|
|
Treasury stock, 12,607,223 shares
|
|
|
(150)
|
|
|
(150)
|
|
Unearned stock-based compensation
|
|
|
(15)
|
|
|
(17)
|
|
Accumulated deficit
|
|
|
161
|
|
|
(325)
|
|
Accumulated other comprehensive loss
|
|
|
(1,268)
|
|
|
(1,671)
|
|
Total stockholders’ equity
|
|
|
2,620
|
|
|
1,287
|
|
Total liabilities and stockholders’ equity
|
|
$
|
2,981
|
|
$
|
1,614
|
This statement should be read in conjunction with the notes to the consolidated financial statements.
HUNTSMAN CORPORATION (Parent Only)
STATEMENTS OF OPERATIONS
(In Millions)
|
|
|
|
|
|
|
|
|
|
|
|
|
|
|
|
|
|
Year ended December 31,
|
|
|
|
2017
|
|
2016
|
|
2015
|
|
Selling, general and administrative expenses
|
|
$
|
(4)
|
|
$
|
(4)
|
|
$
|
(5)
|
|
Interest income
|
|
|
16
|
|
|
12
|
|
|
9
|
|
Equity in income (loss) of subsidiaries
|
|
|
504
|
|
|
199
|
|
|
(32)
|
|
Dividend income—affiliate
|
|
|
120
|
|
|
119
|
|
|
121
|
|
Net income
|
|
$
|
636
|
|
$
|
326
|
|
$
|
93
|
This statement should be read in conjunction with the notes to the consolidated financial statements.
HUNTSMAN CORPORATION (Parent Only)
STATEMENTS OF COMPREHENSIVE INCOME (LOSS)
(In Millions)
|
|
|
|
|
|
|
|
|
|
|
|
|
|
Year ended December 31,
|
|
|
|
2017
|
|
2016
|
|
2015
|
|
Net income
|
|
$
|
636
|
|
$
|
326
|
|
$
|
93
|
|
Other comprehensive income (loss), net of tax:
|
|
|
|
|
|
|
|
|
|
|
Foreign currency translations adjustments
|
|
|
210
|
|
|
(171)
|
|
|
(313)
|
|
Pension and other postretirement benefits adjustments
|
|
|
86
|
|
|
(219)
|
|
|
66
|
|
Other, net
|
|
|
105
|
|
|
30
|
|
|
40
|
|
Other comprehensive income (loss), net of tax
|
|
|
401
|
|
|
(360)
|
|
|
(207)
|
|
Comprehensive loss
|
|
|
1,037
|
|
|
(34)
|
|
|
(114)
|
|
Comprehensive income attributable to noncontrolling interests
|
|
|
(127)
|
|
|
(23)
|
|
|
(28)
|
|
Comprehensive income (loss) attributable to Huntsman Corporation
|
|
$
|
910
|
|
$
|
(57)
|
|
$
|
(142)
|
This statement should be read in conjunction with the notes to the consolidated financial statements.
HUNTSMAN CORPORATION (Parent Only)
STATEMENTS OF STOCKHOLDERS’ EQUITY
(In Millions, Except Share Amounts)
|
|
|
|
|
|
|
|
|
|
|
|
|
|
|
|
|
|
|
|
|
|
|
|
|
|
|
|
Huntsman Corporation Stockholders’ Equity
|
|
|
|
|
|
|
|
|
|
|
|
|
|
|
|
|
|
|
|
|
Retained
|
|
Accumulated
|
|
|
|
|
|
|
Shares
|
|
|
|
|
Additional
|
|
|
|
|
Unearned
|
|
earnings
|
|
other
|
|
|
|
|
|
|
Common
|
|
Common
|
|
paid-in
|
|
Treasury
|
|
stock-based
|
|
(accumulated
|
|
comprehensive
|
|
Total
|
|
|
|
stock
|
|
stock
|
|
capital
|
|
stock
|
|
compensation
|
|
deficit)
|
|
loss
|
|
equity
|
|
Beginning balance, January 1, 2015
|
|
243,416,979
|
|
$
|
3
|
|
$
|
3,385
|
|
$
|
(50)
|
|
$
|
(14)
|
|
$
|
(493)
|
|
$
|
(1,053)
|
|
$
|
1,778
|
|
Net income
|
|
—
|
|
|
—
|
|
|
—
|
|
|
—
|
|
|
—
|
|
|
93
|
|
|
—
|
|
|
93
|
|
Other comprehensive loss
|
|
—
|
|
|
—
|
|
|
—
|
|
|
—
|
|
|
—
|
|
|
—
|
|
|
(235)
|
|
|
(235)
|
|
Issuance of nonvested stock awards
|
|
—
|
|
|
—
|
|
|
19
|
|
|
—
|
|
|
(19)
|
|
|
—
|
|
|
—
|
|
|
—
|
|
Vesting of stock awards
|
|
1,037,743
|
|
|
—
|
|
|
7
|
|
|
—
|
|
|
—
|
|
|
—
|
|
|
—
|
|
|
7
|
|
Recognition of stock-based compensation
|
|
—
|
|
|
—
|
|
|
10
|
|
|
—
|
|
|
16
|
|
|
—
|
|
|
—
|
|
|
26
|
|
Repurchase and cancellation of stock awards
|
|
(304,340)
|
|
|
—
|
|
|
—
|
|
|
—
|
|
|
—
|
|
|
(7)
|
|
|
—
|
|
|
(7)
|
|
Stock options exercised
|
|
48,572
|
|
|
—
|
|
|
1
|
|
|
—
|
|
|
—
|
|
|
—
|
|
|
—
|
|
|
1
|
|
Excess tax benefit related to stock-based compensation
|
|
—
|
|
|
—
|
|
|
1
|
|
|
—
|
|
|
—
|
|
|
—
|
|
|
—
|
|
|
1
|
|
Cash paid for noncontrolling interest
|
|
—
|
|
|
—
|
|
|
(1)
|
|
|
—
|
|
|
—
|
|
|
—
|
|
|
—
|
|
|
(1)
|
|
Treasury stock repurchased
|
|
(7,118,928)
|
|
|
—
|
|
|
(15)
|
|
|
(85)
|
|
|
—
|
|
|
—
|
|
|
—
|
|
|
(100)
|
|
Dividends declared on common stock
|
|
—
|
|
|
—
|
|
|
—
|
|
|
—
|
|
|
—
|
|
|
(121)
|
|
|
—
|
|
|
(121)
|
|
Balance, December 31, 2015
|
|
237,080,026
|
|
|
3
|
|
|
3,407
|
|
|
(135)
|
|
|
(17)
|
|
|
(528)
|
|
|
(1,288)
|
|
|
1,442
|
|
Net income
|
|
—
|
|
|
—
|
|
|
—
|
|
|
—
|
|
|
—
|
|
|
326
|
|
|
—
|
|
|
326
|
|
Other comprehensive loss
|
|
—
|
|
|
—
|
|
|
—
|
|
|
—
|
|
|
—
|
|
|
—
|
|
|
(383)
|
|
|
(383)
|
|
Issuance of nonvested stock awards
|
|
—
|
|
|
—
|
|
|
16
|
|
|
—
|
|
|
(16)
|
|
|
—
|
|
|
—
|
|
|
—
|
|
Vesting of stock awards
|
|
914,081
|
|
|
—
|
|
|
2
|
|
|
—
|
|
|
—
|
|
|
—
|
|
|
—
|
|
|
2
|
|
Recognition of stock-based compensation
|
|
—
|
|
|
—
|
|
|
9
|
|
|
—
|
|
|
16
|
|
|
—
|
|
|
—
|
|
|
25
|
|
Repurchase and cancellation of stock awards
|
|
(256,468)
|
|
|
—
|
|
|
—
|
|
|
—
|
|
|
—
|
|
|
(3)
|
|
|
—
|
|
|
(3)
|
|
Stock options exercised
|
|
77,477
|
|
|
—
|
|
|
1
|
|
|
—
|
|
|
—
|
|
|
—
|
|
|
—
|
|
|
1
|
|
Excess tax benefit related to stock-based compensation
|
|
—
|
|
|
—
|
|
|
(3)
|
|
|
—
|
|
|
—
|
|
|
—
|
|
|
—
|
|
|
(3)
|
|
Treasury stock repurchased
|
|
(1,444,769)
|
|
|
—
|
|
|
15
|
|
|
(15)
|
|
|
—
|
|
|
—
|
|
|
—
|
|
|
—
|
|
Dividends declared on common stock
|
|
—
|
|
|
—
|
|
|
—
|
|
|
—
|
|
|
—
|
|
|
(120)
|
|
|
—
|
|
|
(120)
|
|
Balance, December 31, 2016
|
|
236,370,347
|
|
|
3
|
|
|
3,447
|
|
|
(150)
|
|
|
(17)
|
|
|
(325)
|
|
|
(1,671)
|
|
|
1,287
|
|
Net income
|
|
—
|
|
|
—
|
|
|
—
|
|
|
—
|
|
|
—
|
|
|
636
|
|
|
—
|
|
|
636
|
|
Other comprehensive income
|
|
—
|
|
|
—
|
|
|
—
|
|
|
—
|
|
|
—
|
|
|
—
|
|
|
403
|
|
|
403
|
|
Issuance of nonvested stock awards
|
|
—
|
|
|
—
|
|
|
18
|
|
|
—
|
|
|
(18)
|
|
|
—
|
|
|
—
|
|
|
—
|
|
Vesting of stock awards
|
|
1,316,975
|
|
|
—
|
|
|
8
|
|
|
—
|
|
|
—
|
|
|
—
|
|
|
—
|
|
|
8
|
|
Recognition of stock-based compensation
|
|
—
|
|
|
—
|
|
|
10
|
|
|
—
|
|
|
18
|
|
|
—
|
|
|
—
|
|
|
28
|
|
Repurchase and cancellation of stock awards
|
|
(402,978)
|
|
|
—
|
|
|
—
|
|
|
—
|
|
|
—
|
|
|
(12)
|
|
|
—
|
|
|
(12)
|
|
Contribution from noncontrolling interests
|
|
—
|
|
|
—
|
|
|
—
|
|
|
—
|
|
|
—
|
|
|
—
|
|
|
—
|
|
|
—
|
|
Dividends paid to noncontrolling interests
|
|
—
|
|
|
—
|
|
|
—
|
|
|
—
|
|
|
—
|
|
|
—
|
|
|
—
|
|
|
—
|
|
Disposition of a portion of P&A Business
|
|
—
|
|
|
—
|
|
|
413
|
|
|
—
|
|
|
—
|
|
|
—
|
|
|
—
|
|
|
413
|
|
Costs of the IPO and secondary offering of the P&A Business
|
|
—
|
|
|
—
|
|
|
(58)
|
|
|
—
|
|
|
—
|
|
|
—
|
|
|
—
|
|
|
(58)
|
|
Conversion of restricted awards to P&A Business awards
|
|
—
|
|
|
—
|
|
|
(2)
|
|
|
—
|
|
|
2
|
|
|
—
|
|
|
—
|
|
|
—
|
|
Minority interest on disposal of P&A Business
|
|
—
|
|
|
—
|
|
|
—
|
|
|
—
|
|
|
—
|
|
|
—
|
|
|
—
|
|
|
—
|
|
Stock options exercised
|
|
2,929,262
|
|
|
—
|
|
|
53
|
|
|
—
|
|
|
—
|
|
|
(18)
|
|
|
—
|
|
|
35
|
|
Dividends declared on common stock
|
|
—
|
|
|
—
|
|
|
—
|
|
|
—
|
|
|
—
|
|
|
(120)
|
|
|
—
|
|
|
(120)
|
|
Balance, December 31, 2017
|
|
240,213,606
|
|
$
|
3
|
|
$
|
3,889
|
|
$
|
(150)
|
|
$
|
(15)
|
|
$
|
161
|
|
$
|
(1,268)
|
|
$
|
2,620
|
This statement should be read in conjunction with the notes to the consolidated financial statements.
HUNTSMAN CORPORATION (Parent Only)
STATEMENTS OF CASH FLOWS
(In Millions)
|
|
|
|
|
|
|
|
|
|
|
|
|
|
Year ended December 31,
|
|
|
|
2017
|
|
2016
|
|
2015
|
|
Operating Activities:
|
|
|
|
|
|
|
|
|
|
|
Net income
|
|
$
|
636
|
|
$
|
326
|
|
$
|
93
|
|
Equity in (income) loss of subsidiaries
|
|
|
(504)
|
|
|
(199)
|
|
|
32
|
|
Stock-based compensation
|
|
|
1
|
|
|
1
|
|
|
1
|
|
Noncash interest income
|
|
|
(16)
|
|
|
(12)
|
|
|
(9)
|
|
Changes in operating assets and liabilities
|
|
|
13
|
|
|
12
|
|
|
8
|
|
Net cash provided by operating activities
|
|
|
130
|
|
|
128
|
|
|
125
|
|
Investing Activities:
|
|
|
|
|
|
|
|
|
|
|
Loan to affiliate
|
|
|
(47)
|
|
|
—
|
|
|
(195)
|
|
Repayments of loan by affiliate
|
|
|
—
|
|
|
1
|
|
|
148
|
|
Net cash (used in) provided by investing activities
|
|
|
(47)
|
|
|
1
|
|
|
(47)
|
|
Financing Activities:
|
|
|
|
|
|
|
|
|
|
|
Dividends paid to common stockholders
|
|
|
(120)
|
|
|
(120)
|
|
|
(121)
|
|
Repurchase and cancellation of stock awards
|
|
|
(12)
|
|
|
(3)
|
|
|
(7)
|
|
Proceeds from issuance of common stock
|
|
|
35
|
|
|
1
|
|
|
1
|
|
Repurchase of common stock
|
|
|
—
|
|
|
—
|
|
|
(100)
|
|
Increase (decrease) in payable to affiliates
|
|
|
15
|
|
|
(6)
|
|
|
(1)
|
|
Net cash used in financing activities
|
|
|
(82)
|
|
|
(128)
|
|
|
(228)
|
|
Increase (decrease) in cash and cash equivalents
|
|
|
1
|
|
|
1
|
|
|
(150)
|
|
Cash and cash equivalents at beginning of period
|
|
|
1
|
|
|
—
|
|
|
150
|
|
Cash and cash equivalents at end of period
|
|
$
|
2
|
|
$
|
1
|
|
$
|
—
|
This statement should be read in conjunction with the notes to the consolidated financial statements.
HUNTSMAN CORPORATION AND SUBSIDIARIES
Schedule II—Valuation and Qualifying Accounts
(In Millions)
|
|
|
|
|
|
|
|
|
|
|
|
|
|
|
|
|
|
Column A
|
|
Column B
|
|
Column C
|
|
|
|
|
Column D
|
|
Column E
|
|
|
|
|
|
Additions
|
|
|
|
|
|
|
|
|
|
|
|
Charges
|
|
|
|
|
|
|
|
|
|
Balance at
|
|
(credits)
|
|
Charged
|
|
|
|
Balance
|
|
|
|
Beginning
|
|
to cost and
|
|
to other
|
|
|
|
at End
|
|
Description
|
|
of Period
|
|
expenses
|
|
accounts
|
|
Deductions
|
|
of Period
|
|
Allowance for doubtful accounts:
|
|
|
|
|
|
|
|
|
|
|
|
|
|
|
|
|
Year ended December 31, 2017
|
|
$
|
23
|
|
$
|
3
|
|
$
|
(1)
|
|
$
|
—
|
|
$
|
25
|
|
Year ended December 31, 2016
|
|
|
22
|
|
|
2
|
|
|
(1)
|
|
$
|
—
|
|
|
23
|
|
Year ended December 31, 2015
|
|
|
27
|
|
|
1
|
|
|
(6)
|
|
|
—
|
|
|
22
|
HUNTSMAN INTERNATIONAL LLC AND SUBSIDIARIES
Schedule II—Valuation and Qualifying Accounts
(In Millions)
|
|
|
|
|
|
|
|
|
|
|
|
|
|
|
|
|
|
Column A
|
|
Column B
|
|
Column C
|
|
|
|
Column D
|
|
Column E
|
|
|
|
|
|
Additions
|
|
|
|
|
|
|
|
|
|
|
|
Charges
|
|
|
|
|
|
|
|
|
|
Balance at
|
|
(credits)
|
|
Charged
|
|
|
|
Balance
|
|
|
|
Beginning
|
|
to cost and
|
|
to other
|
|
|
|
at End
|
|
Description
|
|
of Period
|
|
expenses
|
|
accounts
|
|
Deductions
|
|
of Period
|
|
Allowance for doubtful accounts:
|
|
|
|
|
|
|
|
|
|
|
|
|
|
|
|
|
Year ended December 31, 2017
|
|
$
|
23
|
|
$
|
3
|
|
$
|
(1)
|
|
$
|
—
|
|
$
|
25
|
|
Year ended December 31, 2016
|
|
|
22
|
|
|
2
|
|
|
(1)
|
|
$
|
—
|
|
|
23
|
|
Year ended December 31, 2015
|
|
|
27
|
|
|
1
|
|
|
(6)
|
|
|
—
|
|
|
22
|