
| FOR IMMEDIATE RELEASE | Media Contact: | Finance Contact: | ||
| November 10, 2003 | Don Olsen | Kimo Esplin | ||
| (703) 741-5885 | (801) 584-5700 |
HUNTSMAN RELEASES THIRD QUARTER RESULTS
EARNINGS STABILIZE AS COMPANY ANNOUNCES
$200 MILLION COST REDUCTION PROGRAM
HUNTSMAN
LLC AND HUNTSMAN INTERNATIONAL
TAKE MEASURES TO STRENGTHEN LIQUIDITY
Houston, TX—The combined Huntsman companies today reported third quarter 2003 EBITDA of $170.0 million, which includes $10.7 million in restructuring charges and losses on the sale of accounts receivable. This compares to second quarter 2003 pro forma EBITDA of $136.3 million and third quarter 2002 pro forma EBITDA of $210.5 million, which included $53.7 million and $16.0 million, respectively, of restructuring charges and losses on the sale of accounts receivable.
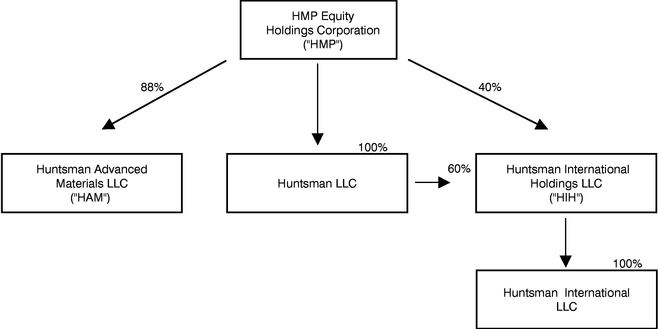
The combined Huntsman companies include HMP Equity Holdings Corporation ("HMP"), and its operating subsidiaries Huntsman LLC, Huntsman International Holdings LLC ("Huntsman International" or "HIH") and Huntsman Advanced Materials LLC ("Advanced Materials" or "HAM").
Peter R. Huntsman, President and CEO, stated, "We are pleased that EBITDA at the Huntsman companies stabilized in the third quarter relative to second quarter at a time when earnings in our industry generally have been soft. We believe this reflects the strength of our differentiated product portfolio and our vigilance in managing costs as the chemical industry remains in the trough of the cycle."
Mr. Huntsman also said the Huntsman companies have commenced an initiative to reduce fixed costs by a minimum of $200 million over the next eighteen months. He further stated the current conditions in the chemical industry present the Huntsman companies with "an opportunity to reposition our businesses at the bottom of the cycle to ensure their long-term competitiveness and profitability." Each of the six Huntsman business segments, Polyurethanes, Advanced Materials, Performance Products, Pigments, Base Chemicals and Polymers, has developed cost reduction plans to meet the overall minimum $200 million goal. The Company also plans to reduce costs by increasing the use of shared services across its businesses. The Company expects to make additional announcements of site consolidations and headcount reductions in the near future.
The Huntsman companies completed a $380 million offering of senior secured notes at Huntsman LLC in the third quarter and raised $205 million of additional Term B and Term C loans at Huntsman International in October. Proceeds from these transactions have allowed Huntsman to make significant pre-payments of term debt maturities and significant payments under the revolving credit facilities of both companies, freeing up substantial amounts of liquidity as trough conditions persist in the industry.
Huntsman Companies Abbreviated Organization Chart
HMP Equity Holdings Corporation Quarterly Results
Three Months Ended September 30, 2003
| |
Huntsman LLC (Excl. HIH)(1) |
Huntsman International Holdings |
Huntsman Advanced Materials |
HMP/ Other |
Eliminations |
HMP Consolidated |
|||||||||||||
|---|---|---|---|---|---|---|---|---|---|---|---|---|---|---|---|---|---|---|---|
| |
In Millions |
||||||||||||||||||
| Revenues | $ | 828.9 | $ | 1,275.7 | $ | 257.8 | $ | — | $ | (61.2 | ) | $ | 2,301.2 | ||||||
| Gross profit | 53.6 | 146.5 | 58.4 | (2.9 | ) | (3.4 | ) | 252.2 | |||||||||||
| SG&A/Other expenses | 36.4 | 100.4 | 52.9 | 0.7 | — | 190.4 | |||||||||||||
| Restructuring expenses | — | 4.8 | — | — | — | 4.8 | |||||||||||||
| Operating income (loss) | 17.2 | 41.3 | 5.5 | (3.6 | ) | (3.4 | ) | 57.0 | |||||||||||
Net loss |
(24.7 |
) |
(46.6 |
) |
(4.9 |
) |
(8.1 |
) |
(4.3 |
) |
(88.6 |
) |
|||||||
| Interest expense—net | 34.7 | 88.4 | 10.3 | 5.0 | 0.9 | 139.3 | |||||||||||||
| Income tax expense (benefit) | 7.4 | (5.3 | ) | — | 0.1 | — | 2.2 | ||||||||||||
| Depreciation and amortization | 32.3 | 67.7 | 10.8 | 2.9 | 3.4 | 117.1 | |||||||||||||
| EBITDA(2)(3) | $ | 49.7 | $ | 104.2 | $ | 16.2 | $ | (0.1 | ) | $ | — | $ | 170.0 | ||||||
2
| |
Huntsman LLC (Excl. HIH) |
Huntsman International Holdings |
Huntsman Advanced Materials |
HMP/Other |
Eliminations |
HMP Consolidated |
|||||||||||||
|---|---|---|---|---|---|---|---|---|---|---|---|---|---|---|---|---|---|---|---|
| Foreign exchange gains (losses)- unallocated | $ | (0.9 | ) | $ | 8.7 | $ | 2.3 | $ | — | $ | — | $ | 10.1 | ||||||
| Purchase acctg. adj.—inventory valuation | — | — | (1.0 | ) | — | — | (1.0 | ) | |||||||||||
| Loss on sale of accounts receivable | — | (5.9 | ) | — | — | — | (5.9 | ) | |||||||||||
| Restructuring expenses | — | (4.8 | ) | — | — | — | (4.8 | ) | |||||||||||
As a result of HMP's acquisition of the 39% minority interest in Huntsman International on May 9, 2003 (HMP now directly and indirectly owns 100% of Huntsman International), HMP's financial results include the consolidated results of Huntsman International for the periods from May 2003. In prior periods, the combined Huntsman companies' results included their share of the equity income from Huntsman International. HMP's financial results also include the consolidated results of Huntsman Chemical Company Australia ("HCCA") from October 2002 forward and the equity income from HCCA for all prior periods. On June 30, 2003, HMP and its parent company, Huntsman Holdings LLC, completed the acquisition of Vantico Group S.A. ("Vantico"). Advanced Materials was formed to hold the Vantico business. As a result of the Vantico acquisition, HMP's financial results include the results of Vantico from July 2003. The following pro forma information is provided to show HMP financial results as if Huntsman International, HCCA and Advanced Materials were consolidated for all periods presented and Huntsman LLC financial results as if HCCA was consolidated for all periods presented.
Huntsman Financial Summary (Pro forma)(1)
| |
Three Months Ended Sept. 30, 2003 |
Three Months Ended Sept. 30, 2002 |
Nine Months Ended Sept. 30, 2003 |
Nine Months Ended Sept. 30, 2002 |
|||||||||
|---|---|---|---|---|---|---|---|---|---|---|---|---|---|
| |
In Millions |
||||||||||||
| HMP Consolidated: | |||||||||||||
| Revenues | $ | 2,301.2 | $ | 2,112.6 | $ | 6,882.0 | $ | 5,984.6 | |||||
| EBITDA(2) | 170.0 | 210.5 | 426.8 | 604.4 | |||||||||
Huntsman LLC (excluding HIH)(3): |
|||||||||||||
| Revenues | 828.9 | 730.5 | 2,431.5 | 2,068.5 | |||||||||
| EBITDA(2) | 49.7 | 70.0 | 129.1 | 200.3 | |||||||||
Huntsman International: |
|||||||||||||
| Revenues | 1,275.7 | 1,195.2 | 3,880.8 | 3,368.1 | |||||||||
| EBITDA(2) | 104.2 | 131.0 | 276.3 | 363.3 | |||||||||
Huntsman Advanced Materials: |
|||||||||||||
| Revenues | 257.8 | 241.2 | 789.5 | 714.9 | |||||||||
| EBITDA(2)(4) | 16.2 | 6.5 | 19.6 | 33.1 | |||||||||
3
| |
Three Months Ended Sept. 30, 2003 |
Three Months Ended Sept. 30, 2002 |
Nine Months Ended Sept. 30, 2003 |
Nine Months Ended Sept. 30, 2002 |
||||||||||
|---|---|---|---|---|---|---|---|---|---|---|---|---|---|---|
| Foreign exchange gains (losses)—unallocated | ||||||||||||||
| Huntsman International | $ | 8.7 | $ | 4.1 | $ | 25.3 | $ | 29.0 | ||||||
| Huntsman LLC (excluding HIH) | (0.9 | ) | (1.0 | ) | 7.0 | (0.4 | ) | |||||||
| Huntsman Advanced Materials | 2.3 | (1.5 | ) | 2.2 | (7.7 | ) | ||||||||
| Loss on sale of accounts receivable | ||||||||||||||
| Huntsman International | (5.9 | ) | (4.2 | ) | (24.0 | ) | (4.3 | ) | ||||||
| Contract termination costs—net | ||||||||||||||
| Huntsman Advanced Materials | (0.8 | ) | ||||||||||||
| Asset write-down | ||||||||||||||
| Huntsman International | (2.8 | ) | ||||||||||||
| Purchase acctg. adj.—inventory valuation | ||||||||||||||
| Huntsman Advanced Materials | (1.0 | ) | (1.0 | ) | ||||||||||
| Restructuring expenses | ||||||||||||||
| Huntsman International | (4.8 | ) | (1.1 | ) | (43.4 | ) | (1.1 | ) | ||||||
| Huntsman LLC (excluding HIH) | 3.7 | (0.9 | ) | 3.7 | ||||||||||
| Reorganization expenses | ||||||||||||||
| Huntsman LLC (excluding HIH) | (8.5 | ) | (15.5 | ) | ||||||||||
| Huntsman Advanced Materials | (5.9 | ) | (28.0 | ) | (7.6 | ) | ||||||||
4
HMP Equity Holdings Corporation
| |
Three Months Ended Sept 30, 2003 |
Three Months Ended Sept 30, 2002 |
Nine Months Ended Sept 30, 2003 |
Nine Months Ended Sept 30, 2002 |
||||||||||
|---|---|---|---|---|---|---|---|---|---|---|---|---|---|---|
| |
In Millions |
|||||||||||||
| Revenues | $ | 2,301.2 | $ | 691.8 | $ | 4,710.1 | $ | 1,964.6 | ||||||
| Gross profit | 252.2 | 72.5 | 454.7 | 201.5 | ||||||||||
| SG&A / Other expenses | 190.4 | 47.8 | 337.7 | 126.2 | ||||||||||
| Restructuring expenses (credits) | 4.8 | (3.7 | ) | 27.2 | (3.7 | ) | ||||||||
| Operating income | 57.0 | 28.4 | 89.8 | 79.0 | ||||||||||
| Net income (loss) | (88.6 | ) | (59.9 | ) | (231.2 | ) | 28.3 | |||||||
| Interest expense—net | 139.3 | 68.6 | 261.4 | 171.0 | ||||||||||
| Income tax expense (benefit) | 2.2 | 7.2 | (4.0 | ) | 7.2 | |||||||||
| Depreciation and amortization | 117.1 | 38.1 | 227.8 | 113.9 | ||||||||||
| Cumulative effect of accounting change | — | — | — | (169.7 | ) | |||||||||
| EBITDA(1) (3) | $ | 170.0 | $ | 54.0 | $ | 254.0 | $ | 150.7 | ||||||
| Pro forma EBITDA(2) | $ | 170.0 | $ | 210.5 | $ | 426.8 | $ | 604.4 | ||||||
| |
Three Months Ended Sept 30, 2003 |
Three Months Ended Sept 30, 2002 |
Nine Months Ended Sept 30, 2003 |
Nine Months Ended Sept 30, 2002 |
|||||||||
|---|---|---|---|---|---|---|---|---|---|---|---|---|---|
| Foreign exchange gains (losses)- unallocated | $ | 10.1 | $ | 1.1 | $ | 28.2 | $ | 0.4 | |||||
| Loss on sale of accounts receivable | (5.9 | ) | (12.3 | ) | |||||||||
| Contract termination costs—net | (0.8 | ) | |||||||||||
| Purchase acctg. adj.—inventory valuation | (1.0 | ) | (1.0 | ) | |||||||||
| Restructuring expenses | (4.8 | ) | 3.7 | (27.2 | ) | 3.7 | |||||||
| Reorganization expenses | (8.5 | ) | (15.5 | ) | |||||||||
5
HMP Equity Holdings Corporation Pro Forma EBITDA
| |
Three Months Ended Sept 30, 2003 |
Three Months Ended Sept 30, 2002 |
Nine Months Ended Sept 30, 2003 |
Nine Months Ended Sept 30, 2002 |
|||||||||
|---|---|---|---|---|---|---|---|---|---|---|---|---|---|
| |
In Millions |
||||||||||||
| HMP EBITDA(1) | $ | 170.0 | $ | 54.0 | $ | 254.0 | $ | 150.7 | |||||
Pro forma adjustments: |
|||||||||||||
| HIH EBITDA(2) | — | 131.0 | 113.2 | 363.3 | |||||||||
| HAM EBITDA(3) | — | 6.5 | 3.4 | 33.1 | |||||||||
| HCCA EBITDA(4) | — | 2.9 | — | 6.6 | |||||||||
| Equity (income) loss adjustment(5) | — | (1.3 | ) | 52.5 | 14.2 | ||||||||
| Minority interest—LLC(6) | — | 14.4 | — | 28.8 | |||||||||
| Minority interest—HAM(7) | — | 3.0 | 3.7 | 7.7 | |||||||||
| HMP pro forma EBITDA(9) | $ | 170.0 | $ | 210.5 | $ | 426.8 | $ | 604.4 | |||||
| HIH | $ | 104.2 | $ | 131.0 | $ | 276.3 | $ | 363.3 | |||||
| Huntsman LLC (excluding HIH)(8) | 49.7 | 70.0 | 129.1 | 200.3 | |||||||||
| HAM | 16.2 | 6.5 | 19.6 | 33.1 | |||||||||
| HMP (parent only) | (0.1 | ) | 3.0 | 1.8 | 7.7 | ||||||||
| HMP pro forma EBITDA(9) | $ | 170.0 | $ | 210.5 | $ | 426.8 | $ | 604.4 | |||||
6
| |
Three Months Ended Sept. 30, 2003 |
Three Months Ended Sept. 30, 2002 |
Nine Months Ended Sept. 30, 2003 |
Nine Months Ended Sept. 30, 2002 |
||||||||||
|---|---|---|---|---|---|---|---|---|---|---|---|---|---|---|
| Foreign exchange gains (losses)—unallocated | ||||||||||||||
| Huntsman International | $ | 8.7 | $ | 4.1 | $ | 25.3 | $ | 29.0 | ||||||
| Huntsman LLC (excluding HIH) | (0.9 | ) | (1.0 | ) | 7.0 | (0.4 | ) | |||||||
| Huntsman Advanced Materials | 2.3 | (1.5 | ) | 2.2 | (7.7 | ) | ||||||||
| Loss on sale of accounts receivable | ||||||||||||||
| Huntsman International | (5.9 | ) | (4.2 | ) | (24.0 | ) | (4.3 | ) | ||||||
| Contract termination costs—net | ||||||||||||||
| Huntsman Advanced Materials | (0.8 | ) | ||||||||||||
| Asset write-down | ||||||||||||||
| Huntsman International | (2.8 | ) | ||||||||||||
| Purchase acctg. adj.—inventory valuation | ||||||||||||||
| Huntsman Advanced Materials | (1.0 | ) | (1.0 | ) | ||||||||||
| Restructuring expenses | ||||||||||||||
| Huntsman International | (4.8 | ) | (1.1 | ) | (43.4 | ) | (1.1 | ) | ||||||
| Huntsman LLC (excluding HIH) | 3.7 | (0.9 | ) | 3.7 | ||||||||||
| Reorganization expenses | ||||||||||||||
| Huntsman LLC (excluding HIH) | (8.5 | ) | (15.5 | ) | ||||||||||
| Huntsman Advanced Materials | (5.9 | ) | (28.0 | ) | (7.6 | ) | ||||||||
7
HMP Equity Holdings Corporation
Pro forma Operating Results
| |
Three Months Ended Sept. 30, 2003 |
Three Months Ended Sept. 30, 2002(1) |
Nine Months Ended Sept. 30, 2003(1) |
Nine Months Ended Sept. 30, 2002(1) |
|||||||||||
|---|---|---|---|---|---|---|---|---|---|---|---|---|---|---|---|
| |
In Millions |
||||||||||||||
| Segment Sales: | |||||||||||||||
| Polyurethanes | $ | 597.4 | $ | 545.6 | $ | 1,718.1 | $ | 1,557.0 | |||||||
| Advanced Materials | 257.8 | 241.2 | 789.5 | 714.9 | |||||||||||
| Performance Products | 440.5 | 390.0 | 1,267.0 | 1,140.8 | |||||||||||
| Polymers | 289.3 | 247.6 | 847.6 | 709.0 | |||||||||||
| Pigments | 251.0 | 232.5 | 752.5 | 669.2 | |||||||||||
| Base Chemicals | 620.4 | 576.5 | 1,954.2 | 1,535.6 | |||||||||||
| Eliminations | (155.2 | ) | (120.8 | ) | (446.9 | ) | (341.9 | ) | |||||||
| Total | $ | 2,301.2 | $ | 2,112.6 | $ | 6,882.0 | $ | 5,984.6 | |||||||
| Segment EBITDA: | |||||||||||||||
| Polyurethanes | $ | 80.5 | $ | 93.8 | $ | 168.6 | $ | 292.1 | |||||||
| Advanced Materials | 16.2 | 6.5 | 19.6 | 33.1 | |||||||||||
| Performance Products | 41.7 | 55.3 | 90.4 | 154.2 | |||||||||||
| Polymers | 17.6 | 24.8 | 54.0 | 61.1 | |||||||||||
| Pigments | 27.7 | 21.1 | 87.4 | 45.2 | |||||||||||
| Base Chemicals | 4.8 | 33.6 | 57.8 | 56.8 | |||||||||||
| Unallocated and other | (18.5 | ) | (24.6 | ) | (51.0 | ) | (38.1 | ) | |||||||
| Total(2)(3) | $ | 170.0 | $ | 210.5 | $ | 426.8 | $ | 604.4 | |||||||
8
| |
Three Months Ended Sept. 30, 2003 |
Three Months Ended Sept. 30, 2002 |
Nine Months Ended Sept. 30, 2003 |
Nine Months Ended Sept. 30, 2002 |
||||||||||
|---|---|---|---|---|---|---|---|---|---|---|---|---|---|---|
| Foreign exchange gains—unallocated | $ | 10.1 | $ | 1.6 | $ | 34.5 | $ | 20.9 | ||||||
| Loss on sale of accounts receivable | (5.9 | ) | (4.2 | ) | (24.0 | ) | (4.3 | ) | ||||||
| Contract termination costs—net | (0.8 | ) | ||||||||||||
| Asset write-down | (2.8 | ) | ||||||||||||
| Purchase acctg. adj.—inventory valuation | (1.0 | ) | (1.0 | ) | ||||||||||
| Reorganization expenses | (14.4 | ) | (28.0 | ) | (23.1 | ) | ||||||||
| Restructuring expenses: | ||||||||||||||
| Polyurethanes | (3.7 | ) | (22.2 | ) | ||||||||||
| Performance Products | (1.1 | ) | (20.1 | ) | (1.1 | ) | ||||||||
| Polymers | 3.7 | (0.9 | ) | 3.7 | ||||||||||
| Pigments | (1.1 | ) | (1.1 | ) | ||||||||||
| Total restructuring expenses | $ | (4.8 | ) | $ | 2.6 | $ | (44.3 | ) | $ | 2.6 | ||||
Three Months Ended September 30, 2003 (Compared to Three Months Ended September 30, 2002 Pro Forma)
For the three months ended September 30, 2003, HMP had EBITDA of $170.0 million, which includes $10.7 million in restructuring charges and losses on the sale of accounts receivable. This compares to second quarter 2003 pro forma EBITDA of $136.3 million and third quarter 2002 pro forma EBITDA of $210.5 million, which included $53.7 million and $16.0 million, respectively, of restructuring charges and losses on the sale of accounts receivable.
Revenues for the three months ended September 30, 2003 increased to $2,301.2 million, or 9%, from $2,112.6 million during the same period in 2002. The increase in revenue was due to an increase of revenues in all segments.
EBITDA for the three months ended September 30, 2003 decreased to $170.0 million, or 19%, from $210.5 million during the same period in 2002. The decrease in EBITDA was due to a decrease in EBITDA in the Polyurethanes, Performance Products, Polymers and Base Chemicals segments, partially offset by increases in EBITDA in the Advanced Materials and Pigments segments.
Polyurethanes
The increase in revenues in the Polyurethanes segment was primarily the result of higher average selling prices principally due to the strength of the major European currencies versus the U.S. dollar, offset in part by lower volumes resulting largely from a reduction in spot sales to co-producers in the 2003 period.
The decrease in EBITDA in the Polyurethane segment was primarily the result of revenue increases failing to keep pace with substantial increases in raw material costs due to the rise in oil and natural gas prices, and the incurrence in the third quarter of a $3.7 million restructuring charge taken in connection with cost reduction efforts at our Rozenburg, Netherlands facility.
Advanced Materials
The increase in revenues in the Advanced Materials segment was primarily the result of higher average selling prices, principally due to the strength of the major European currencies versus the U.S. dollar, and a 1% volume increase.
9
The increase in EBITDA in the Advanced Materials segment was the result of increased revenue, a reduction of SG&A costs primarily due to a reduction in restructuring charges, and reduced costs as a result of cost reduction initiatives.
Performance Products
The increase in revenues in the Performance Products segment was primarily the result of higher average selling prices in North America in response to higher raw material costs, strong volume gains in our linear alkylbenzene, ethyleneamines, ethanolamines and ethylene glycol product lines and higher average selling prices in Europe due to the strengthening of the major European currencies versus the U.S. dollar, partially offset by lower volumes in Europe due to softer European demand and decreased European export business as a result of the strength of the major European currencies.
The decrease in EBITDA in the Performance Products segment was primarily the result of revenue increases failing to keep pace with substantial increases in raw material costs.
Pigments
The increase in revenues in the Pigments segment was primarily the result of higher average selling prices, the majority of which resulted from the strengthening of the major European currencies versus the U.S. dollar, which more than offset a 1% volume decline.
The increase in EBITDA in the Pigments segment was primarily the result of improved margins due to a more favorable industry supply-demand balance in the most recent quarter.
Polymers
The increase in revenues in the Polymers segment was primarily the result of higher volumes and higher average selling prices as industry demand strengthened and prices increased in response to higher raw material costs.
The decrease in EBITDA in the Polymers segment was primarily the result of revenue increases failing to keep pace with substantial increases in raw material costs due to the rise in oil and natural gas prices.
Base Chemicals
The increase in revenues in the Base Chemicals segment was primarily the result of higher volumes in the U.S. as U.S. demand strengthened, and higher average selling prices in the U.S. and Europe in response to higher raw material costs.
The decrease in EBITDA in the Base Chemicals segment was primarily the result of revenue increases failing to keep pace with substantial increases in raw material costs due to the rise in oil and natural gas prices.
Unallocated Items
Unallocated items include unallocated corporate overhead, foreign exchange gains and losses and restructuring and reorganization costs. For the three months ended September 30, 2003, expenses from unallocated items decreased by $6.1 million to $18.5 million from $24.6 million for the same period in 2002. The decrease was primarily due to a reduction of restructuring and reorganization expenses versus the same period in 2002, partially offset by higher unallocated foreign exchange gains in the current period.
10
Huntsman LLC (Excluding HIH)(1)
Pro Forma Operating Results
| |
Three Months Ended Sept. 30, 2003 |
Three Months Ended Sept. 30, 2002 |
Nine Months Ended Sept. 30, 2003 |
Nine Months Ended Sept. 30, 2002 |
|||||||||||
|---|---|---|---|---|---|---|---|---|---|---|---|---|---|---|---|
| |
In Millions |
||||||||||||||
| Segment Sales | |||||||||||||||
| Performance Products | $ | 291.7 | $ | 267.4 | $ | 843.0 | $ | 769.0 | |||||||
| Polymers | 289.3 | 247.6 | 847.7 | 709.0 | |||||||||||
| Base Chemicals | 318.5 | 273.7 | 939.6 | 746.6 | |||||||||||
| Eliminations | (70.6 | ) | (58.2 | ) | (198.8 | ) | (156.1 | ) | |||||||
| Total | $ | 828.9 | $ | 730.5 | $ | 2,431.5 | $ | 2,068.5 | |||||||
| Segment EBITDA | |||||||||||||||
| Performance Products | $ | 37.1 | $ | 51.8 | $ | 105.1 | $ | 131.4 | |||||||
| Polymers | 17.6 | 24.8 | 54.0 | 61.1 | |||||||||||
| Base Chemicals | 3.9 | 12.8 | (6.9 | ) | 51.2 | ||||||||||
| Unallocated and other | (8.9 | ) | (19.4 | ) | (23.1 | ) | (43.4 | ) | |||||||
| Total(2)(3) | $ | 49.7 | $ | 70.0 | $ | 129.1 | $ | 200.3 | |||||||
| |
Three Months Ended Sept. 30, 2003 |
Three Months Ended Sept. 30, 2002 |
Nine Months Ended Sept. 30, 2003 |
Nine Months Ended Sept. 30, 2002 |
||||||||||
|---|---|---|---|---|---|---|---|---|---|---|---|---|---|---|
| Foreign exchange gains (losses)- unallocated | $ | (0.9 | ) | $ | (1.0 | ) | $ | 7.0 | $ | (0.4 | ) | |||
| Restructuring expenses | ||||||||||||||
| Polymers | 3.7 | (0.9 | ) | 3.7 | ||||||||||
| Reorganization expenses | ||||||||||||||
| Unallocated and other | (8.5 | ) | (15.5 | ) | ||||||||||
Huntsman LLC (excluding HIH) Three Months Ended September 30, 2003 (Compared to Three Months Ended September 30, 2002)
For the three months ended September 30, 2003, Huntsman LLC (excluding HIH) had EBITDA of $49.7 million on revenues of $828.9 million, compared to pro forma EBITDA of $70.0 million on revenues of $730.5 million for the same period in 2002. This compares to second quarter 2003 reported pro forma EBITDA of $46.6 million, which included $0.9 million of restructuring charges. The pro
11
forma results of Huntsman LLC exclude the consolidated results of Huntsman International and include the consolidated results of HCCA for all periods.
Revenues for the three months ended September 30, 2003 increased to $828.9 million, or 13%, from $730.5 million during the same period in 2002. Revenues increased in all business segments as the result of higher volumes and higher average selling prices as industry demand strengthened and prices increased in response to higher raw material costs.
EBITDA for the three months ended September 30, 2003 decreased to $49.7 million, or 29%, from $70.0 million during the same period in 2002. EBITDA decreased in all segments as the result of the increases in revenues failing to keep pace with substantial increases in raw material costs due to the rise in oil and natural gas prices.
Performance Products
The increase in revenues in the Performance Products segment was primarily the result of higher average selling prices in response to higher raw material prices and strong volume gains in our linear alkylbenzene, ethanolamines and ethylene glycol product lines.
The decrease in EBITDA in the Performance Products segment was primarily the result of revenue increases failing to keep pace with substantial increases in raw material costs.
Polymers
The increase in revenues in the Polymers segment was primarily the result of higher volumes and higher average selling prices as industry demand strengthened and prices increased in response to higher raw material costs.
The decrease in EBITDA in the Polymers segment was primarily the result of revenue increases failing to keep pace with substantial increases in raw material costs due to the rise in oil and natural gas prices.
Base Chemicals
The increase in revenues in the Base Chemicals segment was primarily the result of higher volumes and higher average selling prices as industry demand strengthened and prices increased in response to higher raw material costs.
The decrease in EBITDA in the Base Chemicals segment was primarily the result of revenue increases failing to keep pace with substantial increases in raw material costs due to the rise in oil and natural gas prices.
Unallocated Items
Unallocated items include unallocated corporate overhead, foreign exchange gains and losses and reorganization costs. For the three months ended September 30, 2003, expenses from unallocated items decreased by $10.5 million to $8.9 million from $19.4 million for the same period in 2002. The decrease was primarily due to reduced reorganization expenses in the 2003 period as compared to the same period in 2002.
12
Huntsman International Holdings LLC
| |
Three Months Ended Sept 30, 2003 |
Three Months Ended Sept 30, 2002 |
Nine Months Ended Sept 30, 2003 |
Nine Months Ended Sept 30, 2002 |
|||||||||
|---|---|---|---|---|---|---|---|---|---|---|---|---|---|
| |
In Millions |
||||||||||||
| Revenues | $ | 1,275.7 | $ | 1,195.2 | $ | 3,880.8 | $ | 3,368.1 | |||||
| Gross profit | 146.5 | 174.9 | 436.3 | 458.0 | |||||||||
| SG&A / Other expenses | 100.4 | 102.3 | 296.8 | 272.1 | |||||||||
| Restructuring and reorganization expenses | 4.8 | 1.1 | 43.4 | 1.1 | |||||||||
| Operating income | 41.3 | 71.5 | 96.1 | 184.8 | |||||||||
Net loss |
(46.6 |
) |
(13.3 |
) |
(181.4 |
) |
(37.4 |
) |
|||||
| Interest expense — net | 88.4 | 89.1 | 266.3 | 246.8 | |||||||||
| Income tax expense | (5.3 | ) | (11.0 | ) | (14.0 | ) | (31.2 | ) | |||||
| Depreciation and amortization | 67.7 | 66.2 | 205.4 | 185.1 | |||||||||
EBITDA(1)(2) |
$ |
104.2 |
$ |
131.0 |
$ |
276.3 |
$ |
363.3 |
|||||
| |
Three Months Ended Sept. 30, 2003 |
Three Months Ended Sept. 30, 2002 |
Nine Months Ended Sept. 30, 2003 |
Nine Months Ended Sept. 30, 2002 |
||||||||||
|---|---|---|---|---|---|---|---|---|---|---|---|---|---|---|
| Foreign exchange gains — unallocated | $ | 8.7 | $ | 4.1 | $ | 25.3 | $ | 29.0 | ||||||
| Loss on sale of accounts receivable | (5.9 | ) | (4.2 | ) | (24.0 | ) | (4.3 | ) | ||||||
| Asset write-down | — | — | (2.8 | ) | — | |||||||||
| Restructuring expenses: | ||||||||||||||
| Polyurethanes | (3.7 | ) | — | (22.2 | ) | — | ||||||||
| Performance Products | — | (1.1 | ) | (20.1 | ) | (1.1 | ) | |||||||
| Pigments | (1.1 | ) | — | (1.1 | ) | — | ||||||||
| Total restructuring expenses | $ | (4.8 | ) | $ | (1.1 | ) | $ | (43.4 | ) | $ | (1.1 | ) | ||
13
Operating Results
| |
Three Months Ended Sept. 30, 2003 |
Three Months Ended Sept. 30, 2002 |
Nine Months Ended Sept. 30, 2003 |
Nine Months Ended Sept. 30, 2002 |
|||||||||||
|---|---|---|---|---|---|---|---|---|---|---|---|---|---|---|---|
| |
In Millions |
||||||||||||||
| Segment Sales | |||||||||||||||
| Polyurethanes | $ | 597.4 | $ | 545.6 | $ | 1,718.1 | $ | 1,557.0 | |||||||
| Performance Products | 164.9 | 143.3 | 490.5 | 426.8 | |||||||||||
| Pigments | 251.0 | 232.5 | 752.5 | 669.2 | |||||||||||
| Base Chemicals | 303.0 | 303.6 | 1,032.9 | 791.3 | |||||||||||
| Eliminations | (40.6 | ) | (29.8 | ) | (113.2 | ) | (76.2 | ) | |||||||
| Total | $ | 1,275.7 | $ | 1,195.2 | $ | 3,880.8 | $ | 3,368.1 | |||||||
| Segment EBITDA | |||||||||||||||
| Polyurethanes | $ | 80.4 | $ | 93.9 | $ | 168.6 | $ | 292.1 | |||||||
| Performance Products | 4.6 | 3.5 | (14.6 | ) | 22.8 | ||||||||||
| Pigments | 27.6 | 21.1 | 87.4 | 45.2 | |||||||||||
| Base Chemicals | 1.0 | 20.8 | 64.8 | 5.6 | |||||||||||
| Unallocated and other | (9.4 | ) | (8.3 | ) | (29.9 | ) | (2.4 | ) | |||||||
| Total(1)(2) | $ | 104.2 | $ | 131.0 | $ | 276.3 | $ | 363.3 | |||||||
| |
Three Months Ended Sept. 30, 2003 |
Three Months Ended Sept. 30, 2002 |
Nine Months Ended Sept. 30, 2003 |
Nine Months Ended Sept. 30, 2002 |
||||||||||
|---|---|---|---|---|---|---|---|---|---|---|---|---|---|---|
| Foreign exchange gains — unallocated | $ | 8.7 | $ | 4.1 | $ | 25.3 | $ | 29.0 | ||||||
| Loss on sale of accounts receivable | (5.9 | ) | (4.2 | ) | (24.0 | ) | (4.3 | ) | ||||||
| Asset write-down | — | — | (2.8 | ) | — | |||||||||
| Restructuring expenses: | ||||||||||||||
| Polyurethanes | $ | (3.7 | ) | $ | — | $ | (22.2 | ) | $ | — | ||||
| Performance Products | — | (1.1 | ) | (20.1 | ) | (1.1 | ) | |||||||
| Pigments | (1.1 | ) | — | (1.1 | ) | — | ||||||||
| Total restructuring expenses | $ | (4.8 | ) | $ | (1.1 | ) | $ | (43.4 | ) | $ | (1.1 | ) | ||
Three Months Ended September 30, 2003 (Compared to Three Months Ended September 30, 2002)
For the three months ended September 30, 2003, Huntsman International had EBITDA of $104.2 million on revenues of $1,275.7 million, compared to EBITDA of $131.0 million on revenues of $1,195.2 million for the same period in 2002. This compares to EBITDA of $88.5 million in the second quarter of 2003, which included charges of $39.0 million. The third quarter 2003 results of Huntsman International include charges of $10.7 million, consisting of $4.8 million in restructuring charges and $5.9 million in loss on sale of accounts receivable. The $4.8 million in restructuring charges relate to an overall corporate cost reduction program to be implemented throughout 2003 and 2004, and consist of a $1.1 million charge related to the company's Pigments segment and a $3.7 million charge relating to the company's Polyurethanes segment.
14
Revenues for the three months ended September 30, 2003 increased to $1,275.7 million, or 7%, from $1,195.2 million during the same period in 2002. The increase in revenue was due to an increase in revenues in the Polyurethanes, Performance Products and Pigments segments and relatively flat revenues in the Base Chemicals segment.
EBITDA for the three months ended September 30, 2003 decreased to $104.2 million, or 20%, from $131.0 million during the same period in 2002. The decrease in EBITDA was due to decreases in EBITDA in the Polyurethanes and Base Chemicals segments, partially offset by increases in EBITDA in the Performance Products and Pigments segments.
Polyurethanes
The increase in revenues in the Polyurethanes segment was primarily the result of higher average selling prices principally due to the strength of the major European currencies versus the U.S. dollar, offset in part by lower volumes resulting largely from a reduction in spot sales to co-producers in the 2003 period.
The decrease in EBITDA in the Polyurethane segment was primarily the result of revenue increases failing to keep pace with substantial increases in raw material costs due to the rise in oil and natural gas prices, and the incurrence in the third quarter of a $3.7 million restructuring charge taken in connection with cost reduction efforts at our Rozenburg, Netherlands facility.
Performance Products
The increase in revenues in the Performance Products segment was primarily the result of higher average surfactant selling prices primarily due to the strength of the major European currencies versus the U.S. dollar, partially offset by a decline in surfactant sales volumes due to softer European demand and weaker export sales. Additionally, ethyleneamines revenues increased largely due to increased export sales.
The increase in EBITDA in the Performance Products segment was primarily the result of reductions in costs.
Pigments
The increase in revenues in the Pigments segment was primarily the result of higher average selling prices, the majority of which resulted from the strengthening of the major European currencies versus the U.S. dollar, which more than offset a 1% volume decline.
The increase in EBITDA in the Pigments segment was primarily the result of improved margins due to a more favorable industry supply-demand balance.
Base Chemicals
The increase in revenues in the Base Chemicals segment was primarily the result of higher average selling prices in response to higher raw material costs, partially offset by lower sales volumes.
The decrease in EBITDA in the Base Chemicals segment was primarily the result of revenue increases failing to keep pace with substantial increases in raw material costs due to the rise in oil and natural gas prices.
Unallocated Items
Unallocated items include unallocated corporate overhead, foreign exchange gains and losses and reorganization costs. For the three months ended September 30, 2003, expenses from unallocated items
15
increased by $1.1 million to $9.4 million from $8.3 million for the same period in 2002. The increase was primarily due to increased losses on the sale of accounts receivable.
Huntsman Advanced Materials LLC
Pro Forma Operating Results
| |
Three Months Ended Sept. 30, 2003 |
Three Months Ended Sept. 30, 2002(1) |
Nine Months Ended Sept. 30, 2003(1) |
Nine Months Ended Sept. 30, 2002(1) |
|||||||||
|---|---|---|---|---|---|---|---|---|---|---|---|---|---|
| |
In Millions |
||||||||||||
| Sales | $ | 257.8 | $ | 241.2 | $ | 789.5 | $ | 714.9 | |||||
| EBITDA(2) | 16.2 | 6.5 | 19.6 | 33.1 | |||||||||
| |
Three Months Ended Sept. 30, 2003 |
Three Months Ended Sept. 30, 2002 |
Nine Months Ended Sept. 30, 2003 |
Nine Months Ended Sept. 30, 2002 |
|||||||||
|---|---|---|---|---|---|---|---|---|---|---|---|---|---|
| Foreign exchange gains (losses)—unallocated | $ | 2.3 | $ | (1.5 | ) | $ | 2.2 | $ | (7.7 | ) | |||
| Reorganization expenses | (5.9 | ) | (28.0 | ) | (7.6 | ) | |||||||
| Purchase acctg adj. — inventory valuation | (1.0 | ) | (1.0 | ) | |||||||||
| Contract termination costs — net | (0.8 | ) | |||||||||||
Three Months Ended September 30, 2003 (Compared to Three Months Ended September 30, 2002 Pro Forma)
For the three months ended September 30, 2003, Advanced Materials had EBITDA of $16.2 million on revenues of $257.8 million, compared to EBITDA of $6.5 million on revenues of $241.2 million for the same period in 2002. EBITDA for the three months ended September 30, 2002 included charges of $5.9 million. This compares to an EBITDA loss of $7.0 million in the second quarter of 2003, which included charges of $22.0 million.
Advanced Materials
The increase in revenues in Advanced Materials was primarily the result of higher average selling prices, principally due to the strength of the major European currencies versus the U.S. dollar, and a 1% volume increase. The increase in EBITDA in Advanced Materials was the result of increased revenue, a reduction of SG&A costs primarily due to a reduction in restructuring charges, and reduced costs as a result of cost reduction initiatives.
Liquidity
HMP Equity Holdings
HMP is a holding company established to hold the equity in Huntsman LLC, Huntsman International and Advanced Materials. HMP has no short-term debt outstanding and maintains no short-term credit facilities. As of September 30, 2003, HMP has approximately $163 million of cash on its consolidated balance sheet.
16
Huntsman LLC (excluding HIH)
As of September 30, 2003, Huntsman LLC had borrowings of approximately $85 million outstanding under its $275 million revolving credit facility in addition to approximately $14 million in letters of credit issued, and Huntsman LLC had approximately $28 million of cash on its balance sheet. Huntsman LLC's cash and undrawn commitments under the revolving credit facility, as of September 30, 2003, were approximately $204 million, subject to covenants under the revolving credit facility, including a minimum revolving credit facility availability covenant. Capital expenditures for the third quarter were approximately $28 million compared with $13 million in the third quarter of 2002. The capital spending through September 30, 2003 of approximately $65 million is representative of our normalized capital expenditure run rate.
On September 30, 2003, Huntsman LLC completed a $380 million offering of Senior Secured Notes issued at a discount, the proceeds of which were used to repay approximately $65 million on the revolving credit facility and approximately $297 million on the Term Loan A. As a result of this offering, there are no scheduled term loan payments under Huntsman LLC's senior secured credit facilities until December of 2005.
Huntsman International
As of September 30, 2003, Huntsman International had borrowings of $199 million outstanding under its $400 million revolving credit facility in addition to approximately $7 million in letters of credit issued, and Huntsman International had approximately $81 million of cash on its balance sheet. Huntsman International also maintains $25 million of short-term overdraft facilities, of which approximately $21 million was available at September 30, 2003. As part of a refinancing that was completed on October 22, 2003 as described below, approximately $53 million was repaid against the revolving credit facility. Total liquidity of as of September 30, 2003 was approximately $296 million, or approximately $349 million on a pro forma basis after giving effect to the October 22, 2003 refinancing. Capital expenditures for the third quarter were approximately $42 million compared with $40 million in the third quarter of 2002.
On October 17, 2003, Huntsman International amended its senior secured credit facilities. The amendment provides, among other things, for changes to certain financial covenants, including the leverage and interest coverage ratios, the annual amount of permitted capital expenditures, and the consolidated net worth covenant. These changes to the financial covenants apply to the quarterly period ended September 30, 2003 and will continue through the quarterly periods ended December 31, 2004. The amendment also allows for the issuance of $205 million of additional term B and term C loans, which was accomplished on October 22, 2003, the net proceeds of which have been applied to pay down our revolving loan facility by approximately $53 million, and the remainder of the net proceeds have been applied to repay, in full, the term A loan. As a result of the prepayment of term debt with the proceeds from the recent refinancing of the term loan A, there are no scheduled term debt maturities under the senior secured credit facilities until the second quarter 2005. In 2005 and 2006, the scheduled term debt maturities under the senior secured credit facilities are approximately $12 million in each year.
Huntsman Advanced Materials
As of September 30, 2003, Advanced Materials had no borrowings outstanding under its $60 million revolving credit facility and approximately $15 million in letters of credit issued thereunder. Advanced Materials had approximately $46 million of cash on its balance sheet as of September 30, 2003 and total liquidity was approximately $91 million. Advanced Materials has no scheduled debt amortization payments until July 2008.
17
Outstanding Debt
| |
Sept. 30, 2003 |
||||
|---|---|---|---|---|---|
| |
In Millions |
||||
| Huntsman LLC (excluding HIH): | |||||
| Senior Secured Debt | $ | 1,561 | |||
| Senior Unsecured Debt | 37 | ||||
| Senior Subordinated Debt | 59 | ||||
| Other Debt(1) | 237 | ||||
| Subtotal | 1,894 | ||||
| Huntsman International(2): | |||||
| Senior Secured Debt | 1,382 | ||||
| Senior Unsecured Debt | 457 | ||||
| Senior Subordinated Notes | 1,127 | ||||
| Other Debt | 33 | ||||
| Subtotal (Huntsman International LLC) | 2,999 | ||||
| HIH Senior and Senior Sub. Discount Notes(3) | 767 | ||||
| Subtotal (Huntsman International Holdings LLC) | 3,766 | ||||
| Huntsman Advanced Materials: | |||||
| Senior Secured Debt | 348 | ||||
| Other Debt | 5 | ||||
| Subtotal | 353 | ||||
| HMP: | |||||
| Senior Secured Notes(3)(4) | 336 | ||||
| Elimination of HIH Senior Sub. Discount Notes(5) | (346 | ) | |||
| Total HMP Debt | 6,003 | ||||
| Cash | 163 | ||||
| Net Debt | $ | 5,840 | |||
Conference Call Information
We will hold a conference call to discuss the third quarter financial results of HMP, Huntsman International, Huntsman LLC and Advanced Materials on Monday, November 10, 2003 at 12:00 noon EST.
| Call-in number for U.S. participants: | (888) 423-3268 | |
| Call in number for international participants: | (651) 291-0900 |
18
The conference call will be replayed beginning November 10, 2003 at 8:00 PM EST and ending Saturday, November 15, 2003 at 2:00 AM EST.
| Call-in numbers for the replay: | ||||
| Within the U.S.: International: |
(800) 475-6701 (320) 365-3844 |
|||
Access code for replay: |
703884 |
Statements in this release that are not historical are forward-looking statements. These statements are based on management's current beliefs and expectations. The forward-looking statements in this release are subject to uncertainty and changes in circumstances and involve risks and uncertainties that may affect the company's operations, markets, products, services, prices and other factors as discussed in the Huntsman companies' filings with the Securities and Exchange Commission. Significant risks and uncertainties may relate to, but are not limited to, financial, economic, competitive, environmental, political, legal, regulatory and technological factors. Accordingly, there can be no assurance that the company's expectations will be realized. The company assumes no obligation to provide revisions to any forward-looking statements should circumstances change, except as otherwise required by securities and other applicable laws.
19