
Exhibit 99.1
| FOR IMMEDIATE RELEASE | Media Contact: | Finance Contacts: | ||
| August 16, 2004 | Don Olsen (281) 719-4175 |
Kimo Esplin John Heskett (801) 584-5700 |
HUNTSMAN RELEASES SECOND QUARTER RESULTS
RESULTS SHOW SIGNIFICANT IMPROVEMENT RELATIVE TO FIRST
QUARTER AND TO THE SECOND QUARTER OF LAST YEAR
Houston, TX—The Huntsman companies today reported second quarter 2004 EBITDA of $116.3 million including $170.9 million of restructuring and other charges. This compares to EBITDA in the second quarter of 2003 of $156.8 million including charges of $60.7 million. EBITDA for the first quarter of 2004 was $207.8 million including charges of $14.1 million. Second quarter 2004 adjusted EBITDA was $287.9 million. This represents a 30% improvement as compared to first quarter 2004 adjusted EBITDA of $221.7 million and 35% improvement as compared to second quarter 2003 pro forma(1) adjusted EBITDA of $214.0 million. The Company computes adjusted EBITDA to eliminate the impacts of restructuring and reorganization costs, gains and losses on the accounts receivable securitization program, losses from early extinguishment of debt, non-recurring legal settlements and minority interest in order to provide investors with a more meaningful measure of the companies' operational performance.
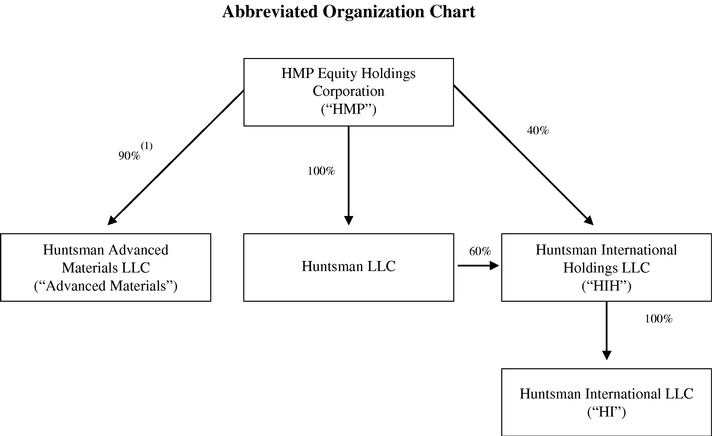
The combined Huntsman companies include HMP Equity Holdings Corporation ("HMP"), and its principal operating subsidiaries Huntsman LLC, Huntsman International Holdings LLC ("Huntsman International" or "HIH") and Huntsman Advanced Materials LLC ("Advanced Materials" or "AdMat").
As of June 30, 2004, HMP and its subsidiaries had combined cash and unused borrowing capacity of approximately $789 million, comprised of $204 million at Huntsman LLC, $468 million at HIH, and $117 million at Advanced Materials.
Peter R. Huntsman, President and CEO, stated, "We are pleased with the improvement in our results, especially considering the continued high and volatile energy and feedstock costs that continue to plague the industry. Overall average selling prices continue to increase as we see improved global demand in our business. The results also reflect our ability to sustain positive pricing momentum in certain areas of our business and the continued progress we are making with our $200 million global cost reduction program. We are concerned that the continued high cost of crude oil and natural gas could have a negative impact on global economic growth. However, for now demand remains relatively strong, industry operating rates continue to improve and we remain cautiously optimistic about our outlook for the second half of the year."
2
HMP Equity Holdings Corporation Quarterly Operating Results
Three Months Ended June 30, 2004
| In Millions |
Huntsman LLC (Excl. HIH)(1) |
Huntsman International Holdings |
Huntsman Advanced Materials |
HMP Other/ Eliminations |
HMP Consolidated |
|||||||||||
|---|---|---|---|---|---|---|---|---|---|---|---|---|---|---|---|---|
| Revenues | $ | 968.9 | $ | 1,623.7 | $ | 287.6 | $ | (108.0 | ) | $ | 2,772.2 | |||||
| Gross profit | 52.2 | 231.4 | 77.4 | (19.6 | ) | 341.4 | ||||||||||
| SG&A/Other expenses | 39.8 | 126.4 | 59.3 | (2.8 | ) | 222.7 | ||||||||||
| Restructuring expenses | 25.6 | 124.9 | — | — | 150.5 | |||||||||||
| Operating income (loss) | (13.2 | ) | (19.9 | ) | 18.1 | (16.8 | ) | (31.8 | ) | |||||||
| Net income (loss) | (58.1 | ) | (90.5 | ) | 5.7 | (42.8 | ) | (185.7 | ) | |||||||
| Interest expense—net | 42.1 | 62.9 | 10.7 | 28.8 | 144.5 | |||||||||||
| Income tax expense (benefit) | 1.7 | 4.7 | 1.7 | (2.1 | ) | 6.0 | ||||||||||
| Depreciation and amortization | 34.1 | 79.8 | 13.6 | 24.0 | 151.5 | |||||||||||
| EBITDA(2) | $ | 19.8 | $ | 56.9 | $ | 31.7 | $ | 7.9 | $ | 116.3 | ||||||
| Minority interest | — | — | — | 0.7 | 0.7 | |||||||||||
| Early extinguishment of debt | 2.5 | — | — | — | 2.5 | |||||||||||
| Legal/contract settlements, net | — | 14.9 | — | — | 14.9 | |||||||||||
| Loss on accounts receivable securitization program | — | 3.0 | — | — | 3.0 | |||||||||||
| Restructuring expenses | 25.6 | 124.9 | — | — | 150.5 | |||||||||||
| Adjusted EBITDA(2) | $ | 47.9 | $ | 199.7 | $ | 31.7 | $ | 8.6 | $ | 287.9 | ||||||
| Unallocated foreign exchange gains (losses) | — | (5.4 | ) | — | — | (5.4 | ) | |||||||||
| Allocated foreign exchange gains (losses)—AdMat | (7.2 | ) | (7.2 | ) | ||||||||||||
See page 15 for footnote explanations
3
Three Months Ended June 30, 2003
| In Millions |
Huntsman LLC (Excl. HIH)(1) |
Huntsman International Holdings |
Huntsman Advanced Materials(2) |
HMP Other/ Eliminations |
HMP Consolidated |
|||||||||||
|---|---|---|---|---|---|---|---|---|---|---|---|---|---|---|---|---|
| Revenues | $ | 770.8 | $ | 1,307.4 | $ | 263.8 | $ | (93.3 | ) | $ | 2,248.7 | |||||
| Gross profit | 53.2 | 157.4 | 53.1 | — | 255.7 | |||||||||||
| SG&A/Other expenses | 37.6 | 83.5 | 44.3 | (2.8 | ) | 162.6 | ||||||||||
| Restructuring expenses | 0.9 | 21.5 | 27.0 | — | 49.4 | |||||||||||
| Operating income (loss) | 14.7 | 52.4 | (18.2 | ) | (5.2 | ) | 43.7 | |||||||||
| Net loss | (23.8 | ) | (22.3 | ) | (29.6 | ) | (25.1 | ) | (100.8 | ) | ||||||
| Interest expense—net | 39.0 | 64.1 | 10.4 | 23.1 | 136.6 | |||||||||||
| Income tax expense (benefit) | — | (0.8 | ) | 1.0 | 0.2 | 0.4 | ||||||||||
| Depreciation and amortization | 31.9 | 68.8 | 14.8 | 5.1 | 120.6 | |||||||||||
| EBITDA(2) | $ | 47.1 | $ | 109.8 | $ | (3.4 | ) | $ | 3.3 | $ | 156.8 | |||||
| Minority interest | — | — | — | (3.5 | ) | (3.5 | ) | |||||||||
| Legal/contract settlements, net | — | — | 5.5 | — | 5.5 | |||||||||||
| Early extinguishment of debt | — | — | — | — | — | |||||||||||
| Loss on accounts receivable securitization program | — | 11.3 | — | — | 11.3 | |||||||||||
| Restructuring expenses | 0.9 | 21.5 | 21.5 | — | 43.9 | |||||||||||
| Adjusted EBITDA(2) | $ | 48.0 | $ | 142.6 | $ | 23.6 | $ | (0.2 | ) | $ | 214.0 | |||||
| Unallocated foreign exchange gains (losses) | 5.0 | 34.7 | — | — | 39.7 | |||||||||||
| Allocated foreign exchange gains (losses)—AdMat | 9.0 | 9.0 | ||||||||||||||
See page 15 for footnote explanations
4
HMP Equity Holdings Corporation Pro Forma Segment Results
| In Millions |
Three Months Ended June 30, 2004 |
Three Months Ended June 30, 2003(3) |
Six Months Ended June 30, 2004 |
Six Months Ended June 30, 2003(3) |
|||||||||||
|---|---|---|---|---|---|---|---|---|---|---|---|---|---|---|---|
| Segment Revenues: | |||||||||||||||
| Polyurethanes | $ | 733.9 | $ | 565.8 | $ | 1,373.4 | $ | 1,120.7 | |||||||
| Advanced Materials | 287.6 | 263.8 | 572.3 | 531.8 | |||||||||||
| Performance Products | 451.2 | 405.2 | 906.0 | 826.5 | |||||||||||
| Polymers | 324.2 | 269.6 | 638.7 | 558.4 | |||||||||||
| Pigments | 278.1 | 255.4 | 533.1 | 501.5 | |||||||||||
| Base Chemicals | 911.2 | 639.2 | 1,770.3 | 1,338.8 | |||||||||||
| Eliminations | (214.0 | ) | (150.3 | ) | (382.8 | ) | (296.4 | ) | |||||||
| Total | $ | 2,772.2 | $ | 2,248.7 | $ | 5,411.0 | $ | 4,581.3 | |||||||
| EBITDA: | |||||||||||||||
| Polyurethanes | $ | 100.0 | $ | 48.1 | $ | 172.8 | $ | 88.3 | |||||||
| Advanced Materials | 31.7 | (3.4 | ) | 65.2 | 9.6 | ||||||||||
| Performance Products | 16.0 | 9.5 | 51.4 | 48.7 | |||||||||||
| Polymers | 0.2 | 22.7 | 19.1 | 36.1 | |||||||||||
| Pigments | (83.4 | ) | 30.9 | (75.8 | ) | 59.8 | |||||||||
| Base Chemicals | 81.2 | 34.7 | 134.5 | 53.0 | |||||||||||
| Corporate and other | (29.4 | ) | 14.3 | (42.8 | ) | 0.6 | |||||||||
| Total(2) | $ | 116.3 | $ | 156.8 | $ | 324.4 | $ | 296.1 | |||||||
| Adjusted Segment EBITDA: | |||||||||||||||
| Polyurethanes | $ | 118.1 | $ | 49.5 | $ | 195.7 | $ | 106.8 | |||||||
| Advanced Materials | 31.7 | 23.6 | 65.2 | 42.6 | |||||||||||
| Performance Products | 37.0 | 29.6 | 72.3 | 68.8 | |||||||||||
| Polymers | 5.3 | 23.6 | 24.2 | 37.0 | |||||||||||
| Pigments | 35.6 | 30.9 | 47.2 | 59.8 | |||||||||||
| Base Chemicals | 83.4 | 34.7 | 136.7 | 53.0 | |||||||||||
| Corporate and other | (23.2 | ) | 22.1 | (31.2 | ) | 18.7 | |||||||||
| Total(2) | $ | 287.9 | $ | 214.0 | $ | 510.1 | $ | 386.7 | |||||||
See page 15 for footnote explanations
Three Months Ended June 30, 2004 (Compared to Three Months Ended June 30, 2003 Pro Forma)
For the three months ended June 30, 2004, HMP had EBITDA of $116.3 million, which included $150.5 million of restructuring charges, $3.0 million in losses on our accounts receivable securitization program, $2.5 million of net losses from the early extinguishment of debt, $14.9 million expenses related to a non-recurring legal settlement and adjustments for minority interest of $0.7 million. This compares to second quarter 2003 pro forma EBITDA of $156.8 million which included $43.9 million of restructuring charges, $11.3 million in losses on our accounts receivable securitization program, $5.5 million in net contract settlement charges and adjustments for minority interest of $(3.5) million.
Revenues for the three months ended June 30, 2004 increased to $2,772.2 million, or 23%, from $2,248.7 million during the same period in 2003 on a pro forma basis. The increase in revenue was due to an increase in revenue in all segments.
5
EBITDA for the three months ended June 30, 2004 decreased to $116.3 million, or 26%, from $156.8 million during the same period in 2003 on a pro forma basis. The decrease in EBITDA was due to an increase in EBITDA in the Polyurethanes, Advanced Materials, Performance Products and Base Chemicals segments, offset by decreases in EBITDA in the Pigments and Polymers segments. Adjusted EBITDA for the second quarter of 2004 was $287.9 million which represented a 35% increase relative to the comparable period in 2003. First quarter 2004 EBITDA and adjusted EBITDA were $207.8 million and $221.7 million, respectively.
Polyurethanes
The increase in revenues in the Polyurethanes segment was primarily due to the result of an 8% increase in MDI average selling prices as compared to the 2003 period principally improved industry operating rates and due to the strength of the major European currencies versus the U.S. dollar. MDI sales volumes increased by 17% as compared to second quarter 2003 as industry demand strengthened.
The increase in EBITDA in the Polyurethanes segment was the result of stronger demand and higher MDI sales volumes, and our ability to offset historically high benzene and energy costs with higher selling prices. EBITDA was negatively impacted by $18.1 million of restructuring charges recorded in the second quarter of 2004.
Advanced Materials
The increase in revenues in the Advanced Materials segment was primarily the result of higher average selling prices, principally due to price increases in selected markets initiated in response to improved demand, and in certain instances in response to higher raw material costs and the strength of the major European currencies versus the U.S. dollar.
The increase in EBITDA in the Advanced Materials segment was the result of increased revenue and improved product mix, as we strategically reduced sales volumes of lower margin basic epoxy resins and increased sales volumes of higher margin surface technologies, adhesives, electrical insulating materials and structural composites products.
Performance Products
The increase in revenues in the Performance Products segment was primarily the result of higher average selling prices in response to higher raw material and energy costs and due to the strength of the major European currencies versus the U.S. dollar.
The increase in EBITDA in the Performance Products segment was primarily the result of margin increases which resulted from average selling price increases which outpaced substantial increases in raw material and energy costs.
Pigments
The increase in revenues in the Pigments segment was primarily the result of a 9% increase in sales volumes relative to the second quarter of 2003. Average selling prices remained relatively flat as a 5% price decrease in local currency average selling prices was offset by currency movements due to the strength of the major European currencies versus the U.S. dollar.
The decrease in EBITDA in the Pigments segment was primarily the result of a $104.2 million restructuring charge recorded in the second quarter of 2004 in connection with the previously announced idling of capacity at the Company's Grimsby, U.K. and Umbogintwini, South Africa facilities, and a $14.9 million charge taken in connection with the settlement of certain legal claims. Exclusive of these charges, EBITDA increased relative to the same period in 2003, primarily attributable to the 9% sales volume increase previously discussed.
6
Polymers
The increase in revenues in the Polymers segment was primarily the result of higher average selling prices as industry demand strengthened and average selling prices increased in response to higher raw material and energy costs. Sales volumes were higher despite the planned turnaround and inspection of our Odessa, Texas facilities in the second quarter of 2004.
The decrease in EBITDA in the Polymers segment was due primarily to costs associated with the planned turnaround and inspection of our Odessa, Texas facilities and higher raw material and energy costs. In addition, we recorded a $5.1 million restructuring charge in the second quarter of 2004 related to the closure of one of our manufacturing units in Australia.
Base Chemicals
The increase in revenues in the Base Chemicals segment was primarily the result of higher sales volumes as demand continued to strengthen, and due to higher average selling prices in response to higher industry operating rates and higher raw material and energy costs.
The increase in EBITDA in the Base Chemicals segment was primarily the result of higher margins as revenue increases outpaced substantial increases in raw material and energy costs in both the U.S. and Europe.
Corporate and Other
Corporate and other items include unallocated corporate overhead, loss on our accounts receivable securitization program, unallocated foreign exchange gains and losses, and unallocated restructuring and reorganization costs. For the three months ended June 30, 2004, net expenses from corporate and other items increased by $43.7 million to $29.4 million from EBITDA of $14.3 million for the same period in 2003 on a pro forma basis. The increase in net expenses was primarily due to a $45.1 million negative impact from unallocated foreign currency gains and losses in the three months ended June 30, 2004 compared to the comparable period in 2003. In addition, there was a decrease of $8.3 million in losses on our accounts receivable securitization program from losses of $11.3 million in 2003 to losses of 3.0 million in 2004, and there were $2.5 million in net losses for the early extinguishment of debt during the three months ended June 30, 2004.
7
Huntsman LLC (Excluding HIH) Pro Forma Segment Results
| In Millions |
Three Months Ended June 30, 2004(1) |
Three Months Ended June 30, 2003(1) |
Six Months Ended June 30, 2004(1) |
Six Months Ended June 30, 2003(1) |
|||||||||||
|---|---|---|---|---|---|---|---|---|---|---|---|---|---|---|---|
| Segment Revenues: | |||||||||||||||
| Performance Products | 284.9 | 272.4 | 586.3 | 551.3 | |||||||||||
| Polymers | 324.2 | 269.6 | 638.7 | 558.4 | |||||||||||
| Base Chemicals | 430.3 | 285.9 | 815.6 | 621.1 | |||||||||||
| Eliminations | (70.5 | ) | (57.1 | ) | (131.9 | ) | (128.2 | ) | |||||||
| Total | $ | 968.9 | $ | 770.8 | $ | 1,908.7 | $ | 1,602.6 | |||||||
| EBITDA: | |||||||||||||||
| Performance Products | 13.6 | 31.1 | 47.1 | 67.9 | |||||||||||
| Polymers | 0.2 | 22.7 | 19.1 | 36.1 | |||||||||||
| Base Chemicals | 23.4 | (2.6 | ) | 45.2 | (10.8 | ) | |||||||||
| Corporate and other | (17.4 | ) | (4.1 | ) | (29.9 | ) | (13.7 | ) | |||||||
| Total(2) | $ | 19.8 | $ | 47.1 | $ | 81.5 | $ | 79.5 | |||||||
| Adjusted Segment EBITDA: | |||||||||||||||
| Performance Products | 34.1 | 31.1 | 67.6 | 67.9 | |||||||||||
| Polymers | 5.3 | 23.6 | 24.2 | 37.0 | |||||||||||
| Base Chemicals | 23.4 | (2.6 | ) | 45.2 | (10.8 | ) | |||||||||
| Corporate and other | (14.9 | ) | (4.1 | ) | (25.7 | ) | (13.7 | ) | |||||||
| Total(2) | $ | 47.9 | $ | 48.0 | $ | 111.3 | $ | 80.4 | |||||||
See page 15 for footnote explanations
Huntsman LLC (excluding HIH) Three Months Ended June 30, 2004 (Compared to Three Months Ended June 30, 2003)
For the three months ended June 30, 2004, Huntsman LLC (excluding HIH) had EBITDA of $19.8 million on revenues of $968.9 million, compared to EBITDA of $47.1 million on revenues of $770.8 million for the same period in 2003. EBITDA for the three months ended June 30, 2004 includes $25.6 million of restructuring charges and $2.5 million of net losses from the early extinguishment of debt.
Revenues for the three months ended June 30, 2004 increased to $968.9 million, or 26%, from $770.8 million during the same period in 2003. Revenues increased in all business segments as the result of higher average selling prices in response to higher industry operating rates, higher raw material and energy costs and improved demand.
EBITDA for the three months ended June 30, 2004 decreased to $19.8 million from $47.1 million during the same period in 2003. EBITDA increased in the Base Chemical segment as average selling price increases outpaced increases in raw material and energy costs and as sales volumes strengthened primarily for olefins and cyclohexane. EBITDA decreased in the Performance Products segment primarily due to $20.5 million restructuring charges recorded in the second quarter of 2004 mainly in connection with the announced closure of our Guelph, Canada facility. EBITDA also decreased in the Polymers segment primarily due to the impact of the planned turnaround and inspection of our Odessa, Texas facility and due to a $5.1 million restructuring charge recorded in the second quarter of 2004 in connection with the closure of one of our manufacturing facilities in Australia. Exclusive of the impact of restructuring charges and net losses on the early extinguishment of debt, adjusted EBITDA for the three months ended June 30, 2004 was $47.9 million.
8
Performance Products
The increase in revenues in the Performance Products segment was primarily the result of higher average selling prices in response to higher raw material and energy costs and sales volume gains in our maleic anhydride and ethylene oxide-based derivative product lines.
The decrease in EBITDA in the Performance Products segment was primarily the result of a $20.5 million in restructuring charges recorded in the second quarter of 2004. Exclusive of this restructuring charge, EBITDA in the Performance Products segment increased relative to the second quarter of 2003.
Polymers
The increase in revenues in the Polymers segment was primarily the result of higher average selling prices as industry demand strengthened and average selling prices increased in response to higher raw material and energy costs. Sales volumes were higher despite the planned turnaround and inspection of our Odessa, Texas facilities in the second quarter of 2004.
The decrease in EBITDA in the Polymers segment was due primarily to costs associated with the planned turnaround and inspection of our Odessa, Texas facilities and higher raw material and energy costs. In addition, we recorded a $5.1 million restructuring charge in the second quarter of 2004 related to the closure of one of our manufacturing units in Australia.
Base Chemicals
The increase in revenues in the Base Chemicals segment was primarily the result of higher sales volumes as demand continued to strengthen, and due to higher average selling prices in response to higher industry operating rates and higher raw material and energy costs.
The increase in EBITDA in the Base Chemicals segment was primarily the result of higher margins as price increases outpaced increases in raw material and energy costs.
Corporate and Other
Corporate and other items include unallocated corporate overhead, foreign exchange gains and losses and reorganization costs. For the three months ended June 30, 2004, net expenses from corporate and other items increased by $13.3 million to $17.4 million from $4.1 million for the same period in 2003. The increase in expenses was due, in part, to a $5.0 million decrease in unallocated foreign currency gains and a $2.5 million net loss from the early extinguishment of debt in the 2004 period.
9
Huntsman International Holdings LLC Segment Results
| In Millions |
Three Months Ended June 30, 2004 |
Three Months Ended June 30, 2003(3) |
Six Months Ended June 30, 2004 |
Six Months Ended June 30, 2003(3) |
|||||||||||
|---|---|---|---|---|---|---|---|---|---|---|---|---|---|---|---|
| Segment Revenues: | |||||||||||||||
| Polyurethanes | $ | 733.8 | $ | 565.8 | $ | 1,373.4 | $ | 1,120.7 | |||||||
| Performance Products | 190.9 | 164.5 | 375.0 | 325.6 | |||||||||||
| Pigments | 278.2 | 255.4 | 533.1 | 501.5 | |||||||||||
| Base Chemicals | 481.0 | 357.7 | 954.9 | 729.9 | |||||||||||
| Eliminations | (60.2 | ) | (36.0 | ) | (114.6 | ) | (72.6 | ) | |||||||
| Total | $ | 1,623.7 | $ | 1,307.4 | $ | 3,121.8 | $ | 2,605.1 | |||||||
| EBITDA: | |||||||||||||||
| Polyurethanes | $ | 100.0 | $ | 48.1 | $ | 172.8 | $ | 88.2 | |||||||
| Performance Products | 2.5 | (21.6 | ) | 4.3 | (19.2 | ) | |||||||||
| Pigments | (83.5 | ) | 30.9 | (75.8 | ) | 59.8 | |||||||||
| Base Chemicals | 57.8 | 37.4 | 89.2 | 63.8 | |||||||||||
| Corporate and other | (19.9 | ) | 15.0 | (20.9 | ) | 9.8 | |||||||||
| Total(2) | $ | 56.9 | $ | 109.8 | $ | 169.6 | $ | 202.4 | |||||||
| Adjusted Segment EBITDA: | |||||||||||||||
| Polyurethanes | $ | 118.1 | $ | 49.5 | $ | 195.7 | $ | 106.7 | |||||||
| Performance Products | 2.9 | (1.5 | ) | 4.7 | 0.9 | ||||||||||
| Pigments | 35.6 | 30.9 | 47.2 | 59.8 | |||||||||||
| Base Chemicals | 60.0 | 37.4 | 91.4 | 63.8 | |||||||||||
| Corporate and other | (16.9 | ) | 26.3 | (14.4 | ) | 33.1 | |||||||||
| Total(2) | $ | 199.7 | $ | 142.6 | $ | 324.6 | $ | 264.3 | |||||||
See page 15 for footnote explanations
Huntsman International Holdings LLC Three Months Ended June 30, 2004 (Compared to Three Months Ended June 30, 2003)
For the three months ended June 30, 2004, Huntsman International had EBITDA of $56.9 million, which included $124.9 million of restructuring charges, $3.0 million in losses on our accounts receivable securitization program, and $14.9 million in charges related to a non-recurring legal settlement, on revenues of $1,623.7 million, compared to EBITDA of $109.8 million, which included $21.5 million of restructuring charges and $11.3 million in losses on our accounts receivable securitization program, on revenues of $1,307.4 million for the same period in 2003.
Revenues for the three months ended June 30, 2004 increased to $1,623.7 million, or 24%, from $1,307.4 million during the same period in 2003. The increase in revenue was due to an increase in revenues in each of the segments.
EBITDA for the three months ended June 30, 2004 decreased to $56.9 million from $109.8 million during the same period in 2003. The decrease in EBITDA was due to increases in EBITDA in the Polyurethanes, Performance Products and Base Chemicals segments, offset by decreases in EBITDA in the Pigments segment. EBITDA was negatively impacted by $124.9 million and $21.5 million of restructuring charges recorded in the three months ended June 30, 2004 and 2003, respectively, and by $14.9 million in charges related to a non-recurring legal settlement in the 2004 period. Excluding the
10
impact of these charges and the losses on our accounts receivable securitization program, EBITDA increased to $199.7 million, or 40%, from $142.6 million as compared to the second quarter of 2003.
Polyurethanes
The increase in revenues in the Polyurethanes segment was primarily due to the result of an 8% increase in MDI average selling prices as compared to the 2003 period principally improved industry operating rates in MDI and due to the strength of the major European currencies versus the U.S. dollar. MDI sales volumes increased by 17% as compared to second quarter 2003 as industry demand strengthened.
The increase in EBITDA in the Polyurethanes segment was the result of stronger demand and higher MDI sales volumes and our ability to offset historically high benzene and energy costs with higher selling prices. EBITDA was negatively impacted by $18.1 million of restructuring charges recorded in the second quarter of 2004.
Performance Products
The increase in revenues in the Performance Products segment was primarily the result of a 12% increase in average selling prices, of which 6% was due to the strength of the major European currencies versus the U.S. dollar, and a 4% increase in sales volumes.
The increase in EBITDA in the Performance Products segment was primarily the result of $20.1 million of restructuring charges recorded in the second quarter of 2003. Exclusive of the impact of the restructuring charges in the prior period, EBITDA increased due to higher sales volumes, partially offset by lower margins as average selling prices failed to keep pace with increases in raw material and energy prices.
Pigments
The increase in revenues in the Pigments segment was primarily the result of a 9% increase in volumes relative to the second quarter of 2003. Average selling prices remained relatively flat as a 5% price decrease in local currency average selling prices was offset by currency movements due to the strength of the major European currencies versus the U.S. dollar.
The decrease in EBITDA in the Pigments segment was primarily the result of a $104.2 million restructuring charge recorded in the second quarter of 2004 in connection with the previously announced idling of capacity at the Company's Grimsby, U.K. and Umbogintwini, South Africa facilities, and a $14.9 million charge taken in connection with the settlement of certain product liability claims. Exclusive of these charges, EBITDA increased relative to the same period in 2003, primarily attributable to the 9% sales volume increase previously discussed.
Base Chemicals
The increase in revenues in the Base Chemicals segment was primarily the result of higher sales volumes as demand continued to strengthen, and due to higher average selling prices in response to higher industry operating rates, higher raw material and energy costs and the strength of the major European currencies versus the U.S. dollar.
The increase in EBITDA in the Base Chemicals segment was primarily the result of higher margins as price increases outpaced increases in raw material and energy costs.
11
Corporate and Other
Corporate and other items include unallocated corporate overhead, loss on our accounts receivable securitization program and unallocated foreign exchange gains and losses. For the three months ended June 30, 2004, net expenses from corporate and other items increased by $34.9 million to $19.9 million from EBITDA of $15.0 million for the same period in 2003. The increase was primarily due to unallocated foreign exchange losses of $5.4 million incurred in the second quarter of 2004 as compared to foreign currency gains of $34.7 million recorded in the second quarter of 2003, partially offset by a decrease in losses on our accounts receivable securitization program to $3.0 million in the three months ended June 30, 2004 from $11.3 million in the comparable period in 2003.
Huntsman Advanced Materials LLC Pro Forma Operating Results
| In Millions |
Three Months Ended June 30, 2004 |
Three Months Ended June 30, 2003(3) |
Six Months Ended June 30, 2004 |
Six Months Ended June 30, 2003(3) |
||||||||
|---|---|---|---|---|---|---|---|---|---|---|---|---|
| Revenues | $ | 287.6 | $ | 263.8 | $ | 572.3 | $ | 531.8 | ||||
| EBITDA(2) | 31.7 | (3.4 | ) | 65.2 | 9.6 | |||||||
| Adjusted EBITDA(2) | $ | 31.7 | $ | 23.6 | $ | 65.2 | $ | 42.6 | ||||
See page 15 for footnote explanations
Huntsman Advanced Materials LLC Three Months Ended June 30, 2004 (Compared to Three Months Ended June 30, 2003 Pro Forma)
For the three months ended June 30, 2004, Advanced Materials had EBITDA of $31.7 million on revenues of $287.6 million, compared to pro forma EBITDA of $(3.4) million, which included $21.5 million of reorganization charges and $5.5 million in contract settlement charges on revenues of $263.8 million for the same period in 2003.
The increase in revenues in the Advanced Materials segment was primarily the result of higher average selling prices, principally due to price increases in selected markets initiated in response to improved demand, and in certain instances, in response to higher raw material costs and the strength of the major European currencies versus the U.S. dollar.
The increase in EBITDA in the Advanced Materials segment was the result of increased revenue and improved product mix, as we strategically reduced sales volumes of lower margin basic epoxy resins and increased sales volumes of higher margin surface technologies, adhesives, electrical insulating materials and structural composites products.
Liquidity and Capital Resources
HMP Equity Holdings
HMP is a holding company established to hold the common equity in Huntsman LLC, Huntsman International Holdings and Advanced Materials. HMP maintains no credit facilities.
Huntsman LLC (excluding HIH)
As of June 30, 2004, Huntsman LLC had borrowings of approximately $87 million outstanding under its $275 million revolving credit facility in addition to approximately $16 million in letters of credit issued, and Huntsman LLC had approximately $31 million of cash. Huntsman LLC's cash and undrawn commitments under the revolving credit facility, as of March 31, 2004, were approximately $204 million. Capital expenditures for the six months ended June 30, 2004 were approximately
12
$30 million compared with approximately $37 million in the six months ended June 30, 2003. Huntsman LLC expects to spend approximately $70 million on capital expenditures in 2004.
Huntsman International Holdings
As of June 30, 2004, Huntsman International had borrowings of approximately $37 million outstanding under its revolving credit facility in addition to approximately $5 million in letters of credit issued, and Huntsman International had approximately $85 million of cash. Huntsman International also maintains $25 million of short-term discretionary overdraft facilities, of which the entire amount was available at June 30, 2004. Huntsman International's cash and undrawn commitments under the revolving credit facility and short-term overdraft facilities as of June 30, 2004 were approximately $468 million. Capital expenditures for the six months ended June 30, 2004 were approximately $60 million compared with approximately $54 million in the six months ended June 30, 2003. HIH expects to spend approximately $160 million on capital expenditures in 2004.
Huntsman Advanced Materials
As of June 30, 2004, Advanced Materials had no borrowings outstanding under its $60 million revolving credit facility and approximately $14 million in letters of credit issued thereunder. Advanced Materials had approximately $71 million of cash as of June 30, 2004 and undrawn commitments under the revolving credit facility were approximately $117 million. Capital expenditures for the six months ended June 30, 2004 were approximately $4 million as compared with approximately $6 million in six months ended June 30, 2003. Advanced Materials expects to spend approximately $25 million on capital expenditures in 2004, including approximately $15 million in capital expenditures associated with our restructuring efforts.
13
Outstanding Debt
| In Millions |
June 30, 2004 |
|||||
|---|---|---|---|---|---|---|
| Huntsman LLC (excluding HIH)(1): | ||||||
| Cash | $ | 31 | ||||
| Senior Secured Debt | 1,240 | |||||
| Senior Unsecured Debt | 400 | |||||
| Senior Subordinated Notes | 59 | |||||
| Other Debt(4) | 205 | |||||
| Subtotal | 1,904 | |||||
| Huntsman International(5): | ||||||
| Cash | 85 | |||||
| Senior Secured Debt | 1,277 | |||||
| Senior Unsecured Notes | 457 | |||||
| Senior Subordinated Notes | 1,150 | |||||
| Other Debt | 37 | |||||
| Subtotal (Huntsman International LLC) | 2,921 | |||||
| HIH Senior and Senior Sub. Discount Notes(6) | 850 | |||||
| Subtotal (Huntsman International Holdings LLC) | 3,770 | |||||
| Huntsman Advanced Materials: | ||||||
| Cash | 71 | |||||
| Senior Secured Notes | 348 | |||||
| Other Debt | 3 | |||||
| Subtotal | 351 | |||||
| HMP: | ||||||
| Cash | — | |||||
| Senior Secured Discount Notes(7) | 368 | |||||
| Elimination of HIH Senior Sub. Discount Notes(8) | (386 | ) | ||||
| Fair value adjustment of HIH Debt | 10 | |||||
| Total HMP Debt | $ | 6,018 | ||||
| Total HMP Cash | 187 | |||||
| Net Debt | $ | 5,831 | ||||
See page 15 for footnote explanations
14
15
Conference Call Information
We will hold a conference call to discuss the first quarter financial results of HMP, Huntsman International, Huntsman LLC and Advanced Materials on Tuesday, August 17, 2004 at 9:00am MDT.
| Call-in number for U.S. participants: | 800-230-1085 | |||
| Call in number for international participants: | 612-288-0318 |
The conference call will be replayed beginning August 17, 2004 at 5:45 PM MDT and ending Wednesday, August 24, 2004 at 11:59 PM MDT.
| Call-in numbers for the replay: | |||||
| Within the U.S.: | 800-475-6701 | ||||
| International: | 320-365-3844 | ||||
Access code for replay: |
742119 |
||||
Statements in this release that are not historical are forward-looking statements. These statements are based on management's current beliefs and expectations. The forward-looking statements in this release are subject to uncertainty and changes in circumstances and involve risks and uncertainties that may affect the company's operations, markets, products, services, prices and other factors as discussed in the Huntsman companies' filings with the Securities and Exchange Commission. Significant risks and uncertainties may relate to, but are not limited to, financial, economic, competitive, environmental, political, legal, regulatory and technological factors. Accordingly, there can be no assurance that the company's expectations will be realized. The company assumes no obligation to provide revisions to any forward-looking statements should circumstances change, except as otherwise required by securities and other applicable laws.
16