Exhibit 99.1
Release
![]()
| FOR IMMEDIATE RELEASE November 15, 2004 |
Media Contact: Don Olsen (281) 719-4175 |
Finance Contacts: Kimo Esplin John Heskett (801) 584-5700 |
HUNTSMAN RELEASES THIRD QUARTER RESULTS
RESULTS SHOW CONTINUED IMPROVEMENTS RELATIVE TO SECOND
QUARTER AND TO THE THIRD QUARTER OF LAST YEAR
Salt Lake City, UT—The Huntsman companies today reported third quarter 2004 EBITDA of $293.2 million including $33.9 million of restructuring and other charges. This compares to EBITDA in the third quarter of 2003 of $166.9 million including charges of $10.7 million. EBITDA for the second quarter of 2004 was $116.3 million including charges of $171.6 million. Third quarter 2004 Adjusted EBITDA was $327.1 million. This represents an 84% improvement as compared to third quarter 2003 Adjusted EBITDA of $177.6 million and 14% improvement as compared to second quarter 2004 Adjusted EBITDA of $287.9 million.
The Company computes Adjusted EBITDA to eliminate the impacts of restructuring and reorganization costs, gains and losses on the accounts receivable securitization program, gains and losses from early extinguishment of debt, non-recurring legal and contract settlements and minority interest in order to provide investors with a more meaningful measure of the companies' operational performance. See footnote (2) on page 9 for more information on EBITDA and Adjusted EBITDA.
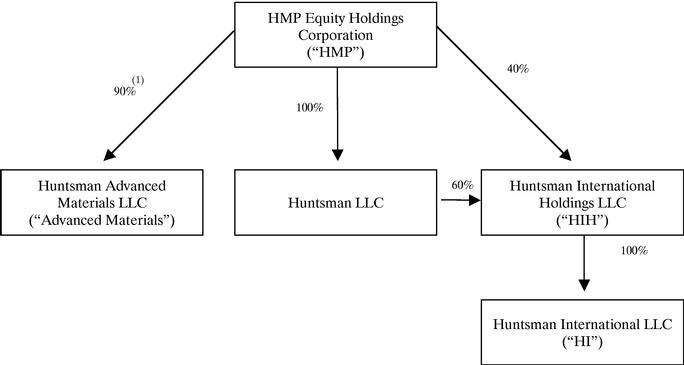
The combined Huntsman companies include HMP Equity Holdings Corporation ("HMP") and its principal operating subsidiaries Huntsman LLC, Huntsman International Holdings LLC ("Huntsman International" or "HIH") and Huntsman Advanced Materials LLC ("Advanced Materials").
As of September 30, 2004, HMP and its subsidiaries had combined cash and unused borrowing capacity of approximately $923 million, comprised of $185 million at Huntsman LLC (excluding HIH), $629 million at HIH, and $109 million at Advanced Materials.
Peter R. Huntsman, President and CEO, stated, "The third quarter results reflect a good, solid performance despite continued high and volatile energy and feedstock costs. We are finally approaching normalized levels of profitability in many of our products after years of difficult industry conditions. Our results also indicate ongoing success with our $200 million global cost reduction initiative. We remain cautiously optimistic about our outlook for the remainder of the year."
Abbreviated Organization Chart
2
HMP Equity Holdings Corporation Quarterly Operating Results
Three Months Ended September 30, 2004
| |
Huntsman LLC (Excl. HIH)(1) |
Huntsman International Holdings |
Huntsman Advanced Materials |
HMP Other/ Eliminations |
HMP Consolidated |
|||||||||||
|---|---|---|---|---|---|---|---|---|---|---|---|---|---|---|---|---|
| |
In Millions |
|||||||||||||||
| Revenues | $ | 1,078.8 | $ | 1,651.6 | $ | 294.1 | $ | (77.8 | ) | $ | 2,946.7 | |||||
| Gross profit | 82.8 | 226.7 | 72.7 | (8.5 | ) | 373.7 | ||||||||||
| SG&A/Other expenses | 38.8 | 103.7 | 28.4 | (3.5 | ) | 167.4 | ||||||||||
| Restructuring expenses | 5.3 | 37.9 | — | — | 43.2 | |||||||||||
| Operating income | 38.7 | 85.1 | 44.3 | (5.0 | ) | 163.1 | ||||||||||
Net (loss) income |
(9.3 |
) |
52.5 |
(3.2 |
) |
3.7 |
43.7 |
|||||||||
| Interest expense—net | 47.3 | 90.7 | 10.5 | 6.1 | 154.6 | |||||||||||
| Income tax expense (benefit) | 5.1 | (61.8 | ) | 36.4 | (15.8 | ) | (36.1 | ) | ||||||||
| Depreciation and amortization | 33.1 | 77.9 | 12.4 | 7.6 | 131.0 | |||||||||||
| EBITDA(2) | $ | 76.2 | $ | 159.3 | $ | 56.1 | $ | 1.6 | $ | 293.2 | ||||||
| Minority interest | — | — | — | 0.2 | 0.2 | |||||||||||
| Loss (gain) on early extinguishment of debt | (2.3 | ) | — | — | — | (2.3 | ) | |||||||||
| Legal/ contract expenses (credits), net | — | — | (10.9 | ) | — | (10.9 | ) | |||||||||
| Loss on accounts receivable securitization program | — | 3.7 | — | — | 3.7 | |||||||||||
| Restructuring expenses | 5.3 | 37.9 | — | — | 43.2 | |||||||||||
| Adjusted EBITDA(2) | $ | 79.2 | $ | 200.9 | $ | 45.2 | $ | 1.8 | $ | 327.1 | ||||||
See page 9 for footnote explanations
3
HMP Equity Holdings Corporation Quarterly Operating Results
Three Months Ended September 30, 2003
| |
Huntsman LLC (Excl. HIH)(1) |
Huntsman International Holdings |
Huntsman Advanced Materials |
HMP Other/ Eliminations |
HMP Consolidated |
|||||||||||
|---|---|---|---|---|---|---|---|---|---|---|---|---|---|---|---|---|
| |
In Millions |
|||||||||||||||
| Revenues | $ | 828.9 | $ | 1,275.7 | $ | 258.7 | $ | (61.1 | ) | $ | 2,302.2 | |||||
| Gross profit | 53.6 | 139.4 | 56.7 | (3.1 | ) | 246.6 | ||||||||||
| SG&A/Other expenses | 36.3 | 102.2 | 50.7 | 0.8 | 190.0 | |||||||||||
| Restructuring expenses | — | 4.8 | — | — | 4.8 | |||||||||||
| Operating income | 17.3 | 32.4 | 6.0 | (3.9 | ) | 51.8 | ||||||||||
Net loss |
(24.6 |
) |
(52.6 |
) |
(4.2 |
) |
(9.3 |
) |
(90.7 |
) |
||||||
Interest expense—net |
34.7 |
88.0 |
10.0 |
5.9 |
138.6 |
|||||||||||
| Income tax expense (benefit) | 7.4 | (5.3 | ) | 0.2 | — | 2.3 | ||||||||||
| Depreciation and amortization | 32.3 | 67.7 | 13.5 | 3.2 | 116.7 | |||||||||||
| EBITDA(2) | $ | 49.8 | $ | 97.8 | $ | 19.5 | $ | (0.2 | ) | $ | 166.9 | |||||
| Minority interest | — | 0.0 | — | (0.5 | ) | (0.5 | ) | |||||||||
| Asset write down | — | 3.0 | — | — | 3.0 | |||||||||||
| Loss on accounts receivable securitization program | — | 3.4 | — | — | 3.4 | |||||||||||
| Restructuring expenses | — | 4.8 | — | — | 4.8 | |||||||||||
| Adjusted EBITDA(2) | $ | 49.8 | $ | 109.0 | $ | 19.5 | $ | (0.7 | ) | $ | 177.6 | |||||
See page 9 for footnote explanations
4
HMP Equity Holdings Corporation Pro Forma Segment Results
| |
Three Months Ended September 30, 2004 |
Three Months Ended September 30, 2003 |
Nine Months Ended September 30, 2004 |
Nine Months Ended September 30, 2003(3) |
|||||||||||
|---|---|---|---|---|---|---|---|---|---|---|---|---|---|---|---|
| |
In Millions |
||||||||||||||
| Segment Revenues: | |||||||||||||||
| Polyurethanes | $ | 743.9 | $ | 597.4 | $ | 2,117.4 | $ | 1,718.1 | |||||||
| Advanced Materials | 294.1 | 258.7 | 866.4 | 790.5 | |||||||||||
| Performance Products | 493.7 | 439.5 | 1,399.7 | 1,266.3 | |||||||||||
| Polymers | 380.9 | 289.3 | 1,019.6 | 847.7 | |||||||||||
| Pigments | 261.6 | 251.0 | 794.7 | 752.5 | |||||||||||
| Base Chemicals | 985.5 | 639.3 | 2,755.8 | 1,954.2 | |||||||||||
| Eliminations | (213.0 | ) | (173.0 | ) | (595.9 | ) | (444.1 | ) | |||||||
| Total | $ | 2,946.7 | $ | 2,302.2 | $ | 8,357.7 | $ | 6,885.2 | |||||||
| Segment EBITDA: | |||||||||||||||
| Polyurethanes | $ | 97.9 | $ | 68.9 | $ | 270.7 | $ | 157.1 | |||||||
| Advanced Materials | 56.1 | 19.5 | 121.3 | (4.7 | ) | ||||||||||
| Performance Products | 31.5 | 41.6 | 82.9 | 90.3 | |||||||||||
| Polymers | 26.5 | 17.3 | 45.6 | 53.4 | |||||||||||
| Pigments | 22.2 | 28.5 | (53.6 | ) | 88.3 | ||||||||||
| Base Chemicals | 70.3 | 2.8 | 204.8 | 55.8 | |||||||||||
| Corporate and other | (11.3 | ) | (11.7 | ) | (54.1 | ) | (13.8 | ) | |||||||
| Total(2) | $ | 293.2 | $ | 166.9 | $ | 617.6 | $ | 426.4 | |||||||
| Segment Adjusted EBITDA: | |||||||||||||||
| Polyurethanes | $ | 107.8 | $ | 72.6 | $ | 303.5 | $ | 179.3 | |||||||
| Advanced Materials | 45.2 | 19.5 | 112.5 | 62.1 | |||||||||||
| Performance Products | 51.9 | 41.6 | 124.1 | 110.4 | |||||||||||
| Polymers | 28.9 | 17.3 | 53.2 | 54.3 | |||||||||||
| Pigments | 25.8 | 29.6 | 73.0 | 89.4 | |||||||||||
| Base Chemicals | 77.2 | 2.8 | 213.9 | 55.8 | |||||||||||
| Corporate and other | (9.7 | ) | (5.8 | ) | (40.9 | ) | 47.1 | ||||||||
| Total(2) | $ | 327.1 | $ | 177.6 | $ | 839.3 | $ | 598.4 | |||||||
See page 9 for footnote explanations
Three Months Ended September 30, 2004 (Compared to Three Months Ended September 30, 2003)
For the three months ended September 30, 2004, HMP generated EBITDA of $293.2 million, which included $43.2 million of restructuring charges, $3.7 million in losses on our accounts receivable securitization program, $2.3 million of net gains from the early extinguishment of debt, $10.9 million of net legal settlement credits and $0.2 million of minority interest. This compares to third quarter 2003 EBITDA of $166.9 million which included $4.8 million of restructuring charges, $3.4 million in losses on our accounts receivable securitization program, $3.0 million related to asset write downs and minority interest of $(0.5) million.
Revenues for the three months ended September 30, 2004 increased to $2,946.7 million, or 28%, from $2,302.2 million during the same period in 2003. Revenue increases were experienced in all segments.
5
EBITDA for the three months ended September 30, 2004 increased to $293.2 million, or 76%, from $166.9 million during the same period in 2003. The increase in EBITDA resulted from increases in EBITDA in the Polyurethanes, Advanced Materials, Polymers, and Base Chemicals segments, partially offset by decreases in EBITDA in the Performance Products and Pigments segments. Adjusted EBITDA for the third quarter of 2004 was $327.1 million which represented an 84% increase relative to the comparable period in 2003. Second quarter 2004 EBITDA and Adjusted EBITDA were $116.3 million and $287.9 million, respectively.
Polyurethanes
The increase in revenues in the Polyurethanes segment was primarily due to a 19% increase in average MDI selling prices and 13% higher sales volume in MDI as compared to the 2003 period. The increase in MDI average selling prices resulted principally from improved market demand, tighter supply, the strength of the major European currencies versus the U.S. dollar, and higher raw material and energy costs. MDI sales volumes reflect further extension of markets for MDI and recent improvements in global economic conditions.
The increase in EBITDA in the Polyurethanes segment was the result of increased sales volumes and higher selling prices, partially offset by higher raw materials and energy costs. EBITDA was negatively impacted by $9.9 million of restructuring charges recorded in the third quarter of 2004 and $3.7 million for the same period in 2003.
Advanced Materials
The increase in revenues in the Advanced Materials segment was primarily the result of higher average selling prices, principally due to price increases in selected markets, higher raw material costs and the effects of the strength of the major European currencies versus the U.S. dollar. Sales volumes were higher due to improved customer demand.
The increase in EBITDA in the Advanced Materials segment was the result of increased revenue, lower administrative expenses and improved product mix, partially offset by higher raw material costs and manufacturing costs resulting from the strength of the major European currencies versus the U.S. dollar. EBITDA was also positively impacted by $10.9 million in net legal settlement credits in the third quarter of 2004.
Performance Products
The increase in revenues in the Performance Products segment was primarily the result of higher average selling prices for all products partially offset by lower sales volumes for surfactants and LAB. Average selling prices increased by 18% in response to higher raw material and energy costs, improved market conditions and the strength of the European and Australian currencies versus the U.S. dollar. Sales volumes decreased by 4% primarily resulting from weak customer demand and increased competition in the marketplace.
The decrease in EBITDA in the Performance Products segment principally resulted from a restructuring charge of $20.4 million recorded in the third quarter of 2004. In addition, higher revenues were partially offset by higher raw material and energy costs.
Polymers
The increase in revenues in the Polymers segment in the third quarter 2004 relative to the same period 2003 was primarily the result of higher average selling prices and increased sales volumes. These increases were primarily in response to higher raw material and energy costs, and stronger customer demand.
6
The increase in EBITDA in the Polymers segment was due primarily to increased average selling prices, increased sales volumes and improved production efficiencies which more than offset higher raw material and energy costs. EBITDA was negatively impacted by a $2.4 million restructuring charge for the third quarter of 2004.
Pigments
The increase in revenues in the Pigments segment was primarily due to higher sales volumes as compared to the third quarter of 2003. In addition, average selling prices increased in North America and Asia but were lower in local European currencies.
The decrease in EBITDA in the Pigments segment was primarily the result of increased costs due to the strengthening of the major European currencies versus the U.S. dollar. In addition, the benefits of higher sales volume and higher average selling prices in North America and Asia were partially offset by lower average selling prices in local European currencies. EBITDA was also negatively impacted by $3.6 million of restructuring charges recorded in the third quarter of 2004 versus $1.1 million for the same period in 2003.
Base Chemicals
The increase in revenues in the Base Chemicals segment was primarily the result of a 58% increase in average selling prices in response to higher raw material and energy costs and the strengthening of major European currencies versus the U.S. dollars slightly offset by a 1% decrease in sales volumes.
The increase in EBITDA in the Base Chemicals segment was primarily the result of higher average selling prices, partially offset by higher raw material and energy costs. EBITDA was negatively impacted by a restructuring charge for the third quarter of 2004 of $6.9 million.
Corporate and Other
Corporate and other items include unallocated corporate overhead, loss on our accounts receivable securitization program, unallocated foreign exchange gains and losses, other non-operating income and expense and minority interest in subsidiaries' loss, and unallocated restructuring and reorganization costs.
Liquidity and Capital Resources
HMP Equity Holdings
HMP is a holding company established to hold the common equity in Huntsman LLC, Huntsman International Holdings and Advanced Materials. HMP maintains no credit facilities.
Huntsman LLC (excluding HIH)
As of September 30, 2004, Huntsman LLC had borrowings of $105.0 million outstanding and $16.1 million of outstanding letters of credit under its $275 million revolving credit facility. In addition, Huntsman LLC had $31.3 million of cash as of September 30, 2004. Huntsman LLC's cash and undrawn availability under the revolving credit facility, as of September 30, 2004 were approximately $185 million without taking into consideration the increased liquidity of approximately $82 million provided by the October 14, 2004 refinancing of HLLC credit facilities. Capital expenditures for the nine months ended September 30, 2004 were $46.1 million compared with $64.6 million in the nine months ended September 30, 2003. Huntsman LLC expects to spend approximately $70 million on capital expenditures in 2004.
7
Huntsman International Holdings LLC
As of September 30, 2004, Huntsman International had no borrowings outstanding and approximately $7 million of outstanding letters of credit under its $375 million revolving credit facility. In addition, Huntsman International had $147.7 million of cash as of September 30, 2004. Huntsman International also maintains $25 million of short-term discretionary overdraft facilities, all of which was available at September 30, 2004. Huntsman International's cash and undrawn availability under the revolving credit facility, off-balance sheet accounts receivable securitization facility and short-term overdraft facility as of September 30, 2004 was approximately $629 million. Capital expenditures for the nine months ended September 30, 2004 were $91.6 million compared with $95.7 million in the nine months ended September 30, 2003. HIH expects to spend approximately $140 to $150 million on capital expenditures in 2004.
Huntsman Advanced Materials LLC
As of September 30, 2004, Advanced Materials had no borrowings outstanding and $10.9 million of outstanding letters of credit under its $60 million revolving credit facility. In addition, Advanced Materials had $60.1 million of cash as of September 30, 2004. Advanced Materials cash and undrawn availability under the revolving credit facility was approximately $109 million. Capital expenditures for the nine months ended September 30, 2004 were $7.3 million as compared with $7.5 million in the nine months ended September 30, 2003. Advanced Materials expects to spend approximately $20 million on capital expenditures in 2004, including approximately $10 million in capital expenditures associated with our restructuring efforts.
8
| |
September 30, 2004 |
|||||
|---|---|---|---|---|---|---|
| |
In Millions |
|||||
| Huntsman LLC (excluding HIH)(1): | ||||||
| Cash | $ | 31 | ||||
| Senior Secured Debt | 1,258 | |||||
| Senior Unsecured Debt | 400 | |||||
| Senior Subordinated Notes | 59 | |||||
| Other Debt(4) | 233 | |||||
| Subtotal | 1,950 | |||||
| Huntsman International(5): | ||||||
| Cash | 148 | |||||
| Senior Secured Debt | 1,367 | |||||
| Senior Unsecured Notes | 456 | |||||
| Senior Subordinated Notes | 1,160 | |||||
| Other Debt | 38 | |||||
| Subtotal (Huntsman International LLC) | 3,021 | |||||
| HIH Senior and Senior Sub. Discount Notes(6) | 880 | |||||
| Subtotal (Huntsman International Holdings LLC) | 3,901 | |||||
| Huntsman Advanced Materials: | ||||||
| Cash | 60 | |||||
| Senior Secured Notes | 349 | |||||
| Other Debt | 3 | |||||
| Subtotal | 352 | |||||
| HMP: | ||||||
| Cash | — | |||||
| Senior Secured Discount Notes(7) | 389 | |||||
| Elimination of HIH Senior Sub. Discount Notes(8) | (401 | ) | ||||
| Other Debt | 10 | |||||
| Total HMP Debt | $ | 6,201 | ||||
| Total HMP Cash | 239 | |||||
| Net Debt | $ | 5,962 | ||||
See page 9 for footnote explanations
9
flow to meet Huntsman LLC's debt obligations and which are subject to the restrictive covenants in the agreements governing Huntsman LLC's debt.
10
Conference Call Information
We will hold a conference call to discuss the third quarter financial results of HMP, Huntsman International, Huntsman LLC and Advanced Materials on Tuesday, November 16, 2004 at 9:00am MST.
| Call-in number for U.S. participants: | (877) 857 - 2510 | |
| Call in number for international participants: | (706) 634 - 5675 |
The conference call will be replayed beginning November 16, 2004 at 5:00 PM MST and ending Tuesday, November 23, 2004 at 11:59 PM MST.
| Call-in numbers for the replay: | ||||
| Within the U.S.: | (800) 642 - 1687 | |||
| International: | (706) 645 - 9291 | |||
Access code for replay: |
2273894 |
Statements in this release that are not historical are forward-looking statements. These statements are based on management's current beliefs and expectations. The forward-looking statements in this release are subject to uncertainty and changes in circumstances and involve risks and uncertainties that may affect the company's operations, markets, products, services, prices and other factors as discussed in the Huntsman companies' filings with the Securities and Exchange Commission. Significant risks and uncertainties may relate to, but are not limited to, financial, economic, competitive, environmental, political, legal, regulatory and technological factors. Accordingly, there can be no assurance that the company's expectations will be realized. The company assumes no obligation to provide revisions to any forward-looking statements should circumstances change, except as otherwise required by securities and other applicable laws.
11