Use these links to rapidly review the document
TABLE OF CONTENTS
INDEX TO FINANCIAL STATEMENTS
As filed with the Securities and Exchange Commission on November 24, 2004
Registration No. 333-
SECURITIES AND EXCHANGE COMMISSION
Washington, D.C. 20549
FORM S-1
REGISTRATION STATEMENT
UNDER
THE SECURITIES ACT OF 1933
Huntsman Corporation
(Exact Name of Registrant as Specified in its Charter)
| Delaware (State or Other Jurisdiction of Incorporation or Organization) |
2800 (Primary Standard Industrial Classification Code Number) |
42-1648585 (I.R.S. Employer Identification Number) |
||
500 Huntsman Way Salt Lake City, UT 84108 (801) 584-5700 (Address, Including Zip Code and Telephone Number, Including Area Code, of Registrant's Principal Executive Offices) |
||||
Samuel D. Scruggs
Executive Vice President, General Counsel and Secretary
Huntsman Corporation
500 Huntsman Way
Salt Lake City, UT 84108
(801) 584-5700
(Name, Address, Including Zip Code, and Telephone
Number, Including Area Code, of Agent For Service)
| Copies to: | ||
| Jeffery B. Floyd Vinson & Elkins L.L.P. 1001 Fannin, Suite 2300 Houston, TX 77002 (713) 758-2222 |
Gregory A. Fernicola Skadden, Arps, Slate, Meagher & Flom LLP Four Times Square New York, NY 10036 (212) 735-3000 |
|
Approximate date of commencement of proposed sale to the public: As soon as practicable after the effective date of this registration statement.
If the securities being registered on this form are to be offered on a delayed or continuous basis pursuant to Rule 415 under the Securities Act of 1933, check the following box: o
If this form is filed to register additional securities for an offering pursuant to Rule 462(b) under the Securities Act, check the following box and list the Securities Act registration statement number of the earlier effective registration statement for the same offering: o
If this Form is a post-effective amendment filed pursuant to Rule 462(c) under the Securities Act, check the following box and list the Securities Act registration statement number of the earlier effective registration statement for the same offering: o
If this Form is a post-effective amendment filed pursuant to Rule 462(d) under the Securities Act, check the following box and list the Securities Act registration statement number of the earlier effective registration statement for the same offering: o
If delivery of the prospectus is expected to be made pursuant to Rule 434, check the following box: o
CALCULATION OF REGISTRATION FEE
| Title of Class of Securities to be Registered |
Proposed Maximum Aggregate Offering Price(1) |
Amount of Registration Fee |
||||
|---|---|---|---|---|---|---|
| Common Stock, $0.01 par value | $ | 1,610,000,000 | $ | 203,987 | ||
The Registrant hereby amends this registration statement on such date or dates as may be necessary to delay its effective date until the Registrant shall file a further amendment that specifically states that this registration statement shall thereafter become effective in accordance with Section 8(a) of the Securities Act or until this registration statement shall become effective on such date as the Securities and Exchange Commission, acting pursuant to said Section 8(a), may determine.
The information in this prospectus is not complete and may be changed. We may not sell these securities until the registration statement filed with the Securities and Exchange Commission is effective. This prospectus is not an offer to sell these securities and it is not soliciting an offer to buy these securities in any state where the offer or sale is not permitted.
SUBJECT TO COMPLETION, DATED NOVEMBER 24, 2004
P R O S P E C T U S
Huntsman Corporation
Shares
Common Stock
This is an initial public offering of our common stock. We currently expect the initial public offering price to be between $ and $ per share. We have applied to have the common stock listed on the New York Stock Exchange under the symbol "HUN."
We are selling shares of common stock and the selling stockholder named in this prospectus is selling shares. The shares being sold by the selling stockholder will represent less than 10% of the aggregate number of shares being sold in this offering. We will not receive any proceeds from the sale of shares by the selling stockholder.
We and the selling stockholder have granted the underwriters an option to purchase up to additional shares of common stock to cover over-allotments.
Investing in our common stock involves risks. See "Risk Factors" on page 15.
Neither the Securities and Exchange Commission nor any state securities commission has approved or disapproved of these securities or passed upon the accuracy or adequacy of this prospectus. Any representation to the contrary is a criminal offense.
| |
Per Share |
Total |
||||
|---|---|---|---|---|---|---|
| Public Offering Price | $ | $ | ||||
| Underwriting Discount | $ | $ | ||||
| Proceeds to Huntsman Corporation (before expenses) | $ | $ | ||||
| Proceeds to the selling stockholder (before expenses) | $ | $ | ||||
The Underwriters expect to deliver the shares to purchasers on or about , 2004.
| Citigroup |
Credit Suisse First Boston |
Merrill Lynch & Co. |
Deutsche Bank Securities |
The date of this prospectus is , 2004.
Until , 2005 (25 days after the date of this prospectus), all dealers that buy, sell or trade our common stock, whether or not participating in this offering, may be required to deliver a prospectus. This is in addition to the dealers' obligation to deliver a prospectus when acting as underwriters and with respect to unsold allotments or subscriptions.
You should rely only on the information contained in this prospectus. We have not authorized anyone to provide you with different information. If anyone provides you with different or inconsistent information, you should not rely on it. We are not making an offer of these securities in any jurisdiction where the offer is not permitted. You should not assume that the information contained in this prospectus is accurate as of any date other than the date on the front of this prospectus.
Industry and Market Data
This prospectus includes information with respect to market share, industry conditions and forecasts that we obtained from internal industry research, publicly available information (including industry publications and surveys), and surveys and market research provided by consultants (including Nexant, Inc., an international consulting and research firm ("Nexant"), Chemical Market Associates, Inc., an international consulting and research firm ("CMAI"), International Business Management Associates, an industry research and consulting firm ("IBMA"), and others). The publicly available information and the reports, forecasts and other research provided by consultants generally state that the information contained therein has been obtained from sources believed to be reliable, but there can be no assurance as to the accuracy and completeness of such information. We have not independently verified any of the data from third-party sources, nor have we ascertained the underlying economic assumptions relied upon therein. Similarly, our internal research and forecasts are based upon our management's understanding of industry conditions, and such information has not been verified by any independent sources. As is noted, certain statements in this prospectus are based on information provided by consultants that we commissioned to provide us with the referenced information.
i
The following summary highlights selected information from this prospectus and does not contain all of the information that you should consider before investing in our common stock. This prospectus contains information regarding our businesses and detailed financial information. You should carefully read this entire prospectus, including the historical and pro forma financial statements and related notes, before making an investment decision.
Huntsman Corporation is a new company formed to hold the existing businesses of Huntsman Holdings, LLC. Concurrently with the consummation of this offering, Huntsman Holdings, LLC will be merged into Huntsman Corporation in a transaction we refer to as the "Reorganization Transaction." The pro forma and pro forma as adjusted financial data included in this prospectus give effect to the transactions described in "Unaudited Pro Forma Financial Data."
In this prospectus, "Huntsman Corporation," the "company," "we," "us" or "our" refer to Huntsman Corporation and its subsidiaries, including our predecessor Huntsman Holdings, LLC after giving effect to the Reorganization Transaction, except where the context makes clear that the reference is only to Huntsman Corporation itself and not its subsidiaries. Huntsman Holdings, LLC has conducted its operations through three principal subsidiaries: Huntsman LLC, Huntsman International Holdings LLC and Huntsman Advanced Materials LLC. In this prospectus, the term "HLLC" refers to Huntsman LLC and, unless the context otherwise requires, its subsidiaries, the term "HIH" refers to Huntsman International Holdings LLC and, unless the context otherwise requires, its subsidiaries, and the term "Advanced Materials" refers to Huntsman Advanced Materials LLC and, unless the context otherwise requires, its subsidiaries. A glossary of chemical abbreviations used in this prospectus begins on page 166.
Overview
We are among the world's largest global manufacturers of differentiated and commodity chemical products. We manufacture a broad range of chemical products and formulations, which we market in more than 100 countries to a diversified group of consumer and industrial customers. Our products are used in a wide range of applications, including those in the adhesives, aerospace, automotive, construction products, durable and non-durable consumer products, electronics, medical, packaging, paints and coatings, power generation, refining and synthetic fiber industries. We are a leading global producer in many of our key product lines, including MDI, amines, surfactants, epoxy- based polymer formulations, maleic anhydride and titanium dioxide. We operate 63 manufacturing facilities located in 22 countries and employ over 11,500 associates. Our businesses benefit from significant vertical integration, large production scale and proprietary manufacturing technologies, which allow us to maintain a low-cost position. We had pro forma revenues for the nine months ended September 30, 2004 and the year ended December 31, 2003 of $8.4 billion and $9.3 billion, respectively.
Our Products and Segments
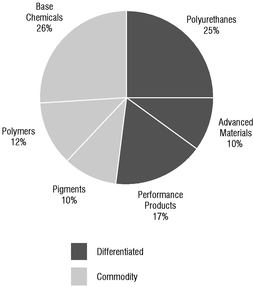
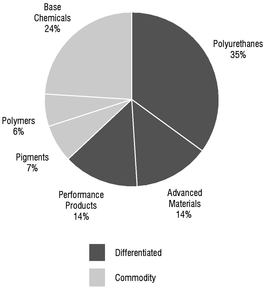
Our business is organized around our six segments: Polyurethanes, Advanced Materials, Performance Products, Pigments, Polymers and Base Chemicals. These segments can be divided into two broad categories: differentiated and commodity. We produce differentiated products primarily in our Polyurethanes, Advanced Materials and Performance Products segments. These products serve diverse end markets and are generally characterized by historical growth in excess of GDP growth resulting from product substitution and new product development, proprietary manufacturing processes and product formulations and a high degree of customer loyalty. Demand for these products tends to be driven by the value-added attributes that they create in our customers' end-use applications. While the demand for these differentiated products is also influenced by worldwide economic conditions and GDP growth, our differentiated products have tended to produce more stable profit margins and higher demand growth rates than our commodity products.
1
In our commodity chemical businesses, we produce titanium dioxide derived from titanium-bearing ores in our Pigments segment and petrochemical-based olefins, aromatics and polyolefins products in our Polymers and Base Chemicals segments. Since the coatings industry consumes a substantial portion of titanium dioxide production, seasonal demand patterns in the coatings industry drive the profitability of our Pigments segment. The profitability of our petrochemical-based commodity products is cyclical and has been experiencing a down cycle for the last several years, resulting primarily from significant new capacity additions, a decrease in demand reflecting weak global economic conditions and high raw material costs. Certain industry fundamentals have recently improved and, according to Nexant and IBMA, point to increased profitability in the markets for the major commodity products that we manufacture.
The following charts set forth information regarding the revenues and EBITDA of our six business segments for the nine months ended September 30, 2004:
| Segment Revenues* |
Segment EBITDA* |
|
|---|---|---|
|
|
2
The following table identifies the key products, their principal end markets and applications and representative customers of each of our segments:
| Segment |
Products |
End Markets and Applications |
Representative Customers |
|||
|---|---|---|---|---|---|---|
| Polyurethanes | MDI, PO, polyols, PG, TDI, TPU, aniline and MTBE | automotive interiors, refrigeration and appliance insulation, construction products, footwear, furniture cushioning, adhesives, specialized engineering applications and fuel additives | BMW, Collins & Aikman, Electrolux, Firestone, Lear, Louisiana Pacific, Shell, Weyerhauser | |||
Advanced Materials |
epoxy resin compounds and formulations; cross-linking, matting and curing agents; epoxy, acrylic and polyurethane-based adhesives and tooling resin formulations |
adhesives, aerospace, electrical power transmission, consumer electronics, civil engineering, wind power generation and automotive |
ABB, Akzo, BASF, Boeing, Bosch, Cytec, Hexcel, Rohm & Haas, Sherwin Williams |
|||
Performance Products |
ethyleneamines, ethanolamines, polyetheramines, carbonates, surfactants, LAB, maleic anhydride, EO and EG |
detergents, personal care products, agrochemicals, lubricant and fuel additives, paints and coatings, construction, marine and automotive products and PET fibers and resins |
ChevronTexaco, Colgate, Ecolab, Henkel, Monsanto, Procter & Gamble, Unilever |
|||
Pigments |
titanium dioxide |
paints and coatings, plastics, paper, printing inks, fibers and ceramics |
Akzo, Atofina, Clariant, ICI, Jotun, PolyOne |
|||
Polymers |
LDPE and LLDPE, polypropylene, EPS, styrene and APAO |
flexible and rigid packaging, adhesives and automotive, medical and construction products |
Ashland, Kerr, Kimberly Clark, Pliant, Polymer Group, PolyOne, Sealed Air |
|||
Base Chemicals |
ethylene, propylene, butadiene, benzene, cyclohexane, paraxylene and MTBE |
packaging film, polyester and nylon fibers, PVC, cleaning compounds, polymer resins, SBR rubber and fuel additives |
Bayer, BP, Bridgestone/Firestone, Dow, DuPontSA, Invista, Goodyear, Nova, Shell, Solvay |
Polyurethanes
We are a leading global manufacturer and marketer of a broad range of polyurethane chemicals, including MDI, PO, polyols, PG, TDI and TPU. Polyurethane chemicals are used to produce rigid and flexible foams, as well as coatings, adhesives, sealants and elastomers. We focus on the higher-margin, higher-growth markets for MDI and MDI-based polyurethane systems. Growth in our Polyurethanes
3
segment has been driven primarily by the continued substitution of MDI-based products for other materials across a broad range of applications. As a result, according to Nexant, global consumption of MDI grew at a compound annual growth rate of 7.3% from 1992 to 2003. Our Polyurethanes segment is widely recognized as an industry leader in utilizing state-of-the-art application technology to develop new polyurethane systems and applications. In 2003 approximately 20% of the revenues from our MDI-based products were generated from products and applications introduced in the previous three years. According to Nexant, we are the lowest-cost and second-largest producer of MDI in the world. We operate four primary Polyurethanes manufacturing facilities in the U.S. and Europe. We also operate 14 Polyurethanes formulation facilities, which are located in close proximity to our customers worldwide. We have a significant interest in a manufacturing joint venture that has recently begun construction of a low-cost, world-scale, integrated MDI production facility near Shanghai, China. We expect production at this facility to commence in 2006.
Advanced Materials
We are a leading global manufacturer and marketer of technologically advanced epoxy, acrylic and polyurethane-based polymer products. We focus on formulations and systems that are used to address customer-specific needs in a wide variety of industrial and consumer applications. Our products are used either as replacements for traditional materials such as metal, wood, clay, glass, stone and ceramics, or in applications where traditional materials do not meet demanding engineering specifications. For example, structural adhesives are used to replace metal rivets and advanced composites are used to replace traditional aluminum panels in the manufacture of aerospace components. Revenue growth for much of our product portfolio has historically been well in excess of global GDP growth. Our Advanced Materials segment is characterized by the breadth of our product offering, our expertise in complex chemistry, our long-standing relationships with our customers and our ability to develop and adapt our technology and our applications expertise for new markets and new applications. We market over 6,000 products to more than 5,000 customers. We operate 15 Advanced Materials synthesis and formulating facilities in North America, Europe, Asia, South America and Africa.
Performance Products
Our Performance Products segment is organized around three business groups, performance specialties, performance intermediates, and maleic anhydride and licensing, and serves a wide variety of consumer and industrial end markets. In performance specialties, we are a leading global producer of amines, carbonates and certain specialty surfactants. Growth in demand in our performance specialties business tends to be driven by the end-performance characteristics that our products deliver to our customers. These products are manufactured for use in a growing number of niche industrial end uses and have been characterized by growing demand and stable profitability. For example, we are one of two significant global producers of polyetheramines, for which our sales volumes have grown at a compound annual rate of over 13% in the last ten years due to strong demand in a number of industrial applications, such as epoxy curing agents, fuel additives and civil construction materials. In performance intermediates, we consume internally produced and third-party-sourced base petrochemicals in the manufacture of our surfactants, LAB and ethanolamines products, which are primarily used in detergent and consumer products applications. We also produce EG, which is primarily used in the production of polyester fibers and PET packaging, and EO, all of which is consumed internally in the production of our downstream products. We believe we are North America's largest and lowest-cost producer of maleic anhydride. Maleic anhydride is the building block for UPRs, mainly used in the production of fiberglass reinforced resins for marine, automotive and construction products. We are the leading global licensor of maleic anhydride manufacturing technology and are also the largest supplier of a catalyst used in the manufacture of maleic anhydride. We operate 16 Performance Products manufacturing facilities in North America, Europe and Australia.
4
Pigments
We are a leading global manufacturer and marketer of titanium dioxide, which is a white pigment used to impart whiteness, brightness and opacity to products such as paints, plastics, paper, printing inks, fibers and ceramics. According to IBMA, our Pigments segment, which operates under the trade name "Tioxide®," is the fourth largest producer of titanium dioxide in the world, with an estimated 12% of global production capacity, and the largest producer of titanium dioxide in Western Europe, with an estimated 23% of Western European production capacity. The global titanium dioxide market is characterized by a small number of large, global producers. We operate eight chloride-based and sulfate-based titanium dioxide manufacturing facilities located in North America, Europe, Asia and Africa.
Polymers
We manufacture and market polypropylene, polyethylene, EPS, EPS packaging and APAO. We consume internally produced and third-party-sourced base petrochemicals, including ethylene and propylene, as our primary raw materials in the manufacture of these products. In our polyethylene, APAO and certain of our polypropylene product lines, we pursue a targeted marketing strategy by focusing on those customers and end use applications that require customized polymer formulations. We produce these products at our smaller and more flexible Polymers manufacturing facilities and generally sell them at premium prices. In our other product lines, including the balance of our polypropylene, EPS and EPS packaging, we maintain leading regional market positions and operate cost-competitive manufacturing facilities. We operate six primary Polymers manufacturing facilities in North America and Australia. We are expanding the geographic scope of our polyethylene business and improving the integration of our European Base Chemicals business through the construction of an integrated, low-cost, world-scale LDPE plant to be located adjacent to our existing olefins facility in Wilton, U.K. Upon completion of this facility, which we expect will occur in late 2007, we will consume approximately 50% of the output from our U.K. ethylene unit in the production of LDPE.
Base Chemicals
We are a highly integrated North American and European producer of olefins and aromatics. We consume a substantial portion of our Base Chemicals products, such as ethylene, propylene and benzene, in our Performance Products and Polyurethanes segments. We believe this integration leads to higher operating rates for our Base Chemical assets, improved reliability of raw material supply for our other segments and reduced logistics and transportation costs. We operate four Base Chemicals manufacturing facilities located on the Texas Gulf Coast and in northeast England. These facilities are equipped to process a variety of oil- and natural gas-based feedstocks and benefit from their close proximity to multiple sources of these raw materials. This flexibility allows us to optimize our operating costs. These facilities also benefit from extensive underground storage capacity and logistics infrastructure, including pipelines, deepwater jetties and ethylene liquefaction facilities.
Current Industry Conditions
Over the past several years, the global chemical industry has generally experienced depressed market conditions due to weak demand, lower capacity utilization rates and high, volatile feedstock costs. In 2004, the profitability of the industry has generally improved as demand has recovered and additions of new manufacturing capacity have been limited.
Growth in our Polyurethanes and Advanced Materials segments has been driven by the continued substitution of our products for other materials across a broad range of applications as well as the level of global economic activity. Historically, demand for many of these products has grown at rates in excess of GDP growth. In Polyurethanes, this growth, particularly in Asia, has recently resulted in
5
improved demand and higher industry capacity utilization rates for many of our key products, including MDI. In 2004, the profitability of our Polyurethanes and Advanced Materials segments has improved due to increased demand in several of our key industrial end markets, including aerospace, automotive and construction products. This has allowed us to increase selling prices, which has more than offset increases in the cost of our primary raw materials, including benzene, propylene and chlorine.
In our Performance Products segment, demand for our performance specialties has generally continued to grow at rates in excess of GDP as overall demand is significantly influenced by new product and application development. In 2004, overall demand for most of our performance intermediates has generally been stable or improving, but excess surfactant manufacturing capacity in Europe and a decline in the use of LAB in new detergent formulations has limited our ability to increase prices in response to higher raw material costs. In EG, higher industry capacity utilization rates in 2004 due to stronger demand in the PET resin and Asian fiber markets have resulted in higher profitability.
Our Pigments segment experienced difficult business conditions throughout 2003 and much of 2004, reflecting soft economic conditions, but industry fundamentals have recently strengthened. This has resulted in higher capacity utilization rates and improved product pricing. The cost of titanium-bearing ores, which is the primary raw material used to produce titanium dioxide, has been relatively stable. IBMA currently expects that titanium dioxide industry operating rates will continue to increase as a result of increased demand from improving economic conditions and a lack of significant new planned capacity additions.
The profitability of our Polymers and Base Chemicals segments has historically been cyclical. The industry has recently operated in a down cycle that resulted from significant new capacity additions, weak demand reflecting soft global economic conditions and high crude oil and natural gas-based raw material costs. Despite continued high feedstock costs, the profitability of our Base Chemicals segment has improved in 2004 as demand has strengthened and average selling prices and profit margins have increased in most of our product lines. Limited new capacity additions have been announced for these products in North America and Western Europe over the next several years. Consequently, Nexant currently expects operating rates and profit margins in the polymers and base chemicals markets to increase as demand continues to recover as a result of improved global economic conditions.
Competitive Strengths
Leading Market Positions in Our Differentiated Product Segments
We derive a substantial portion of our revenues and EBITDA from our Polyurethanes, Advanced Materials and Performance Products segments, which manufacture our differentiated products. For the nine months ended September 30, 2004, these segments accounted for 52% of our revenues and 63% of our segment EBITDA, as described on page 2. We enjoy leading market positions in many of our primary product lines in these segments, including MDI, amines, carbonates, specialty surfactants, maleic anhydride, adhesives and epoxy-based polymer formulations. Demand for many of these products has been relatively resistant to changes in global economic conditions and has historically grown at rates in excess of GDP growth due to new product development and the continued substitution of our products for traditional materials and chemicals. We produce many of these products using our proprietary manufacturing processes, and we own many patents related to our processes, product formulations and their end-use applications. The markets for many of these products also benefit from a limited number of global producers, significant barriers to entry and a high degree of customer loyalty.
6
Large Scale, Integrated Manufacturer with Low Cost Operations
We are among the world's largest global manufacturers of chemical products. We operate 63 manufacturing facilities located in 22 countries as well as numerous sales, technical service and research facilities. We believe that the scale of our operations enables us to source raw materials and services that we purchase from third parties on terms more advantageous than those available to our smaller competitors. In addition, we are able to leverage selling, administrative and corporate overhead service platforms in order to reduce the operating costs of our businesses, including those that we have acquired. Our scale has also allowed us to rationalize smaller, less efficient capacity in recent years.
Our businesses also benefit from significant product integration. In 2003, we utilized approximately half of our ethylene production and all our EO production in the manufacturing operations of our Performance Products and Polymers segments. In addition, we utilized substantially all the benzene that we produced in the production of our aromatics and MDI. We believe that our high degree of product integration provides us with a competitive advantage over non-integrated producers by reducing both our exposure to cyclical raw material prices and our raw material transportation costs, as well as increasing the operating rates of our facilities. We believe our large production scale and integration enable us to manufacture and market our products at costs that are lower than those achieved by smaller, less integrated producers.
Diverse Customer Base Across Broad Geographic Regions
We sell our products to a highly diverse base of customers who are located in all major geographic regions and represent many end-use industry groups. We have thousands of customers in more than 100 countries. We have developed a global presence, with approximately 47% of our pro forma revenues for the year ended December 31, 2003 from North America, approximately 37% from Europe, approximately 12% from the Asia/Pacific region and approximately 4% from South America and other regions. We believe that this diversity limits our dependence on any particular product line, customer, end market or geographic region.
Experienced Management
We are managed by an experienced group of executives, led by Jon M. Huntsman, our Chairman of the Board, and Peter R. Huntsman, our President and Chief Executive Officer. Jon M. Huntsman is the founder of our company and has over 40 years of experience in the chemicals and plastics industries. Peter Huntsman has over 20 years of experience in the chemicals and plastics industries. Both have been instrumental in leading our company through periods of growth and industry cycles. The balance of our executive management team has extensive industry experience and prior work experience at leading chemical and professional services firms, including Imperial Chemical Industries PLC, Texaco, Inc., Mobil Corporation, Bankers Trust Company and Skadden, Arps, Slate, Meagher & Flom LLP. Throughout our history, our management team has demonstrated expertise and entrepreneurial spirit in expanding our businesses, integrating numerous acquisitions and executing on significant cost cutting programs.
Business Strategy
Expand Our Differentiated Segments
Since 1999, we have invested over $500 million in discretionary capital expenditures and completed seven strategic acquisitions to expand our differentiated segments. As a result, for the nine months ended September 30, 2004, these segments produced 52% of our revenues and 63% of our segment EBITDA. We intend to continue to invest our capital in our higher-growth, higher-margin differentiated segments in order to expand the breadth of our product offerings, extend the geographic scope of these businesses and increase our production capacity to meet growing customer demand. As
7
part of this strategy, we have a significant interest in a manufacturing joint venture that has recently begun construction of a world-scale MDI production facility near Shanghai, China. We believe that this will enable us to strengthen our long-standing presence in China and to further capitalize on the growth in demand for MDI in Asia. We intend to continue to invest in our global research and development capabilities in order to meet the increasingly sophisticated needs of our customers in areas of new product development and product application technology. We have recently announced that we will consolidate substantially all of our existing North American Polyurethanes, Advanced Materials and Performance Products research and development, technical service and process technology capabilities in a new, state-of-the-art facility to be constructed in The Woodlands, Texas.
Maximize Cash Generated By Our Commodity Segments
We derived 48% of our revenues and 37% of our segment EBITDA for the nine months ended September 30, 2004 from our Pigments, Polymers and Base Chemicals segments. We believe we have cost-competitive facilities in each of these segments, which produce primarily commodity products. In periods of favorable market conditions, our commodity businesses have historically generated significant amounts of free cash flow. We intend to continue to selectively invest sufficient capital to sustain the competitive position of our existing commodity facilities and improve their cost structure. In addition, we intend to capitalize on the low-cost position of our Wilton, U.K. olefins facility by constructing a world-scale LDPE facility on an adjacent site.
Continue Focus on Improving Operational Efficiencies
We continuously focus on identifying opportunities to reduce our operating costs and maximize our operating efficiency. We have completed a number of targeted cost reduction programs and other actions since 1999. These programs have included, among other things, the closing of seven high-cost manufacturing units as well as reducing corporate and administrative costs. More recently, we have announced a comprehensive global cost reduction program, which we refer to as "Project Coronado," with a goal of further reducing our annual fixed manufacturing and selling, general and administrative costs by $200 million by 2006. In connection with Project Coronado, we have recently announced the closure of eight smaller, less competitive manufacturing units in our Polyurethanes, Advanced Materials, Performance Products and Pigments segments. These and other actions have resulted in the reduction of approximately 1,500 employees in these businesses since 2000.
Further Reduce Our Indebtedness
We intend to use substantially all of our net proceeds from this offering to reduce our outstanding indebtedness. This will result in a significant reduction in our annual interest expense. If the profitability of our businesses continues to improve, we intend to further reduce the level of our indebtedness.
Our History
Jon M. Huntsman founded the predecessor to our company in the early 1970s as a small packaging company. Since then, we have grown through a series of significant acquisitions and now own a global portfolio of commodity and differentiated businesses. In 1993, we purchased the LAB and maleic anhydride businesses of The Monsanto Company. In 1994, we purchased the global chemical business from what was formerly Texaco Inc. In 1997, we purchased our PO business from Texaco. Also in 1997, we acquired Rexene Corporation, significantly increasing the size of our Polymers business. In 1999, we acquired certain polyurethanes, pigments and European petrochemicals businesses from Imperial Chemical Industries PLC ("ICI"). In 2000, we completed the acquisition of the Morton global TPU business from The Rohm and Haas Company. In 2001, we completed our acquisition of the global ethyleneamines business of Dow Chemical Company, and we completed our acquisition of the
8
Albright & Wilson European surfactants business from Rhodia S.A. In 2003, we completed our acquisition of 88% of our Advanced Materials business through the purchase of Vantico Group S.A., and we now own approximately 90% of Advanced Materials.
We have also divested certain non-core businesses, including our packaging subsidiary in 1997 and our global styrenics business in 1998.
The Reorganization Transaction
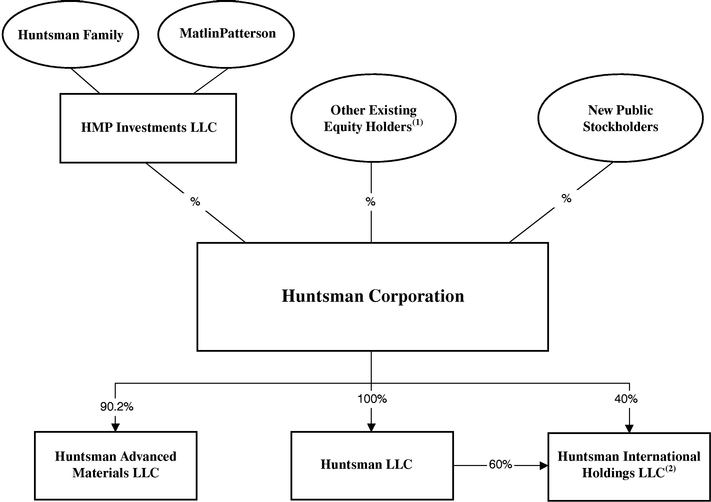
We will consummate the Reorganization Transaction in connection with the completion of this offering. In the Reorganization Transaction, Huntsman Holdings, LLC will merge into us, and the existing holders of the common and preferred membership interests of Huntsman Holdings, LLC, including the mandatorily redeemable preferred interests, will receive, directly or indirectly, shares of our common stock in exchange for their interests. In addition, the holders of warrants in our subsidiary HMP Equity Holdings Corporation ("HMP") will exchange all of their warrants for shares of our common stock. Immediately prior to the merger, Huntsman Family Holdings Company LLC ("Huntsman Family Holdings"), which is owned by Jon M. Huntsman and certain members of his family, and MatlinPatterson Global Opportunities Partners L.P., MatlinPatterson Global Opportunities B, L.P. and MatlinPatterson Global Oportunities (Bermuda), L.P. (collectively, "MatlinPatterson") will contribute all of their membership interests in Huntsman Holdings, LLC to HMP Investments LLC, a new entity formed to hold such interests ("Investments LLC"). Investments LLC will receive shares of our common stock in exchange for these interests. Huntsman Family Holdings will control Investments LLC, including the voting of the shares of our common stock held by Investments LLC. However, Investments LLC will not be able to vote its shares of our common stock in favor of certain corporate actions without the consent of MatlinPatterson. MatlinPatterson will have control over the disposition of the shares of our common stock held by Investments LLC that are allocated to MatlinPatterson's membership interests in Investments LLC. In addition, Huntsman Family Holdings has agreed to cause all of the shares of our common stock held by Investments LLC to be voted in favor of the election to our board of directors of two nominees designated by MatlinPatterson. Immediately following the Reorganization Transaction and this offering, Investments LLC will hold a majority of our outstanding common stock.
9
The following chart reflects our organizational structure immediately after the completion of this offering.
10
The Offering
| Issuer | Huntsman Corporation | |
Common stock offered by us |
shares |
|
Common stock offered by the selling stockholder |
shares |
|
Common stock to be outstanding after this offering |
shares |
|
Use of Proceeds |
We estimate that the net proceeds to us from the offering will be approximately $1,250 million. We intend to use these net proceeds for the repayment of outstanding indebtedness and for general corporate purposes. |
|
We will not receive any of the proceeds from the sale of shares by the selling stockholder. See "Use of Proceeds." |
||
Proposed New York Stock Exchange Symbol |
HUN |
|
Risk Factors |
This offering involves risks. See "Risk Factors" on page 15. |
Unless we specifically state otherwise, all information in this prospectus:
Our principal executive offices are located at 500 Huntsman Way, Salt Lake City, Utah 84108, and our telephone number is (801) 584-5700.
11
SUMMARY HISTORICAL AND PRO FORMA AS ADJUSTED FINANCIAL DATA
The summary historical financial data set forth below presents the historical financial data of our predecessor Huntsman Holdings, LLC. In such financial data, HIH is accounted for using the equity method of accounting through April 30, 2003. Effective May 1, 2003, as a result of the HIH Consolidation Transaction (as defined below), we have consolidated the financial results of HIH. Effective July 1, 2003, as a result of the AdMat Transaction (as defined below), we have consolidated the financial results of Advanced Materials. As a result, the financial information as of and for the year ended December 31, 2003 is not comparable to the prior years' historical financial data presented herein, and the financial information as of and for the nine months ended September 30, 2004 is not comparable to the financial information as of and for the nine months ended September 30, 2003.
In order to present data that is useful for comparative purposes, we have provided pro forma as adjusted statement of operations data for the year ended December 31, 2003 and the nine months ended September 30, 2003 and 2004, which gives pro forma effect to the following transactions as if each transaction had occurred on January 1, 2003:
and which is adjusted to give effect to the following transactions as if each transaction had occurred on January 1, 2003:
We have also provided pro forma as adjusted balance sheet data which gives effect to the following transactions as if each transaction had occurred on September 30, 2004:
The unaudited pro forma as adjusted financial data does not purport to be indicative of the combined financial position or results of operations of future periods or indicative of results that would have occurred had the above transactions been completed on the dates indicated.
The summary financial data set forth below should be read in conjunction with the Consolidated Financial Statements, "Management's Discussion and Analysis of Financial Condition and Results of
12
Operations," "Unaudited Pro Forma Financial Data," and "Selected Historical Financial Data" included elsewhere in this prospectus and, in each case, the notes related thereto.
| |
Year Ended December 31, |
Nine Months Ended September 30, |
|||||||||||||||||||||||
|---|---|---|---|---|---|---|---|---|---|---|---|---|---|---|---|---|---|---|---|---|---|---|---|---|---|
| |
|
|
|
Pro Forma As Adjusted |
|
|
Pro Forma As Adjusted |
||||||||||||||||||
| |
2001 |
2002 |
2003 |
2003(a) |
2003 |
2004 |
2003(a) |
2004(a) |
|||||||||||||||||
| |
(in millions) |
||||||||||||||||||||||||
| Statement of Operations Data: | |||||||||||||||||||||||||
| Revenues | $ | 2,757.4 | $ | 2,661.0 | $ | 7,080.9 | $ | 9,252.4 | $ | 4,711.1 | $ | 8,357.7 | $ | 6,885.2 | $ | 8,357.7 | |||||||||
| Cost of goods sold | 2,666.6 | 2,421.0 | 6,373.1 | 8,255.1 | 4,258.7 | 7,358.0 | 6,150.1 | 7,358.0 | |||||||||||||||||
| Gross profit | 90.8 | 240.0 | 707.8 | 997.3 | 452.4 | 999.7 | 735.1 | 999.7 | |||||||||||||||||
| Operating expenses | 211.7 | 174.7 | 493.4 | 732.2 | 333.3 | 580.9 | 567.2 | 580.9 | |||||||||||||||||
| Restructuring, impairment and plant closing costs (credit) | 588.5 | (1.0 | ) | 37.9 | 55.0 | 27.2 | 202.4 | 44.3 | 202.4 | ||||||||||||||||
| Operating (loss) income | (709.4 | ) | 66.3 | 176.5 | 210.1 | 91.9 | 216.4 | 123.6 | 216.4 | ||||||||||||||||
| Interest expense—net | (239.3 | ) | (181.9 | ) | (409.1 | ) | (413.6 | ) | (260.7 | ) | (459.5 | ) | (310.0 | ) | (315.3 | ) | |||||||||
| Loss on sale of accounts receivable | (5.9 | ) | — | (20.4 | ) | (32.4 | ) | (11.9 | ) | (10.2 | ) | (24.0 | ) | (10.2 | ) | ||||||||||
| Other income (expense) | 0.6 | (7.6 | ) | — | (2.2 | ) | 0.4 | (0.8 | ) | (1.8 | ) | (0.8 | ) | ||||||||||||
| Equity in (loss) income of unconsolidated affiliates | (86.8 | ) | (31.4 | ) | (37.5 | ) | 1.5 | (38.2 | ) | 3.0 | 0.8 | 3.0 | |||||||||||||
| Income tax benefit (expense) | 184.9 | (8.5 | ) | (30.8 | ) | (32.1 | ) | 3.8 | 25.7 | 2.4 | 25.7 | ||||||||||||||
| Minority interest in subsidiaries' loss (income) | 13.1 | (28.8 | ) | 1.5 | 6.8 | 0.5 | (1.1 | ) | 5.8 | (1.1 | ) | ||||||||||||||
| Loss from continuing operations | (842.8 | ) | (191.9 | ) | (319.8 | ) | (261.9 | ) | (214.2 | ) | (226.5 | ) | (203.2 | ) | (82.3 | ) | |||||||||
| Cumulative effect of accounting changes(b) | 0.1 | 169.7 | — | — | — | — | — | — | |||||||||||||||||
| Net loss | $ | (842.7 | ) | $ | (22.2 | ) | $ | (319.8 | ) | $ | (261.9 | ) | $ | (214.2 | ) | $ | (226.5 | ) | $ | (203.2 | ) | $ | (82.3 | ) | |
Other Data: |
|||||||||||||||||||||||||
| EBITDA(c) | $ | (590.8 | ) | $ | 320.9 | $ | 473.5 | $ | 663.5 | $ | 273.2 | $ | 617.6 | $ | 463.3 | $ | 617.6 | ||||||||
| Total unusual items of (expense) income included in EBITDA(d) | (602.0 | ) | 145.4 | (63.3 | ) | (126.2 | ) | (42.1 | ) | (220.6 | ) | (107.1 | ) | (220.6 | ) | ||||||||||
| Depreciation and amortization | 197.5 | 152.7 | 353.4 | 479.7 | 230.5 | 410.3 | 358.9 | 410.3 | |||||||||||||||||
| Capital expenditures | 76.4 | 70.2 | 191.0 | 228.9 | 129.9 | 145.0 | 167.8 | 145.0 | |||||||||||||||||
Balance Sheet Data (at period end): |
|||||||||||||||||||||||||
| Total assets | $ | 8,993.8 | $ | 8,943.1 | |||||||||||||||||||||
| Total debt | 6,200.7 | 5,128.1 | |||||||||||||||||||||||
| Total liabilities | 8,724.4 | 7,643.3 | |||||||||||||||||||||||
| Stockholders' (deficit) equity | (441.4 | ) | 1,270.6 | ||||||||||||||||||||||
13
| |
Year Ended December 31, |
Nine Months Ended September 30, |
|||||||||||||||||||||||
|---|---|---|---|---|---|---|---|---|---|---|---|---|---|---|---|---|---|---|---|---|---|---|---|---|---|
| |
|
|
|
Pro Forma As Adjusted |
|
|
Pro Forma As Adjusted |
||||||||||||||||||
| |
2001 |
2002 |
2003 |
2003 |
2003 |
2004 |
2003 |
2004 |
|||||||||||||||||
| |
(in millions) |
||||||||||||||||||||||||
| Net loss | $ | (842.7 | ) | $ | (22.2 | ) | $ | (319.8 | ) | $ | (261.9 | ) | $ | (214.2 | ) | $ | (226.5 | ) | $ | (203.2 | ) | $ | (82.3 | ) | |
| Depreciation and amortization | 197.5 | 152.7 | 353.4 | 479.7 | 230.5 | 410.3 | 358.9 | 410.3 | |||||||||||||||||
| Interest expense, net | 239.3 | 181.9 | 409.1 | 413.6 | 260.7 | 459.5 | 310.0 | 315.3 | |||||||||||||||||
| Income tax (benefit) expense | (184.9 | ) | 8.5 | 30.8 | 32.1 | (3.8 | ) | (25.7 | ) | (2.4 | ) | (25.7 | ) | ||||||||||||
EBITDA |
$ |
(590.8 |
) |
$ |
320.9 |
$ |
473.5 |
$ |
663.5 |
$ |
273.2 |
$ |
617.6 |
$ |
463.3 |
$ |
617.6 |
||||||||
| |
Year Ended December 31, |
Nine Months Ended September 30, |
|||||||||||||||||||||||
|---|---|---|---|---|---|---|---|---|---|---|---|---|---|---|---|---|---|---|---|---|---|---|---|---|---|
| |
|
|
|
Pro Forma As Adjusted |
|
|
Pro Forma As Adjusted |
||||||||||||||||||
| |
2001 |
2002 |
2003 |
2003 |
2003 |
2004 |
2003 |
2004 |
|||||||||||||||||
| |
(in millions) |
||||||||||||||||||||||||
| Early extinguishment of debt(1) | $ | (1.1 | ) | $ | (6.7 | ) | $ | — | $ | — | $ | — | $ | (1.9 | ) | $ | — | $ | (1.9 | ) | |||||
| Legal and contract settlement expense, net(2) | — | — | (2.0 | ) | (5.5 | ) | — | (6.1 | ) | (5.5 | ) | (6.1 | ) | ||||||||||||
| Loss on sale of accounts receivable(3) | (5.9 | ) | — | (20.4 | ) | (32.4 | ) | (11.9 | ) | (10.2 | ) | (24.0 | ) | (10.2 | ) | ||||||||||
| Asset write down(4) | — | — | (3.0 | ) | (5.8 | ) | (3.0 | ) | — | (5.8 | ) | — | |||||||||||||
| Restructuring, impairment and plant closing costs(5) | (588.5 | ) | 1.0 | (37.9 | ) | (55.0 | ) | (27.2 | ) | (202.4 | ) | (44.3 | ) | (202.4 | ) | ||||||||||
| Reorganization costs(6) | (6.6 | ) | (18.6 | ) | — | (27.5 | ) | — | — | (27.5 | ) | — | |||||||||||||
| Cumulative effect of accounting changes | 0.1 | 169.7 | — | — | — | — | — | — | |||||||||||||||||
Total unusual items of (expense) income included in EBITDA |
$ |
(602.0 |
) |
$ |
145.4 |
$ |
(63.3 |
) |
$ |
(126.2 |
) |
$ |
(42.1 |
) |
$ |
(220.6 |
) |
$ |
(107.1 |
) |
$ |
(220.6 |
) |
||
14
You should carefully consider the risks described below in addition to all other information provided to you in this prospectus before making an investment decision. The risks described below are not the only risks we face. Additional risks and uncertainties not currently known to us or that we currently deem to be immaterial may also materially and adversely affect our business operations. Any of the following risks could materially and adversely affect our business, results of operations and financial condition.
Risks Related to Our Business
We have a history of losses and may incur losses in the future, which could materially and adversely affect the market price of our common stock.
We have incurred net losses in each of the last five fiscal years and in the nine months ended September 30, 2004, and we had an accumulated deficit of $1,470 million as of September 30, 2004. We will need to generate additional revenues and/or significantly reduce costs, including interest expense, in order to avoid additional net losses in future periods. If we do achieve profitability, we may not sustain or increase profitability on a quarterly or annual basis. Failure to achieve or maintain profitability may materially and adversely affect the market price of our common stock.
Our available cash and access to additional capital may be limited by our substantial leverage, which could restrict our ability to grow our businesses.
Following this offering, we will have a substantial amount of indebtedness outstanding at our subsidiaries. As of September 30, 2004, on a pro forma as adjusted basis, we had total consolidated outstanding indebtedness of approximately $5,128.1 million (including the current portion of long-term debt). We may incur substantial additional debt from time to time for a variety of purposes. Our outstanding debt could have important consequences for our businesses, including:
The existing debt instruments of our subsidiaries contain restrictive covenants that may limit our ability to utilize our cash flow to operate our businesses by restricting our subsidiaries' ability to, among other things, make prepayments of certain debt, pay dividends to us, make investments and merge or consolidate and transfer or sell assets.
If we are unable to generate sufficient cash flow or are otherwise unable to obtain the funds required to meet payments of principal and interest on our indebtedness, or if we otherwise fail to comply with the various covenants in the instruments governing our indebtedness, we could be in default under the terms of those instruments. In the event of a default, a holder of the indebtedness could elect to declare all the funds borrowed under those instruments to be due and payable together with accrued and unpaid interest, the lenders under our credit facilities could elect to terminate their commitments thereunder and we or one or more of our subsidiaries could be forced into bankruptcy or
15
liquidation. Any of the foregoing consequences could have a material adverse effect on our business, results of operations and financial condition.
We are a holding company, with no revenue generating operations of our own. We depend on the performance of our subsidiaries and their ability to make distributions to us.
We are a holding company with no business operations, sources of income, indebtedness or assets of our own other than our ownership interests in our subsidiaries. Because all our operations are conducted by our subsidiaries, our cash flow and our ability to repay our debt that we may incur after this offering and our ability to pay dividends to our stockholders are dependent upon cash dividends and distributions or other transfers from our subsidiaries. Payment of dividends, distributions, loans or advances by our subsidiaries to us are subject to restrictions imposed by the current and future debt instruments of our subsidiaries. Moreover, our principal operating subsidiaries, HIH, HLLC and Advanced Materials, are financed separately from each other, and the debt instruments of each such subsidiary limit our ability to allocate cash flow or resources from one subsidiary, and its related group of subsidiaries, to another subsidiary group. Further, payments of dividends and other distributions by Advanced Materials may be subject to the consent of the holders of minority interests in Advanced Materials. In addition, those payments could be subject to restrictions on dividends or repatriation of earnings under applicable local law, monetary transfer restrictions and foreign currency exchange regulations in the jurisdictions in which our subsidiaries operate. As of September 30, 2004, on a pro forma as adjusted basis, our subsidiaries had total outstanding indebtedness of approximately $5,128.1 million (including the current portion of long-term debt).
Our subsidiaries are separate and distinct legal entities. Any right that we have to receive any assets of or distributions from any of our subsidiaries upon the bankruptcy, dissolution, liquidation or reorganization of any such subsidiary, or to realize proceeds from the sale of their assets, will be junior to the claims of that subsidiary's creditors, including trade creditors and holders of debt or preferred stock issued by that subsidiary.
Demand for some of our products is cyclical, and we may experience prolonged depressed market conditions for our products.
Historically, the markets for many of our products, particularly our commodity products, have experienced alternating periods of tight supply, causing prices and profit margins to increase, followed by periods of capacity additions, resulting in oversupply and declining prices and profit margins. Currently, several of our markets continue to experience conditions of oversupply, and the pricing of our products in these markets is depressed. We cannot guarantee that future growth in demand for these products will be sufficient to alleviate any existing or future conditions of excess industry capacity or that such conditions will not be sustained or further aggravated by anticipated or unanticipated capacity additions or other events.
We derive a substantial portion of our revenue from sales of commodity products. Due to the commodity nature of these products, competition in these markets is based primarily on price and to a lesser extent on performance, product quality, product deliverability and customer service. As a result, we may not be able to protect our market position for these products by product differentiation and may not be able to pass on cost increases to our customers. Historically, the prices for our commodity products have been cyclical and sensitive to relative changes in supply and demand, the availability and price of feedstocks and general economic conditions. Our other products may be subject to these same factors, but, typically, the impact of these factors is greatest on our commodity products.
16
Significant price volatility or interruptions in supply of our raw materials may result in increased costs that we may be unable to pass on to our customers, which could negatively affect our profitability.
The prices of the raw materials that we purchase from third parties are cyclical and volatile. We purchase a substantial portion of these raw materials from third party suppliers, and the cost of these raw materials represents a substantial portion of our operating expenses. The prices for a number of these raw materials generally follow price trends of, and vary with market conditions for, crude oil and natural gas feedstocks, which are highly volatile and cyclical. In recent periods, we have experienced significantly higher crude oil prices, which have resulted in increased raw material prices.
Although we frequently enter into supply agreements to acquire these raw materials, these agreements typically provide for market based pricing and provide us only limited protection against price volatility. While we attempt to match cost increases with corresponding product price increases, we are not always able to raise product prices immediately or at all. Timing differences between raw material prices, which may change daily, and contract product prices, which in many cases are negotiated only monthly or less often, have had and may continue to have a negative effect on profitability. If any of our suppliers is unable to meet its obligations under present supply agreements, we may be forced to pay higher prices to obtain the necessary raw materials from other sources and we may not be able to increase prices for our finished products to recoup the higher raw materials cost. In addition, if any of the raw materials that we use become unavailable within the geographic area from which they are now sourced, then we may not be able to obtain suitable and cost effective substitutes. Any underlying cost increase that we are not able to pass on to our customers or any interruption in supply of raw materials could have a material adverse effect on our business, results of operations and financial condition.
The industries in which we compete are highly competitive, and we may not be able to compete effectively with our competitors that have greater financial resources, which could have a material adverse effect on our business, results of operations and financial condition.
The industries in which we operate are highly competitive. Among our competitors are some of the world's largest chemical companies and major integrated petroleum companies that have their own raw material resources. Some of these companies may be able to produce products more economically than we can. In addition, some of our competitors have greater financial resources, which may enable them to invest significant capital into their businesses, including expenditures for research and development. If any of our current or future competitors develops proprietary technology that enables them to produce products at a significantly lower cost, our technology could be rendered uneconomical or obsolete. Moreover, certain of our businesses use technology that is widely available. Accordingly, barriers to entry, apart from capital availability, are low in certain product segments of our business, and the entrance of new competitors into the industry may reduce our ability to capture improving profit margins in circumstances where capacity utilization in the industry is increasing. Further, petroleum-rich countries have become more significant participants in the petrochemical industry and may expand this role significantly in the future. Increased competition in any of our businesses could compel us to reduce the prices of our products, which could result in reduced profit margins and loss of market share and have a material adverse effect on our business, results of operations and financial condition.
Our operations involve risks that may increase our operating costs, which could have a material adverse effect on our business, results of operations and financial condition.
Although we take precautions to enhance the safety of our operations and minimize the risk of disruptions, our operations are subject to hazards inherent in the manufacturing and marketing of differentiated and commodity chemical products. These hazards include: pipeline leaks and ruptures; explosions; fires; severe weather and natural disasters; mechanical failures; unscheduled downtimes;
17
labor difficulties; transportation interruptions; remediation complications; chemical spills; discharges or releases of toxic or hazardous substances or gases; storage tank leaks; and other risks. Some of these hazards can cause bodily injury and loss of life, severe damage to or destruction of property and equipment and environmental damage, and may result in suspension of operations and the imposition of civil or criminal penalties and liabilities. Furthermore, we are subject to present and future claims with respect to workplace exposure, exposure of contractors on our premises as well as other persons located nearby, workers' compensation and other matters.
We maintain property, business interruption and casualty insurance policies which we believe are in accordance with customary industry practices, but we are not fully insured against all potential hazards and risks incident to our business. As a result of market conditions, premiums and deductibles for certain insurance policies can increase substantially and, in some instances, certain insurance may become unavailable or available only for reduced amounts of coverage. If we were to incur a significant liability for which we were not fully insured, it could have a material adverse effect on our business, results of operations and financial condition.
In addition, we are subject to various claims and litigation in the ordinary course of business. We maintain insurance to cover many of our potential losses, but we are subject to various self-retentions and deductibles under our insurance. In conjunction with many of our past acquisitions, we have obtained indemnity agreements from the prior owners addressing liabilities that may arise from operations and events prior to our ownership. We are a party to several pending lawsuits and proceedings. It is possible that a judgment could be rendered against us in these cases or others in which we could be uninsured or not covered by indemnity and beyond the amounts that we currently have reserved or anticipate incurring for such matters. See "Business—Legal Proceedings."
Our independent auditors have reported several material weaknesses in our internal controls that, if not remedied, could result in material misstatements in our financial statements, cause investors to lose confidence in our reported financial information and have a negative effect on the trading price of our stock.
In connection with the audit of our financial statements for the year ended December 31, 2003, our independent auditors identified several matters that they deemed to be "material weaknesses" in our internal controls as defined in standards established by the American Institute of Certified Public Accountants. The auditors noted that these material weaknesses had led to restatements of the financial statements of certain of our subsidiaries in recent periods.
The principal material weakness identified by our auditors was that our controllership function did not have an adequate formal process in place to gather the data required to prepare the financial statements and disclosures required for the numerous financial reporting requirements of our subsidiaries. Specifically, the auditors noted that there was not a detailed review of the data supporting the disclosures in our financial statements by a senior member of our controllership function, that supporting documentation for certain disclosures was very limited, that the processes used to aggregate the information varied by subsidiary, without a standard, comprehensive package of supporting disclosure, and that information delivered to senior management and our audit committee was not timely and was often incomplete.
In addition, the auditors noted that we had made a data entry error during the transition of our PO business to the SAP enterprise resource planning system in April 2003. This error, which was not detected until February 2004, led to the restatement of the third quarter 2003 financial statements of certain of our subsidiaries, resulting in a $12.3 million increase in our net loss for the three months ended September 30, 2003. The auditors also noted that during 2003, loss on sale of accounts receivable related to our receivables securitization program was reported incorrectly due to a failure to properly understand certain aspects of the securitization program and a lack of oversight in the accounting for the program. This error led to the restatement of the financial statements of certain of
18
our subsidiaries for the first three quarters of 2003, resulting in a $17.9 million decrease in our net loss for the three months ended March 31, 2003, a $12.3 million decrease in our net loss for the three months ended June 30, 2003 and a $6.4 million decrease in our net loss for the three months ended September 30, 2003.
On October 12, 2004, we announced that we had determined to reclassify certain amounts in our consolidated statements of cash flows caused by errors in the automated process by which we determined the effect and classification of foreign exchange rates, the classification of repayment of debt by a subsidiary and the classification of certain fees paid in connection with the AdMat Transaction on our statements of cash flows. These errors led to a restatement of the financial statements of certain of our subsidiaries for the six months ended June 30, 2004 and the years ended December 31, 2003, 2002 and 2001. These reclassifications had no impact on our consolidated statements of operations or balance sheets.
We entered into a number of significant transactions in 2003, including the acquisition of the HIH minority interests and the AdMat Transaction, which significantly increased our financial reporting obligations. To improve our financial accounting organization and processes, we appointed a new independent director as the chairman of the audit committee of each of our principal subsidiaries in December 2003. In addition, since the beginning of 2004, we have replaced our Controller and have added 13 new positions in the areas of finance, treasury, internal controls and internal audit, including a Director of Financial Reporting and a Director of Internal Controls. We intend to add two more positions in internal audit before the end of the year. We have also adopted and implemented additional policies and procedures to strengthen our financial reporting system. However, the process of designing and implementing an effective financial reporting system is a continuous effort that requires us to anticipate and react to changes in our business and the economic and regulatory environments and to expend significant resources to maintain a financial reporting system that is adequate to satisfy our reporting obligations. Upon completion of this offering, we will have had only limited operating experience with the improvements we have made to date. The effectiveness of the measures we have taken to address the material weaknesses described above have not been independently tested or evaluated. We cannot assure you that the measures we have taken to date or any future measures will remediate the material weaknesses reported by our independent auditors, that we will implement and maintain adequate controls over our financial processes and reporting in the future or that we will not be required to restate our financial statements in the future. In addition, we cannot assure you that additional past or future weaknesses or significant deficiencies in our financial reporting system will not be discovered in the future.
Any failure to remediate the material weaknesses reported by our independent auditors or to implement required new or improved controls, or difficulties encountered in their implementation, could cause us to fail to meet our reporting obligations or result in material misstatements in our financial statements. Any such failure also could adversely affect the results of the periodic management evaluations and annual auditor attestation reports regarding the effectiveness of our "internal control over financial reporting" that will be required when the SEC's rules under Section 404 of the Sarbanes-Oxley Act of 2002 become applicable to us beginning with our Annual Report on Form 10-K for the year ending December 31, 2005 to be filed in early 2006. Inferior internal controls could also cause investors to lose confidence in our reported financial information, which could have a negative effect on the trading price of our stock.
We are subject to many environmental and safety regulations that may result in unanticipated costs or liabilities, which could have a material adverse effect on our business, results of operations and financial condition.
We are subject to extensive federal, state, local and foreign laws, regulations, rules and ordinances relating to pollution, protection of the environment and the generation, storage, handling,
19
transportation, treatment, disposal and remediation of hazardous substances and waste materials. Actual or alleged violations of environmental laws or permit requirements could result in restrictions or prohibitions on plant operations, substantial civil or criminal sanctions, as well as, under some environmental laws, the assessment of strict liability and/or joint and several liability. Moreover, changes in environmental regulations could inhibit or interrupt our operations, or require us to modify our facilities or operations. Accordingly, environmental or regulatory matters may cause us to incur significant unanticipated losses, costs or liabilities, which could have a material adverse effect on our business, results of operations and financial condition. See "Business—Environmental, Health and Safety Matters."
In addition, we could incur significant expenditures in order to comply with existing or future environmental or safety laws. Capital expenditures and costs relating to environmental or safety matters will be subject to evolving regulatory requirements and will depend on the timing of the promulgation and enforcement of specific standards which impose requirements on our operations. Therefore, we cannot assure you that capital expenditures and costs beyond those currently anticipated will not be required under existing or future environmental or safety laws.
Furthermore, we may be liable for the costs of investigating and cleaning up environmental contamination on or from our properties or at off-site locations where we disposed of or arranged for the disposal or treatment of hazardous materials or from disposal activities that pre-dated the purchase of our businesses. We cannot assure you that additional costs and expenditures beyond those currently anticipated will not be incurred to address all such known and unknown situations under existing and future environmental law. See "Business—Environmental, Health and Safety Matters."
Existing or future litigation or legislative initiatives restricting the use of MTBE in gasoline may subject us or our products to environmental liability or materially adversely affect our sales and costs.
We produce MTBE, an oxygenate that is blended with gasoline to reduce vehicle air emissions and to enhance the octane rating of gasoline. The use of MTBE is controversial in the U.S. and elsewhere and may be substantially curtailed or eliminated in the future by legislation or regulatory action. For example, California, New York and Connecticut have adopted rules that prohibit the use of MTBE in gasoline sold in those states as of January 1, 2004. Overall, states that have taken some action to prohibit or restrict the use of MTBE in gasoline account for a substantial portion of the "pre-ban" U.S. MTBE market. Additional phase-outs or other future regulation of MTBE may result in a significant reduction in demand for our MTBE, a material loss in revenues or material increase in compliance costs or expenditures. In addition, a number of lawsuits have been filed, primarily against gasoline manufacturers, marketers and distributors, by persons seeking to recover damages allegedly arising from the presence of MTBE in groundwater. While we have not been named as a defendant in any litigation concerning the environmental effects of MTBE, we cannot provide assurances that we will not be involved in any such litigation or that such litigation will not have a material adverse effect on our business, results of operations and financial condition. See "Business—Environmental, Health and Safety Matters."
Our results of operations may be adversely affected by fluctuations in currency exchange rates and international business risks.
Some of our subsidiaries conduct a significant portion of their business outside the U.S. These operations outside the U.S. are subject to risks normally associated with international operations. These risks include the need to convert currencies which may be received for our products into currencies in which our subsidiaries purchase raw materials or pay for services, which could result in a gain or loss depending on fluctuations in exchange rates. In addition, we translate our local currency financial results into U.S. dollars based on average exchange rates prevailing during the reporting period or the exchange rate at the end of that period. During times of a strengthening U.S. dollar, our reported
20
international sales and earnings may be reduced because the local currency may translate into fewer U.S. dollars.
Other risks of international operations include trade barriers, tariffs, exchange controls, national and regional labor strikes, social and political risks, general economic risks and required compliance with a variety of foreign laws, including tax laws and the difficulty of enforcing agreements and collecting receivables through foreign legal systems. The occurrence of these risks could adversely affect the businesses of our international subsidiaries, which could significantly affect their ability to make distributions to us.
Our business is dependent on our intellectual property. If our patents are declared invalid or our trade secrets become known to our competitors, our ability to compete may be adversely affected.
Proprietary protection of our processes, apparatuses and other technology is important to our business. Consequently, we may have to rely on judicial enforcement of our patents and other proprietary rights. While a presumption of validity exists with respect to patents issued to us in the U.S., there can be no assurance that any of our patents will not be challenged, invalidated, circumvented or rendered unenforceable. Furthermore, if any pending patent application filed by us does not result in an issued patent, or if patents are issued to us, but such patents do not provide meaningful protection of our intellectual property, then our ability to compete may be adversely affected. Additionally, our competitors or other third parties may obtain patents that restrict or preclude our ability to lawfully produce or sell our products in a competitive manner, which could have a material adverse effect on our business, results of operations and financial condition.
We also rely upon unpatented proprietary know-how and continuing technological innovation and other trade secrets to develop and maintain our competitive position. While it is our policy to enter into confidentiality agreements with our employees and third parties to protect our intellectual property, these confidentiality agreements may be breached, may not provide meaningful protection for our trade secrets or proprietary know-how, or adequate remedies may not be available in the event of an unauthorized use or disclosure of such trade secrets and know-how. In addition, others could obtain knowledge of such trade secrets through independent development or other access by legal means. The failure of our patents or confidentiality agreements to protect our processes, apparatuses, technology, trade secrets or proprietary know-how could have a material adverse effect on our business, results of operations and financial condition.
Loss of key members of our management could adversely affect our business.
We depend on the continued employment and performance of our senior executives and other key members of management. If any of these individuals resigns or becomes unable to continue in his present role and is not adequately replaced, our business operations could be materially adversely affected. We generally do not have employment agreements with, and we do not maintain any "key man" life insurance for, any of our executive officers. See "Management."
Terrorist attacks, such as the attacks that occurred on September 11, 2001, the continuing military action in Iraq, general instability in various OPEC member nations, the threat of other attacks or acts of war in the U.S. and abroad and increased security regulations related to our industry could adversely affect our business.
The attacks of September 11, 2001, and subsequent events, including the continuing military action in Iraq, have caused instability in the U.S. and other financial markets and have led, and may continue to lead, to further armed hostilities, prolonged military action in Iraq, or further acts of terrorism in the U.S. or abroad, which could cause further instability in financial markets. Current regional tensions and conflicts in various OPEC member nations, including the continuing military action in Iraq, have caused, and may cause further, increases in raw material costs, particularly crude oil and natural gas
21
feedstocks, which are used in our operations. The uncertainty surrounding the continuing military action in Iraq and the threat of further armed hostilities or acts of terrorism may impact any or all of our physical facilities and operations, which are located in North America, Europe, Australia, Asia, Africa, South America and the Middle East, or those of our customers. Furthermore, the terrorist attacks, subsequent events and future developments in any of these areas may result in reduced demand from our customers for our products. In addition, local, state and federal governments have begun a regulatory process that could lead to new regulations impacting the security of chemical plant locations and the transportation of hazardous chemicals, which could result in higher operating costs. These developments will subject our worldwide operations to increased risks and, depending on their magnitude, could have a material adverse effect on our business, results of operations and financial condition.
Future acquisitions, partnerships and joint ventures may require significant resources and/or result in unanticipated adverse consequences that could adversely affect our business, results of operations and financial condition.
In the future we may seek to grow our company and businesses by making acquisitions or entering into partnerships and joint ventures. Any future acquisition, partnership or joint venture may require that we make a significant cash investment, issue stock or incur substantial debt. In addition, acquisitions, partnerships or investments may require significant managerial attention, which may be diverted from our other operations. These capital, equity and managerial commitments may impair the operation of our businesses. Furthermore, any future acquisitions of businesses or facilities could entail a number of additional risks, including:
We have incurred indebtedness to finance past acquisitions. We may finance future acquisitions with additional indebtedness and/or by issuing additional equity securities. We could face the financial risks associated with incurring additional indebtedness such as reducing our liquidity and access to financing markets and increasing the amount of cash flow required to service such indebtedness.
Risks Related to the Offering
Our common stock has no prior market, and our stock price may decline or fluctuate substantially after the offering.
Before this offering, there has not been a public market for our common stock. Although we have applied for listing of our common stock on the New York Stock Exchange, we cannot assure you that an active trading market for our shares will develop or be sustained after this offering. An illiquid market for our common stock may result in volatility and poor execution of buy and sell orders for investors. The initial public offering price for our shares has been determined by negotiations among the underwriters and us. We cannot assure you that the initial public offering price will correspond to the price at which our shares will trade in the public market subsequent to this offering or that the price of our shares available in the public market will reflect our actual financial performance. As a result, you may not be able to resell your shares at or above the initial public offering price. Among the factors that could affect our stock price are:
22
The stock markets in general have experienced extreme volatility that has at times been unrelated to the operating performance of particular companies. These broad market fluctuations may also adversely affect the trading price of our common stock.
Future sales of our common stock may depress our stock price.
Sales of a substantial number of shares of our common stock after the offering could adversely affect the market price of our common stock by introducing a significant increase in the supply of our common stock to the market. This increased supply could cause the market price of our common stock to decline significantly.
After the offering, we will have outstanding shares of common stock, and we will have reserved shares of common stock for issuance under the Huntsman Stock Incentive Plan. Subject to the lock-up agreements described in "Underwriting," all the shares of common stock sold in the offering will be freely tradable without restriction or further registration under the federal securities laws unless purchased by one of our "affiliates," as that term is defined in Rule 144 under the Securities Act. The remaining shares of outstanding common stock, including shares held by Investments LLC and its affiliates, will be "restricted securities" under the Securities Act and will be subject to restrictions on the timing, manner and volume of sales.
Our executive officers and directors, Investments LLC, our other stockholders and the underwriters have entered into the lock-up agreements described in "Underwriting." Upon the expiration of these lock-up agreements, the shares outstanding and owned by such persons may be sold in the future without registration under the Securities Act to the extent permitted by Rule 144 or any applicable exemption under the Securities Act. Under registration rights agreements between Investments LLC, certain other stockholders and our company, Investments LLC and such stockholders, who will collectively hold approximately shares of our common stock after this offering, will have the right to require us to register their shares of our common stock following the lock-up period. The possibility that Investments LLC, such stockholders or any of their or our affiliates may dispose of shares of our common stock, or the announcement or completion of any such transaction, could have an adverse effect on the market price of our common stock. See "Certain Relationships and Related Transactions" and "Shares Eligible for Future Sale."
As a new investor, you will experience immediate and substantial dilution in the value of your shares.
Purchasers of our common stock in this offering will experience immediate dilution of $ in pro forma net tangible book value per share as of September 30, 2004. Dilution per share represents the difference between the initial public offering price and the net consolidated book value per share immediately after the offering of our common stock. See "Dilution."
23
We are indirectly controlled by the Huntsman family and MatlinPatterson, whose interests may conflict with those of our company or our other stockholders, and other stockholders' voting power may be limited.
Following the consummation of this offering, Jon M. Huntsman and other members of the Huntsman family and MatlinPatterson will indirectly control, in the aggregate, approximately % of our outstanding common stock through their ownership of Investments LLC and will have the ability to:
The interests and objectives of our controlling stockholders may be different from those of our company or our other stockholders, and our controlling stockholders may vote their common stock in a manner that may adversely affect our other stockholders. In addition, four of our directors, Mr. Jon M. Huntsman, Mr. Peter R. Huntsman, Mr. David J. Matlin and Mr. Christopher Pechock, are also current managers or officers of Investments LLC. This may create conflicts of interest because these directors have responsibilities to Investments LLC and its owners. Their duties as directors or officers of Investments LLC may conflict with their duties as directors of our company regarding business dealings between Investments LLC and us and other matters. The resolution of these conflicts may not always be in our or our stockholders' best interest.
Investments LLC's controlling position and provisions contained in our certificate of incorporation and bylaws could discourage a takeover attempt, which may reduce or eliminate the likelihood of a change of control transaction and, therefore, your ability to sell your shares at a premium.
Investments LLC's controlling position, as well as provisions contained in our certificate of incorporation and bylaws, such as a classified board of directors, limitations on stockholder proposals at meetings of stockholders and the inability of stockholders to call special meetings, and certain provisions of Delaware law, could make it more difficult for a third party to acquire control of our company, even if some of our stockholders considered such a change of control to be beneficial. Our certificate of incorporation also authorizes our board of directors to issue preferred stock without stockholder approval. If our board of directors elects to issue preferred stock that has special voting or other rights, it could make it even more difficult for a third party to acquire us, which may reduce or eliminate your ability to sell your shares of common stock at a premium. See "Description of Capital Stock."
DISCLOSURE REGARDING FORWARD-LOOKING STATEMENTS
All statements other than statements of historical facts included in this prospectus, including, without limitation, statements regarding our future financial position, business strategy, budgets, projected costs and plans and objectives of management for future operations, are forward-looking statements. In addition, forward-looking statements generally can be identified by the use of forward-looking terminology such as "may," "could," "expect," "potential," "plan," "intend," "estimate," "anticipate," "believe" or "continue" or the negative thereof or variations thereon or similar terminology. Although we believe that the expectations reflected in such forward-looking statements are reasonable, there can be no assurances that such expectations will prove to have been correct. Important factors that could cause actual results to differ materially from our expectations are disclosed under "Risk Factors" and elsewhere in this prospectus, including, without limitation, in conjunction with the forward-looking statements included in this prospectus.
24
Jon M. Huntsman founded the predecessor to our company in the early 1970s as a small packaging company. Since then, we have grown through a series of significant acquisitions and now own a global portfolio of commodity and differentiated businesses. In 1993, we purchased the LAB and maleic anhydride businesses of Monsanto. In 1994, we purchased the global chemical business from what was formerly Texaco. In 1997, we purchased our PO business from Texaco. Also in 1997, we acquired Rexene Corporation, significantly increasing the size of our polymers business. In 1999, we acquired certain polyurethanes, pigments and European petrochemicals businesses from ICI. In 2000, we completed the acquisition of the Morton global TPU business from Rohm and Haas. In 2001, we completed our acquisition of the global ethyleneamines business of Dow, and we completed our acquisition of the Albright & Wilson European surfactants business from Rhodia. In 2003, we completed our acquisition of 88% of our Advanced Materials business, and we now own approximately 90% of Advanced Materials. We have also divested certain non-core businesses, including our packaging subsidiary in 1997 and our global styrenics business in 1998. On September 30, 2002, we completed a series of restructuring transactions that included a debt for equity exchange (the "HLLC Restructuring"), which resulted in the Huntsman family, MatlinPatterson and Consolidated Press Holdings Limited acquiring substantially all of our equity interests. See "Certain Relationships and Related Transactions—The HLLC Restructuring."
We will complete the Reorganization Transaction in connection with the completion of this offering. In the Reorganization Transaction, Huntsman Holdings, LLC will merge into us, and the existing holders of the common and preferred membership interests of Huntsman Holdings, LLC, including the mandatorily redeemable preferred interests, will receive, directly or indirectly, shares of our common stock in exchange for their interests. In addition, each of the holders of warrants to purchase approximately 12% of the common stock of HMP (the "HMP Warrants") will exchange all of their HMP Warrants for shares of our common stock. Immediately prior to the merger, Huntsman Family Holdings and MatlinPatterson will contribute all of their membership interests in Huntsman Holdings, LLC to Investments LLC, which will receive shares of our common stock in exchange for these interests.
Immediately following the Reorganization Transaction and this offering, Investments LLC will hold approximately % of our outstanding common stock. The economic interest in the shares of our common stock held by Investments LLC will be allocated as follows: $400 million of such shares plus 50% of the remainder of such shares will be allocated to the membership interests owned by MatlinPatterson, 45% of the remainder of such shares will be allocated to the membership interests owned by Huntsman Family Holdings and 5% of the remainder of such shares will be unallocated. The unallocated shares will be allocated between the membership interests of Huntsman Family Holdings and MatlinPatterson approximately 18 months after the completion of this offering based on the trading price of our common stock. The Investments LLC limited liability company agreement will grant control of Investments LLC (including the voting of the shares of our common stock held by Investments LLC) to Huntsman Family Holdings. However, Investments LLC will not be able to vote its shares of our common stock in favor of certain corporate actions without the consent of MatlinPatterson. MatlinPatterson will have control over the disposition of the shares of our common stock held by Investments LLC that are allocated to MatlinPatterson's membership interests in Investments LLC. In addition, Huntsman Family Holdings has agreed to cause all of the shares of our common stock held by Investments LLC to be voted in favor of the election to our board of directors of two nominees designated by MatlinPatterson.
25
We estimate that the proceeds to us from this offering, after deduction of fees and expenses, based upon an assumed initial offering price equal to $ , will be approximately $1,250 million. We intend to use these net proceeds, together with cash on hand, as follows:
Pending these uses, we intend to invest the net proceeds in short-term interest-bearing, investment-grade securities or money market funds.
We will use the net proceeds that we receive from any exercise of the underwriters' over-allotment option to further reduce our outstanding indebtedness.
Jon M. Huntsman, our Chairman of the Board, owns all of the equity interests in Horizon Ventures LLC. See "Certain Relationships and Related Transactions."
We will not receive any of the proceeds from the sale of shares by the selling stockholder.
We do not currently anticipate paying any cash dividends on our common stock. Instead, we currently intend to retain our earnings, if any, to invest in our businesses, to repay indebtedness and to use for general corporate purposes. Our board of directors has the authority to declare and pay dividends on the common stock, in its discretion, as long as there are funds legally available to do so. However, amounts available to pay dividends will be restricted by the terms of the credit agreements and indentures of our subsidiaries. See "Management's Discussion and Analysis of Financial Condition and Results of Operations—Liquidity and Capital Resources."
26
The following table sets forth our cash and capitalization as of September 30, 2004:
The information set forth below is derived from unaudited financial information and should be read in conjunction with the audited consolidated financial statements included herein, "Use of Proceeds," "Selected Historical Financial Data," "Unaudited Pro Forma Financial Data" and the Consolidated Financial Statements included elsewhere in this prospectus and, in each case, the notes related thereto.
| |
As of September 30, 2004 |
|||||||
|---|---|---|---|---|---|---|---|---|
| |
Actual |
Pro Forma As Adjusted |
||||||
| |
(in millions) |
|||||||
| Cash | $ | 239.1 | $ | 197.0 | (a) | |||
| Debt: | ||||||||
| Secured credit facilities | $ | 2,228.2 | $ | 2,233.2 | ||||
| Secured notes | 799.5 | 640.1 | ||||||
| Notes | 2,075.2 | 2,075.2 | ||||||
| Secured discount notes | 389.5 | — | ||||||
| Discount notes | 489.2 | — | ||||||
| Note due to affiliate | 39.5 | — | ||||||
| Other debt | 179.6 | 179.6 | ||||||
| Total debt | 6,200.7 | 5,128.1 | ||||||
| Stockholders' (deficit) equity: | ||||||||
| Common stock ( shares of common stock, par value $0.01 per share, authorized, shares outstanding pro forma as adjusted) | — | — | ||||||
| Preferred member's interest | 195.7 | — | ||||||
| Common member's interest | — | — | ||||||
| Additional paid-in capital | 734.4 | 2,863.7 | ||||||
| Accumulated deficit | (1,470.0 | ) | (1,691.6 | )(b) | ||||
| Accumulated other comprehensive income | 98.5 | 98.5 | ||||||
| Total stockholders' (deficit) equity | (441.4 | ) | 1,270.6 | |||||
| Total capitalization | $ | 5,759.3 | $ | 6,398.7 | ||||
27
If you invest in our common stock, your interest will be diluted to the extent of the difference between the initial public offering price of our common stock and the pro forma as adjusted net tangible book value per share of our common stock after this offering. Our pro forma net tangible book value as of September 30, 2004 was approximately $ million, or approximately $ per share. Pro forma net tangible book value per share represents the amount of tangible assets less total liabilities, divided by shares of common stock outstanding.
After giving effect to our sale of shares in this offering at an assumed initial public offering price of $ per share and after deduction of the estimated underwriting discounts and commissions and offering expenses, our pro forma as adjusted net tangible book value as of September 30, 2004 would have been approximately $ million, or $ per share. This represents an immediate increase in pro forma net tangible book value of $ per share to existing stockholders and an immediate dilution of $ per share to purchasers of common stock in this offering.
| Assumed initial public offering price per share | $ | ||||||
| Pro forma net tangible book value per share at September 30, 2004 | $ | ||||||
| Increase per share attributable to new investors | |||||||
| Pro forma, as adjusted net tangible book value per share after offering | |||||||
| Dilution per share to new investors | $ | ||||||
The following table sets forth, on a pro forma basis as of September 30, 2004, the total consideration paid and the average price per share paid by the existing stockholders and by new investors, before deducting estimated underwriting discounts and commissions and offering expenses payable by us at a public offering price of $ per share.
| |
Shares Purchased |
Total Consideration |
|
||||||||||
|---|---|---|---|---|---|---|---|---|---|---|---|---|---|
| |
Average Price Per Share |
||||||||||||
| |
Number |
Percent |
Amount |
Percent |
|||||||||
| Existing shareholders | % | $ | % | $ | |||||||||
| New investors | |||||||||||||
| Total | 100 | % | 100 | % | |||||||||
The foregoing computations exclude shares issuable upon the exercise of stock options to be issued in connection with this offering and shares available for future issuance under the Huntsman Stock Incentive Plan. To the extent the option holders exercise these outstanding options or warrants, or any options or warrants we grant in the future, there will be further dilution to new investors.
28
SELECTED HISTORICAL FINANCIAL DATA
The selected historical financial data set forth below presents the historical financial data of our predecessor Huntsman Holdings, LLC as of and for the dates and periods indicated. The selected financial data as of September 30, 2003 and 2004 and for the nine months ended September 30, 2003 and 2004 have been derived from the unaudited consolidated financial statements of Huntsman Holdings, LLC included elsewhere in this prospectus. The selected financial data as of December 31, 2002 and 2003 and for the years ended December 31, 2001, 2002 and 2003 have been derived from the audited consolidated financial statements of Huntsman Holdings, LLC included elsewhere in this prospectus. The selected financial data as of December 31, 1999, 2000 and 2001 and for the years ended December 31, 1999 and 2000 have been derived from the audited consolidated financial statements of Huntsman Holdings, LLC for these periods, which are not included in this prospectus.
In such financial data, HIH is accounted for using the equity method of accounting through April 30, 2003. Effective May 1, 2003, as a result of the HIH Consolidation Transaction, we have consolidated the financial results of HIH. Effective July 1, 2003, as a result of the AdMat Transaction, we have consolidated the financial results of Advanced Materials. As a result, the financial information as of and for the year ended December 31, 2003 is not comparable to the prior years' historical financial data presented herein, and the financial information as of and for the nine months ended September 30, 2004 is not comparable to the financial information as of and for the nine months ended September 30, 2003. You should read the selected financial data in conjunction with "Unaudited Pro Forma Financial Data," "Management's Discussion and Analysis of Financial Condition and Results of Operations," and the Consolidated Financial Statements and accompanying notes of Huntsman Holdings, LLC included elsewhere in this prospectus.
| |
Year Ended December 31, |
Nine Months Ended September 30, |
|||||||||||||||||||||
|---|---|---|---|---|---|---|---|---|---|---|---|---|---|---|---|---|---|---|---|---|---|---|---|
| |
1999 |
2000 |
2001 |
2002 |
2003 |
2003 |
2004 |
||||||||||||||||
| |
(in millions, except per share amounts) |
||||||||||||||||||||||
| Statement of Operations Data: | |||||||||||||||||||||||
| Revenues | $ | 2,838.8 | $ | 3,325.7 | $ | 2,757.4 | $ | 2,661.0 | $ | 7,080.9 | $ | 4,711.1 | $ | 8,357.7 | |||||||||
| Gross profit | 320.3 | 128.7 | 90.8 | 240.0 | 707.8 | 452.4 | 999.7 | ||||||||||||||||
| Restructuring, impairment and plant closing costs (credit) | — | — | 588.5 | (1.0 | ) | 37.9 | 27.2 | 202.4 | |||||||||||||||
| Operating income (loss) | 74.8 | (78.7 | ) | (709.4 | ) | 66.3 | 176.5 | 91.9 | 216.4 | ||||||||||||||
| Loss before cumulative effect of accounting changes | (75.6 | ) | (138.6 | ) | (842.8 | ) | (191.9 | ) | (319.8 | ) | (214.2 | ) | (226.5 | ) | |||||||||
| Cumulative effect of accounting changes(a) | — | — | 0.1 | 169.7 | — | — | — | ||||||||||||||||
| Net loss | (75.6 | ) | (138.6 | ) | (842.7 | ) | (22.2 | ) | (319.8 | ) | (214.2 | ) | (226.5 | ) | |||||||||
| Net loss per common share(b) | |||||||||||||||||||||||
| Basic | |||||||||||||||||||||||
| Diluted | |||||||||||||||||||||||
| Average shares outstanding(b) | |||||||||||||||||||||||
| Basic | |||||||||||||||||||||||
| Diluted | |||||||||||||||||||||||
| Other Data: | |||||||||||||||||||||||
| Depreciation and amortization | $ | 203.6 | $ | 200.3 | $ | 197.5 | $ | 152.7 | $ | 353.4 | $ | 230.5 | $ | 410.3 | |||||||||
| Capital expenditures | 150.2 | 90.3 | 76.4 | 70.2 | 191.0 | 129.9 | 145.0 | ||||||||||||||||
| Balance Sheet Data (at period end): | |||||||||||||||||||||||
| Total assets | $ | 3,565.1 | $ | 3,543.8 | $ | 2,357.8 | $ | 2,747.2 | $ | 8,737.4 | $ | 8,444.1 | $ | 8,993.8 | |||||||||
| Total debt | 2,136.2 | 2,268.6 | 2,450.5 | 1,736.1 | 5,910.1 | 5,968.4 | 6,200.7 | ||||||||||||||||
| Total liabilities | 3,109.9 | 3,322.3 | 3,046.3 | 2,532.0 | 8,278.8 | 8,044.0 | 8,724.4 | ||||||||||||||||
29
UNAUDITED PRO FORMA FINANCIAL DATA
The pro forma statements of operations data for the year ended December 31, 2003 and the nine months ended September 30, 2003 and 2004 set forth below gives effect to the following transactions as if each transaction had occurred on January 1, 2003:
The pro forma as adjusted statements of operations data for the year ended December 31, 2003 and the nine months ended September 30, 2003 and 2004 set forth below adjusts the pro forma statements of operations data to give effect to the following transactions as if each transaction had occurred on January 1, 2003:
The pro forma balance sheet data set forth below gives effect to the HLLC Bank Refinancing as if it had occurred on September 30, 2004. The pro forma as adjusted balance sheet data set forth below adjusts the pro forma balance sheet data to give effect to the Reorganization Transaction and this offering and the use of net proceeds to us as described in "Use of Proceeds" as if each transaction had occurred on September 30, 2004.
The pro forma financial data does not purport to be indicative of the combined financial position or results of operations of future periods or indicative of results that would have occurred had the above transactions been completed on the date indicated. The pro forma and other adjustments, as described in the accompanying notes to the pro forma consolidated condensed balance sheet and statements of operations, are based upon available information and certain assumptions that we believe are reasonable. The pro forma financial data set forth below should be read in conjunction with the Consolidated Financial Statements, "Management's Discussion and Analysis of Financial Condition and Results of Operations," and "Selected Historical Financial Data" included elsewhere in this prospectus and, in each case, the notes related thereto.
30
UNAUDITED PRO FORMA CONDENSED CONSOLIDATED STATEMENT OF OPERATIONS
FOR THE NINE MONTHS ENDED SEPTEMBER 30, 2003
| |
|
Pro Forma Adjustments |
|
|
|
||||||||||||||||||
|---|---|---|---|---|---|---|---|---|---|---|---|---|---|---|---|---|---|---|---|---|---|---|---|
| |
|
|
Offering and Reorganization Transaction Adjustments |
|
|||||||||||||||||||
| |
Actual |
HIH Consolidation Transaction(a) |
AdMat Transaction(b) |
Other Pro Forma Adjustments |
Pro Forma |
Pro Forma As Adjusted |
|||||||||||||||||
| |
(in millions) |
||||||||||||||||||||||
| Revenues | $ | 4,711.1 | $ | 1,733.4 | $ | 531.8 | $ | (91.1 | )(c) | $ | 6,885.2 | $ | 6,885.2 | ||||||||||
| Cost of goods sold | 4,258.7 | 1,551.9 | 412.7 | (73.2 | )(d) | 6,150.1 | 6,150.1 | ||||||||||||||||
| Gross profit | 452.4 | 181.5 | 119.1 | (17.9 | ) | 735.1 | 735.1 | ||||||||||||||||
| Expenses: | |||||||||||||||||||||||
| Operating expenses | 333.3 | 104.6 | 172.1 | (42.8 | )(e) | 567.2 | 567.2 | ||||||||||||||||
| Restructuring and plant closing costs | 27.2 | 17.1 | — | — | 44.3 | 44.3 | |||||||||||||||||
| Total expenses | 360.5 | 121.7 | 172.1 | (42.8 | )(e) | 611.5 | 611.5 | ||||||||||||||||
| Operating income | 91.9 | 59.8 | (53.0 | ) | 24.9 | 123.6 | 123.6 | ||||||||||||||||
| Interest expense, net | (260.7 | ) | (113.2 | ) | (36.3 | ) | (40.3 | )(f) | (450.5 | ) | $ | 140.5 | (f) | (310.0 | ) | ||||||||
| Loss on accounts receivable securitization program | (11.9 | ) | (12.0 | ) | — | (0.1 | ) | (24.0 | ) | (24.0 | ) | ||||||||||||
| Equity in (loss) income of unconsolidated affiliates | (38.2 | ) | — | — | 39.0 | (g) | 0.8 | 0.8 | |||||||||||||||
| Other non-operating expenses | 0.4 | (2.2 | ) | — | — | (1.8 | ) | (1.8 | ) | ||||||||||||||
| Loss before income taxes and minority interest | (218.5 | ) | (67.6 | ) | (89.3 | ) | 23.5 | (351.9 | ) | 140.5 | (211.4 | ) | |||||||||||
| Income tax benefit (expense) | 3.8 | 2.4 | 11.4 | (15.2 | )(h) | 2.4 | 2.4 | ||||||||||||||||
| Minority interest in subsidiaries' loss | 0.5 | — | — | 5.3 | (i) | 5.8 | 5.8 | ||||||||||||||||
| Net (loss) income | $ | (214.2 | ) | $ | (65.2 | ) | $ | (77.9 | ) | $ | 13.6 | $ | (343.7 | ) | $ | 140.5 | $ | (203.2 | ) | ||||
31
UNAUDITED PRO FORMA CONDENSED CONSOLIDATED STATEMENT OF OPERATIONS
FOR THE NINE MONTHS ENDED SEPTEMBER 30, 2004
| |
Actual |
Pro Forma Adjustments |
Pro Forma |
Offering and Reorganization Transaction Adjustments |
Pro Forma As Adjusted |
|||||||||||||
|---|---|---|---|---|---|---|---|---|---|---|---|---|---|---|---|---|---|---|
| |
(in millions) |
|||||||||||||||||
| Revenues | $ | 8,357.7 | $ | 8,357.7 | $ | 8,357.7 | ||||||||||||
| Cost of goods sold | 7,358.0 | 7,358.0 | 7,358.0 | |||||||||||||||
| Gross profit | 999.7 | 999.7 | 999.7 | |||||||||||||||
| Expenses: | ||||||||||||||||||
| Operating expenses | 580.9 | 580.9 | 580.9 | |||||||||||||||
| Restructuring and plant closing costs | 202.4 | 202.4 | 202.4 | |||||||||||||||
| Total expenses | 783.3 | 783.3 | 783.3 | |||||||||||||||
| Operating income | 216.4 | 216.4 | 216.4 | |||||||||||||||
| Interest expense, net | (459.5 | ) | $ | 3.7 | (a) | (455.8 | ) | $ | 140.5 | (a) | (315.3 | ) | ||||||
| Loss on accounts receivable securitization program | (10.2 | ) | (10.2 | ) | (10.2 | ) | ||||||||||||
| Equity in income of unconsolidated affiliates | 3.0 | 3.0 | 3.0 | |||||||||||||||
| Other non-operating expenses | (0.8 | ) | (0.8 | ) | (0.8 | ) | ||||||||||||
| Loss before income taxes and minority interest | (251.1 | ) | 3.7 | (247.4 | ) | 140.5 | (106.9 | ) | ||||||||||
| Income tax expense | 25.7 | — | (b) | 25.7 | 25.7 | |||||||||||||
| Minority interest in subsidiaries' income | (1.1 | ) | (1.1 | ) | (1.1 | ) | ||||||||||||
| Net (loss) income | $ | (226.5 | ) | $ | 3.7 | $ | (222.8 | ) | $ | 140.5 | $ | (82.3 | ) | |||||
32
UNAUDITED PRO FORMA CONDENSED CONSOLIDATED STATEMENT OF OPERATIONS
FOR THE YEAR ENDED DECEMBER 31, 2003
| |
|
Pro Forma Adjustments |
|
|
|
||||||||||||||||||
|---|---|---|---|---|---|---|---|---|---|---|---|---|---|---|---|---|---|---|---|---|---|---|---|
| |
|
|
Offering and Reorganization Transaction Adjustments |
|
|||||||||||||||||||
| |
Actual |
HIH Consolidation Transaction(a) |
AdMat Transaction(b) |
Other Pro Forma Adjustments |
Pro Forma |
Pro Forma As Adjusted |
|||||||||||||||||
| |
(in millions) |
||||||||||||||||||||||
| Revenues | $ | 7,080.9 | $ | 1,733.4 | $ | 531.8 | $ | (93.7 | )(c) | $ | 9,252.4 | $ | 9,252.4 | ||||||||||
| Cost of goods sold | 6,373.1 | 1,551.9 | 412.7 | (82.6 | )(d) | 8,255.1 | 8,255.1 | ||||||||||||||||
| Gross profit | 707.8 | 181.5 | 119.1 | (11.1 | ) | 997.3 | 997.3 | ||||||||||||||||
| Expenses: | |||||||||||||||||||||||
| Operating expenses | 493.4 | 104.6 | 172.1 | (37.9 | )(e) | 732.2 | 732.2 | ||||||||||||||||
| Restructuring and plant closing costs | 37.9 | 17.1 | — | — | 55.0 | 55.0 | |||||||||||||||||
| Total expenses | 531.3 | 121.7 | 172.1 | (37.9 | )(e) | 787.2 | 787.2 | ||||||||||||||||
| Operating income | 176.5 | 59.8 | (53.0 | ) | 26.8 | 210.1 | 210.1 | ||||||||||||||||
| Interest expense, net | (428.3 | ) | (113.2 | ) | (36.3 | ) | (23.2 | )(f) | (601.0 | ) | $ | 187.4 | (f) | (413.6 | ) | ||||||||
| Interest income—affiliate | 19.2 | — | — | (19.2 | )(g) | — | — | — | |||||||||||||||
| Loss on accounts receivable securitization program | (20.4 | ) | (12.0 | ) | — | — | (32.4 | ) | (32.4 | ) | |||||||||||||
| Equity in (loss) income of unconsolidated affiliates | (37.5 | ) | — | — | 39.0 | (h) | 1.5 | 1.5 | |||||||||||||||
| Other non-operating expenses | — | (2.2 | ) | — | — | (2.2 | ) | (2.2 | ) | ||||||||||||||
| Loss before income taxes and minority interest | (290.5 | ) | (67.6 | ) | (89.3 | ) | 23.4 | (424.0 | ) | 187.4 | (236.6 | ) | |||||||||||
| Income tax expense | (30.8 | ) | 2.4 | 11.4 | (15.1 | )(i) | (32.1 | ) | (32.1 | ) | |||||||||||||
| Minority interest in subsidiaries' loss | 1.5 | — | — | 5.3 | (j) | 6.8 | 6.8 | ||||||||||||||||
| Net (loss) income | $ | (319.8 | ) | $ | (65.2 | ) | $ | (77.9 | ) | $ | 13.6 | $ | (449.3 | ) | $ | 187.4 | $ | (261.9 | ) | ||||
33
UNAUDITED PRO FORMA CONSOLIDATED BALANCE SHEET
AS OF SEPTEMBER 30, 2004
| |
Actual |
Pro Forma Adjustments |
Pro Forma |
Offering and Reorganization Transaction Adjustments |
Pro Forma As Adjusted |
|||||||||||
|---|---|---|---|---|---|---|---|---|---|---|---|---|---|---|---|---|
| |
(in millions) |
|||||||||||||||
| Assets | ||||||||||||||||
| Cash and equivalents | $ | 239.1 | $ | $ | 239.1 | $ | (42.1 | )(d) | $ | 197.0 | ||||||
| Accounts and notes receivable | 1,403.3 | 1,403.3 | 1,403.3 | |||||||||||||
| Inventories | 1,132.6 | 1,132.6 | 1,132.6 | |||||||||||||
| Prepaid expense | 70.6 | 70.6 | 70.6 | |||||||||||||
| Deferred income taxes | 20.6 | 20.6 | 20.6 | |||||||||||||
| Other current assets | 69.5 | 69.5 | 69.5 | |||||||||||||
| Current assets | 2,935.7 | 2,935.7 | (42.1 | ) | 2,893.6 | |||||||||||
| Property, plant and equipment, net | 5,014.8 | 5,014.8 | 5,014.8 | |||||||||||||
| Investment in unconsolidated affiliates | 167.5 | 167.5 | 167.5 | |||||||||||||
| Intangible assets, net | 264.8 | 264.8 | 264.8 | |||||||||||||
| Goodwill | 3.3 | 3.3 | 3.3 | |||||||||||||
| Deferred income taxes | 21.3 | 21.3 | 21.3 | |||||||||||||
| Other noncurrent assets | 586.4 | 3.5 | (a) | 589.9 | (12.1 | )(e) | 577.8 | |||||||||
| Total assets | $ | 8,993.8 | $ | 3.5 | $ | 8,997.3 | $ | (54.2 | ) | $ | 8,943.1 | |||||
| Liabilities and stockholders' equity | ||||||||||||||||
| Accounts payable | $ | 919.7 | $ | $ | 919.7 | $ | $ | 919.7 | ||||||||
| Accrued liabilities | 689.8 | 689.8 | (8.5 | )(f) | 681.3 | |||||||||||
| Deferred income taxes | 18.9 | 18.9 | 18.9 | |||||||||||||
| Current portion of long-term debt | 54.8 | 54.8 | 54.8 | |||||||||||||
| Current liabilities | 1,683.2 | 1,683.2 | (8.5 | ) | 1,674.7 | |||||||||||
| Long-term debt | 6,106.4 | 5.0 | (b) | 6,111.4 | (1,038.1 | )(g) | 5,073.3 | |||||||||
| Long-term debt—affiliates | 39.5 | 39.5 | (39.5 | )(g) | — | |||||||||||
| Deferred income taxes | 242.1 | 242.1 | 242.1 | |||||||||||||
| Other noncurrent liabilities | 653.2 | 653.2 | 653.2 | |||||||||||||
| Total liabilities | 8,724.4 | 5.0 | 8,729.4 | (1,086.1 | ) | 7,643.3 | ||||||||||
| Minority interest in common stock of consolidated subsidiaries | 29.2 | 29.2 | 29.2 | |||||||||||||
| Minority interest in warrants of consolidated subsidiary | 128.7 | 128.7 | (128.7 | )(h) | — | |||||||||||
| Manditorily redeemable preferred members' interest | 552.9 | 552.9 | (552.9 | )(i) | — | |||||||||||
| Total minority interests | 710.8 | 710.8 | (681.6 | ) | 29.2 | |||||||||||
| Stockholders' equity | ||||||||||||||||
| Preferred members' interest | 195.7 | 195.7 | (195.7 | )(j) | — | |||||||||||
| Common members' interest | ||||||||||||||||
| Class A units, 10,000,000 issued and outstanding, no par value | — | — | — | |||||||||||||
| Class B units, 10,000,000 issued and outstanding, no par value | — | — | — | |||||||||||||
| Common stock | — | — | — | |||||||||||||
| Additional paid-in capital | 734.4 | 734.4 | 2,129.3 | (k) | 2,863.7 | |||||||||||
| Accumulated deficit | (1,470.0 | ) | (1.5 | )(c) | (1,471.5 | ) | (220.1 | )(l) | (1,691.6 | ) | ||||||
| Accumulated other comprehensive income | 98.5 | 98.5 | 98.5 | |||||||||||||
| Total stockholders' (deficit) equity | (441.4 | ) | (1.5 | ) | (442.9 | ) | 1,713.5 | 1,270.6 | ||||||||
| Total liabilities and stockholders' equity | $ | 8,993.8 | $ | 3.5 | $ | 8,997.3 | $ | (54.2 | ) | $ | 8,943.1 | |||||
34
35
Schedule of Pro Forma and Pro Forma As Adjusted Interest Expense Adjustments
The following schedule sets forth the interest expense adjustments to the pro forma and pro forma as adjusted financial statements set forth above. For a discussion of the debt obligations shown below, see "Management's Discussion and Analysis of Financial Condition and Results of Operations—Debt and Liquidity."
| |
|
Interest Expense |
||||||||||||
|---|---|---|---|---|---|---|---|---|---|---|---|---|---|---|
| |
Pro Forma Balance as of September 30, 2004(1) |
|
Nine Months Ended September 30, |
|||||||||||
| |
Year Ended December 31, 2003 |
|||||||||||||
| |
2003 |
2004 |
||||||||||||
| |
(in millions) |
|||||||||||||
| Average LIBOR for period | 1.209 | % | 1.235 | % | 1.287 | % | ||||||||
| Average dollar/euro exchange rate for period | 1.1329 | 1.1128 | 1.2259 | |||||||||||
Pro forma interest expense adjustments: |
||||||||||||||
| Secured credit facilities: | ||||||||||||||
| HLLC Revolving Facility (LIBOR plus 2.25%, unused fee of 0.50%) | $ | 97.4 | $ | 4.9 | $ | 3.7 | $ | 3.7 | ||||||
| HI Revolving Facility (LIBOR plus 3.25%, unused fee of 0.75%) | — | 2.8 | 2.1 | 2.1 | ||||||||||
| AdMat Revolving Credit Facility (LIBOR plus 3.00%, unused fee of 1.00%) | — | 0.6 | 0.5 | 0.5 | ||||||||||
| HLLC Term Facility (LIBOR plus 3.50%) | 715.0 | 33.7 | 25.4 | 25.7 | ||||||||||
| HI Term Facility (LIBOR plus 3.25%) | 1,366.6 | 60.9 | 46.0 | 46.5 | ||||||||||
| HCA Facilities (90 Day Bank Bill Swap Rate plus 2.90%) | 41.9 | 2.9 | 2.2 | 2.6 | ||||||||||
| New HCCA Facility (90 Day Bank Bill Swap Rate plus 2.90%) | 12.3 | 0.8 | 0.6 | 0.8 | ||||||||||
Secured notes: |
||||||||||||||
| HLLC Senior Secured Notes (11.875% effective rate) | 451.0 | 53.6 | 40.2 | 40.2 | ||||||||||
| AdMat Fixed Rate Notes (11.00%) | 250.0 | 27.5 | 20.6 | 20.6 | ||||||||||
| AdMat Floating Rate Notes (LIBOR plus 8.00%, 8.50% effective rate) | 98.5 | 9.6 | 7.2 | 7.3 | ||||||||||
Notes: |
||||||||||||||
| HLLC Senior Fixed Rate Notes (11.50%) | 300.0 | 34.5 | 25.9 | 25.9 | ||||||||||
| HLLC Senior Floating Rate Notes (LIBOR plus 7.25%) | 100.0 | 8.5 | 6.4 | 6.4 | ||||||||||
| HI Senior Notes (9.478% effective rate) | 456.3 | 43.2 | 32.4 | 32.4 | ||||||||||
| HI Senior Subordinated Notes (10.125%) | 600.0 | 60.7 | 45.6 | 45.6 | ||||||||||
| HI Senior Subordinated Notes (€450, 9.882% effective rate) | 559.6 | 50.4 | 37.1 | 40.9 | ||||||||||
| HLLC Subordinated Fixed Rate Notes (9.50%) | 44.2 | 4.2 | 3.1 | 3.1 | ||||||||||
| HLLC Subordinated Floating Rate Notes (LIBOR plus 3.25%) | 15.1 | 0.7 | 0.5 | 0.5 | ||||||||||
Secured discount notes: |
||||||||||||||
| HMP Discount Notes (23.658% effective rate)(2) | 389.5 | 92.1 | 69.1 | 69.1 | ||||||||||
Discount notes: |
||||||||||||||
| HIH Senior Discount Notes (13.375%)(2) | 479.2 | 64.1 | 48.1 | 48.1 | ||||||||||
Note due to affiliate: |
||||||||||||||
| HLLC Affiliate Note (15.00%)(2) | 39.5 | 5.9 | 4.4 | 4.4 | ||||||||||
Other debt: |
||||||||||||||
| Huntsman Specialty Chemicals Corporation Subordinated Note (9.298% effective rate) | 100.8 | 9.4 | 7.0 | 7.0 | ||||||||||
| Other debt (4.98% effective rate) | 78.8 | 3.9 | 2.9 | 2.9 | ||||||||||
Other items: |
||||||||||||||
| Amortization of debt issuance costs | 23.6 | 17.7 | 17.7 | |||||||||||
| Interest rate hedging arrangements (notional amount of $184.3; pay 4.44% weighted average fixed rate, receive LIBOR) | 2.5 | 1.8 | 1.8 | |||||||||||
| Total pro forma interest expense | $ | 601.0 | $ | 450.5 | $ | 455.8 | ||||||||
Less historical interest expense(3) |
(577.8 |
) |
(410.2 |
) |
(459.5 |
) |
||||||||
Net pro forma interest expense adjustment |
$ |
23.2 |
$ |
40.3 |
$ |
(3.7 |
) |
|||||||
Pro forma as adjusted interest expense adjustments: |
||||||||||||||
| Adjustment of HLLC Term Facility (0.50% interest rate reduction as a result of this offering) | $ | 715.0 | $ | (3.6 | ) | $ | (2.7 | ) | $ | (2.7 | ) | |||
| Repayment of HMP Discount Notes (23.658% effective rate) | 389.5 | (92.1 | ) | (69.1 | ) | (69.1 | ) | |||||||
| Repayment of HIH Senior Discount Notes (13.375%) | 479.2 | (64.1 | ) | (48.1 | ) | (48.1 | ) | |||||||
| Repayment of HLLC Senior Secured Notes (11.875% effective rate) | 159.4 | (18.9 | ) | (14.2 | ) | (14.2 | ) | |||||||
| Repayment of HLLC Affiliate Note (15.00%) | 39.5 | (5.9 | ) | (4.4 | ) | (4.4 | ) | |||||||
| Adjustment to amortization of debt issuance costs | (2.8 | ) | (2.0 | ) | (2.0 | ) | ||||||||
Net pro forma as adjusted interest expense adjustment |
$ |
(187.4 |
) |
$ |
(140.5 |
) |
$ |
(140.5 |
) |
|||||
| Total pro forma as adjusted interest expense | $ | 413.6 | $ | 310.0 | $ | 315.3 | ||||||||
| |
|
Balance |
||||||||||
|---|---|---|---|---|---|---|---|---|---|---|---|---|
| |
|
|
As of September 30, |
|||||||||
| (2) Interest expense for the discount and PIK notes has been calculated on carrying amounts as of September 30, 2004. Respective carrying amounts for each period end were as follows: |
|
As of December 31, 2003 |
||||||||||
| |
2003 |
2004 |
||||||||||
(1) Gives effect to the HLLC Bank Refinancing. |
||||||||||||
| |
|
(in millions) |
||||||||||
| HLLC Affiliate Note | $ | 35.5 | $ | 34.3 | $ | 39.5 | ||||||
| HMP Discount Notes | 329.4 | 311.5 | 389.5 | |||||||||
| HIH Senior Discount Notes | 434.6 | 421.0 | 479.2 | |||||||||
(3) As adjusted for the HIH Consolidated Transaction and the AdMat Transaction. |
||||||||||||
36
MANAGEMENT'S DISCUSSION AND ANALYSIS OF
FINANCIAL CONDITION AND RESULTS OF OPERATIONS
The following discussion and analysis should be read in conjunction with the historical financial statements and other financial information appearing elsewhere in the prospectus, including "Prospectus Summary—Summary Historical and Pro Forma As Adjusted Financial Data," "Capitalization," "Selected Historical Financial Data" and "Unaudited Pro Forma Financial Data."
Overview
We are among the world's largest global manufacturers of differentiated and commodity chemical products. We manufacture a broad range of chemical products and formulations, which we market in more than 100 countries to a diversified group of consumer and industrial customers. Our products are used in a wide range of applications, including those in the adhesives, aerospace, automotive, construction products, durable and non-durable consumer products, electronics, medical, packaging, paints and coatings, power generation, refining and synthetic fiber industries. We are a leading global producer in many of our key product lines, including MDI, amines, surfactants, epoxy-based polymer formulations, maleic anhydride and titanium dioxide. | We operate 63 manufacturing facilities located in 22 countries and employ over 11,500 associates. Our businesses benefit from significant vertical integration, large production scale and proprietary manufacturing technologies, which allow us to maintain a low-cost position. We had pro forma revenues for the nine months ended September 30, 2004 and the year ended December 31, 2003 of $8.4 billion and $9.3 billion, respectively.
Our business is organized around our six segments: Polyurethanes, Advanced Materials, Performance Products, Pigments, Polymers and Base Chemicals. These segments can be divided into two broad categories: differentiated and commodity. Our Polyurethanes, Advanced Materials and Performance Products segments produce differentiated products, and our Pigments, Polymers and Base Chemicals segments produce commodity chemicals. Among our commodity products, our Pigments business, while cyclical, is influenced largely by seasonal demand patterns in the coatings industry. Certain products in our Polymers segment also follow different trends than petrochemical commodities as a result of our niche marketing strategy for such products that focuses on supplying customized formulations. Nevertheless, each of our six operating segments is impacted to some degree by economic conditions, prices of raw materials and global supply and demand pressures.
Growth in our Polyurethanes and Advanced Materials segments has been driven by the continued substitution of our products for other materials across a broad range of applications as well as the level of global economic activity. Historically, demand for many of these products has grown at rates in excess of GDP growth. In Polyurethanes, this growth, particularly in Asia, has recently resulted in improved demand and higher industry capacity utilization rates for many of our key products, including MDI. In 2004, the profitability of our Polyurethanes and Advanced Materials segments has improved due to increased demand in several of our key industrial end markets, including aerospace, automotive and construction products. This has allowed us to increase selling prices, which has more than offset increases in the cost of our primary raw materials, including benzene, propylene and chlorine.
The global PO market is influenced by supply and demand imbalances. PO demand is largely driven by growth in the polyurethane industry, and, as a result, growth rates for PO have generally exceeded GDP growth rates. As a co-product of our PO manufacturing process, we also produce MTBE. MTBE is an oxygenate that is blended with gasoline to reduce harmful vehicle emissions and to enhance the octane rating of gasoline. See "—Business—Environmental, Health and Safety Matters—MTBE Developments" below for more information on the legal and regulatory developments that may curtail or eliminate the use of MTBE in gasoline in the U.S.
In our Performance Products segment, demand for our performance specialties has generally continued to grow at rates in excess of GDP as overall demand is significantly influenced by new
37
product and application development. In 2004, overall demand for most of our performance intermediates has generally been stable or improving, but excess surfactant manufacturing capacity in Europe and a decline in the use of LAB in new detergent formulations have limited our ability to increase prices in response to higher raw material costs. In EG, higher industry capacity utilization rates in 2004 due to stronger demand in the PET resin and Asian fiber markets have resulted in higher profitability.
Historically, demand for titanium dioxide pigments has grown at rates approximately equal to global GDP growth. Pigment prices have historically reflected industry-wide operating rates but have typically lagged behind movements in these rates by up to twelve months due to the effects of product stocking and destocking by customers and producers, contract arrangements and seasonality. The industry experiences some seasonality in its sales because sales of paints, the largest end use for titanium dioxide, generally peak during the spring and summer months in the northern hemisphere. This results in greater sales volumes in the second and third quarters of the year.
The profitability of our Polymers and Base Chemicals segments has historically been cyclical in nature. The industry has recently operated in a down cycle that resulted from significant new capacity additions, weak demand reflecting soft global economic conditions and high crude oil and natural gas-based raw material costs. Despite continued high feedstock costs, the profitability of our Base Chemicals segment has improved in 2004 as demand has strengthened and average selling prices and profit margins have increased in most of our product lines. According to Nexant, industry fundamentals currently point to a continued cyclical recovery in the olefins and aromatics industries. Limited new capacity additions have been announced for these products in North America and Western Europe over the next several years. Consequently, Nexant currently expects operating rates and profit margins in the polymers and base chemicals markets to increase as demand continues to recover as a result of improved global economic conditions.
Pro Forma Results of Operations
The businesses of our predecessor Huntsman Holdings, LLC underwent significant changes as a result of a number of transactions that were completed in 2003. As a result, the financial information as of and for the year ended December 31, 2003 is not comparable to the prior years' historical financial data presented herein, and the financial information as of and for the nine months ended September 30, 2004 is not comparable to the financial information as of and for the nine months ended September 30, 2003. In order to present data that is useful for comparative purposes, we have included pro forma information for the years ended December 31, 2002 and 2003 and the nine month periods ended September 30, 2003 and 2004. The pro forma information for the year ended December 31, 2003 and the nine months ended September 30, 2003 has been prepared as if the HIH Consolidation Transaction, the AdMat Transaction and the Refinancing Transactions occurred on January 1, 2003. HIH became a consolidated subsidiary effective as of May 1, 2003, and Advanced Materials became a consolidated subsidiary effective as of June 30, 2003. The Refinancing Transactions occurred between April 2003 and October 2004. The pro forma information for the year ended December 31, 2002 has been prepared as if the HIH Consolidation Transaction, the AdMat Transaction, the Refinancing Transactions and the HLLC Restructuring occurred on January 1, 2002. See Note 1 to the Consolidated Financial Statements of Huntsman Holdings, LLC included elsewhere in this prospectus for a discussion of the HLLC Restructuring. The pro forma information for the nine months ended September 30, 2004 has been prepared as if the Refinancing Transaction that occurred in 2004 occurred on January 1, 2004. We believe the use of pro forma results for the periods covered in this report provides a more meaningful comparison of our results between the applicable periods. These results do not necessarily reflect the results that would have been obtained if we had completed the transactions described above on the dates indicated or that may be expected in the future. See "Unaudited Pro
38
Forma Financial Data." For a period to period comparison of our historical results of operations, see "—Historical Results of Operations."
| |
Pro Forma |
||||||||||||
|---|---|---|---|---|---|---|---|---|---|---|---|---|---|
| |
Year Ended December 31, |
Nine Months Ended September 30, |
|||||||||||
| |
2002 |
2003 |
2003 |
2004 |
|||||||||
| |
(in millions) |
||||||||||||
| Revenues | $ | 8,012.2 | $ | 9,252.4 | $ | 6,885.2 | $ | 8,357.7 | |||||
| Cost of goods sold | 6,929.7 | 8,255.1 | 6,150.1 | 7,358.0 | |||||||||
| Gross profit | 1,082.5 | 997.3 | 735.1 | 999.7 | |||||||||
| Operating expense | 824.5 | 732.2 | 567.2 | 580.9 | |||||||||
| Restructuring, impairment and plant closing costs | 62.7 | 55.0 | 44.3 | 202.4 | |||||||||
| Operating income | 195.3 | 210.1 | 123.6 | 216.4 | |||||||||
| Interest expense, net | (605.0 | ) | (601.0 | ) | (450.5 | ) | (455.8 | ) | |||||
| Loss on accounts receivable securitization program | (5.5 | ) | (32.4 | ) | (24.0 | ) | (10.2 | ) | |||||
| Equity in income of unconsolidated affiliates | 1.6 | 1.5 | 0.8 | 3.0 | |||||||||
| Other non-operating expense | (7.2 | ) | (2.2 | ) | (1.8 | ) | (0.8 | ) | |||||
| Loss before income taxes and minority interest | (420.8 | ) | (424.0 | ) | (351.9 | ) | (247.4 | ) | |||||
| Income tax benefit (expense) | 11.1 | (32.1 | ) | 2.4 | 25.7 | ||||||||
| Minority interests in subsidiaries' loss (income) | 15.8 | 6.8 | 5.8 | (1.1 | ) | ||||||||
| Cumulative effect of accounting change | 169.7 | — | — | — | |||||||||
| Net loss | $ | (224.2 | ) | $ | (449.3 | ) | $ | (343.7 | ) | $ | (222.8 | ) | |
| Interest expense, net | 605.0 | 601.0 | 450.5 | 455.8 | |||||||||
| Income tax (benefit) expense | (11.1 | ) | 32.1 | (2.4 | ) | (25.7 | ) | ||||||
| Depreciation and amortization | 487.7 | 479.7 | 358.9 | 410.3 | |||||||||
| EBITDA(1) | $ | 857.4 | $ | 663.5 | $ | 463.3 | $ | 617.6 | |||||
39
| |
Pro Forma |
||||||||||||||
|---|---|---|---|---|---|---|---|---|---|---|---|---|---|---|---|
| |
Year Ended December 31, |
Nine Months Ended September 30, |
|||||||||||||
| |
2002 |
2003 |
2003 |
2004 |
|||||||||||
| |
(in millions) |
||||||||||||||
| Early extinguishment of debt | $ | (6.7 | ) | $ | — | $ | — | $ | (1.9 | ) | |||||
| Legal and contract settlement income (expense), net | 9.0 | (5.5 | ) | (5.5 | ) | (6.1 | ) | ||||||||
| Gain (loss) on accounts receivable securitization program | (5.5 | ) | (32.4 | ) | (24.0 | ) | (10.2 | ) | |||||||
| Asset write down | — | (5.8 | ) | (5.8 | ) | — | |||||||||
| Reorganization costs | (40.6 | ) | (27.5 | ) | (27.5 | ) | — | ||||||||
| Cumulative effect of accounting change | 169.7 | — | — | — | |||||||||||
| Restructuring, impairment and plant closing (expense) income: | |||||||||||||||
| Polyurethanes | $ | — | $ | (28.1 | ) | $ | (22.2 | ) | $ | (32.8 | ) | ||||
| Advanced Materials | (56.0 | ) | — | — | — | ||||||||||
| Performance Products | (4.6 | ) | (22.1 | ) | (20.1 | ) | (41.2 | ) | |||||||
| Pigments | (3.1 | ) | (6.5 | ) | (1.1 | ) | (111.7 | ) | |||||||
| Polymers | 5.7 | (0.7 | ) | (0.9 | ) | (7.6 | ) | ||||||||
| Base Chemicals | — | 2.4 | — | (9.1 | ) | ||||||||||
| Corporate and other | (4.7 | ) | — | — | — | ||||||||||
| Total | $ | (62.7 | ) | $ | (55.0 | ) | $ | (44.3 | ) | $ | (202.4 | ) | |||
Nine months ended September 30, 2004 (Pro Forma) compared to nine months ended September 30, 2003 (Pro Forma)
For the nine months ended September 30, 2004, we had a net loss of $222.8 million on revenues of $8,357.7 million compared to a net loss of $343.9 million on revenues of $6,885.2 million for the same period in 2003. The decrease of $121.1 million in net loss was the result of the following items:
40
41
The following table sets forth the revenues and EBITDA for each of our operating segments (dollars in millions):
| |
Pro Forma |
|
|||||||
|---|---|---|---|---|---|---|---|---|---|
| |
Nine Months Ended September 30, |
|
|||||||
| |
% Change |
||||||||
| |
2003 |
2004 |
|||||||
| |
(in millions) |
|
|||||||
| Revenues | |||||||||
| Polyurethanes | $ | 1,718.1 | $ | 2,117.4 | 23 | % | |||
| Advanced Materials | 790.5 | 866.4 | 10 | % | |||||
| Performance Products | 1,266.3 | 1,399.7 | 11 | % | |||||
| Pigments | 752.5 | 794.7 | 6 | % | |||||
| Polymers | 847.7 | 1,019.6 | 20 | % | |||||
| Base Chemicals | 1,954.2 | 2,755.8 | 41 | % | |||||
| Eliminations | (444.1 | ) | (595.9 | ) | 34 | % | |||
| Total | $ | 6,885.2 | $ | 8,357.7 | 21 | % | |||
Segment EBITDA |
|||||||||
| Polyurethanes | $ | 157.1 | $ | 270.7 | 72 | % | |||
| Advanced Materials | (4.7 | ) | 121.3 | NM | |||||
| Performance Products | 90.3 | 82.9 | (8 | )% | |||||
| Pigments | 88.3 | (53.6 | ) | NM | |||||
| Polymers | 53.4 | 45.6 | (15 | )% | |||||
| Base Chemicals | 55.8 | 204.8 | 267 | % | |||||
| Corporate and other | 23.1 | (54.1 | ) | NM | |||||
| Total | $ | 463.3 | $ | 617.6 | 33 | % | |||
NM—Not meaningful
Polyurethanes
For the nine months ended September 30, 2004, Polyurethanes revenues increased by $399.3 million, or 23%, from the same period in 2003, primarily from higher average selling prices and higher sales volumes for MDI. MDI revenues increased by 30%, resulting from 16% higher sales volumes and 12% higher average selling prices. The increase in MDI average selling prices resulted principally from improved market demand coupled with tighter supply, stronger major European currencies versus the U.S. dollar and in response to higher raw material and energy costs. Higher MDI volumes reflect further extension of markets for MDI and recent improvements in global economic conditions.
For the nine months ended September 30, 2004, Polyurethanes segment EBITDA increased by $113.6 million, or 72%, from the same period in 2003. Increased segment EBITDA resulted mainly from higher sales volumes and higher average selling prices, partly offset by increased raw material and energy costs and higher restructuring costs. For the nine months ended September 30, 2003 and 2004, restructuring charges of $22.2 million and $32.8 million, respectively, were included in segment EBITDA.
Advanced Materials
On a pro forma basis, Advanced Materials revenues for the nine months ended September 30, 2004 increased by $75.9 million, or 10%, from the same period in 2003. Higher revenues were attributable to a 10% increase in average selling prices, with stable sales volumes. Average selling prices
42
were higher due to price increase initiatives in certain markets in response to improved demand, higher raw material costs and the effect of the strength of the major European currencies versus the U.S. dollar.
For the nine months ended September 30, 2004, Advanced Materials segment EBITDA increased by $126.0 million to $121.3 million from a loss of $4.7 million for the same period of 2003. The increase in segment EBITDA was primarily due to higher average selling prices and lower reorganization and contract settlement costs, partially offset by higher raw material and manufacturing costs attributable to the strength of the major European currencies versus the U.S. dollar. In addition, the 2003 period includes foreign currency losses of $33.8 million related to the debt structure of Advanced Materials' predecessor.
Performance Products
For the nine months ended September 30, 2004, Performance Products revenues increased by $133.4 million, or 11%, from the same period in 2003 primarily as a result of higher average selling prices for all products, offset somewhat by lower sales volumes in certain product lines. Overall, average selling prices increased by 14% in response to higher raw material and energy costs, improved market conditions and the strength of European and Australian currencies versus the U.S. dollar. The 3% decrease in sales volumes resulted principally from lower amine and surfactants sales. The reduction in surfactants sales volumes was due to reduced customer demand in certain product lines and increased competition in the marketplace.
For the nine months ended September 30, 2004, Performance Products segment EBITDA decreased by $7.4 million, or 8%, from the same period in 2003, resulting primarily from higher raw material and energy costs and higher restructuring charges that more than offset higher average selling prices, particularly for ethylene glycol. During the nine months ended September 30, 2004, we recorded restructuring charges of $41.2 million related to workforce reductions at several of our European surfactants locations and the closure of our Guelph, Canada, Queeny, Missouri and Austin, Texas facilities. In the same period in 2003, we recorded a $20.1 million restructuring charge mainly related to the closure of a number of units at our Whitehaven, U.K. facility.
Pigments
For the nine months ended September 30, 2004, Pigments segment revenues increased by $42.2 million, or 6%, from the same period in 2003, resulting principally from higher sales volumes, higher average selling prices in North America and Asia and the strengthening of major European currencies versus the U.S. dollar, offset somewhat by lower average selling prices in local European currencies.
Pigments segment EBITDA for the nine months ended September 30, 2004 decreased by $141.9 million to a loss of $53.6 million from $88.3 million for the same period in 2003. The decrease in segment EBITDA is mainly due to restructuring and plant closing costs of $111.7 million, charges of $14.9 million relating to the payment of costs and settlement amounts for claims relating to discoloration of nonplasticized polyvinyl chloride products allegedly caused by our titanium dioxide ("Discoloration Claims") recorded in the 2004 period, increased costs due to the strengthening of the major European currencies versus the U.S. dollar and lower average selling prices in local European currencies. Somewhat offsetting these decreases were increases to segment EBITDA from higher sales volumes and higher average selling prices in North America and Asia. During the nine months ended September 30, 2003 and 2004, our Pigments segment recorded restructuring charges of $1.1 million and $111.7 million, respectively.
43
Polymers
For the nine months ended September 30, 2004, Polymers revenues increased by $171.9 million, or 20%, from the same period in 2003 due mainly to 17% higher average selling prices and 3% higher sales volumes. Higher average selling prices were primarily in response to higher raw material and energy costs while sales volumes increased principally as a result of stronger customer demand.
For the nine months ended September 30, 2004, Polymers segment EBITDA decreased by $7.8 million, or 15%, from the same period in 2003. The decrease in segment EBITDA was primarily due to higher raw material and energy costs, a $7.6 million restructuring charge related to the closure of an Australian manufacturing unit and the $8.5 million unfavorable impact of foreign exchange movements, partially offset by higher average selling prices, higher sales volumes and improved production efficiencies.
Base Chemicals
For the nine months ended September 30, 2004, Base Chemicals revenues increased $801.6 million, or 41%, from the same period in 2003 due mainly to a 30% increase in average selling prices and an 8% increase in sales volumes. Higher average selling prices were primarily in response to higher raw material and energy costs and the strengthening of major European currencies versus the U.S. dollar. Sales volumes increased for all key products driven by increased sales volumes of ethylene, propylene and cyclohexane of 6%, 12% and 12%, respectively, principally as a result of increased demand.
For the nine months ended September 30, 2004, Base Chemicals segment EBITDA increased by $149.0 million, or 267%, from the same period in 2003 primarily as a result of higher average selling prices, increased sales volumes and lower operating expenses resulting from our on-going cost reduction initiatives, partially offset by higher raw material and energy costs and higher restructuring costs. During the nine months ended September 30, 2004, our Base Chemicals segment recorded restructuring charges of $9.1 million related to workforce reductions primarily at our Wilton and North Tees, U.K. facilities.
Corporate and Other
Corporate and other items includes unallocated corporate overhead, unallocated foreign exchange gains and losses, loss on the sale of accounts receivable, other non-operating income and expense and minority interest in subsidiaries' loss. For the nine months ended September 30, 2004, EBITDA from corporate and other items decreased by $77.2 million to a loss of $54.1 million from $23.1 million for the same period in 2003. Lower EBITDA resulted primarily from a negative impact from unallocated foreign currency gains and losses in the nine months ended September 30, 2004 as compared to the comparable period in 2003.
Year ended December 31, 2003 (Pro Forma) compared to year ended December 31, 2002 (Pro Forma)
For the year ended December 31, 2003, we had a net loss of $449.7 million on revenues of $9,252.4 million, compared to net loss of $225.3 million on revenues of $8,012.2 million for 2002. The decrease of $224.4 million in net income was the result of the following items:
44
overall raw material prices during 2003 as compared to 2002. Increased raw material prices were only partially offset by increased average selling prices.
45
The following table sets forth certain financial information for each of our operating segments:
| |
Pro Forma |
|
||||||||
|---|---|---|---|---|---|---|---|---|---|---|
| |
Year Ended December 31, |
|
||||||||
| |
% Change |
|||||||||
| |
2002 |
2003 |
||||||||
| |
(in millions) |
|
||||||||
| Revenues | ||||||||||
| Polyurethanes | $ | 2,066.0 | $ | 2,297.5 | 11 | % | ||||
| Advanced Materials | 949.0 | 1,049.6 | 11 | % | ||||||
| Performance Products | 1,524.0 | 1,689.6 | 11 | % | ||||||
| Pigments | 880.3 | 1,009.9 | 15 | % | ||||||
| Polymers | 944.3 | 1,155.5 | 22 | % | ||||||
| Base Chemicals | 2,091.3 | 2,639.9 | 26 | % | ||||||
| Eliminations | (442.7 | ) | (589.6 | ) | (33 | )% | ||||
| Total | $ | 8,012.2 | $ | 9,252.4 | 16 | % | ||||
| Segment EBITDA | ||||||||||
| Polyurethanes | $ | 365.1 | $ | 233.4 | (36 | )% | ||||
| Advanced Materials | (28.0 | ) | 48.2 | NM | ||||||
| Performance Products | 191.6 | 128.3 | (33 | )% | ||||||
| Pigments | 68.2 | 105.4 | 55 | % | ||||||
| Polymers | 81.8 | 80.8 | (1 | )% | ||||||
| Base Chemicals | 58.6 | 71.7 | 22 | % | ||||||
| Corporate and other | 120.1 | (4.3 | ) | NM | ||||||
| Total | $ | 857.4 | $ | 663.5 | (23 | )% | ||||
NM—Not Meaningful
Polyurethanes
For the year ended December 31, 2003, Polyurethanes revenues increased by $231.5 million, or 11%, to $2,297.5 million from $2,066.0 million for 2002. MDI revenues increased by 11%, due to 11% higher average selling prices and relatively flat sales volumes. The overall lack of MDI sales volume growth was largely the result of a reduction in spot sales to co-producers in 2003. MDI sales volumes, excluding spot sales, rose by 6%, with increases of 20%, 6% and 2% in Asia, the Americas and Europe, respectively, driven by the improved rigid polyurethanes market in the fourth quarter 2003. MDI overall average selling prices increased by 11%, 7% of which was attributable to the strength of the major European currencies versus the U.S. dollar and 4% of which was attributable to our continued efforts to increase sales prices as raw material costs increased. Polyol revenues increased by
46
16% as sales volumes increased by 4%, consistent with underlying MDI sales volumes, and average selling prices increased by 12%, 7% of which was attributable to the strength of the major European currencies versus the U.S. dollar. PO revenue decreased 8%, primarily due to the conversion of certain sales to a tolling arrangement, which affected revenues but only had a minimal impact on gross margin. MTBE revenues increased by 14% due to a 7% increase in sales volumes and a 7% increase in selling prices due to stronger crude oil and gasoline markets.
For the year ended December 31, 2003, Polyurethanes segment EBITDA decreased by $131.7 million to $233.4 million from $365.1 million for the same period in 2002. Lower EBITDA resulted mainly from a $271.9 million increase in raw material and energy costs, partly offset by a $200.5 million improvement in average selling prices. We also recorded $28.1 million in restructuring charges in connection with the integration of our global flexible products unit into our urethane specialties unit and cost reduction efforts at our Rozenburg, Netherlands site. These charges are part of an overall cost reduction program that is expected to be implemented from 2003 to 2005. We also incurred a $2.5 million charge due to the write-off of an asset formerly used in connection with our Geismar, Louisiana TDI facility. Fixed production costs increased $33.6 million, primarily due to the $18.9 million impact of the strengthening of the major European currencies versus the U.S. dollar, increased pension costs of $10.1 million and a $7.1 million fixed cost absorption as a result of a reduction in inventory levels. Operating expenses also increased $1.5 million due to a $16.6 million adverse foreign currency exchange impact, partly offset by $15.3 million in cost savings as measured in local currencies.
Advanced Materials
Advanced Materials revenues for the year ended December 31, 2003 increased by $100.6 million, or 11%, to $1,049.6 million from $949.0 million for 2002. Higher revenues were attributable to a 3% increase in sales volumes and an 8% increase in average selling prices. The increase in Advanced Materials average selling prices was primarily due to the effect of the strength of the major European currencies versus the U.S. dollar. Sales volumes in our Advanced Materials segment increased 8% in Asia, 1.5% in Europe and 2.5% in North America. Revenues from our surface technologies products increased 8%, primarily as a result of a 7% increase in average selling prices, driven primarily by favorable currency movements. Structural composites revenues increased 12%, as sales volumes increased 11%, with strong sales in the wind power generation market and strengthening sales in the aerospace and recreational markets. Average selling prices for structural composites products increased 1%, as favorable currency movements were almost entirely offset by weaker prices in the Asian electronic laminates market. Revenues from our electrical and electronics materials increased 10% in response to a 12% increase in average selling prices, driven by currency movements and selected price increases. Sales volumes of electrical products decreased by 2%, primarily due to weak demand in the U.S. and European electrical power generation markets. Adhesives revenues increased by 23%, as sales volumes increased 16% with strong sales volume gains in the DVD bonding, consumer and general industrial markets, and average selling prices increased 6% as a result of favorable foreign currency movements. Tooling and modeling materials revenues increased by 9% as sales volumes increased 3% due to steady growth in sales of stereolithography products throughout the year and growth in the automotive markets in the fourth quarter 2003. Average selling prices for tooling and modeling materials increased 6%, as a result of a combination of favorable foreign currency movements and an improvement in our product mix.
For the year ended December 31, 2003, Advanced Materials segment EBITDA increased by $76.2 million to $48.2 million from a loss of $28.0 million for the same period in 2002. Higher EBITDA resulted mainly from a decrease in operating expenses of $105.9 million to $201.1 million from $307.0 million for 2002. Lower costs in 2003 were the result of our cost reduction initiatives and a $56.0 million impairment charge recorded in 2002. This reduction was partially offset by lower margins
47
of $15.9 million, as average selling price increases failed to keep pace with increases in raw material prices. Prices for the raw materials used as building blocks for many of our formulated polymer systems increased 9% on average in 2003 as compared to 2002, partially due to adverse foreign currency movements. Prices for epichlorohydrin and bisphenol A, the two base components of base resins, each increased 6% in Europe and were flat and increased 2%, respectively, in North America. Reorganization costs for the period increased $5.5 million, from $22.0 million in 2002 to $27.5 million in 2003. These increased costs are the result of a number of cost reduction programs, including the cost of severance for headcount reductions and expenses in connection with operational restructuring and the financial restructuring leading up to the AdMat Transaction.
Performance Products
For the year ended December 31, 2003, Performance Products revenues increased by $165.6 million, or 11%, to $1,689.6 million from $1,524.0 million in 2002. Overall, segment sales volumes increased by 2% and average selling prices increased by 8%. EG revenues increased by 63% over 2002, resulting from a 45% increase in average selling prices in response to higher raw material costs and higher industry operating rates, and sales volumes increased 13% due to stronger demand, particularly in Asia. Maleic anhydride revenues decreased by 18% compared to 2002, as sales volumes fell by 2% and average selling prices fell by 19%, both due to lower sales of relatively higher-priced catalyst. Our sales of maleic anhydride catalyst are dependent upon new plant commissioning, plant retrofits and catalyst change schedules. Surfactants revenues increased by 5% over 2002, resulting from an 8% increase in average selling prices, partially offset by a decrease of 3% in global sales volumes. Average selling prices in our non-U.S. surfactants markets decreased in local currencies due to intense competition, but average selling prices of our surfactants increased by 19% due to the strength of the major European currencies and the Australian dollar versus the U.S. dollar. In the U.S., surfactants pricing was relatively flat. Surfactants sales volumes decreased due to a market shift away from nonyl phenol ethoxylates to alternative products, softer European demand, competitive activity and decreased export business as a result of the strength of the major European currencies versus the U.S. dollar. Amine revenues increased by 12% over 2002, resulting from a 9% increase in average selling prices, which was due to higher raw material costs, and improved product mix and an increase of 2% in sales volumes as a result of favorable demand conditions.
For the year ended December 31, 2003, Performance Products segment EBITDA fell by $63.3 million to $128.3 million from $191.6 million in 2002. Lower segment EBITDA resulted mainly from a $157.5 million increase in raw material costs, partially offset by a $139.7 million improvement in average selling prices. Fixed production costs increased by $13.2 million, of which $11.0 million was due to adverse foreign exchange movements, and the remainder of which was due to higher maintenance and waste disposal costs. Overall, operating expenses increased by $12.2 million, of which $9.0 million was due to adverse foreign exchange impacts. Restructuring costs in the year ended December 31, 2003 were $17.5 million higher than in 2002 due to the $20.1 million charge taken in connection with the closure of certain units at our Whitehaven, U.K. facility in September 2003 and $2.0 million charged in respect of severance costs arising from the closure of an administrative office in London, U.K., the rationalization of our surfactants technical center in Oldbury, U.K. and the restructuring of our facility in Barcelona, Spain.
Pigments
For the year ended December 31, 2003, Pigments revenues increased by $129.6 million, or 15%, to $1,009.9 million from $880.3 million for the same period in 2002. Average selling prices increased by 13%, of which 9% resulted from the strength of the major European currencies versus the U.S. dollar, and the remainder of which resulted from improved supply and demand conditions. Average selling prices as measured in local currencies increased by 5%, 3% and 6% in Europe, North America and
48
Asia-Pacific ("APAC"), respectively, due to price increases implemented in early 2003 as a result of favorable supply and demand conditions that existed at that time. Sales volumes increased overall by 1%, with North America and APAC both showing an increase of 6%, while Europe was unchanged.
For the year ended December 31, 2003, Pigments segment EBITDA increased by $37.2 million to $105.4 million from $68.2 million in 2002. The increase in segment EBITDA is primarily a result of a $114.6 million increase in selling prices and the $5.3 million impact of the 1% increase in sales volume, partially offset by an increase in manufacturing costs of $83.6 million. The manufacturing cost increase was caused mainly by foreign currency movements of $84.3 million, which were partially offset by savings of $4.8 million, as measured in local currencies, from our cost reduction initiatives. Operating expenses increased by $1.6 million mainly due to an increase in restructuring charges of $3.4 million and a $3.2 million increase in pension costs, partially offset by the release of $2.6 million of surplus environmental provisions recorded in relation to our Tracy, Canada facility, which was closed in 2000.
Polymers
For the year ended December 31, 2003, Polymers revenues increased by $211.2 million, or 22%, to $1,155.5 million from $944.3 million in 2002. Overall sales volumes increased by 9% and average selling prices increased by 13%. Polyethylene revenues increased by 22%, as average selling prices increased 19% primarily in response to higher underlying raw material and energy costs, and sales volumes increased 2%. After giving effect to the shutdown of a manufacturing line in Odessa, Texas, polypropylene revenues increased by 11%, as average selling prices increased by 11% primarily in response to higher raw material and energy costs and increased industry operating rates. APAO revenues increased by 29%, as average selling prices increased 5% due to changes in product mix, and sales volumes increased 24% as the result of increased export sales and increased sales into the roofing market. EPS revenues increased by 10%, as average selling prices increased 16% primarily in response to higher underlying raw material and energy costs, while sales volumes decreased 5% due to import competition. Australian styrenics revenues increased by 25%, resulting from an increase in average selling prices of 18%, 17% of which was attributable to the strength of the Australian dollar versus the U.S. dollar, and an increase in sales volumes of 6%.
For the year ended December 31, 2003, Polymers segment EBITDA decreased by $1.0 million to $80.8 million from $81.8 million in 2002. The decrease in segment EBITDA is primarily the result of increases in selling prices of $165.5 million and increases in sales volumes of $8.6 million, which were offset by higher raw material and energy prices of $152.4 million, higher fixed production costs of $18.6 million (primarily in maintenance and employee costs), and lower operating expenses of $2.2 million. A favorable adjustment of $5.7 million to EBITDA taken in 2002, associated with the partial reversal of a 2001 restructuring charge, also contributed a negative impact to the 2003 over 2002 change.
Base Chemicals
For the year ended December 31, 2003, Base Chemicals revenues increased by $548.6 million, or 26%, to $2,639.9 million from $2,091.3 million in 2002. Overall, sales volumes decreased by 3% and average selling prices increased by 30%. The decrease in sales volumes was primarily the result of a 14% decrease in our U.S. olefins sales volumes due to the planned maintenance shutdown at our Port Arthur, Texas facility in May 2003 and lower benzene sales volumes in our European markets due to increased internal consumption to produce cyclohexane. Base Chemicals average selling prices were up 24% in response to higher raw material and energy prices and favorable supply and demand conditions and 6% due to the strength of the major European currencies versus the U.S. dollar. Ethylene revenues increased 22%, resulting from a 22% increase in average sales prices while sales volumes were relatively flat. Propylene revenue increase 6%, resulting from an 18% increase in average selling prices,
49
partially offset by a 10% decrease in sales volumes. Cyclohexane revenues increased 21%, resulting from a 28% increase in average selling prices, partially offset by 6% lower sales volumes.
For the year ended December 31, 2003, Base Chemicals segment EBITDA increased by $13.1 million to $71.7 million from $58.6 million in 2002. The increase in segment EBITDA is primarily the result of a $633.7 million increase in average selling prices. Higher average selling prices were partially offset by a $571.8 million increase in raw material and energy costs and by $5.3 million in lower sales volumes primarily due to the planned shutdown of our Port Arthur, Texas olefins facility. Fixed production costs increased $49.9 million, of which $16.0 million was due to foreign exchange impacts, $11.0 million was due to costs reclassified from operating expenses and $19.9 million was due to higher costs related to a planned maintenance shutdown as well as other personnel and maintenance costs. Operating expenses decreased by $7.9 million, which included $11.0 million of costs reclassified as fixed production costs, $2.6 million of insurance claim recoveries and $3.0 million of recoveries from the sale of precious metals used in the manufacturing process. The decreases in operating expenses were partially offset by $2.4 million associated with various terminated capital projects and reduced foreign currency translation gains of $1.9 million, a $1.8 million bad debt adjustment taken in 2003 and a $2.8 million credit adjustment taken in 2002 related to MTBE raw material costs in 2001.
Corporate and Other
Corporate and other includes corporate overhead, loss on the accounts receivable securitization program, minority interest in earnings of consolidated subsidiaries and unallocated foreign exchange gains and losses. For the year ended December 31, 2003, EBITDA from corporate and other items decreased by $124.4 million to a loss of $4.3 million from $120.1 million in 2002. This decrease was primarily due to the cumulative effect of accounting changes of $169.7 million resulting from the adoption of SFAS No. 141, "Business Combinations," and increased losses on HI's accounts receivable securitization program of $26.9 million, partially offset by decreased reorganization costs of $13.1 million and increased unallocated foreign exchange gains of $54.8 million.
As noted, unallocated foreign exchange gains were $54.8 million higher, primarily resulting from movements in the foreign exchange rates used to translate the current portion of intercompany balances to the functional currency at the end of the period as well as the translation of foreign currency accounts receivable balances sold into HI's accounts receivable securitization program to U.S. dollars. Losses on HI's accounts receivable securitization program include the discount on receivables sold into the program, fees and expenses associated with the program and gains (losses) on foreign currency hedge contracts mandated by the terms of the program to hedge currency exposures on the collateral supporting the off-balance sheet debt issued. The increased losses on HI's accounts receivable securitization program were primarily due to losses on foreign exchange hedge contracts mandated by HI's accounts receivable securitization program and the increase in the size of the securitization facility effective October 2002.
Historical Results of Operations
The businesses of our predecessor Huntsman Holdings, LLC underwent significant changes as a result of a number of transactions. In our historical financial data, HIH is accounted for using the equity method of accounting through April 30, 2003. Effective May 1, 2003, as a result of the HIH Consolidation Transaction, we have consolidated the financial results of HIH. Effective July 1, 2003, as a result of the AdMat Transaction, we have consolidated the financial results of Advanced Materials. Effective September 30, 2002, as a result of the HLLC Restructuring, we have consolidated the financial results of HLLC. See Note 1 to the Consolidated Financial Statements of Huntsman Holdings, LLC included elsewhere in this prospectus for a discussion of the HLLC Restructuring. As a result, the financial information as of and for the year ended December 31, 2003 is not comparable to the prior years' historical financial data presented herein, and the financial information as of and for the nine
50
months ended September 30, 2004 is not comparable to the financial information as of and for the nine months ended September 30, 2003.
| |
Historical |
|||||||||||||||
|---|---|---|---|---|---|---|---|---|---|---|---|---|---|---|---|---|
| |
Year Ended December 31, |
Nine Months Ended September 30, |
||||||||||||||
| |
2001 |
2002 |
2003 |
2003 |
2004 |
|||||||||||
| |
(in millions) |
|||||||||||||||
| Revenues | $ | 2,757.4 | $ | 2,661.0 | $ | 7,080.9 | $ | 4,711.1 | $ | 8,357.7 | ||||||
| Cost of goods sold | 2,666.6 | 2,421.0 | 6,373.1 | 4,258.7 | 7,358.0 | |||||||||||
| Gross profit | 90.8 | 240.0 | 707.8 | 452.4 | 999.7 | |||||||||||
| Operating expense | 211.7 | 174.7 | 493.4 | 333.3 | 580.9 | |||||||||||
| Restructuring, impairment and plant closing costs (credit) | 588.5 | (1.0 | ) | 37.9 | 27.2 | 202.4 | ||||||||||
| Operating (loss) income | (709.4 | ) | 66.3 | 176.5 | 91.9 | 216.4 | ||||||||||
| Interest expense, net | (239.3 | ) | (181.9 | ) | (409.1 | ) | (260.7 | ) | (459.5 | ) | ||||||
| Loss on sale of accounts receivable | (5.9 | ) | — | (20.4 | ) | (11.9 | ) | (10.2 | ) | |||||||
| Equity in (loss) income of unconsolidated affiliates | (86.8 | ) | (31.4 | ) | (37.5 | ) | (38.2 | ) | 3.0 | |||||||
| Other (expense) income | 0.6 | (7.6 | ) | — | 0.4 | (0.8 | ) | |||||||||
| Loss before income tax benefit and minority interests | (1,040.8 | ) | (154.6 | ) | (290.5 | ) | (218.5 | ) | (251.1 | ) | ||||||
| Income tax benefit (expense) | 184.9 | (8.5 | ) | (30.8 | ) | 3.8 | 25.7 | |||||||||
| Minority interests in subsidiaries' loss (income) | 13.1 | (28.8 | ) | 1.5 | 0.5 | (1.1 | ) | |||||||||
| Cumulative effect of accounting changes | 0.1 | 169.7 | — | — | — | |||||||||||
| Net loss | $ | (842.7 | ) | $ | (22.2 | ) | $ | (319.8 | ) | $ | (214.2 | ) | $ | (226.5 | ) | |
| Interest expense, net | 239.3 | 181.9 | 409.1 | 260.7 | 459.5 | |||||||||||
| Income tax (benefit) expense | (184.9 | ) | 8.5 | 30.8 | (3.8 | ) | (25.7 | ) | ||||||||
| Depreciation and amortization | 197.5 | 152.7 | 353.4 | 230.5 | 410.3 | |||||||||||
| EBITDA(1) | $ | (590.8 | ) | $ | 320.9 | $ | 473.5 | $ | 273.2 | $ | 617.6 | |||||
51
use of EBITDA as compared to net income, which reflects overall financial performance, including the effects of interest, income taxes, depreciation and amortization.
Nine months ended September 30, 2004 (Historical) compared to nine months ended September 30, 2003 (Historical)
For the nine months ended September 30, 2004, we had a net loss of $226.5 million on revenues of $8,357.7 million compared to a net loss of $214.2 million on revenues of $4,711.1 million for the same period in 2003. The increase of $12.3 million in net loss was the result of the following items:
52
The following table sets forth certain financial information for each of our operating segments:
| |
Historical |
|
||||||||
|---|---|---|---|---|---|---|---|---|---|---|
| |
Nine Months Ended September 30, |
|
||||||||
| |
% Change |
|||||||||
| |
2003 |
2004 |
||||||||
| |
(in millions) |
|
||||||||
| Revenues | ||||||||||
| Polyurethanes | $ | 983.3 | $ | 2,117.4 | 115 | % | ||||
| Advanced Materials | 258.7 | 866.4 | 235 | % | ||||||
| Performance Products | 1,084.4 | 1,399.7 | 29 | % | ||||||
| Pigments | 421.6 | 794.6 | 88 | % | ||||||
| Polymers | 847.7 | 1,019.6 | 20 | % | ||||||
| Base Chemicals | 1,467.0 | 2,755.8 | 88 | % | ||||||
| Eliminations | (351.6 | ) | (595.9 | ) | 69 | % | ||||
| Total | $ | 4,711.1 | $ | 8,357.7 | 77 | % | ||||
| Segment EBITDA | ||||||||||
| Polyurethanes | $ | 99.8 | $ | 270.7 | 171 | % | ||||
| Advanced Materials | 19.5 | 121.3 | 522 | % | ||||||
| Performance Products | 87.7 | 82.9 | (5 | )% | ||||||
| Pigments | 47.6 | (53.6 | ) | NM | ||||||
| Polymers | 53.4 | 45.6 | (15 | )% | ||||||
| Base Chemicals | 24.8 | 204.8 | 726 | % | ||||||
| Corporate and other | (59.6 | ) | (54.1 | ) | (9 | )% | ||||
| Total EBITDA | $ | 273.2 | $ | 617.6 | 126 | % | ||||
NM—Not Meaningful
53
Polyurethanes
For the nine months ended September 30, 2004, Polyurethanes revenues increased by $1.1 billion, or 115.5%, from the same period in 2003. This increase was due primarily to our consolidation of HIH for the entire period in 2004 following the HIH Consolidation Transaction effective May 1, 2003.
For the nine months ended September 30, 2004, Polyurethanes segment EBITDA increased by $170.9 million, or 171%, to $270.7 million from $99.8 million for the same period in 2003 due primarily to our consolidation of HIH for the entire period in 2004 following the HIH Consolidation Transaction effective May 1, 2003.
Advanced Materials
Advanced Materials revenues for the nine months ended September 30, 2004 increased by $607.7 million, or 235%, from the same period in 2003. The increase was attributable to our ownership of Advanced Materials for the entire period in 2004 following the AdMat Transaction on June 30, 2003.
For the nine months ended September 30, 2004, Advanced Materials segment EBITDA increased by $101.8 million to $121.3 million from $19.5 million for the same period of 2003. The increase was attributable to the our ownership of Advanced Materials for the entire period in 2004 following the AdMat Transaction on June 30, 2003.
Performance Products
For the nine months ended September 30, 2004, Performance Products revenues increased by $315.3 million, or 29%, from the same period in 2003. This increase was primarily due to our consolidation of HIH for the entire period in 2004 following the HIH Consolidation Transaction effective May 1, 2003. Excluding the impact of the HIH Consolidation Transaction, for HLLC (excluding HIH), higher revenues resulted primarily from higher average selling prices for all products, offset somewhat by lower sales volumes in certain product lines. Overall, average selling prices increased by 12% in response to higher raw material and energy costs, improved market conditions and the strength of the Australian dollar versus the U.S. dollar. A 3% decrease in sales volumes resulted principally from lower sales volumes of amines and surfactants. The reduction in surfactants sales volumes was due principally to increased competition in the marketplace.
For the nine months ended September 30, 2004, Performance Products segment EBITDA decreased by $4.8 million, or 5%, to $82.9 million from $87.7 million for the same period in 2003 due primarily to our consolidation of HIH for the entire period in 2004 following the HIH Consolidation Transaction effective May 1, 2003. Excluding the impact of the HIH Consolidation Transaction, for HLLC (excluding HIH), decrease in segment EBITDA resulted primarily from higher raw material and energy costs and higher restructuring charges that more than offset higher average selling prices, particularly for ethylene glycol. During the nine months ended September 30, 2004, HLLC recorded restructuring charges of $23.3 million related primarily to the closure of our Guelph, Canada, Queeny, Missouri and Austin, Texas facilities.
Pigments
For the nine months ended September 30, 2004, Pigments revenues increased by $373.0 million, or 88%, from the same period in 2003. This increase was primarily due to our consolidation of HIH for the entire period in 2004 following the HIH Consolidation Transaction effective May 1, 2003.
Pigments segment EBITDA for the nine months ended September 30, 2004 decreased by $101.2 million to a loss of $53.6 million from income of $47.6 million for the same period in 2003 due primarily to our consolidation of HIH for the entire period in 2004 following the HIH Consolidation Transaction effective May 1, 2003. During the nine months ended September 30, 2004 and 2003, our Pigments segment recorded restructuring charges of $111.7 million and $1.1 million, respectively.
54
Polymers
For the nine months ended September 30, 2004, Polymers revenues increased by $171.9 million, or 20%, to $1,019.6 million from $847.7 million the same period in 2003 due mainly to 17% higher average selling prices and 3% higher sales volumes. Higher average selling prices were primarily in response to higher raw material and energy costs while sales volumes increased principally as a result of stronger customer demand.
For the nine months ended September 30, 2004, Polymers segment EBITDA decreased by $7.8 million to $45.6 million from $53.4 million for the same period in 2003. The decrease in segment EBITDA was primarily due to higher raw material and energy costs, and $7.6 million restructuring charge related to the closure of an Australian manufacturing unit and the $8.5 million unfavorable impact of foreign exchange movements, partially offset by higher average selling prices, higher sales volumes and improved production efficiencies.
Base Chemicals
For the nine months ended September 30, 2004, Base Chemicals revenues increased $1.3 billion, or 88%, from the same period in 2003. This increase was primarily due to our consolidation of HIH for the entire period in 2004 following the HIH Consolidation Transaction effective May 1, 2003. Excluding the impact of the HIH Consolidation Transaction, for HLLC (excluding HIH), the increase in revenue is due to 27% higher average selling prices and 5% higher sales volumes. Higher average selling prices were primarily in response to higher raw material and energy costs. Sales volumes increases were driven by increases for ethylene, propylene and cyclohexane of 10%, 14% and 27%, respectively, principally as a result of increased demand.
For the nine months ended September 30, 2004, Base Chemicals segment EBITDA increased by $180.0 million to $204.8 million from $24.8 million for the same period in 2003 due primarily to our consolidation of HIH for the entire period in 2004 following the HIH Consolidation Transaction effective May 1, 2003. Excluding the impact of the HIH Consolidation Transaction, for HLLC (excluding HIH), segment EBITDA increased by $56.2 million from the same period in 2003, primarily as a result of higher average selling prices, increased sales volumes and lower operating expenses relating to our on-going cost reduction initiatives, partially offset higher raw material and energy costs and higher maintenance costs on furnaces in the U.S.
Corporate and Other
Corporate and other items includes unallocated corporate overhead, unallocated foreign exchange gains and losses, loss on the sale of accounts receivable, other non-operating income and expense and minority interest in subsidiaries' loss. For the nine months ended September 30, 2004, EBITDA from corporate and other items increased by $5.5 million to a loss of $54.1 million from loss of $59.6 million for the same period in 2003.
Year Ended December 31, 2003 (Historical) Compared to Year Ended December 31, 2002 (Historical)
For the year ended December 31, 2003, we had a net loss of $319.8 million on revenues of $7,080.9 million, compared to net loss of $22.2 million on revenues of $2,661.0 million for 2002. The decrease of $297.6 million in net income was the result of the following items:
55
56
adoption of SFAS No. 141 "Business Combinations." The adoption of SFAS No. 141 resulted in the increase in the carrying value of our investment in HIH to reflect our proportionate share of the underlying assets. Effective June 30, 1999, Huntsman Specialty, our consolidated subsidiary, transferred its PO business to HIH. The transfer of our PO business was recorded at the net book value of the assets and liabilities transferred. The carrying value of our investment in HIH was less than our proportionate share of the underlying net assets of HIH at December 31, 2001 by approximately $176.1 million. Prior to the adoption of SFAS No. 141, this difference was being accreted to income over a 20-year period.
The following table sets forth certain financial information for each of our operating segments:
| |
Historical |
|
||||||||
|---|---|---|---|---|---|---|---|---|---|---|
| |
Year Ended December 31, |
|
||||||||
| |
% Change |
|||||||||
| |
2002 |
2003 |
||||||||
| |
(in millions) |
|
||||||||
| Revenues | ||||||||||
| Polyurethanes | $ | — | $ | 1,562.4 | NM | |||||
| Advanced Materials | — | 517.8 | NM | |||||||
| Performance Products | 1,028.2 | 1,507.7 | 47 | % | ||||||
| Pigments | — | 678.9 | NM | |||||||
| Polymers | 840.2 | 1,155.5 | 38 | % | ||||||
| Base Chemicals | 996.2 | 2,152.7 | 116 | % | ||||||
| Eliminations | (203.6 | ) | (494.1 | ) | 143 | % | ||||
| Total | $ | 2,661.0 | $ | 7,080.9 | 166 | % | ||||
Segment EBITDA(1) |
||||||||||
| Polyurethanes | $ | — | $ | 176.0 | NM | |||||
| Advanced Materials | — | 38.6 | NM | |||||||
| Performance Products | 164.4 | 125.6 | (24 | )% | ||||||
| Pigments | — | 64.7 | NM | |||||||
| Polymers | 74.7 | 80.8 | 8 | % | ||||||
| Base Chemicals | 44.7 | 40.7 | (9 | )% | ||||||
| Corporate and other | (132.6 | ) | (52.9 | ) | 60 | % | ||||
| Total | $ | 151.2 | $ | 473.5 | 213 | % | ||||
Polyurethanes
For the year ended December 31, 2003, Polyurethanes revenues increased by $1,562.4 million to $1,562.4 million from $0.0 million for 2002. The increase was the result of our consolidation of HIH for the remainder of 2003 following the HIH Consolidation Transaction effective May 1, 2003.
For the year ended December 31, 2003, Polyurethanes segment EBITDA increased by $176.0 million to $176.0 million from $0.0 million for the same period in 2002. The increase was the result of our consolidation of HIH for the remainder of 2003 following the HIH Consolidation Transaction effective May 1, 2003.
57
Advanced Materials
Advanced Materials revenues for the year ended December 31, 2003 increased by $517.8 million to $517.8 million from $0.0 million for 2002. The increase was the result of our ownership of Advanced Materials for the remainder of 2003 following the AdMat Transaction on June 30, 2003.
For the year ended December 31, 2003, Advanced Materials segment EBITDA increased by $38.6 million to $38.6 million from $0.0 million for the same period in 2002. The increase was the result of our ownership of Advanced Materials for the remainder of 2003 following the AdMat Transaction on June 30, 2003.
Performance Products
For the year ended December 31, 2003, Performance Products revenues increased by $479.5 million, or 47%, to $1,507.7 million from $1,028.2 million in 2002. The increase was primarily the result of our consolidation of HIH for the remainder of 2003 following the HIH Consolidation Transaction effective May 1, 2003. Excluding the impact of the HIH Consolidation Transaction, for HLLC (excluding HIH), higher revenues resulted mainly from increases in average selling prices of 1% and sales volumes of 5%.
For the year ended December 31, 2003, Performance Products segment EBITDA fell by $38.8 million to $125.6 million from $164.4 million in 2002 due primarily to our consolidation of HIH for the remainder of 2003 following the HIH Consolidation Transaction effective May 1, 2003. Excluding the impact of the HIH Consolidation Transaction, for HLLC (excluding HIH), lower EBITDA resulted mainly from an increase in raw material costs which was only partially offset by an improvement in average selling prices. Operating expenses were also lower.
Pigments
For the year ended December 31, 2003, Pigments revenues increased by $678.9 million to $678.9 million from $0.0 million for the same period in 2002. The increase was the result of our consolidation of HIH for the remainder of 2003 following the HIH Consolidation Transaction effective May 1, 2003.
For the year ended December 31, 2003, Pigments segment EBITDA increased by $64.7 million to $64.7 million from $0.0 million in 2002. The increase was the result of our consolidation of HIH for the remainder of 2003 following the HIH Consolidation Transaction effective May 1, 2003.
Polymers
For the year ended December 31, 2003, Polymers revenues increased by $315.3 million, or 38%, to $1,155.5 million from $840.2 million in 2002. Overall sales volumes increased by 9% and average selling prices increased by 13%. Polyethylene revenues increased by 22%, as average selling prices increased 19% primarily in response to higher underlying raw material and energy costs, and sales volumes increased 2%. After giving effect to the shutdown of a manufacturing line in Odessa, Texas, polypropylene revenues increased by 11%, as average selling prices increased by 11% primarily in response to higher raw material and energy costs and increased industry operating rates. APAO revenues increased by 29%, as average selling prices increased 5% due to changes in product mix, and sales volumes increased 24% as the result of increased export sales and increased sales into the roofing market. EPS revenues increased by 10%, as average selling prices increased 16% primarily in response to higher underlying raw material and energy costs, while sales volumes decreased 5% due to import competition. Australian styrenics revenues increased by 25%, resulting from an increase in average selling prices of 18%, 17% of which was attributable to the strength of the Australian dollar versus the U.S. dollar, and an increase in sales volumes of 6%.
58
For the year ended December 31, 2003, Polymers segment EBITDA increased by $6.1 million to $80.8 million from $74.7 million in 2002. The increase in EBITDA is primarily the result of increases in average selling prices, partially offset by higher raw material costs.
Base Chemicals
For the year ended December 31, 2003, Base Chemicals revenues increased by $1,156.5 million, or 116%, to $2,152.7 million from $996.2 million in 2002. The increase was primarily the result of our consolidation of HIH for the remainder of 2003 following the HIH Consolidation Transaction effective May 1, 2003. Excluding the impact of the HIH Consolidation Transaction, for HLLC (excluding HIH), higher revenues resulted mainly from increases in average selling prices of 28%, partially offset by a decrease in overall sales volumes of 3%.
For the year ended December 31, 2003, Base Chemicals segment EBITDA decreased by $4.0 million to $40.7 million from $44.7 million in 2002. Segment EBITDA increased as a result of our consolidation of HIH for the remainder of 2003 following the HIH Consolidation Transaction effective May 1, 2003. Excluding the impact of the HIH Consolidation Transaction, for HLLC (excluding HIH), EBITDA decreased primarily as a result of higher raw material and energy costs, which were partially offset by increases in average selling prices, and higher fixed production expenses due to costs related to a planned maintenance shutdown as well as other personnel and maintenance costs.
Corporate and Other
Corporate and other includes corporate overhead, loss on the accounts receivable securitization program, minority interest in earnings of consolidated subsidiaries and unallocated foreign exchange gains and losses. For the year ended December 31, 2003, EBITDA from corporate and other items increased by $79.7 million to a loss of $52.9 million from a loss of $132.6 million in 2002. This increase was primarily due to increased unallocated foreign exchange gains resulting from the HIH Consolidation Transaction on May 1, 2003 and the AdMat Transaction on June 30, 2003.
Year ended December 31, 2002 (Historical) compared to year ended December 31, 2001 (Historical)
For the year ended December 31, 2002, we had a net loss of $22.2 million on revenues of $2,661.0 million, compared to a net loss of $842.7 million on revenues of $2,757.4 million for 2001. The decrease of $820.5 million in net loss was the result of the following items:
59
more rapidly than raw material prices, but the decline was partially offset by lower fixed costs due to our cost reduction program. In addition, depreciation expense in the 2002 period was lower due to a reduction in depreciable basis as a result of our cost rationalization program and the impairment charges taken in 2001.
Cumulative effect of accounting changes resulted in an increase to net income of $169.7 million for the year ended December 31, 2002. This increase was due to the effects of the initial adoption of SFAS No. 141 "Business Combinations." The adoption of SFAS No. 141 resulted in the increase in the carrying value of our investment in HIH to reflect our proportionate share of the underlying assets. Effective June 30, 1999, Huntsman Specialty, our consolidated subsidiary, transferred its PO business to HIH. The transfer of our PO business was recorded at the net book value of the assets and liabilities transferred. The carrying value of our investment in HIH was less than our proportionate share of the underlying net assets of HIH at December 31, 2001 by approximately $176.1 million. Prior to the adoption of SFAS No. 141, this difference was being accreted to income over a 20-year period.
60
The following table sets forth certain financial information for each of our operating segments:
| |
Historical |
||||||||
|---|---|---|---|---|---|---|---|---|---|
| |
Year Ended December 31, |
||||||||
| |
2001 |
2002 |
|||||||
| |
(in millions) |
||||||||
| Net Sales: | |||||||||
| Performance Products | $ | 1,077.6 | $ | 1,028.2 | |||||
| Polymers | 816.4 | 840.2 | |||||||
| Base Chemicals | 1,051.3 | 996.2 | |||||||
| Eliminations | (187.9 | ) | (203.6 | ) | |||||
| $ | 2,757.4 | $ | 2,661.0 | ||||||
Segment EBITDA: |
|||||||||
| Performance Products | $ | 127.7 | $ | 164.4 | |||||
| Polymers | (550.6 | ) | 74.7 | ||||||
| Base Chemicals | 63.1 | 44.7 | |||||||
| Corporate and other | (231.1 | ) | (132.6 | ) | |||||
| Total | $ | (590.9 | ) | $ | 151.2 | ||||
Performance Products
For the year ended December 31, 2002, Performance Products revenues decreased by $49.4 million to $1,028.2 million from $1,077.6 million in 2001. This decrease was primarily the result of lower revenues in our LAB and amines operations. LAB product revenues decreased by 20% due to lower sales volumes of 12%, coupled with pricing declines of 9%. These decreases were the result of product substitution into lower priced alternatives. Amines chemicals revenues decreased by 4% due to an 8% decrease in sales volumes partially offset by a 4% increase in average selling prices. The increase in average selling prices was due primarily to proactive product and customer mix rationalization efforts. Maleic anhydride revenues increased by 9% as compared to the same period in 2001. Maleic anhydride average selling prices increased by 7% due to increased sales of higher priced maleic catalyst.
For the year ended December 31, 2002, Performance Products segment EBITDA increased by $36.7 million to $164.4 million from $127.7 million for 2001. This increase resulted from lower ethylene-based feedstock costs, higher sales volumes and fixed cost savings resulting from our cost reduction program. The $36.7 million increase in segment EBITDA is net of $33.6 million received in 2001 from business interruption insurance proceeds relating to a loss sustained in connection with the outage of our EO unit in December of 2000.
Polymers
For the year ended December 31, 2002, Polymers revenues increased by $23.8 million to $840.2 million from $816.4 million in 2001. The major factor contributing to the increase in Polymers revenues was the inclusion of the fourth quarter results of our Australian styrenics operations in 2002, which resulted in an increase of $35.7 million of revenues. Prior to the fourth quarter 2002, these results were reported under the equity method of accounting. Offsetting this increase, we had lower revenues due to the permanent closure of our Odessa, Texas styrene plant, which resulted in a reduction in revenues of $40.8 million. Changes in U.S. revenues are as follows: Olefins revenues decreased by 19%, with sales volumes down 12% due primarily to lower propane sales resulting from a change in feedstock mix, while average selling prices decreased by 7% due to declining underlying raw material and energy prices. Polyethylene revenues increased by 2%, with sales volumes up by 10% on
61
stronger demand. Increased polyethylene sales volumes were partially offset by a decrease in average selling prices of 7%. Polypropylene revenues increased by 10%, with sales volumes up 7% due to a tighter supply/demand balance and concentrated buying associated with the discontinuation of certain polypropylene products from our Odessa facility. EPS revenue increased 5%, with sales volumes up by 10% due to a tighter supply/demand balance, partially offset by a decrease in average selling prices of 3%.
For the year ended December 31, 2002, Polymers segment EBITDA increased by $625.3 million to $74.7 million from a segment EBITDA loss of $550.6 million for 2001. The increase in segment EBITDA was primarily due to a $527.0 million restructuring and plant closing charge recorded in the 2001 period and improved market fundamentals in 2002 allowing some margin expansion from earlier trough conditions, coupled with the benefits of our fixed cost reductions and elimination of certain non-competitive assets.
Base Chemicals
For the year ended December 31, 2002, Base Chemicals revenues decreased $55.1 million to $996.2 million from $1,051.3 million in 2001. Olefins revenues decreased by 10%, partly due to sales volume decreases of 1%, but primarily because average selling prices decreased by 10% in line with loosening operating rates in the industry and generally declining raw material costs. Benzene revenues decreased by 6% as compared to 2001. Benzene sales volumes decreased by 15% due to a lack of available feedstock. Benzene average selling prices increased by 11%. Cyclohexane revenues increased by 45% as compared to 2001. Cyclohexane sales volumes increased by 37% due to tightening market conditions resulting from steady demand. Cyclohexane average selling prices increased by 7%. Butadiene sales volumes increased by 4% due to increased feedstock availability, while average selling prices decreased by 5%. MTBE sales volumes increased by 5% as a result of tightening market conditions due to steady demand, while average selling prices decreased by 7%.
For the year ended December 31, 2002, Base Chemicals segment EBITDA decreased $18.4 million to $44.7 million from $63.1 million for 2001. The decrease was primarily due to declines in average selling prices outpacing decreases in raw material prices for most Base Chemicals products, partially offset by cost savings resulting from our cost reduction program and increased demand for cyclohexane and MTBE. In the fourth quarter of 2002, raw material prices increased significantly as a result of the crude oil shortage caused by the strike in Venezuela and the uncertainty regarding war with Iraq. In addition, higher natural gas prices were experienced in the fourth quarter of 2002 due to the unusually cold start to the winter heating season.
Corporate and Other
Corporate and other includes corporate overhead, gain (loss) on the accounts receivable securitization program, minority interest in earnings of consolidated subsidiaries and unallocated foreign exchange gains and losses. EBITDA from corporate and other for the year ended December 31, 2002 increased by $98.5 million to an EBITDA loss of $132.6 million from an EBITDA loss of $231.1 million for 2001. The increase was due to a $61.5 million restructuring charge recorded in the 2001 period, a $41.1 million change in minority interest, a $5.6 million increase in loss on extinguishment of long-term debt, a decrease in equity losses of $54.6 million due to reduced losses of HIH, and reductions in corporate overhead expenses of $22.0 million resulting from our cost reduction program. Additionally, we had $8.6 million in additional write-offs of accounts receivable balances in 2001 as compared with 2002, which resulted in lower corporate and other costs in 2002.
62
Liquidity and Capital Resources
Nine months ended September 30, 2004 (Historical) compared to nine months ended September 30, 2003 (Historical)
Net cash provided (used) by operating activities for the nine months ended September 30, 2004 and September 30, 2003 was $55.9 million and $(36.6) million, respectively. The variance is largely attributable to the HIH Consolidation Transaction and the AdMat Transaction that occurred in the 2003 period. The net loss in the 2004 period was $12.3 million higher than in the 2003 period. Offsetting this increased loss were net favorable adjustments to reconcile net loss to net cash used in operating activities, including higher depreciation and amortization by $179.8 million in the 2004 period, higher non cash restructuring charges in the 2004 period by $96.7 million, and higher non cash interest expense by $73.5 million, partially offset by a net increase in net operating assets and liabilities of $157.0 in the 2004 period versus the 2003 period. In addition, the adjustments for deferred income taxes and equity in (gain) loss of investment in unconsolidated affiliates decreased by $38.4 million and $41.2 million, respectively.
Net cash used in investing activities for the nine months ended September 30, 2004 and September 30, 2003 was $153.1 million and $843.0 million, respectively. The variance is largely attributable to the HIH Consolidation Transaction and the AdMat Transaction that occurred in 2003. The investing activities for the nine months ended September 30, 2003 include the acquisition of minority interests in connection with the HIH Consolidation Transaction and the cash paid in connection with the AdMat Transaction. Capital expenditures in the 2004 period were $15.1 million higher in the 2004 period than in the 2003 period, largely attributable to the non-comparative nature of the 2003 results.
Net cash provided by financing activities for the nine months ended September 30, 2004 and September 30, 2003 was $128.2 million and $947.7 million, respectively. The variance is largely attributable to the HIH Consolidation Transaction and the AdMat Transaction that occurred in 2003. The financing activities for the nine months ended September 30, 2003 include (i) the issuance of the HMP Discount Notes and the HMP Warrants resulting in net cash proceeds of $415 million used to purchase the minority interests in HIH and to complete the purchase of senior subordinated discount notes of HIH, (ii) the issuance of $380 million in aggregate principal amount of the HLLC Senior Secured Notes, the net proceeds of which were used to repay indebtedness under the HLLC senior credit facilities and (iii) the issuance of $350 million in aggregate principal amount of the AdMat Senior Secured Notes (as defined below), the proceeds of which were used to acquire Advanced Materials in the AdMat Transaction. The financing activities for the nine months ended September 30, 2004, include (i) the refinancing of the HI credit facilities, (ii) the issuance of the HLLC Senior Notes in the aggregate principal amount of $400 million, the net proceeds of which were used to repay amounts outstanding under the Original HLLC Credit Facilities and the HCCA Facilities (each as defined below), (iii) the refinancing of the Australian senior credit facilities; and (iv) the repayment, in full, of $36.8 million on the senior unsecured notes of Huntsman Polymers Corporation ("Huntsman Polymers") with borrowings under the HLLC Credit Facilities.
Year ended December 31, 2003 (Historical) compared to year ended December 31, 2002 (Historical)
Net cash provided by operating activities for the years ended December 31, 2003 and December 31, 2002 was $225.4 million and $88.7 million, respectively. The variance is largely attributable to the HIH Consolidation Transaction and the AdMat Transaction that occurred in the 2003 period. The net loss in the 2003 period was $297.6 million higher than in the 2002 period. Offsetting this increased loss were net favorable adjustments to reconcile net loss to net cash provided by operating activities, including higher depreciation and amortization by $200.7 million in the 2003 period, higher non-cash interest expense by $104.2 million in the 2003 period and a net decrease in net
63
operating assets and liabilities of $30.5 million in the 2003 period versus the 2002 period. In addition, there was a negative adjustment to reconcile net loss to net cash provided by operating activities in the 2002 period of $169.7 million for cumulative effect of accounting change, and a negative adjustment of $58.3 million in the 2003 period for unrealized gains and losses on foreign currency transactions.
Net cash used in investing activities for the years ended December 31, 2003 and December 31, 2002 was $907.1 million and $77.7 million, respectively. The increase was largely attributable to the acquisition of minority interests in connection with the HIH Consolidation Transaction as well as the cash paid in connection with the AdMat Transaction. In addition, capital expenditures were higher in 2003 primarily due to the incremental capital expenditures related to the HIH and AdMat businesses.
Net cash provided by financing activities for the year ended December 31, 2003 was $786.7 million. For the year ended December 31, 2002, net cash used by financing activities was $93.0 million. The variance is largely attributable to the impact of the HIH Consolidation Transaction and the AdMat Transaction. The financing activities for the year ended December 31, 2003 include (i) the issuance of the HMP Discount Notes and the HMP Warrants resulting in net cash proceeds of $415 million, which were used to purchase the minority interests in HIH and complete the purchase of the HIH Senior Subordinated Discount Notes, (ii) the issuance of $455.4 million in aggregate principal amount of the HLLC Senior Secured Notes, the net proceeds of which were used primarily to repay indebtedness under the Original HLLC Credit Facilities (as defined below), (iii) the issuance of $350 million in aggregate principal amount of AdMat Senior Secured Notes (as defined below), the proceeds of which were used to acquire Advanced Materials and (iv) the issuance by HI of $205 million of additional term loans, the net proceeds of which were used to repay existing indebtedness.
Debt and Liquidity
Secured Credit Facilities
As of September 30, 2004, HLLC's credit facilities consisted of a revolving facility of up to $275 million maturing on June 30, 2006 and a term loan A of $606.3 million and a term loan B of $96.1 million maturing in March 2007 (together, the "Original HLLC Credit Facilities").
On October 14, 2004, HLLC completed a $1.065 billion refinancing of the Original HLLC Credit Facilities. HLLC's credit facilities (as refinanced, the "HLLC Credit Facilities") now consist of a $350 million revolving facility due 2009 (the "HLLC Revolving Facility"), with an outstanding balance on October 14, 2004 of $105 million, and a $715 million term loan B facility due 2010 (the "HLLC Term Facility"). The HLLC Revolving Facility is secured by a first priority lien on substantially all of the current and intangible assets of HLLC and its restricted domestic subsidiaries and by a second priority lien on substantially all of the property, plant and equipment of HLLC and its restricted domestic subsidiaries and HLLC's equity interest in HIH. The HLLC Term Facility is secured by a first priority lien on substantially all of the property, plant and equipment of HLLC and its restricted domestic subsidiaries and HLLC's equity interest in HIH and by a second priority lien on substantially all of the current and intangible assets of HLLC and its restricted domestic subsidiaries. The proceeds of the refinancing were used to repay in full HLLC's outstanding borrowings under the Original HLLC Credit Facilities.
Borrowings under the new HLLC Revolving Facility are limited by a borrowing base consisting of eligible accounts receivable and inventory. The new HLLC Term Facility has scheduled annual amortization payments of approximately $7 million, with the remaining balance due at maturity. The HLLC Revolving Facility and HLLC Term Facility bear interest at LIBOR plus 2.25% per year and LIBOR plus 3.50% per year, respectively. In addition, the terms of the HLLC Term Facility provide for a reduction in interest rate margin to LIBOR plus 3.0% per year upon completion of this offering and the use of the net proceeds as described in "Use of Proceeds." The revolving credit and term loan agreements contain customary financial covenants, covenants relating to the incurrence of debt and the
64
purchase and sale of assets, limitations on investments and affiliate transactions, change in control provisions, events of default and acceleration provisions.
On July 13, 2004, HI completed an amendment and restatement of its senior secured credit facility (the "HI Credit Facilities"). Pursuant to the amendment and restatement, the revolving loan facility (the "HI Revolving Facility") was reduced from $400 million to $375 million and its maturity was extended from June 2006 to September 2008. The HI Revolving Facility includes a $50 million multicurrency revolving loan facility available in euros, GBP Sterling and U.S. dollars. In addition, HI's then-existing term loans B and C, totaling $1,240.2 million, were repaid and replaced with the new term facility (the "HI Term Facility") consisting of a $1,305 million term portion and a €50 million (approximately $61.6 million) term portion. The additional proceeds from the HI Term Facility of approximately $126.6 million were applied to repay the $82.4 million of outstanding borrowings as of July 13, 2004 on the HI Revolving Facility and for general corporate purposes and to provide a portion of the funds for the construction of a polyethylene production facility at our Wilton, U.K. facility. The HI Credit Facilities are secured by a first priority lien on substantially all the assets of HIH, HI's domestic subsidiaries, and certain of HI's foreign subsidiaries.
Pursuant to the July 13, 2004 amendment and restatement of the HI Credit Facilities, interest rates on the HI Revolving Facility and the HI Term Facility decreased from a LIBOR spread of 3.50% and 4.125% to 3.25% and 3.25%, respectively. In addition, scheduled amortization of the HI Term Facility is approximately $13.7 million per year, commencing June 30, 2005, with the remaining unpaid balance due at maturity on December 31, 2010. Maturity will be accelerated to December 31, 2008 if HI has not refinanced all of the outstanding HI Senior Notes and HI Senior Subordinated Notes (as defined below) on or before December 31, 2008 on terms satisfactory to the administrative agent under the HI Credit Facilities.
The HI Credit Facilities contain customary financial covenants, covenants relating to the incurrence of debt and the purchase and sale of assets, limitations on investments and affiliate transactions, change in control provisions, events of default and acceleration provisions. The amendment and restatement of the HI Credit Facilities amended certain financial covenants. These amendments, among other things, included changes to the maximum leverage ratio, the minimum interest coverage ratio, and provided for an increase in the permitted amount of annual consolidated capital expenditures from $250 million to $300 million, with a provision for carryover to subsequent years. In addition, the mandatory prepayment level in connection with HI's accounts receivable securitization program was increased from $310 million to $325 million. For more information, see "—Liquidity and Capital Resources—Off-Balance Sheet Arrangements" below.
On June 30, 2003, Advanced Materials entered into a $60 million revolving credit facility (the "AdMat Revolving Credit Facility") with a maturity of June 30, 2007. As of September 30, 2004, Advanced Materials had no outstanding revolving borrowings under the AdMat Revolving Credit Facility and approximately $10.9 million of outstanding letters of credit issued under such facility. The AdMat Revolving Credit Facility is secured by a first priority lien on substantially all the assets of Advanced Materials' domestic subsidiaries and certain of Advanced Materials' foreign subsidiaries.
Notes
On September 30, 2003, HLLC sold $380 million aggregate principal amount of HLLC Senior Secured Notes due 2010 at an issue price of 98.8%. On December 3, 2003, HLLC sold an additional $75.4 million aggregate principal amount of HLLC Senior Secured Notes at an issue price of 99.5%. Interest on the HLLC Senior Secured Notes is payable semi-annually in April and October of each year. Net proceeds from the sale of these notes were used to repay amounts outstanding under the Original HLLC Credit Facilities and certain other indebtedness. The HLLC Senior Secured Notes rank pari passu with the HLLC Term Facility. The HLLC Senior Secured Notes are redeemable after
65
October 15, 2007 at 105.813% of the principal amount thereof, declining ratably to par on and after October 15, 2009. At any time prior to October 15, 2006, HLLC may redeem up to 35% of the aggregate principal amount of the HLLC Senior Secured Notes at a redemption price of 111.625% of the principal amount thereof, plus accrued and unpaid interest to the redemption date with the net cash proceeds of a qualified equity offering. We intend to use a portion of the net proceeds of this offering to redeem $159.4 million in aggregate principal amount of these notes.
On June 22, 2004, HLLC sold $400 million of HLLC Senior Notes, consisting of $300 million of senior unsecured notes, which bear interest at 11.5% and mature on July 15, 2012 (the "HLLC Unsecured Fixed Rate Notes"), and $100 million of senior unsecured floating rate notes, which bear interest at a rate equal to LIBOR plus 7.25% and mature on July 15, 2011 (the "HLLC Unsecured Floating Rate Notes"). Interest on the HLLC Unsecured Fixed Rate Notes is payable semi-annually in January and July of each year, and interest on the Unsecured Floating Rate Notes is payable quarterly in January, April, July and October of each year. As of September 30, 2004, the interest rate on the HLLC Unsecured Floating Rate Notes was 8.8%. The net proceeds from the offering were used to repay amounts outstanding under the Original HLLC Credit Facilities and the HCCA Facilities (as defined below). The HLLC Senior Notes are unsecured obligations of HLLC. The HLLC Unsecured Fixed Rate Notes are redeemable after July 15, 2008 at 105.75% of the principal amount thereof, declining ratably to par on and after July 15, 2010. The HLLC Unsecured Floating Rate Notes are redeemable after July 15, 2006 at 104.0% of the principal amount thereof, declining ratably to par on and after July 15, 2008. At any time prior to July 15, 2007, HLLC may redeem up to 40% of the aggregate principal amount of the HLLC Unsecured Fixed Rate Notes, at a redemption price of 111.5% of the principal amount thereof, plus accrued and unpaid interest to the redemption date with the net cash proceeds of a qualified equity offering. At any time prior to July 15, 2006, HLLC may also redeem up to 40% of the aggregate principal amount of the HLLC Unsecured Floating Rate Notes at a redemption price of 100% plus LIBOR plus 7.25% of the principal amount thereof plus accrued and unpaid interest to the redemption date with the net cash proceeds of a qualified public offering.
Under the terms of a registration rights agreement among HLLC, the guarantors of the HLLC Senior Notes and the initial purchasers of the HLLC Senior Notes, HLLC was required to file a registration statement relating to an exchange offer for the HLLC Senior Notes on or before November 19, 2004 (the "Filing Date"). Under the terms of the registration rights agreement, because HLLC did not file the registration statement by the Filing Date, it is required to pay additional interest on the HLLC Senior Notes at a rate of 0.25% per year for the first 90 day period following the Filing Date. HLLC expects to file the registration statement during the fourth quarter of 2004.
In March 2002, HI sold $300 million aggregate principal amount of HI Senior Notes due 2009. On April 11, 2003, HI sold an additional $150 million aggregate principal amount of the HI Senior Notes at an issue price of 105.25%. Net proceeds from the sale of these notes were used to repay amounts outstanding under the HI Credit Facilities. The HI Senior Notes are unsecured obligations of HI. Interest on the HI Senior Notes is payable semi-annually in March and September of each year. The HI Senior Notes are redeemable after March 1, 2006 at 104.937% of the principal amount thereof, declining ratably to par on and after March 1, 2008.
HI also has outstanding $600 million and €450 million ($559.6 million as of September 30, 2004, which includes $5.2 million of unamortized premium) of 101/8% senior subordinated notes due 2009 (the "HI Senior Subordinated Notes"). The HI Senior Subordinated Notes are unsecured. Interest on the HI Senior Subordinated Notes is payable semi-annually in January and July of each year. The HI Senior Subordinated Notes became redeemable on July 1, 2004 at 105.063% of the principal amount thereof, which declines ratably to par on and after July 1, 2007.
On June 30, 2003, in connection with the AdMat Transaction, Advanced Materials issued $350 million aggregate principal amount of its senior secured notes (the "AdMat Senior Secured
66
Notes"), consisting of 11% fixed rate notes with an aggregate principal amount of $250 million due 2010 (the "AdMat Fixed Rate Notes") and floating rate notes with an aggregate principal amount of $100 million due 2008, which bear interest at a rate equal to LIBOR plus 8.00% (but not lower than 10.00%) (the "AdMat Floating Rate Notes"). The AdMat Floating Rate Notes were issued with an original issue discount of 2%, or for $98 million. As of September 30, 2004, the interest rate on the Floating Rate Notes was 10.0%. Interest on the AdMat Senior Secured Notes is payable semi-annually in January and July of each year. The AdMat Senior Secured Notes are secured by a second lien on substantially all of the assets that secure the AdMat Revolving Credit Facility and are guaranteed on a senior basis by the AdMat Guarantors. The AdMat Fixed Rate Notes are redeemable on or after July 15, 2007 at 105.5% of the principal amount thereof, declining ratably to par on or after July 15, 2009. The AdMat Floating Rate Notes are redeemable on or after July 15, 2005 at 105.0% of the principal amount thereof, declining ratably to par on or after July 15, 2007. At any time prior to July 15, 2006, Advanced Materials may redeem up to 35% of the aggregate principal amount of the AdMat Fixed Rate Notes at 111% of the principal amount thereof, plus accrued and unpaid interest, with the net cash proceeds of a qualified equity offering. At any time prior to July 15, 2005, Advanced Materials may redeem up to 35% of the aggregate principal amount of the AdMat Floating Rate Notes at 111% of the principal amount thereof, plus accrued and unpaid interest, with the net cash proceeds of a qualified equity offering.
Under the terms of a registration rights agreement among Advanced Materials, the AdMat Guarantors and the initial purchasers of the AdMat Senior Secured Notes, Advanced Materials was required to cause a registration statement relating to an exchange offer for the AdMat Senior Secured Notes to become effective on or before July 9, 2004 (the "Effectiveness Date") and to complete the exchange offer on or before August 23, 2004 (the "Completion Date"). Due to a delay in the completion of predecessor period audited financial statements for certain subsidiaries of Advanced Materials, the registration statement did not become effective by the Effectiveness Date and the exchange offer was not completed by the Completion Date. Accordingly, under the registration rights agreement, Advanced Materials was required to pay additional interest on the AdMat Senior Secured Notes at a rate of 0.25% per year for the first 90-day period following the Effectiveness Date, and this rate increased by 0.25% per year for the immediately following 90-day period. Once the registration statement becomes effective, Advanced Materials will be required to continue paying additional interest at the current rate until the exchange offer is completed. Advanced Materials expects to file an amended registration statement during the fourth quarter of 2004 and expects that the exchange offer will be completed approximately 30 days after the registration statement becomes effective.
On September 30, 2004, HLLC had outstanding $44.2 million of 9.5% fixed rate and $15.1 million of variable rate senior subordinated notes due 2007 (collectively the "HLLC Subordinated Notes"). The HLLC Subordinated Notes are unsecured subordinated obligations of HLLC. Interest is payable on the HLLC Subordinated Notes semi-annually on January 1 and July 1 of each year at an annual rate of 9.5% on the fixed rate notes and LIBOR plus 3.25% on the floating rate notes. The HLLC Subordinated Notes are redeemable at the option of HLLC after July 1, 2002 at a price declining from 104.75% to 100% of par value as of July 1, 2005.
Discount Notes
On May 9, 2003, in connection with the HIH Consolidation Transaction, HMP issued HMP Discount Notes with an accreted value of $423.5 million and the HMP Warrants providing for the purchase of approximately 12% of HMP's common stock. Cash proceeds from the offering were $415 million. We have recorded the HMP Discount Notes at an original carrying value of $285.0 million, and we have recorded the HMP Warrants at an original carrying value of $130.0 million. As of September 30, 2004, the HMP Discount Notes had a book value of $389.5 million and an
67
accreted value of $518.2 million. We intend to use the proceeds of this offering to redeem the HMP Discount Notes in full.
On June 30, 1999, HIH issued the HIH Senior Discount Notes with initial stated value of $242.7 million. The HIH Senior Discount Notes are due December 31, 2009. Interest on the HIH Senior Discount Notes accrues at 133/8% per year and is paid in kind. As of September 30, 2004, the accreted value of the HIH Senior Discount Notes was $479.2 million. We intend to use the proceeds of this offering to redeem the HIH Senior Discount Notes in full.
On July 2, 2001, HLLC entered into the HLLC Affiliate Note payable with Horizon Ventures LLC, an affiliated entity controlled by Jon M. Huntsman, in the amount of $25.0 million. The HLLC Affiliate Note is due and payable on the earlier of: (1) July 2, 2011, or (2) the date of repayment in full in cash of all indebtedness under the HLLC Credit Facilities and the HLLC Subordinated Notes. Interest is not paid in cash but is accrued at a designated rate of 15% per year, compounded annually. As of September 30, 2004, accrued interest added to the principal balance was $14.5 million. We intend to use the proceeds from this offering to repay this note in full.
Other Debt
Certain of our Australian subsidiaries maintain credit facilities. Huntsman Australia Holdings Corporation ("HAHC") and certain of its subsidiaries hold our Australian surfactants assets. On August 31, 2004, Huntsman Corporation Australia Pty Ltd ("HCA"), an indirect subsidiary of HAHC, refinanced the secured credit facility of HAHC with a A$30.0 million ($21.4 million) revolving credit line supported by a borrowing base of eligible accounts receivable and inventory, and a A$44.0 million ($31.4 million) term facility (the "HCA Facilities"). As of September 30, 2004, borrowings under the HCA Facility totaled A$58.6 million ($41.9 million).
Huntsman Chemical Company Australia Pty Ltd ("HCCA") and certain Australian affiliates hold our Australian styrenics assets. On June 24, 2004, HLLC used $25 million of proceeds from the offering of the HLLC Senior Notes to repay a portion of the secured credit facilities of HCCA (the "HCCA Facilities"), including repaying in full the working capital facility and reducing the term facility to $14.4 million (A$20.9 million). On August 31, 2004, HCCA refinanced the HCCA Facilities with a A$30.0 million ($21.4 million) revolving credit line supported by a borrowing base of eligible accounts receivable (the "New HCCA Facility"). As of September 30, 2004, borrowings under the New HCCA Facility totaled A$17.2 million ($12.3 million).
The HCA Facilities and the New HCCA Facility are secured by a lien on substantially all their respective assets, bear interest at a rate of 2.9% above the Australian base rate and mature in August 2007. As of September 30, 2004, the interest rate on the HCA Facilities and the New HCCA Facility was 8.38%.
On March 21, 1997, Huntsman Specialty executed a 7.0% subordinated note in the amount of $75 million, payable to BASF Capital Corporation and maturing on April 30, 2008. Under the terms of the note, accrued interest from inception through April 30, 2002 was not paid in cash and was added to the note for a total principal amount of $106.6 million. Interest that accrued after April 30, 2002 is payable quarterly in cash, beginning on July 30, 2002. For financial reporting purposes, the note was initially recorded at its estimated fair value of $58.2 million, based on prevailing market rates at that time. As of September 30, 2004 and December 31, 2003, the unamortized discount on the note is $5.8 million and $6.9 million, respectively.
HI maintains a $25 million multicurrency overdraft facility for its European subsidiaries (the "HI European Overdraft Facility"), all of which was available as of September 30, 2004. As of December 31, 2003, HI had approximately $7.5 million outstanding under the HI European Overdraft Facility included within trade payables. The HI European Overdraft Facility is used for daily working capital needs.
68
As of September 30, 2004, HLLC had $24.3 million outstanding in short term notes payable for financing a portion of our insurance premiums. Such notes have monthly scheduled amortization payments through April 1, 2005, bear interest at rates ranging from 3.65% to 4.0%, and are secured by unearned insurance premiums.
Included within other debt is debt associated with one of HI's Chinese MDI joint ventures. In January 2003, HI entered into a joint venture agreement with Shanghai Chlor-Alkali Chemical Company, Ltd. to build MDI production facilities near Shanghai, China. HI owns 70% of the joint venture, Huntsman Polyurethanes Shanghai Ltd. (the "Chinese Splitting JV"), which is a consolidated affiliate. On September 19, 2003, the Chinese Splitting JV obtained secured financing for the construction of the production facilities consisting of various committed loans in the aggregate amount of approximately $119 million in U.S. dollar equivalents. As of September 30, 2004, there were $7.0 million outstanding in U.S. dollar borrowings and 10.0 million in RMB borrowings ($1.2 million) under these facilities. The interest rate on these facilities is LIBOR plus 0.48% for U.S. dollar borrowings and 90% of the Peoples Bank of China rate for RMB borrowings. As of September 30, 2004, the interest rates for U.S. dollar borrowings and RMB borrowings were approximately 2.6% and 5.2%, respectively. The loans are secured by substantially all the assets of the Chinese Splitting JV and will be repaid in 16 semi-annual installments, beginning no later than June 30, 2007. The financing will be non-recourse to HI, but is guaranteed during the construction phase by us. We unconditionally guarantee 70% of any amounts due and unpaid by the Chinese Splitting JV under the loans described above. Our guarantee remains in effect until the Chinese Splitting JV has commenced production of at least 70% of capacity for at least 30 days and achieved a debt service coverage ratio of at least 1.5:1.
Receivables Securitization
HI has an accounts receivable securitization program, under which interests in certain of its trade receivables are transferred to a qualified off-balance sheet entity. As of September 30, 2004, the qualified off-balance sheet entity had issued $197 million in medium term notes and $37 million in commercial paper. See "—Off-Balance Sheet Arrangements."
Short-Term and Long-Term Liquidity; Compliance with Covenants
We depend upon our credit facilities and other debt instruments to provide liquidity for our operations and working capital needs. As of September 30, 2004, we had approximately $923 million of combined cash and combined unused borrowing capacity, consisting of approximately $185 million attributable to HLLC, approximately $629 million attributable to HI and approximately $109 million attributable to Advanced Materials.
We believe our current liquidity, together with funds generated by our businesses, is sufficient to meet the short-term and long-term needs of our businesses, including funding operations, making capital expenditures and servicing our debt obligations in the ordinary course. We believe that we are currently in compliance with the covenants contained in the agreements governing our senior secured credit facilities and the indentures governing our notes.
Certain Credit Support Issues
Our subsidiaries HIH and HI have not guaranteed or provided any other credit support to HLLC's obligations under the HLLC Credit Facilities or its outstanding notes, and HLLC has not guaranteed or provided any other credit support to the obligations of HI under the HI Credit Facilities or to the obligations of HI and HIH under their outstanding notes. Because of restrictions contained in the financing arrangements of HIH and HI, these subsidiaries are presently unable to make any loans or "restricted payments" to HLLC, including dividends, distributions or other payments in respect of equity interests or payments to purchase, redeem or otherwise acquire or retire for value any of their equity interests, subject to exceptions contained in such financing arrangements. Events of default under the HI Credit Facilities, or under the outstanding notes of HIH and HI or the exercise of any
69
remedy by the lenders thereunder will not cause any cross-defaults or cross-accelerations under the HLLC Credit Facilities or HLLC's outstanding notes. Additionally, any events of default under the HLLC Credit Facilities or HLLC's outstanding notes or the exercise of any remedy by the lenders thereunder will not cause any cross-defaults or cross-accelerations under the outstanding notes of HIH or HI or the HI Credit Facilities, except insofar as foreclosure on certain subsidiary equity interests pledged to secure our obligations under the HLLC Credit Facilities or the HLLC 2003 Secured Notes, would constitute a "change of control" and an event of default under the HI Credit Facilities and would give rise to certain put rights in favor of the holders of outstanding notes of HI or HIH. Advanced Materials is also financed separately from HLLC and HIH, HLLC and HIH's debt is non-recourse to Advanced Materials and Advanced Materials has no contractual obligation to fund HLLC or HIH's operations and vice versa.
Contractual Obligations and Commercial Commitments
Our obligations under long-term debt, lease agreements and other contractual commitments as of December 31, 2003 are summarized below:
| |
|
2004 |
2005-2007 |
2008-2009 |
After 2009 |
Total |
||||||||||||
|---|---|---|---|---|---|---|---|---|---|---|---|---|---|---|---|---|---|---|
| |
|
(in millions) |
||||||||||||||||
| Long-term debt(1) | $ | 135.1 | $ | 1,816.8 | $ | 3,209.1 | $ | 732.6 | $ | 5,893.6 | ||||||||
| Capital lease obligations | 2.1 | 4.6 | 4.9 | 4.9 | 16.5 | |||||||||||||
| Operating leases | 44.4 | 95.2 | 40.8 | 92.0 | 272.4 | |||||||||||||
| Purchase commitments(2) | 1,069.4 | 1,956.6 | 300.4 | 356.4 | 3,682.8 | |||||||||||||
| Total(1) | $ | 1,251.0 | $ | 3,873.2 | $ | 3,555.2 | $ | 1,185.9 | $ | 9,865.3 | ||||||||
| |
2005-2007 |
2008-2009 |
After 2009 |
Total |
|||||||||
|---|---|---|---|---|---|---|---|---|---|---|---|---|---|
| |
(in millions) |
||||||||||||
| Long-term debt and capital lease obligations | $ | 227.1 | $ | 1,872.4 | $ | 3,033.7 | $ | 5,133.2 | |||||
Off-Balance Sheet Arrangements
Receivables Securitization
HI maintains an off-balance sheet receivables securitization facility to provide liquidity for its operations and working capital needs. Under the accounts receivable securitization facility, interests in certain of its trade receivables are transferred to a qualified off-balance sheet entity (the "Receivables Trust"). The Receivables Trust is not our affiliate. The acquisitions of these receivables by the
70
Receivables Trust are financed through the issuance of dollar- or euro-denominated commercial paper and/or medium term notes of the Receivables Trust. The debt associated with the commercial paper and medium term notes is not reflected on HI's balance sheet. The accounts receivable securitization program is an important source of liquidity to HI.
A portion of the medium term notes (€90.5 million) is denominated in euros and is subject to fluctuation in currency rates versus the U.S. dollar. The total outstanding balance of medium term notes was approximately $197 million in U.S. dollar equivalents as of September 30, 2004. In addition to medium term notes, the Receivables Trust also maintains an annual commitment with a third party to issue commercial paper for an amount up to $125 million. As of September 30, 2004, the total outstanding balance of such commercial paper was approximately €30 million ($37 million). The commercial paper facility matures on March 31, 2007, and the medium term notes mature in June 2006.
Subject to the annual seasonality of HI's accounts receivable, we estimate that the total availability to HI from the sale of accounts receivable under the securitization program may range between $280 million to $325 million (the mandatory prepayment limit under the HI Credit Facilities—see further discussion below) at certain periods during a calendar year. The weighted average interest rates on the medium term notes and commercial paper was approximately 2.5% as of September 30, 2004. Losses on the accounts receivable securitization program in the nine months ended September 30, 2004 were $10.2 million. Losses on the accounts receivable securitization program include the discount on receivables sold into the program, fees and expenses associated with the program and gains (losses) on foreign currency hedge contracts mandated by the terms of the program to hedge currency exposures on the collateral supporting the off-balance sheet debt issued. For the nine months ended September 30, 2004, losses on the accounts receivable securitization program include losses of $1.0 million on foreign currency hedge contracts mandated by the accounts receivable securitization program. We believe that the multicurrency commercial paper facility discussed above has enabled it to better naturally hedge the off-balance sheet debt to the underlying collateral supporting such debt and thereby reduce the impact on, and need for, foreign currency hedges as experienced in prior periods under the accounts receivable securitization program.
The HI Credit Facilities require a mandatory prepayment to the extent that the proceeds to HI from the sale of accounts receivable under the securitization program exceed $325 million at any time, except if such excess is attributed to the change in foreign currency rates within a 30-day period. HI does not guarantee the medium term notes or commercial paper issued under the program, but HI is responsible for dilution adjustments and ensuring that the collection policies relating to the receivables are followed. HI also indemnifies the Receivables Trust if account debtors raise defenses, disputes, offsets or counterclaims, HI breaches its administrative and other obligations with respect to accounts or an account ceases to be an eligible receivable for purposes of the program. In addition, while HI does not anticipate it, if at any time it were unable to sell sufficient receivables into the program to support the volume of commercial paper and medium term notes issued under the program, HI may be required to inject cash into the program as collateral. Under such circumstance, and depending on the timing of such circumstance, the requirement to provide cash collateral to the program could have a negative effect on our liquidity.
Financing of Chinese MDI Facilities
In 2003, we entered into two related joint venture agreements to build MDI production facilities near Shanghai, China. One joint venture, with BASF AG and three Chinese chemical companies, and known as Shanghai Lianheng Isocyanate Company Limited (the "Chinese Manufacturing JV"), will build three plants to manufacture MNB, aniline, and crude MDI. We effectively own 35% of the Chinese Manufacturing JV. The Chinese Splitting JV, the other joint venture with Shanghai Chlor-Alkali Chemical Company, Ltd., will build a plant to manufacture pure MDI, polymeric MDI and MDI variants. We own 70% of the Chinese Splitting JV.
71
On September 19, 2003, the joint ventures obtained secured financing for the construction of the production facilities. The Chinese Splitting JV is our consolidated subsidiary, and the details of its financing are described in "—Debt and Liquidity—Other Debt" above. The Chinese Manufacturing JV is not our consolidated subsidiary. The Chinese Manufacturing JV obtained various committed loans in the aggregate amount of approximately $224 million in U.S. dollar equivalents. As of September 30, 2004, there were no outstanding U.S. dollar borrowings and 30 million in outstanding RMB ($3.6 million) borrowings under these facilities. The interest rate on these facilities is LIBOR plus 0.48% for U.S. dollar borrowings and 90% of the Peoples Bank of China rate for RMB borrowings. The loans are secured by substantially all the assets of the Chinese Manufacturing JV and will be paid in 16 semi-annual installments, beginning no later than June 30, 2007. The financing will be non-recourse to us, but during the construction phase we unconditionally guarantee 35% of any amounts due and unpaid by the Chinese Manufacturing JV under the loans described above (except for a VAT facility of approximately $1.5 million which is not guaranteed). Our guarantee remains in effect until the Chinese Manufacturing JV has commenced production of at least 70% of capacity for at least 30 days and achieved a debt service coverage ratio of at least 1:1. As noted above in "Debt and Liquidity—Other Debt," we also unconditionally guarantee 70% of the amounts due and unpaid by the Chinese Splitting JV.
Restructuring and Plant Closing Costs
Nine Months Ended September 30, 2004
As of September 30, 2004 and December 31, 2003, we had reserves for restructuring and plant closing costs of $117.3 million and $76.8 million, respectively. During the nine months ended September 30, 2004, we recorded additional reserves of $93.4 million, including reserves for workforce reductions. During the 2004 period, we made cash payments against these reserves of $55.5 million.
As of September 30, 2004, accrued restructuring and plant closing costs by type of cost consist of the following (in millions):
| |
Workforce Reductions |
Demolition and decommissioning |
Non-cancelable lease costs |
Other |
Total |
|||||||||||
|---|---|---|---|---|---|---|---|---|---|---|---|---|---|---|---|---|
| Accrued liability as of December 31, 2003 | $ | 66.4 | $ | 4.1 | $ | 0.2 | $ | 6.1 | $ | 76.8 | ||||||
| Charges(1) | 88.0 | 1.9 | — | 3.5 | 93.4 | |||||||||||
| Payments(2) | (47.6 | ) | (0.2 | ) | (0.2 | ) | (7.5 | ) | (55.5 | ) | ||||||
| Other | 0.6 | — | — | 2.0 | 2.6 | |||||||||||
| Accrued liability as of September 30, 2004 | $ | 107.4 | $ | 5.8 | $ | — | $ | 4.1 | $ | 117.3 | ||||||
Details with respect to our reserves for restructuring and plant closing costs are provided below by segments (in millions):
| |
Polyurethanes |
Advanced Materials |
Performance Products |
Pigments |
Polymers |
Base Chemicals |
Total |
|||||||||||||||
|---|---|---|---|---|---|---|---|---|---|---|---|---|---|---|---|---|---|---|---|---|---|---|
| Accrued liability as of December 31, 2003 | $ | 15.8 | $ | 51.5 | $ | 2.4 | $ | 4.3 | $ | 2.8 | $ | — | $ | 76.8 | ||||||||
| Charges(1) | 24.8 | — | 24.8 | 30.6 | 4.1 | 9.1 | 93.4 | |||||||||||||||
| Payments(2) | (12.3 | ) | (23.0 | ) | (4.1 | ) | (12.2 | ) | (3.9 | ) | — | (55.5 | ) | |||||||||
| Other | — | 2.6 | — | — | — | — | 2.6 | |||||||||||||||
| Accrued liability as of September 30, 2004 | $ | 28.3 | $ | 31.1 | $ | 23.1 | $ | 22.7 | $ | 3.0 | $ | 9.1 | $ | 117.3 | ||||||||
72
As of December 31, 2003, our Polyurethanes segment reserve consisted of $15.8 million related to the restructuring activities at the Rozenburg, Netherlands site (as announced in 2003), the workforce reductions throughout the Polyurethanes segment (as announced in 2003), and the closure of the Shepton Mallet, U.K. site (as announced in 2002). During the nine months ended September 30, 2004, our Polyurethanes segment recorded additional restructuring charges of $24.8 million and made cash payments of $12.3 million. In the first quarter of 2004, our Polyurethanes segment recorded restructuring expenses of $4.8 million, all of which are payable in cash. In the second quarter of 2004, our Polyurethanes segment announced restructuring charges of $18.1 million, all of which are payable in cash. During the third quarter of 2004, our Polyurethanes segment recorded additional restructuring expenses of $9.9 million, $1.9 million of which are payable in cash and the remainder is an impairment of our West Deptford, New Jersey site. These restructuring activities are expected to result in additional restructuring charges of approximately $9 million through 2005 and result in workforce reductions of approximately 160 employees, of which 52 employees have been reduced during the nine months ended September 30, 2004. As of September 30, 2004, our Polyurethanes segment restructuring reserve totaled $28.3 million.
In connection with the AdMat Transaction, we are implementing a substantial cost reduction program. The program includes reductions in costs in our Advanced Materials segment's global supply chain, reductions in general and administrative costs across the business and the centralization of operations where efficiencies may be achieved. The cost reduction program is expected to continue through June 2005 and is estimated to involve $63.5 million in total restructuring costs, all of which were recorded in the opening balance sheet. The program will result in approximately $53.9 million in costs for workforce reduction and approximately $9.6 million in costs to close plants and discontinue certain service contracts worldwide. Our Advanced Materials segment reduced workforce by 188 employees and 151 employees during the six months ended December 31, 2003 and the nine months ended September 30, 2004, respectively.
As of December 31, 2003, our Performance Products segment reserve consisted of $2.4 million relating to the closure of a number of plants at our Whitehaven, U.K. facility, the closure of an administrative office in London, U.K., the rationalization of a surfactants technical center in Oldbury, U.K., and the restructuring of a facility in Barcelona, Spain. During the nine months ended September 30, 2004, our Performance Products segment accrued restructuring charges of $41.2 million consisting of cash charges of $24.8 million and $16.4 million of asset write offs. During the second quarter 2004, our Performance Products segment recorded charges of $20.9 million, of which $5.1 million were payable in cash. These charges primarily related to the announced closure of our Guelph, Ontario, Canada Performance Products manufacturing facility, involving a restructuring charge of $20.2 million consisting of a $15.8 million asset write down and $4.4 million of charges payable in cash. Production will be moved to our other larger, more efficient facilities. Workforce reductions of approximately 66 employees are anticipated. During the third quarter of 2004, we adopted a plan to reduce the workforce across all locations in our European surfactants business by approximately 250 employees. A restructuring charge of $17.5 million was recorded consisting entirely of severance charges to be paid in cash. During the third quarter of 2004, we also announced the closure of our maleic anhydride plant in Queeny, Missouri and recorded a restructuring charge of $1.5 million which consisted of a $0.6 million asset write off and a charge payable in cash of $0.9 million. During the third quarter of 2004, we also announced the closure of our technical facility in Austin, Texas and recorded a restructuring charge of $1.3 million which is payable in cash. During the nine months ended September 30, 2004, we made cash payments of $4.1 million related to restructuring activities. These restructuring activities are not expected to result in additional charges. Our Performance Products segment reserve totaled $23.1 million as of September 30, 2004.
On October 27, 2004, we adopted a plan to rationalize the Whitehaven, U.K. surfactants operations of our Performance Products segment. The plan includes the closure of substantially all of our Whitehaven, U.K. surfactants manufacturing facility and the reduction of approximately 70
73
employees at the facility. The rationalization is in addition to the reorganization of our European surfactants business which is expected to reduce an additional 250 employees over a period of 15 months at facilities throughout Europe. In connection with the rationalization of the Whitehaven facility, we expect to recognize a restructuring charge of approximately $51 million in the fourth quarter of 2004, of which approximately $20 million is expected to be payable in cash.
As of December 31, 2003, our Polymers segment reserve consisted of $2.8 million related to the demolition and decommissioning of our Odessa, Texas styrene manufacturing facility and non-cancelable lease costs. During the nine months ended September 30, 2004, our Polymers segment recorded restructuring expenses related to the closure of an Australian manufacturing unit of $7.6 million and made cash payments of $3.9 million related to these restructuring activities. Of the $7.6 million of restructuring expenses, $5.2 million were recorded in the second quarter and $2.4 million were recorded in the third quarter, and $4.1 million are payable in cash. These restructuring activities are expected to result in additional charges of less than $1.0 million through 2005 and in workforce reductions of approximately 23 employees. Our Polymers segment reserve totaled $3.0 million as of September 30, 2004.
As of September 30, 2004 and December 31, 2003, our Pigments segment reserve consisted of $22.7 million and $4.3 million, respectively. During the nine months ended September 30, 2004, our Pigments segment recorded additional restructuring charges of $111.7 million and made cash payments of $12.2 million. In the first quarter 2004, our Pigments segment recorded restructuring expenses of $3.9 million, all of which are payable in cash. In the second quarter 2004, our Pigments segment recorded restructuring expenses of $104.2 million, of which $81.1 million is not payable in cash. In April 2004, we announced that, following a review of our Pigments business, we will idle approximately 55,000 tonnes, or about 10%, of our total TiO2 production capacity in the fourth quarter of 2004. As a result of this decision, we have recorded a restructuring charge of $17.0 million to be paid in cash, a $77.2 million asset impairment charge and a $3.9 million charge for the write off of spare parts inventory and other assets. Concerning the impairment charge, we determined that the value of the related long-lived assets was impaired and recorded the non-cash charge to earnings for the impairment of these assets. The fair value of these assets for purposes of measuring the impairment was determined using the present value of expected cash flows. Additional second quarter 2004 restructuring activities resulted in a charge of $6.1 million, all of which is payable in cash. In the third quarter of 2004, our Pigments segment recorded restructuring expenses of $3.6 million, all of which are payable in cash, related to workforce reductions at several of our locations worldwide. These restructuring activities are expected to result in additional restructuring charges of approximately $9 million through 2005 and result in workforce reductions of approximately 475 employees, of which 180 employees have been reduced during the nine months ended September 30, 2004.
As of September 30, 2004 and December 31, 2003, our Base Chemicals segment reserve consisted of $9.1 million and nil, respectively, related to workforce reductions arising from the announced change in work shift schedules and in the engineering and support functions at our Wilton and North Tees, U.K. facilities. During the nine months ended September 30, 2004, our Base Chemicals segment recorded restructuring charges of $9.1 million, all of which is payable in cash. Of these charges, $2.2 million were recorded in the second quarter of 2004 and $6.9 million were recorded in the third quarter of 2004. These restructuring activities are expected to result in additional charges of approximately $5 million and in workforce reductions of approximately 100 positions.
Restructuring Activities for the Year Ended December 31, 2003
We have incurred restructuring and plant closing costs totaling $37.9 million, $4.3 million and $588.5 million (which included asset impairment charges) for the years ended December 31, 2003, 2002 and 2001, respectively. Charges for 2001 were revised downward during 2002 by $5.3 million.
74
As of December 31, 2003, accrued restructuring and plant closing costs consist of the following (in millions):
| |
Property, plant and equipment |
Workforce Reductions |
Demolition and decommissioning |
Non-cancelable lease costs |
Other |
Total |
|||||||||||||
|---|---|---|---|---|---|---|---|---|---|---|---|---|---|---|---|---|---|---|---|
| Accrued liability as of December 31, 2002 | $ | — | $ | 3.9 | $ | 3.3 | $ | 0.6 | $ | — | $ | 7.8 | |||||||
| HIH charges prior to May 1, 2003(a) | — | 24.2 | — | — | — | 24.2 | |||||||||||||
| Advanced Materials charges as of June 30, 2003(b) | 1.5 | 53.2 | — | — | 6.1 | 60.8 | |||||||||||||
| Charges | — | 26.1 | (0.3 | ) | (0.2 | ) | — | 25.6 | |||||||||||
| Payments(c) | — | (41.0 | ) | (0.4 | ) | (0.2 | ) | — | (41.6 | ) | |||||||||
| Accrued liability as of December 31, 2003 | $ | 1.5 | $ | 66.4 | $ | 2.6 | $ | 0.2 | $ | 6.1 | $ | 76.8 | |||||||
Detail of these reserves by segment are as follows (in millions):
| |
Polyurethanes |
Advanced Materials |
Performance Products |
Pigments |
Polymers |
Base Chemicals |
Total |
||||||||||||||
|---|---|---|---|---|---|---|---|---|---|---|---|---|---|---|---|---|---|---|---|---|---|
| Accrued liability as of December 31, 2003 | $ | 15.8 | $ | 51.5 | $ | 2.4 | $ | 4.3 | $ | 2.8 | $ | — | $ | 76.8 | |||||||
On March 11, 2003 (before we consolidated HIH), the Polyurethanes segment announced that it would integrate its global flexible products unit into its urethane specialties unit, and recorded a restructuring charge of $19.2 million for workforce reductions of approximately 118 employees. During the remainder of the year, charges of $8.9 million were taken for workforce reductions relating to this restructuring at the Rozenburg, Netherlands site.
In June 2003, we announced that our Performance Products segment would close a number of plants at its Whitehaven, U.K. facility and recorded a charge of $20.1 million in the second quarter 2003. This charge represents $11.4 million relating to an impairment of assets in connection with the plant shutdowns and $8.7 million of workforce reduction costs. We also recorded a $2.0 million charge in respect of severance costs arising from the closure of an administrative office in London, U.K., the rationalization of our surfactants technical center in Oldbury, U.K., and the restructuring of our facility in Barcelona, Spain. These charges are part of an overall cost reduction program for this segment that is expected to be implemented from 2003 to 2005.
In August 2003, we recorded a restructuring charge of $6.5 million related to workforce reductions of approximately 63 employees across our global Pigments operations. The overall cost reduction program to be completed from 2003 to 2005 for the Pigments segment will involve 250 employees and is estimated to cost an additional $16.5 million. At December 31, 2003, $4.3 million remains in the reserve for restructuring and plant closing costs related to these restructuring activities.
In connection with the AdMat Transaction, we are implementing a substantial cost reduction program. The program will include reductions in costs of our global supply chain, reductions in general
75
and administrative costs across the business and the centralization of operations where efficiencies may be achieved. The cost reduction program is expected to be implemented from June 2003 to June 2005. We reduced 188 staff in the six months ended December 31, 2003 and an additional 151 in the nine months ended September 30, 2004. Payments of restructuring and plant closing costs were recorded against reserves established in connection with recording the AdMat Transaction as a purchase business combination. At December 31, 2003, $51.5 million remained in the reserve for restructuring and plant closing costs related to the cost reduction program.
Capital Expenditures
Nine Months Ended September 30, 2004
Capital expenditures for the nine months ended September 30, 2004 and September 30, 2003 were $145.0 million and $129.9 million, respectively. The increase is largely attributable to the HIH Consolidation Transaction effective May 2003 and the AdMat Transaction effective June 30, 2003.
At HIH, capital expenditures for the nine months ended September 30, 2004 were $91.6 million, a decrease of approximately $4.1 million compared to the same period in 2003. At HLLC (excluding HIH), capital expenditures for the nine months ended September 30, 2004 were $46.1 million, a decrease of approximately $18.5 million compared to the same period in 2003. This decrease was largely attributable to increased capital expenditures in the 2003 period relating to implementation of our North American SAP system. At Advanced Materials, capital expenditures for the nine months ended September 30, 2004 were $7.3 million, a decrease of approximately $0.2 million compared to the same period in 2003.
We expect to spend approximately $230 million to $240 million during 2004 on capital projects, which includes any expenditures for the LDPE facility at Wilton, U.K. discussed below. During 2004, we expect to spend approximately $25 million to fund our Chinese MDI joint ventures, which includes approximately $13 million in the Chinese Splitting JV as capital expenditures and approximately $12 million in the Chinese Manufacturing JV as an investment in unconsolidated affiliates. We expect to fund up to a total of approximately $85 million to the Chinese MDI joint ventures over the next several years, approximately $43 million in the Chinese Splitting JV as capital expenditures and approximately $42 million in the Chinese Manufacturing JV as an investment in unconsolidated affiliates.
We believe that the cost position of our Wilton, U.K. olefins facility uniquely positions it to be the site of a polyethylene production facility. While we export approximately one-third of our ethylene production each year to continental Europe, incurring significant shipping and handling costs, the U.K. annually imports approximately 1.9 billion pounds of polyethylene. We believe this provides an opportunity to capitalize on the low-cost operating environment and extensive petrochemical infrastructure and logistics at Wilton, as supported by a feasibility study that was conducted with respect to the construction of a world-scale LDPE facility at our Wilton site. The LDPE facility will have the capacity to produce approximately 900 million pounds of LDPE annually and is estimated to cost $300 million to construct net of any grant proceeds obtained. HI has been awarded a grant of £16.5 million (approximately $30 million) from the U.K. Government's Department of Trade and Industry to finance a portion of the construction of the LDPE facility. We expect construction of the LDPE facility to be complete in late 2007.
In connection with our joint ventures with Rubicon LLC and Louisiana Pigment Company, L.P., we are obligated to fund our proportionate share of capital expenditures. During the nine months ended September 30, 2004 and 2003, we invested $1.8 million and $2.2 million, respectively, in Rubicon LLC. With respect to Louisiana Pigment, during the nine months ended September 30, 2004 and 2003, we received $9.1 million and $2.1 million, respectively.
We expect to finance our capital expenditure commitments through a combination of our financing arrangements and cash flow from operations.
76
Year Ended December 31, 2003
Consolidated capital expenditures for the years ended December 31, 2003 and December 31, 2002 were $191.0 million and $70.2 million, respectively. The increase is largely attributable to the HIH Consolidation Transaction effective May 2003 and the AdMat Transaction effective June 30, 2003.
At HIH, capital expenditures for the year ended December 31, 2003 were $127.4 million, a decrease of approximately $63.1 million compared to the same period in 2002. The decrease was largely attributable to increased expenditures in the 2002 period in connection with the ICON modernization and the expansion of the titanium dioxide manufacturing facility at Greatham, U.K., and the SAP project within our Pigments segment. At HLLC (excluding HIH), capital expenditures for the year ended December 31, 2003 were $89.7 million, an increase of approximately $19.5 million compared to the same period in 2002. This increase was largely attributable to increased capital expenditures in the 2003 period in connection with the planned turnaround and inspection of our Port Arthur, Texas Olefins unit, the implementation of our North American SAP system, and a return to a more normalized level of expenditures. At Advanced Materials, capital expenditures for the year ended December 31, 2003 were $11.8 million, a decrease of approximately $12.2 million compared to the same period in 2003. This decrease was largely attributable to liquidity management efforts.
Changes in Financial Condition
The following information summarizes our working capital position as of September 30, 2004 and December 31, 2003 (in millions):
| |
December 31, 2003 |
September 30, 2004 |
Increase (Decrease) |
|||||||
|---|---|---|---|---|---|---|---|---|---|---|
| Current assets: | ||||||||||
| Cash and cash equivalents | $ | 208.3 | $ | 239.1 | $ | 30.8 | ||||
| Accounts and notes receivables | 1,102.7 | 1,403.3 | 300.6 | |||||||
| Inventories | 1,039.3 | 1,132.6 | 93.3 | |||||||
| Prepaid expenses | 39.6 | 70.6 | 31.0 | |||||||
| Deferred income taxes | 14.7 | 20.6 | 5.9 | |||||||
| Other current assets | 108.3 | 69.5 | (38.8 | ) | ||||||
| Total current assets | 2,512.9 | 2,935.7 | 422.8 | |||||||
| Current liabilities: | ||||||||||
| Accounts payable | 832.1 | 919.7 | 87.6 | |||||||
| Accrued liabilities | 702.0 | 689.8 | (12.2 | ) | ||||||
| Deferred income taxes | 15.1 | 18.9 | 3.8 | |||||||
| Current portion of long-term debt | 137.1 | 54.8 | (82.3 | ) | ||||||
| Total current liabilities | 1,686.3 | 1,683.2 | (3.1 | ) | ||||||
| Working capital | $ | 826.6 | $ | 1,252.5 | $ | 425.9 | ||||
From December 31, 2003 to September 30, 2004, our working capital increased by $425.9 million as a result of the net impact of the following significant changes:
77
Recently Issued Financial Accounting Standards
In January 2003, the Financial Accounting Standards Board ("FASB") issued Financial Interpretation No. ("FIN") 46, "Consolidation of Variable Interest Entities." FIN 46 addresses the requirements for business enterprises to consolidate related entities, for which they do not have controlling interests through voting or other rights, if they are determined to be the primary beneficiary as a result of variable economic interests. Transfers to a qualifying special purpose entity are not subject to this interpretation. In December 2003, the FASB issued a complete replacement of FIN 46 (FIN 46R), to clarify certain complexities. We are required to adopt this standard on January 1, 2005. We do not believe that the impact of FIN 46R on our financial statements will be material.
Critical Accounting Policies
The preparation of financial statements and related disclosures in conformity with accounting principles generally accepted in the U.S. requires management to make judgments, estimates and assumptions that affect the reported amounts in the consolidated financial statements. Our significant accounting policies are summarized in Note 2 to the Consolidated Financial Statements of Huntsman Holdings, LLC included elsewhere in this prospectus. Summarized below are our critical accounting policies:
Revenue Recognition
We generate substantially all of our revenues through sales in the open market and long-term supply agreements. We recognize revenue when it is realized or realizable and earned. Revenue for product sales is recognized as risk and title to the product transfer to the customer, collectibility is reasonably assured and pricing is fixed or determinable. Generally, this occurs at the time shipment is made.
Long-Lived Assets
The determination of useful lives of our property, plant and equipment is considered a critical accounting estimate. Such lives are estimated based upon our historical experience, engineering estimates and industry information and are reviewed when economic events indicate that we may not be able to recover the carrying value of the assets. The estimated lives of our property range from 3 to 30 years and depreciation is recorded on the straight-line method. Inherent in our estimates of useful lives is the assumption that periodic maintenance and an appropriate level of annual capital expenditures will be performed. Without on-going capital improvements and maintenance, the productivity and cost efficiency declines and the useful lives of our assets would be shorter.
Until January 1, 2003, approximately $1.3 billion of our total plant and equipment was depreciated using the straight-line method on a group basis at a 4.7% composite rate. When capital assets representing complete groups of property were disposed of, the difference between the disposal proceeds and net book value was credited or charged to income. When miscellaneous assets were
78
disposed of, the difference between asset costs and salvage value was charged or credited to accumulated depreciation. Effective January 1, 2003, we changed our method of accounting for depreciation for the assets previously recorded on a group basis to the component method. Specifically, the net book value of all the assets on January 1, 2003 were allocated to individual components and are being depreciated over their remaining useful lives and gains and losses are recognized when a component is retired. This change decreased depreciation for the year ended December 31, 2003 by $43.0 million.
We are required to evaluate our plant assets whenever events indicate that the carrying value may not be recoverable in the future or when management's plans change regarding those assets, such as idling or closing a plant. We evaluate impairment by comparing undiscounted cash flows of the related property to the carrying value. Key assumptions in determining the future cash flows include the useful life, technology, competitive pressures, raw material pricing and regulations.
Restructuring and Plant Closing Costs
We have recorded restructuring charges in recent periods in connection with closing certain plant locations, work force reductions and other cost savings programs. These charges are recorded when management has committed to a plan and incurred a liability related to the plan. Estimates for plant closing include the write-off of the carrying value of the plant, any necessary environmental and/or regulatory costs, contract termination and demolition costs. Estimates for work force reductions and other costs savings are recorded based upon estimates of the number of positions to be terminated, termination benefits to be provided and other information as necessary. Management evaluates the estimates on a quarterly basis and adjusts the reserve when information indicates that the estimate is above or below the initial estimate.
Income Taxes
Huntsman Holdings, LLC is treated as a partnership for U.S. federal income tax purposes and as such is generally not subject to U.S. income tax. Income of Huntsman Holdings, LLC is taxed directly to its owners. Income of the subsidiaries of Huntsman Holdings, LLC is taxed under consolidated corporate income tax rules. These subsidiaries file a U.S. Federal consolidated tax return with Huntsman Group Inc. ("HGI") as the parent. HGI and all of its U.S. subsidiaries are parties to various tax sharing agreements which generally provide that the entities will pay their own taxes (as computed on a separate-company basis) and will be compensated for the use of tax attributes, including net operating losses.
We use the asset and liability method of accounting for income taxes. Deferred income taxes reflect the net tax effects of temporary differences between the carrying amounts of assets and liabilities for financial and tax reporting purposes. We evaluate the resulting deferred tax assets to determine whether it is more likely than not that they will be realized. Valuation allowances have been established against the entire U.S. and a material portion of the non-U.S. deferred tax assets due to an uncertainty of realization.
Subsequent to the AdMat Transaction, substantially all non-U.S. operations of Advanced Materials are treated as our branches for U.S. income tax purposes and are, therefore, subject to both U.S. and non-U.S. income tax. Until we have sufficient U.S. taxable income to utilize foreign tax credits, most income will continue to be effectively taxed in both U.S. and non-U.S. jurisdictions in which it is earned.
Prior and subsequent to the AdMat Transaction, for non-U.S. entities that are not treated as branches for U.S. tax purposes, we do not provide for income taxes or benefits on the undistributed earnings of these subsidiaries as earnings are reinvested and, in the opinion of management, will continue to be reinvested indefinitely. Upon distribution of these earnings, certain of our subsidiaries
79
would be subject to both income taxes and withholding taxes in the various international jurisdictions. It is not practical to estimate the amount of taxes that might be payable upon such distributions.
As of December 31, 2003, we had gross deferred tax assets (primarily tax net operating losses and specific deferred tax assets of a nature similar to net operating losses) of approximately $3.0 billion. These deferred tax assets are primarily located in the U.S., the U.K., The Netherlands, Switzerland and Malaysia. A material portion of these deferred tax assets is not on our balance sheet because they are offset by a valuation allowance. In addition to the amount above, we also had gross tax net operating losses in Luxembourg of approximately $1.1 billion as of December 31, 2003. A material utilization of the Luxembourg tax net operating losses is unlikely.
Employee Benefit Programs
We sponsor several contributory and non-contributory defined benefit plans primarily covering employees in the U.S., the U.K., Netherlands, Belgium, Canada and a number of other countries. We fund the material plans through trust arrangements (or local equivalents) where the assets are held separately from the employer. We also sponsor unfunded post-retirement plans which provide medical and life insurance benefits covering certain employees in the U.S. and Canada. Amounts recorded in the consolidated financial statements are recorded based upon actuarial valuations performed by various independent actuaries. Inherent in these valuations are numerous assumptions regarding expected return on assets, discount rates, compensation increases, mortality rates and health care costs trends. These assumptions are disclosed in the notes to the consolidated financial statements.
Environmental Reserves
Environmental remediation costs for our facilities are accrued when it is probable that a liability has been incurred and the amount can be reasonably estimated. Estimates of environmental reserves require evaluating government regulation, available technology, site-specific information and remediation alternatives. We accrue an amount equal to our best estimate of the costs to remediate based upon the available information. Adjustments to our estimates are made periodically based upon additional information received as remediation progresses. For further information see Note 18 to the Unaudited Consolidated Financial Statements of Huntsman Holdings, LLC included elsewhere in this prospectus.
Quantitative and Qualitative Disclosures About Market Risk
We are exposed to market risk, including changes in interest rates, currency exchange rates and certain commodity prices. Our exposure to changing commodity prices is somewhat limited since the majority of our raw materials are acquired at posted or market related prices, and sales prices for finished products are generally at market related prices which are largely set on a monthly or quarterly basis in line with industry practice. To manage the volatility relating to these exposures, from time to time, we enter into various derivative transactions. We hold and issue derivative financial instruments for economic hedging purposes only.
Our cash flows and earnings are subject to fluctuations due to exchange rate variation. Our sales prices are typically denominated in euros or U.S. dollars. From time to time, we may enter into foreign currency derivative instruments to minimize the short-term impact of movements in foreign currency rates. Short-term exposures to changing foreign currency exchange rates at certain foreign subsidiaries are generally netted where practicable with exposures of other subsidiaries and the remaining exposures then, from time to time, may be managed through financial market transactions, principally through the purchase of spot or forward foreign exchange contracts (with maturities of nine months or less) with various financial institutions, to reflect the currency denomination of our cash flows. We do not hedge our currency exposures in a manner that would entirely eliminate the effect of changes in exchange rates on our cash flows and earnings. As of September 30, 2004, we had no outstanding forward foreign exchange contracts. Our hedging activity from time to time comprises selling forward surpluses of
80
non-dollar receivables for U.S. dollars. In addition, HI's accounts receivable securitization program requires in certain circumstances that we enter into certain forward foreign currency hedges intended to hedge currency exposures on the collateral supporting the off-balance sheet debt issued in the program.
As of September 30, 2004, HLLC had entered into approximately $184 million notional amount of interest rate swap transactions, which have remaining terms ranging from approximately 15 to 33 months. The majority of these transactions hedge against movements in U.S. dollar interest rates. The U.S. dollar swap transactions obligate HLLC to pay fixed amounts ranging from 3.78% to 6.55% of the notional amount in exchange for LIBOR-based floating amounts. As of September 30, 2004, HI and Advanced Materials had not entered into any interest rate agreements. We do not hedge our interest rate exposure in a manner that would eliminate the effects of changes in market interest rates on our cash flow and earnings.
As of September 30, 2004, we had combined outstanding variable rate borrowings at HLLC, HI and Advanced Materials of approximately $2.5 billion. The weighted average interest rate of these borrowings was approximately 6.0%. This weighted average rate does not consider the effects of interest rate hedging activities. Assuming a 1.0% increase in interest rates, without giving effect to interest rate hedges, the effect on the annual interest expense would be an increase of approximately $25 million. This increase would be reduced by approximately $1.8 million on an annualized basis, as a result of the effects of the interest rate swap, cap and collar transactions described above.
In order to reduce overall raw material cost volatility, from time to time we enter into various commodity contracts to hedge our purchase of commodity products. We do not hedge our commodity exposure in a manner that would eliminate the effects of changes in commodity prices on our cash flows and earnings. At September 30, 2004, we had forward purchase and sale contracts for 30,000 tonnes of naphtha and 56,000 tonnes of other hydrocarbons, which do not qualify for hedge accounting. Assuming a 10% increase or a 10% decrease in the price per tonne of naphtha, the impact on the forward purchase contracts would result in losses and gains of approximately $0.3 million, respectively.
81
Overview
We are among the world's largest global manufacturers of differentiated and commodity chemical products. We manufacture a broad range of chemical products and formulations, which are marketed in more than 100 countries to a diversified group of consumer and industrial customers. Our products are used in a wide range of applications, including those in the adhesives, aerospace, automotive, construction products, durable and non-durable consumer products, electronics, medical, packaging, paints and coatings, power generation, refining and synthetic fiber industries. We are a leading global producer in many of our key product lines, including MDI, amines, surfactants, epoxy-based polymer formulations, maleic anhydride and titanium dioxide. We operate 63 manufacturing facilities located in 22 countries and employ over 11,500 associates. Our businesses benefit from significant integration, large production scale and proprietary manufacturing technologies, which allow us to maintain a low-cost position. We had pro forma revenues for the nine months ended September 30, 2004 and the year ended December 31, 2003 of $8.4 billion and $9.3 billion, respectively.
Competitive Strengths
Leading Market Positions in Our Differentiated Product Segments
We derive a substantial portion of our revenues and EBITDA from our Polyurethanes, Advanced Materials and Performance Products segments, which manufacture our differentiated products. For the nine months ended September 30, 2004, these segments accounted for 52% of our total revenues and 63% of our segment EBITDA. We enjoy leading market positions in many of our primary product lines in these segments, including MDI, amines, carbonates, specialty surfactants, maleic anhydride, adhesives and epoxy-based polymer formulations. Demand for many of these products has been relatively resistant to changes in global economic conditions and has historically grown at rates in excess of GDP growth due to new product development and the continued substitution of our products for traditional materials and chemicals. We produce many of these products using our proprietary manufacturing processes, and we own many patents related to our processes, product formulation and their end-use applications. The markets for many of these products also benefit from a limited number of global producers, significant barriers to entry and a high degree of customer loyalty.
Large Scale, Integrated Manufacturer with Low Cost Operations
We are among the world's largest global manufacturers of chemical products. We operate 63 manufacturing facilities located in 22 countries as well as numerous sales, technical service and research facilities. We believe that the scale of our operations enables us to source raw materials and services that we purchase from third parties on terms more advantageous than those available to our smaller competitors. In addition, we are able to leverage selling, administrative and corporate overhead service platforms in order to reduce the operating costs of our businesses, including those that we have acquired. Our scale has also allowed us to rationalize smaller, less efficient capacity in recent years.
Our businesses also benefit from significant product integration. In 2003, we utilized approximately half of our ethylene production and all our EO production in the manufacturing operations of our Performance Products and Polymers segments. In addition, we utilized substantially all the benzene that we produced in the production of our aromatics and MDI. We believe that our high degree of product integration provides us with a competitive advantage over non-integrated producers by reducing both our exposure to cyclical raw material prices and our raw material transportation costs, as well as increasing the operating rates of our facilities. We believe our large production scale and integration enable us to manufacture and market our products at costs that are lower than those achieved by smaller, less integrated producers.
82
Diverse Customer Base Across Broad Geographic Regions
We sell our products to a highly diverse base of customers who are located in all major geographic regions and represent many end-use industry groups. We have thousands of customers in more than 100 countries. We have developed a global presence, with approximately 47% of our pro forma revenues for the year ended December 31, 2003 from North America, approximately 37% from Europe, approximately 12% from the Asia/Pacific region and approximately 4% from South America and other regions. We believe that this diversity limits our dependence on any particular product line, customer, end market or geographic region.
Experienced Management
We are managed by an experienced group of executives, led by Jon M. Huntsman, our Chairman of the Board, and Peter R. Huntsman, our President and Chief Executive Officer. Jon M. Huntsman is the founder of our company and has over 40 years of experience in the chemicals and plastics industries. Peter Huntsman has over 20 years of experience in the chemicals and plastics industries. Both have been instrumental in leading our company through periods of growth and industry cycles. The balance of our executive management team has extensive industry experience and prior work experience at leading chemical and professional services firms, including ICI, Texaco, Inc., Mobil Corporation, Bankers Trust Company and Skadden, Arps, Slate, Meagher & Flom LLP. Throughout our history, our management team has demonstrated expertise and entrepreneurial spirit in expanding our businesses, integrating numerous acquisitions and executing on significant cost cutting programs.
Business Strategy
Expand Our Differentiated Segments
Since 1999, we have invested over $500 million in discretionary capital expenditures and completed seven strategic acquisitions to expand our differentiated segments. As a result, in the nine months ended September 30, 2004, these segments produced 52% of our pro forma revenues and 63% of our segment EBITDA. We intend to continue to invest our capital in the higher-growth, higher-margin differentiated segments in order to expand the breadth of our product offerings, extend the geographic scope of these businesses and increase our production capacity to meet growing customer demand. As part of this strategy, we have a significant interest in a manufacturing joint venture that has recently begun construction of a world-scale MDI production facility near Shanghai, China. We believe that this will enable us to strengthen our long-standing presence in China and to further capitalize on the growth in demand for MDI in this region, especially in Asia. We intend to continue to invest in our global research and development capabilities in order to meet the increasingly sophisticated needs of our customers in areas of new product development and product application technology. We have recently announced that we will consolidate substantially all of our existing North American Polyurethanes, Advanced Materials and Performance Products research and development, technical service and process technology capabilities in a new, state-of-the-art facility to be constructed in The Woodlands, Texas.
Maximize Cash Generated By Our Commodity Segments
We derived 48% of our revenues and 37% of our segment EBITDA for the nine months ended September 30, 2004 from our Pigments, Polymers and Base Chemicals segments. We believe we have cost-competitive facilities in each of these segments, which produce primarily commodity products. In periods of favorable market conditions, our commodity businesses have historically generated significant amounts of free cash flow. We intend to continue to selectively invest sufficient capital to sustain the competitive position of our existing commodity facilities and improve their cost structure. In addition,
83
we intend to capitalize on the low-cost position of our Wilton, U.K. olefins facility by constructing a world-scale LDPE facility on an adjacent site.
Continue Focus on Improving Operational Efficiencies
We continuously focus on identifying opportunities to reduce our operating costs and maximize our operating efficiency. We have completed a number of targeted cost reduction programs and other actions since 1999. These programs have included, among other things, the closing of seven high-cost manufacturing units as well as reducing corporate and administrative costs. More recently, we have announced a comprehensive global cost reduction program, which we refer to as "Project Coronado," with a goal of further reducing our annual fixed manufacturing and selling, general and administrative costs by $200 million by 2006. In connection with Project Coronado, we have recently announced the closure of eight smaller, less competitive manufacturing units in our Polyurethanes, Advanced Materials, Performance Products and Pigments segments. These and other actions have resulted in the reduction of approximately 1,500 employees in these businesses since 2000.
Further Reduce Our Indebtedness
We intend to use substantially all of our net proceeds from this offering to reduce our outstanding indebtedness. This will result in a significant reduction in our annual interest expense. If the profitability of our businesses continues to improve, we intend to further reduce the level of our indebtedness.
Our Products and Segments
Our business is organized around our six segments: Polyurethanes, Advanced Materials, Performance Products, Pigments, Polymers and Base Chemicals. These segments can be divided into two broad categories: differentiated and commodity. We produce differentiated products primarily in our Polyurethanes, Advanced Materials and Performance Products segments. These products serve diverse end markets and are generally characterized by historical growth in excess of GDP growth resulting from product substitution and new product development, proprietary manufacturing processes and product formulations and a high degree of customer loyalty. Demand for these products tends to be driven by the value-added attributes that they create in our customers' end-use applications. While the demand for these differentiated products is also influenced by worldwide economic conditions and GDP growth, our differentiated products have tended to produce more stable profit margins and higher demand growth rates than our commodity products.
In our commodity chemical businesses, we produce titanium dioxide derived from titanium-bearing ores in our Pigments segment and petrochemical-based olefins, aromatics and polyolefins products in our Polymers and Base Chemicals segments. Since the coatings industry consumes a substantial portion of titanium dioxide production, seasonal demand patterns in the coatings industry drive the profitability of our Pigments segment. The profitability of our petrochemical-based commodity products is cyclical and has been experiencing a down cycle for the last several years, resulting primarily from significant new capacity additions, a decrease in demand reflecting weak global economic conditions and high raw material costs. Certain industry fundamentals have recently improved and, according to Nexant and IBMA, point to increased profitability in the markets for the major commodity products that we manufacture.
84
The following charts set forth information regarding the revenues and EBITDA of our six business segments for the nine months ended September 30, 2004:
| Segment Revenues* |
Segment EBITDA* |
|
|---|---|---|
|
|
|
Polyurethanes
General
We are a leading global manufacturer and marketer of a broad range of polyurethane chemicals, including MDI, PO, polyols, PG, TDI and TPU. Polyurethane chemicals are used to produce rigid and flexible foams, as well as coatings, adhesives, sealants and elastomers. We focus on the higher-margin, higher-growth markets for MDI and MDI-based polyurethane systems. Growth in our Polyurethanes segment has been driven primarily by the continued substitution of MDI-based products for other materials across a broad range of applications. As a result, according to Nexant, global consumption of MDI grew at a compound annual growth rate of 7.3% from 1992 to 2003. Our Polyurethanes segment is widely recognized as an industry leader in utilizing state-of-the-art application technology to develop new polyurethane systems and applications. In 2003, approximately 20% of the revenues from our MDI-based products were generated from products and applications introduced in the previous three years. According to Nexant, we are the lowest-cost and second-largest producer of MDI in the world. We operate four primary Polyurethanes manufacturing facilities in the U.S. and Europe. We also operate 14 Polyurethanes formulation facilities, which are located in close proximity to our customers worldwide. We have a significant interest in a manufacturing joint venture that has recently begun construction of a low-cost, world-scale, integrated MDI production facility near Shanghai, China. We expect production at this facility to commence in 2006.
85
Our customers produce polyurethane products through the combination of an isocyanate, such as MDI or TDI, with polyols, which are derived largely from PO and EO. While the range of TDI-based products is relatively limited, we are able to produce over 2,000 distinct MDI-based polyurethane products by varying the proportion and type of polyol used and by introducing other chemical additives to our MDI formulations. As a result, polyurethane products, especially those derived from MDI, are continuing to replace traditional products in a wide range of end-use markets, including insulation in construction and appliances, cushioning for automotive and furniture, adhesives, wood binders, footwear and other specialized engineering applications. Largely as a result of our technological expertise and history of product innovation, we have enjoyed long-term relationships with a diverse customer base, including BMW, Collins & Aikman, Electrolux, Firestone, Lear, Louisiana Pacific, Shell and Weyerhauser.
We are one of three North American producers of PO. We and some of our customers process PO into derivative products such as polyols for polyurethane products, PG and various other chemical products. End uses for these derivative products include applications in the home furnishings, construction, appliance, packaging, automotive and transportation, food, paints and coatings and cleaning products industries. We are also, according to Nexant, the third largest U.S. marketer of PG, which is used primarily to produce UPR for bath and shower enclosures and boat hulls, and to produce heat transfer fluids and solvents. We also produce MTBE as a co-product of our PO manufacturing process. MTBE is an oxygenate that is blended with gasoline to reduce harmful vehicle emissions and to enhance the octane rating of gasoline. See "—Environmental, Health and Safety Matters—MTBE Developments" for a further discussion of legal and regulatory developments that may curtail or eliminate the use of MTBE in gasoline in the U.S. and elsewhere in the future.
In 1992, we were the first global supplier of polyurethane chemicals to open a technical service center in China. We have since expanded this facility to include an integrated polyurethanes formulation facility. In January 2003, we entered into two related joint ventures to build MDI production facilities near Shanghai, China. According to the China Household Appliances Association and China Polyurethanes Industry Association, in 2003 China was responsible for approximately 35% of the world's production of refrigerators, 70% of the world's production of shoes and 60% of the world's production of toys and was a leading manufacturer of construction materials, synthetic leather furniture and automobiles. Our MDI joint ventures will enable us to strengthen our long-standing presence in China and to further capitalize on the growth in demand for MDI in Asia.
Industry Overview
According to Nexant, the polyurethane chemicals industry was a $30 billion global market in 2003, consisting primarily of the manufacture and marketing of MDI, TDI and polyols. Primary polyurethane end-uses include automotive interiors, refrigeration and appliance insulation, construction products, footwear, furniture cushioning, adhesives and other specialized engineering applications.
In 2003, according to Nexant, MDI, TDI, TPU, polyols and other products, such as specialized additives and catalysts, accounted for 30%, 15%, 2%, 38% and 15% of global polyurethane chemicals sales, respectively. MDI is used primarily in rigid foam applications and in a wide variety of customized higher-value flexible foam and coatings, adhesives, sealants and elastomers; conversely, TDI is used primarily in commodity flexible foam applications. Polyols, including polyether and polyester polyols, are used in conjunction with MDI and TDI in rigid foam, flexible foam and other non-foam
86
applications. PO is one of the principal raw materials for producing polyether polyols. The following chart illustrates the range of product types and end uses for polyurethane chemicals:
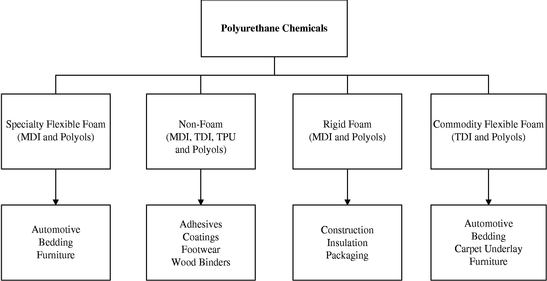
Polyurethane chemicals are sold to customers who combine the chemicals to produce polyurethane products. Depending on their needs, customers will use either commodity polyurethane chemicals produced for mass sales or polyurethane systems tailored for their specific requirements. By varying the blend, additives and specifications of the polyurethane chemicals, manufacturers are able to produce and develop a breadth and variety of polyurethane products. The following table sets forth information regarding the three principal polyurethane chemicals markets:
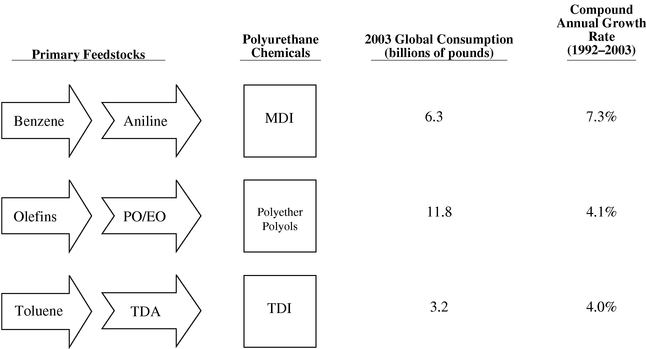
Source: Nexant
MDI. As reflected in the chart above, MDI has a substantially larger market size and a higher growth rate than TDI. This is primarily because MDI can be used to make polyurethanes with a
87
broader range of properties and can therefore be used in a wider range of applications than TDI. Nexant reports that future growth of MDI is expected to be driven by the continued substitution of MDI-based polyurethane for fiberglass and other materials currently used in rigid insulation foam for construction. We expect that other markets, such as binders for reconstituted wood board products, specialty cushioning applications and coatings will further contribute to the continued growth of MDI.
According to Nexant, global consumption of MDI was approximately 6.3 billion pounds in 2003, growing from 2.9 billion pounds in 1992, which represents a 7.3% compound annual growth rate. This growth rate is the result of the wide variety of end-uses for MDI and its superior performance characteristics relative to other polymers. The U.S. and European markets currently consume the largest quantities of MDI. With the recent rapid growth of the developing Asian economies, the Asian markets are becoming an increasingly important market for MDI, and we currently believe that per-capita demand for MDI in Asia will continue to increase as its less-developed economies continue to grow.
There are four major global producers of MDI: Bayer, our company, BASF and Dow, which, according to Nexant, had 24%, 24%, 20% and 16%, respectively, of global MDI production capacity in 2003. We believe it is unlikely that any new global producers of MDI will emerge in the foreseeable future due to the substantial requirements for entry such as the limited availability of licenses for MDI technology and the substantial capital commitment and integration that is required to develop both the necessary technology and the infrastructure to manufacture and market MDI.
TDI. The consumers of TDI consist primarily of numerous manufacturers of flexible foam blocks sold for use as furniture cushions and mattresses. Flexible foam is typically the first polyurethane market to become established in developing countries because smaller local plants can be constructed using technology and intermediate chemicals that are easier to obtain than those required for MDI production. As a result, TDI production typically precedes MDI production in developing markets. The four largest TDI producers supplied approximately 60% of global TDI demand in 2003, according to Nexant.
TPU. TPU is a high-quality fully formulated thermal plastic derived from the reaction of MDI or an aliphatic isocyanate with polyols to produce unique qualities such as durability, flexibility, strength, abrasion-resistance, shock absorbency and chemical resistance. We can tailor the performance characteristics of TPU to meet the specific requirements of our customers. TPU is used in injection molding and small components for the automotive and footwear industries. It is also extruded into films, wires and cables for use in a wide variety of applications in the coatings, adhesives, sealants and elastomers markets. According to Nexant, the market capacity for TPU in 2003 was approximately 660 million pounds per year.
Polyols. Polyols are combined with MDI, TDI and other isocyanates to create a broad spectrum of polyurethane products. In the U.S., approximately 80% of all polyols produced in 2003 were used in polyurethane applications, according to Nexant. Demand for specialty polyols has been growing at approximately the same rate at which MDI consumption has grown.
Aniline. Aniline is an intermediate chemical used primarily to manufacture MDI. Approximately 80% of all aniline produced is consumed by MDI producers, while the remaining 20% is consumed by synthetic rubber and dye producers. According to Nexant, global capacity for aniline was approximately 6.9 billion pounds per year in 2003. Generally, most aniline is either consumed internally by the producers of the aniline or is sold to third parties under long-term supply contracts. We believe that the lack of a significant spot market for aniline means that in order to remain competitive, MDI manufacturers must either be integrated with an aniline manufacturing facility or have a long-term cost-competitive aniline supply contract.
88
PO. PO is an intermediate chemical used mainly to produce a wide range of polyols and PG. The following chart illustrates the primary end markets and applications for PO and their respective percentages of global PO consumption for 2003:
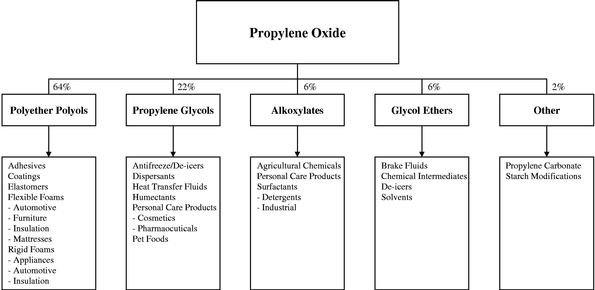
Source: Nexant
Demand for PO depends largely on overall economic demand, especially that of consumer durables. According to Nexant, consumption of PO in the U.S. represented approximately one-third of global consumption in 2003. According to Nexant, U.S. consumption of PO was approximately 3.9 billion pounds in 2003, growing from 2.5 billion pounds in 1990, which represents a 3.5% compound annual growth rate.
Two U.S. producers, Lyondell and Dow, accounted for approximately 90% of North American PO production in 2003, according to Nexant. We believe that Dow consumes the majority of its North American PO production in its North American downstream operations and that a significant amount of Lyondell's North American PO production is consumed internally or sold to Bayer, which acquired Lyondell's polyols business.
Propylene glycol is derived from PO and is used in the production of UPR, antifreeze, industrial coolants and de-icers and liquid laundry detergents, as well as in food, pharmaceutical, and personal care products. According to Nexant, world capacity for production of propylene glycol in 2003 was 3.8 billion pounds, of which approximately 40%, or 1.5 billion pounds, was located in the U.S.
MTBE. We currently use our entire production of TBA, a co-product of our PO production process, to produce MTBE. MTBE is an oxygenate that is blended with gasoline to reduce harmful vehicle emissions and to enhance the octane rating of gasoline. Historically, the refining industry utilized tetra ethyl lead as the primary additive to increase the octane rating of gasoline until health concerns resulted in the removal of tetra ethyl lead from gasoline. This led to the increasing use of MTBE as a component in gasoline during the 1980s. According to Nexant, U.S. consumption of MTBE grew at a compound annual rate of 14.6% in the 1990s due primarily to the implementation of federal environmental standards that require improved gasoline quality through the use of oxygenates. MTBE has experienced historical growth due to its ability to satisfy the oxygenation requirement of amendments to the Clean Air Act of 1990 (the "Clean Air Act") with respect to exhaust emissions of carbon monoxide and hydrocarbon emissions from automobile engines. Some regions of the U.S. adopted this oxygenate requirement to improve air quality even though they were not mandated to do so by the Clean Air Act. The use of MTBE is controversial in the U.S. and elsewhere and may be substantially curtailed or eliminated in the future by legislation or regulatory action. See "—Environmental, Health and Safety Matters—MTBE Developments."
89
Sales and Marketing
We manage a global sales force, with 40 locations in 35 countries, which sells our polyurethane chemicals to over 2,000 customers in more than 90 countries. Our sales and technical resources are organized to support major regional markets, as well as key end-use markets which require a more global approach. These key end-use markets include the appliance, automotive, footwear, furniture and coatings, construction products, adhesives, sealants and elastomers industries.
We provide a wide variety of polyurethane solutions as components (i.e., the isocyanate or the polyol) or in the form of "systems" in which we provide the total isocyanate and polyol formulation to our customers in ready-to-use form. Our ability to deliver a range of polyurethane solutions and technical support tailored to meet our customers needs is critical to our long term success. We have strategically located our polyurethane formulation facilities, commonly referred to in the chemicals industry as "systems houses," close to our customers, enabling us to focus on customer support and technical service. We believe this customer support and technical service system contributes to customer retention and also provides opportunities for identifying further product and service needs of customers. We manufacture TDI and polyols primarily to support our MDI customers' requirements.
We believe that the extensive market knowledge and industry experience of our sales teams and technical experts, in combination with our strong emphasis on customer relationships, have facilitated our ability to establish and maintain long-term customer supply positions. Due to the specialized nature of our markets, our sales force must possess technical knowledge of our products and their applications. Our strategy is to continue to increase sales to existing customers and to attract new customers by providing innovative solutions, quality products, reliable supply, competitive prices and superior customer service.
Based on current production levels, we have entered into long-term contracts to provide up to 45% of our PO capacity to one customer at specified prices through 2007. The balance of our PO capacity is used to produce PO for use internally or to be sold to a number of industrial accounts. Other contracts provide for the sale of our MTBE production to ChevronTexaco and BP. More than 70% of our annual MTBE production of our Port Neches, Texas PO/MTBE plant is committed to ChevronTexaco under a contract expiring in 2007 and to BP. In addition, over 40% of our current annual PG production is sold pursuant to long-term contracts.
Manufacturing and Operations
According to Nexant, we own the world's two largest and lowest-cost MDI production facilities in terms of capacity, located in Geismar, Louisiana and Rozenburg, Netherlands. These facilities receive aniline, which is a primary material used in the production of MDI, from our facilities located in Geismar, Louisiana and Wilton, U.K., which are the world's two largest aniline facilities as determined by production capacity, according to Nexant. We believe that this relative scale and product integration provide a significant competitive advantage over other producers. In addition to reducing transportation costs for our raw materials, integration helps reduce our exposure to cyclical prices. Since 1996, we have invested over $600 million to significantly enhance our production capabilities through the rationalization of our older, less efficient facilities and the modernization of our newer facilities at Rozenburg and Geismar.
90
The following table sets forth the annual production capacity of polyurethane chemicals at each of our polyurethanes facilities:
| |
MDI |
TDI |
Polyols |
TPU |
Aniline |
Nitrobenzene |
PO |
PG |
MTBE(1) |
|||||||||
|---|---|---|---|---|---|---|---|---|---|---|---|---|---|---|---|---|---|---|
| |
(millions of pounds) |
|||||||||||||||||
| Geismar, Louisiana | 860 | 90 | 160 | 715 | (2) | 935 | (2) | |||||||||||
| Port Neches, Texas | 525 | 145 | 260 | |||||||||||||||
| Ringwood, Illinois | 20 | |||||||||||||||||
| Rozenburg, Netherlands | 660 | 120 | ||||||||||||||||
| Wilton, U.K. | 670 | 880 | ||||||||||||||||
| Osnabrück, Germany | 20 | 30 | ||||||||||||||||
| Total | 1,520 | 90 | 300 | 50 | 1,385 | 1,815 | 525 | 145 | 260 | |||||||||
At both our Geismar and Rozenburg facilities we utilize sophisticated proprietary technology to produce our MDI. This technology, which will be used in our world scale JV in Shanghai, China, contributes to our position as the lowest cost MDI operator in the industry. In addition to MDI, we use a proprietary manufacturing process to manufacture PO. We own or license all technology, know-how and patents developed and utilized at our PO facility. Our process combines isobutane and oxygen in proprietary oxidation (peroxidation) reactors, thereby forming TBHP and TBA, which are further processed into PO and MTBE, respectively. Because our PO production process is less expensive relative to other technologies and allows all of our PO co-products to be processed into saleable or useable materials, we believe that our PO production technology possesses several distinct advantages over its alternatives.
We also operate polyurethane systems houses in Deerpark, Australia; Shanghai, China; Cartagena, Colombia; Deggendorf, Germany; Thane (Maharashtra), India; Ternate, Italy; Tlalnepantla, Mexico; Mississauga, Ontario; Kuan Yin, Taiwan; and Samuprakam, Thailand.
We currently market approximately 95% of our MTBE to customers located in the U.S. for use as a gasoline additive. If the use of MTBE in gasoline in the U.S. is further curtailed or eliminated in the future, we believe that we will be able to export MTBE to Europe, Asia or South America, although this may produce a lower level of cash flow than the sale of MTBE in the U.S. We may also elect to use all or a portion of our precursor TBA to produce saleable products other than MTBE. If we opt to produce products other than MTBE, necessary modifications to our facilities will require us to make significant capital expenditures and the sale of such other products may produce a lower level of cash flow than the sale of MTBE.
Joint Ventures
Rubicon Joint Venture. We and Crompton Corporation own Rubicon LLC, which owns aniline, nitrobenzene and DPA manufacturing facilities in Geismar, Louisiana. We are entitled to approximately 78% of the nitrobenzene and aniline production capacity of Rubicon LLC, and Crompton Corporation is entitled to 100% of the DPA production. In addition to operating the joint venture's owned aniline, nitrobenzene and DPA facilities, Rubicon LLC also operates our wholly owned MDI, TDI and polyol facilities at Geismar and is responsible for providing other auxiliary services to the entire Geismar complex. As a result of this joint venture, we are able to achieve greater scale and lower costs for our products than we would otherwise have been able to obtain.
91
Chinese MDI Joint Ventures. In January 2003, we entered into two related joint venture agreements to build MDI production facilities near Shanghai, China. The Chinese Manufacturing JV with BASF and three Chinese chemical companies will build three plants to manufacture MNB, aniline, and crude MDI. We effectively own 35% of the Chinese Manufacturing JV. The Chinese Splitting JV, with Shanghai Chlor-Alkali Chemical Company, Ltd., will build a plant to manufacture pure MDI, polymeric MDI and MDI variants. We own 70% of the Chinese Splitting JV. A feasibility study for the project has been approved by the appropriate Chinese authorities, preliminary engineering work has commenced and a business license was issued in March 2003, making the joint ventures the first entities with foreign investors to receive a license to construct an integrated MDI plant in China.
The project will be funded by a combination of equity invested by the joint venture partners and borrowed funds. We anticipate that our investment in the joint ventures and other related capital costs will be approximately $85 million. Upon expected completion in 2006, the production capacity of this facility will be 525 million pounds per year.
Raw Materials
The primary raw materials for MDI-based polyurethane chemicals are benzene and PO. Benzene is a widely available commodity that is the primary feedstock for the production of MDI and aniline. Historically, benzene has been the largest component of our raw material costs. We use the benzene produced in our Base Chemicals segment and purchase benzene from third parties to manufacture nitrobenzene and aniline, almost all of which we then use to produce MDI. Our vertical integration provides us with a competitively priced supply of feedstocks and reduces our exposure to supply interruption.
A major cost in the production of polyols is attributable to the costs of PO. The integration of our PO business with our polyurethane chemicals business gives us access to a competitively priced, strategic source of PO and the opportunity to develop polyols that enhance our range of MDI products. The primary raw materials used in our PO production process are butane/isobutane, propylene, methanol and oxygen, which accounted for 57%, 24%, 16% and 3%, respectively, of total raw material costs in 2003. We purchase our raw materials primarily under long-term contracts. While most of these feedstocks are commodity materials generally available to us from a wide variety of suppliers at competitive prices in the spot market, all the propylene used in the production of our PO is produced internally and delivered through a pipeline connected to our PO facility.
Competition
The following table sets forth our competitors in the polyurethane chemicals business:
| |
Share of Global Production Capacity (2003) |
Share of U.S. Production Capacity (2003) |
|||||||||
|---|---|---|---|---|---|---|---|---|---|---|---|
| |
MDI |
TDI |
PO |
Polyols |
PG |
||||||
| Huntsman | 24 | % | 2 | % | 4 | % | 4 | % | 10 | % | |
| BASF | 20 | % | 18 | % | 6 | % | 12 | % | — | ||
| Bayer | 24 | % | 17 | % | 2 | % | 29 | % | — | ||
| Dow | 16 | % | 13 | % | 27 | % | 27 | % | 46 | % | |
| Lyondell | — | 12 | % | 23 | % | — | 39 | % | |||
| Others | 16 | % | 38 | % | 38 | % | 28 | % | 5 | % | |
| 100 | % | 100 | % | 100 | % | 100 | % | 100 | % | ||
Source: Nexant
92
While these competitors produce various types and quantities of polyurethane chemicals, we focus on MDI and MDI-based polyurethane systems. We compete based on technological innovation, technical assistance, customer service and product reliability. Our polyurethane chemicals business competes in two basic ways: (1) where price is the dominant element of competition, our polyurethane chemicals business differentiates itself by its high level of customer support including cooperation on technical and safety matters; and (2) elsewhere, we compete on the basis of product performance and our ability to react quickly to changing customer needs and by providing customers with innovative solutions to their needs.
Advanced Materials
General
We are a leading global manufacturer and marketer of technologically advanced epoxy, acrylic and polyurethane-based polymer products. We focus on formulations and systems that are used to address customer-specific needs in a wide variety of industrial and consumer applications. Our products are used either as replacements for traditional materials such as metal, wood, clay, glass, stone and ceramics, or in applications where traditional materials do not meet demanding engineering specifications. For example, structural adhesives are used to replace metal rivets and advanced composites are used to replace traditional aluminum panels in the manufacture of aerospace components. Revenue growth for much of our product portfolio has historically been well in excess of global GDP growth. Our Advanced Materials segment is characterized by the breadth of our product offering, our expertise in complex chemistry, our long-standing relationships with our customers and our ability to develop and adapt our technology and our applications expertise for new markets and new applications. We operate 15 Advanced Materials synthesis and formulating facilities in North America, Europe, Asia, South America and Africa. We market over 6,000 products to more than 5,000 customers in over 20 end-markets, which are grouped as follows:
| Market Groups |
End Markets |
|
|---|---|---|
| Adhesives | adhesives, consumer/do it yourself ("DIY"), aerospace, DVD, LNG transport | |
Electrical and Electronics Materials |
electrical power transmission, distribution and generation, printed circuit boards, consumer and industrial electronics |
|
Structural Composites |
aerospace, wind power generation, automotive, electronic laminates, recreational sports equipment |
|
Surface Technologies |
civil engineering, shipbuilding and marine maintenance, automotive, consumer appliances, food and beverage packaging |
|
Tooling and Modeling Materials |
automotive, aerospace, industrial, medical |
Since completing the AdMat Transaction in June 2003, we have initiated a comprehensive restructuring program designed to reduce our costs and transform our Advanced Materials segment from a product-driven business to a market-focused business. This program includes optimization of our global supply chain, reductions in general and administrative costs and the consolidation and centralization of support functions across Advanced Materials and with our other businesses. We have
93
closed or announced the closure of manufacturing facilities in Quillan, France and Thomastown, Australia and have significantly reduced or downsized the scale of our operations in Bergkamen, Germany and East Lansing, Michigan. We have also closed sales and administrative offices in seven locations. Through September 30, 2004 we have reduced our global headcount by approximately 339 people.
Market and Product Overview
Adhesives. Overview. The high-growth structural adhesives market requires high-strength "engineering" adhesives for use in the manufacture and repair of items to bond various engineering substrates. Our business focus is on engineering adhesives based on epoxy, polyurethane, acrylic and other technologies which are used to bond materials such as steel, aluminum, engineering plastics and composites in substitution of traditional joining techniques. Our Araldite® brand name has considerable value in the industrial and consumer adhesives markets. In many countries, Araldite® is synonymous with high-performance adhesives and we generally believe that this is the value-added segment of the market where recognition of our long-standing Araldite® brand is a key competitive advantage. We also believe that products marketed under the Araldite® name are generally less price-sensitive than the brands of our competitors. Packaging is a key characteristic of our adhesives products. Our range of adhesives is sold in a variety of packs and sizes, specifically targeted to three specific end-markets and sold through specifically targeted routes to market:
Our key customers for our adhesives products include Airbus, Boeing, Bostik, Daewoo, GE, General Dynamics, Gray & Adams, Hexcel, Idemitsu, Johnson Electric, Optical Disc Service, Pratt & Whitney, Samsung, Technicolor, Toray and Warner Music.
Market Trends. We have observed the following significant trends emerging in the markets for our products used in adhesives applications:
94
Competition. We face substantial competition for the sale of our products for adhesives applications. Competition in the industry specific market segments is based on an understanding of the relevant industry sector and the ability to provide highly reliable and tailored engineering solutions, applications expertise and ease of use with the customer's processing equipment. Competition in the consumer market segment is based on branding, packaging and making widely available, easy-to-use products on which our customers can rely. We believe that our competitive strengths are our focus on defined market needs, provision of a high level of service and recognition as a quality supplier in the chosen sectors, all of which are exemplified by our strong Araldite® brand name. The principal participants in the structural adhesives market include Henkel/Loctite, ITW, National Starch, Sika, 3M and many other regional or industry specific competitors.
Electrical and Electronics Materials. Overview. Our electrical materials are formulated polymer systems, which make up the insulation materials used in equipment for the generation, transmission and distribution of electrical power, such as transformers, switch gears, ignition coils, sensors, motors, and magnets, and for the protection of electrical and electronic devices and components. The purpose of these products is to insulate, protect or shield either the environment from electrical current or electrical devices from the environment, such as temperature or humidity. Our electrical insulating materials target two key market segments, the heavy electrical equipment market and the light electrical equipment market.
Products for the heavy electrical equipment market segment are used in power plant components, devices for power grids and insulating parts and components. In addition, there are numerous devices, such as motors and magnetic coils used in trains and medical equipment, which are manufactured using epoxy and related technologies. Products for the light electrical equipment market segment are used in applications such as industrial automation and control, consumer electronics, car electronics and electrical components. The end customers in the electrical insulating materials market encompass the relevant original equipment manufacturer ("OEM") as well as numerous manufacturers of components used in the final products.
Our electrical materials business is a long-standing, certified global supplier to major manufacturers of electrical equipment such as ABB, Alstom, Bosch, Philips, Samsung, Schneider Electric, Shunde, Siemens and Sony.
We also develop, manufacture and market materials used in the production of printed circuit boards. Our products are ultimately used in industries ranging from telecommunications and personal computer mother board manufacture to automotive electronic systems manufacture. Our printed circuit board technologies business has three product lines:
95
Soldermasks are our most important product line in the printed circuit board technologies business, particularly in Europe. Sales are made mainly under the Probimer®, Probimage®, and Probelec® trademarks. Probimer® is a widely recognized brand name for soldermasks. Our key customers for our electronics products in the printed circuit board market include Adiboard, AT&S, Compeq, Coretec, Elec & Eltek, Hitachi, Kansai Paint, NanYa BCB Co., Nippon Paint, Photocircuits NY, Ruwel, Sanmina, Via Systems and Wuerth Elektronic.
Market Trends. We have observed the following significant trends emerging in the markets for our products used for electrical and electronics materials:
Heavy electrical:
Light electrical:
Printed circuit board:
Competition. Competition for electrical insulating materials applications is based on technology, know-how, applications expertise, formulations expertise, reliability, performance and price. Manufacturers of heavy electrical equipment place more importance on reliability and level of support, while manufacturers of light electrical equipment choose materials offering the lowest cost, but also the required quality and performance. As a result, epoxy products, which offer a combination of price and performance superior to competing polyurethane and silicone and conventional glass and ceramic products, are widely used in heavy electrical equipment, and both epoxy and cheaper polyurethane products are used in light electrical equipment.
We believe that our competitive strengths in the electrical materials market are our long-standing customer relationships, product reliability and technical performance. Our key products used in heavy electrical and light electrical applications, such as resins, hardeners and auxiliaries, are tested and certified according to industry standards established by Underwriters Laboratories, International Electrotechnical Commission or Cenelec and also to customer-specific requirements. Our main competitors in the electrical insulating materials market segment include Altana, Bakelite, Schenectady, Wuxi, Dexter-Hysol, Hitachi Chemical, Nagase Chemtex, Toshiba Chemical and Vagnone & Boeri.
96
Competition in the printed circuit board materials business is based on price, technological innovation and the ability to provide process expertise and customer support. Consolidation among our customers has led to increased pricing pressure. We believe that our competitive strengths are our fully developed technology, our application technology center in Basel, Switzerland and our technology center under construction in Panyu, China, our global presence and long-standing relationships with key customers and OEMs, and the approval of our products by global OEMs. Major competitors of our soldermask business include Atotec, Coates, Cookson, Goo, Peters, Taiyo Ink and Tamura. Major competitors for our liquid resist business include Chung Yu, Eternal and Shipley.
Structural Composites. Overview. A structural composite is made by combining two or more different materials such as fibers, resins and other specialty additives to create a product with enhanced structural properties. Specifically, structural composites are lightweight, high-strength, rigid materials with high resistance to chemicals, moisture and high temperatures. Our product range comprises basic and advanced epoxy resins, curing agents, other advanced chemicals and additives and formulated polymer systems utilizing a variety of these products used in reinforced structures. The four key target markets for our structural composites are aerospace, industrial (mainly windmill blades for wind power generation and automotive applications), recreational (mainly sports equipment such as skis and tennis racquets) and electronic laminates used to manufacture printed circuit boards. Structural composites continue to be substituted for traditional materials, such as metals and wood, in a wide variety of applications due to their light weight, strength and durability. A key industry trend is the increased emphasis on customer collaboration, especially in the aerospace industry, where consistent quality of products is essential. Customers are increasingly seeking higher performance characteristics (such as improved temperature resistance). Our key customers for our structural composites products include Advanced Composites, Atomic, BMW, Bonus Energy, Cytec, Dow, GE Wind Energy, Guangdon Shengyi, Hexcel, Loctite, Polyclad, Rossignol, Toray and Vestas.
Market Trends. We have observed the following significant trends emerging in the markets for our products used in structural composite applications:
Aerospace:
Automotive, industrial and recreational:
Electronic laminates:
97
Competition. Competition in structural composites applications varies but is primarily driven by technology, know-how, applications expertise, formulations expertise, product performance, customer service and customer certification. We believe that our competitive strengths are our strong technology base, broad range of value-added products, leading market positions, diverse customer base and reputation for customer service. Pricing dynamics differ greatly among the various end-markets, largely due to their differing structures. Pricing in the aerospace market very much reflects the advanced technology and applications know-how which we provide to customers. Pricing is typically more competitive in the industrial and recreational markets due to the more standardized requirements of the end-user market and higher sales volumes compared to those of the aerospace business. Competition in the electrical laminates industry is largely price-driven due to the standard nature of the products supplied, the highly price-sensitive nature of the electronics industry and the ability of customers to source globally. Our competitors in the structural composites business include Bakelite, DIC, Dow, Mitsui, Resolution Performance Products and Sumitomo. In the aerospace business, we compete principally with Mitsui and Sumitomo. Our competitors in the automotive, industrial and recreational business include Resolution Performance Products, Dow and Bakelite. Finally, our competitors in the laminates business include all of these companies as well as NanYa.
Surface Technologies. Overview. Our surface technologies products are used for the protection of steel and concrete substrates, such as floorings, metal furniture and appliances, buildings, linings of storage tanks and food and beverage cans, and the primer coat of automobile bodies and ships, among other applications. Epoxy-based surface coatings are among the most widely used industrial coatings, due to their structural stability and broad application functionality combined with overall economic efficiency. We focus our efforts in coating systems applications in utilizing our applications expertise and broad product range to provide formulated polymer systems to our customers. We believe our range of curing agents, matting agents, accelerators, cross-linkers, reactive diluents and thermoplastic polyamides, together with our basic and advanced epoxy resin compounds, distinguish us in the various end markets for coating systems. Our key customers for our coatings products include Akzo Nobel, Ameron, Asian Paint Industrial, BASF, DuPont, Rohm & Haas, Rinol, Sherwin Williams, Sigma Coatings, Sika and Valspar.
Market Trends. Trends in the markets for our various coating systems applications generally are being driven to a great extent by regulation, including the imposition of tougher environmental regulations regarding volatile organic compounds. These regulations have caused coatings manufacturers to seek to replace solvent-based coatings with water-based, high solids, powder and ultraviolet curable coatings. In our major markets for coating systems, we have identified the following significant trends:
98
Competition. Competition in coating systems is primarily driven by product performance, service and customer certification. We believe that the competitive strengths of our coating systems business are our strong technology base, broad range of value-added products, leading market positions, diverse customer base and reputation for customer service. Our major competitors for formulated polymer systems and complex chemicals and additives used in coatings systems are Air Products, Arizona, Bakelite, Cognis, Cray Valley and Degussa.
Competition in basic liquid and solid epoxy resins is primarily driven by price. There are two major manufacturers of basic epoxy resins used in industrial protective coatings, Dow and Resolution Performance Products. Other participants in this market include Air Products, BASF, Kukdo, Leuna and NanYa. Competition in coating systems is increasingly becoming more global, with trends toward industry consolidation and the emergence of new competitors in Asia. Our competitors are considerably more fragmented in Asia than in Europe and North America.
Tooling and Modeling Materials. Overview. We produce mainly polyurethane-based and epoxy formulated polymer systems used in the production of models, prototypes, patterns, molds and a variety of related products for design, prototyping and short-run manufacture. Our products are used extensively in the automotive, aerospace and industrial markets as productivity tools to quickly and efficiently create accurate prototypes and develop experimental models, and to lower the cost of manufacturing items in limited quantities primarily using computer-aided-design techniques. Our tooling and modeling materials are used because of their strength, resilience, high temperature resistance or dimensional stability coupled with low shrinkage and ease of cure. In applications where ease and speed of processing, size of finished product and low abrasion are more important, polyurethane resins are gaining increasing recognition. We separate the overall tooling and modeling materials market into two distinct groups: standard tooling and modeling materials and stereolithography technology.
Our standard tooling and modeling materials are polymer-based materials used by craftsmen to make the traditional patterns, molds, models, jigs and fixtures required by the foundry, automotive, ceramics and other such industries. Techniques have evolved with computer-aided-design and modern engineering processes. Customers wishing to produce a model of a design require a rapid method of producing such a model. We provide consumables to be used in high technology machinery made by manufacturers to produce these models. In developing these solutions, we have worked closely with consumers to meet their demands. We are well-placed to drive the development of the market through our strong leadership position and wide breadth of application expertise.
Stereolithography is a technology that is used to accurately produce physical three-dimensional models directly from computer-aided-design data without cutting, machining or tooling. The models are produced by selectively curing a light-sensitive liquid resin with a laser beam. Stereolithography is the most accurate technology commercially available for producing complex three-dimensional models. Models produced using this technology have a high-quality finish with fine detail. Stereolithography can be used for a variety of applications, including the production of concept models, master models, prototypes used for functional testing, tools and for short-run production parts. We sell our stereolithography products to customers in the aerospace, appliance, automotive, consumer, electronics and medical markets.
Our key customers for our tooling and modeling materials products include Arrk, BMW, Boeing, Daimler Chrysler, Elenics, Ford, Freeman, GMC, Honda, Incs, Lego, Mattel, Motorola, MS Composites, Pratt & Whitney, Toyota and Vestas.
Market Trends. We have observed the following significant trends emerging in the markets for our tooling and modeling products:
99
Competition. Competition in standard tooling and modeling solutions is based on quality of service, technical solutions, range, competitive prices and prompt supply, including 24-hour delivery if required. This market segment is generally characterized by pricing pressure and intense competition. Competition in stereolithography is driven by the requirement for innovative solutions. We believe that our competitive strength is our broad range of products, which we make available on a global basis, covering all of the needs of both our standard tooling and modeling and stereolithography customers. A few large manufacturers (including Axson, DSM and Sika), as well as many small, local manufacturers provide a limited product range to local regions in the plastic tooling and modeling solutions market but none have our breadth of product offering.
Sales and Marketing
We maintain multiple routes to market to service our diverse customer base. These routes to market range from using our own direct sales force to targeted, technically-oriented distribution to mass general distribution. Our direct sales force targets sales and specifications to engineering solutions decision-makers at major customers who purchase significant amounts of products from us. We use technically-oriented specialist distributors to augment our sales effort in niche markets and applications where we do not believe it is appropriate to develop direct sales resources. We use mass general distribution channels to sell our products into a wide range of general applications where technical expertise is less important to the user of the products to reduce our overall selling expenses. We believe our use of multiple routes to market enables us to reach a broader customer base at an efficient cost.
We conduct the sales activities for our market groups through separate dedicated regional sales forces in the Americas, Europe, Africa and the Middle East ("EAME") and Asia. Our global customers are covered by key account managers who are familiar with the specific requirements of their clients. The management of long-standing customer relationships, some of which are 20 to 30 years old, is at the heart of the sales and marketing process. We are also supported by a strong network of distributors. We serve a highly fragmented customer base. In the last twelve months, we marketed over 6,000 products to more than 5,000 customers. In addition, our largest customer accounted for less than 3% of our revenues during the year ended December 31, 2003.
For our consumer adhesives, we have entered into exclusive branding and distribution arrangements with, for example, Bostik in Europe and Shelleys in Australia. Under these arrangements, our distribution partners fund advertising and sales promotions, negotiate and sell to major retail chains, own inventories and provide store deliveries (and sometimes shelf merchandising) in exchange for a reliable, high-quality supply of Araldite® branded, ready-to-sell packaged products.
Manufacturing and Operations
We are a global business serving customers in three principal geographic regions: EAME; North and South America; and Asia Pacific. To service our customers efficiently, we maintain 15 manufacturing plants around with the world with a strategy of global, regional and local manufacturing
100
employed to optimize the level of service and minimize the cost to our customers. The table below summarizes the plants that we currently operate:
| Location |
Description of Facility |
|
|---|---|---|
| Bergkamen, Germany(1) | Synthesis Facility | |
| Monthey, Switzerland | Resins and Synthesis Facility | |
| Pamplona, Spain | Resins and Synthesis Facility | |
| McIntosh, Alabama | Resins and Synthesis Facility | |
| Chennai, India(2) | Resins and Synthesis Facility | |
| Bad Saeckingen, Germany(3) | Formulating Facility | |
| Duxford, U.K. | Formulating Facility | |
| Sadat City, Egypt | Formulating Facility | |
| Taboão da Serra, Brazil | Formulating Facility | |
| Kaohsiung, Taiwan | Formulating Facility | |
| Panyu, China(3)(4) | Formulating Facility | |
| Thomastown, Australia(5) | Formulating Facility | |
| East Lansing, Michigan | Formulating Facility | |
| Istanbul, Turkey(3) | Formulating Facility | |
| Los Angeles, California | Formulating Facility |
Our facilities in Asia are well-positioned to take advantage of the market growth that is expected in this region. Furthermore, we believe that we are the largest producer of epoxy resin compounds in India.
Raw Materials
The principal raw materials we purchase for the manufacture of basic and advanced epoxy resins are epichlorohydrin, bisphenol A, tetrabromobisphenol A and BLR. We also purchase amines, polyols, isocyanates, acrylic materials, hardeners and fillers for the production of our formulated polymer systems and complex chemicals and additives. Raw material costs constitute a sizeable percentage of sales for certain applications, particularly surface technologies. We have supply contracts with a number of suppliers, including, for example, Dow. The terms of our supply contracts vary. In general, these contracts contain provisions that set forth the quantities of product to be supplied and purchased and formula based pricing.
Additionally, we produce some of our most important raw materials, such as BLR and its basic derivatives, which are the basic building blocks of many of our products. We are the third largest producer of BLR in the world. Approximately 50% of the BLR we produce is consumed in the production of our formulated polymer systems. The balance of our BLR is sold as liquid or solid resin in the merchant market, allowing us to increase the utilization of our production plants and lower our overall BLR production cost. We believe that manufacturing a substantial proportion of our principal raw material gives us a competitive advantage over other epoxy-based polymer systems formulators, most of whom must buy BLR from third-party suppliers. This position helps protect us from pricing pressure from BLR suppliers and aids in providing us a stable supply of BLR in difficult market conditions.
We consume certain amines produced by our Performance Products segment and isocyanates produced by our Polyurethanes segment, which we use to formulate advanced materials products. In some cases, we use tolling arrangements with third parties to convert our Base Chemicals products into certain of our key raw materials.
101
Performance Products
General
Our Performance Products segment is organized around three business groups, performance specialties, performance intermediates, and maleic anhydride and licensing, and serves a wide variety of consumer and industrial end markets. In performance specialties, we are a leading global producer of amines, carbonates and certain specialty surfactants. Growth in demand in our performance specialties business tends to be driven by the end-performance characteristics that our products deliver to our customers. These products are manufactured for use in a growing number of niche industrial end uses and have been characterized by growing demand and stable profitability. For example, we are one of two significant global producers of polyetheramines, for which our sales volumes have grown at a compound annual rate of over 13% in the last ten years due to strong demand in a number of industrial applications, such as epoxy curing agents, fuel additives and civil construction materials. In performance intermediates, we consume internally produced and third-party-sourced base petrochemicals in the manufacture of our surfactants, LAB and ethanolamines products, which are primarily used in detergent and consumer products applications. We also produce EG, which is primarily used in the production of polyester fibers and PET packaging, and EO, all of which is consumed internally in the production of our downstream products. We believe we are North America's largest and lowest-cost producer of maleic anhydride. Maleic anhydride is the building block for UPRs, mainly used in the production of fiberglass reinforced resins for marine, automotive and construction products. We are the leading global licensor of maleic anhydride manufacturing technology and are also the largest supplier of catalyst used in the manufacture of maleic anhydride. We operate 16 Performance Products manufacturing facilities in North America, Europe and Australia.
Our Products. We have the annual capacity to produce approximately 960 million pounds of more than 250 amines and other performance chemicals. We believe we are the largest global producer of polyetheramines, propylene carbonates, ethylene carbonates and morpholine, the second-largest global producer of ethyleneamines and the third-largest North American producer of ethanolamines. We also produce DGA™ and substituted propylamines. These products are manufactured at our Port Neches, Conroe and Freeport, Texas facilities and at our facilities in Llanelli, U.K. and Petfurdo, Hungary. We use internally produced ethylene, EO, EG and PO in the manufacture of many of our amines. Our amines are used in a wide variety of consumer and industrial applications, including personal care products, polyurethane foam, fuel and lubricant additives, paints and coatings, solvents and catalysts. Our key amines customers include Akzo, ChevronTexaco, Cognis, Hercules, Monsanto and PPG.
We have the capacity to produce approximately 2.8 billion pounds of surfactant products annually at our 10 facilities located in North America, Europe and Australia. Our surfactants business is a leading global manufacturer of nonionic, anionic, cationic and amphotenic surfactants products and is characterized by its breadth of product offering and market coverage. Our surfactant products are primarily used in consumer detergent and industrial cleaning applications. In addition, we manufacture and market a diversified range of mild surfactants and specialty formulations for use in baby shampoos and other personal care applications. We are also a leading European producer of powder and liquid laundry detergents and other cleaners. In addition, we offer a wide range of surfactants and formulated specialty products for use in various industrial applications such as leather and textile treatment, foundry and construction, agrochemicals, polymers and coatings. Our key surfactants customers include Ecolab, Huish, L'Oreal, Monsanto, Nufarm, Procter & Gamble and Unilever.
We are North America's second-largest producer of LAB, with capacity of 400 million pounds per year at our plant in Chocolate Bayou, Texas. LAB is a surfactant intermediate which is converted into LAS, a major anionic surfactant used worldwide for the production of consumer, industrial and institutional laundry detergents. We have also developed a process for the manufacture of a higher-molecular-weight LAB product to be used as an additive to lubricants. Our key customers for LAB include Colgate, Henkel, Lubrizol, Procter & Gamble and Unilever.
102
We are North America's largest producer of maleic anhydride, a highly versatile chemical intermediate that is used to produce UPRs, which are mainly used in the production of fiberglass reinforced resins for marine, automotive and construction products. We have the capacity to produce approximately 240 million pounds annually at our facility located in Pensacola, Florida. We also own a 50% interest in Sasol-Huntsman GmbH & Co. KG, which owns and operates a facility in Moers, Germany with an annual capacity of 125 million pounds. We supply our catalysts to licensees and to worldwide merchant customers, including supplying catalyst to two of the three other U.S. maleic anhydride producers. As a result of our long-standing research and development efforts aided by our pilot and catalyst preparation plants, we have successfully introduced six generations of our maleic anhydride catalysts. Revenue from licensing and catalyst comes from new plant commissioning, as well as current plant retrofits and catalyst change schedules. Our key maleic anhydride customers include AOC, ChevronTexaco, Cook Composites, Dixie, Lubrizol and Reichhold.
We also have the capacity to produce approximately 945 million pounds of EG annually at our facilities in Botany, Australia and Port Neches, Texas.
Industry Overview
Performance Specialties. The following table shows the end-market applications for our performance specialties products:
| Product Group |
Applications |
|
|---|---|---|
| Specialty Amines | liquid soaps; personal care; lubricant and fuel additives; polyurethane foams; fabric softeners; paints and coatings; refinery processing; water treating | |
| Polyetheramines | polyurethane foams and insulation; construction and flooring; paints and coatings; lubricant and fuel additives; adhesives | |
| Ethyleneamines | lubricant and fuel additives; epoxy hardeners; wet strength resins; chelating agents; fungicides | |
| Morpholines/DGA™ and Gas Treating | hydrocarbon processing; construction chemicals; synthetic rubber; water treating; electronics applications; gas treatment and agriculture | |
| Carbonates | lubricant and fuel additives; agriculture; electronics applications; textile treatment | |
| Specialty Surfactants | agricultural herbicides; construction; paper de-inking |
Our performance specialties products are organized around the following end markets: coatings, polymers and resins; process additives; resources, fuels and lubricants; and agrochemicals.
Amines. Amines broadly refers to the family of intermediate chemicals that are produced by reacting ammonia with various ethylene and propylene derivatives. Generally, amines are valued for their properties as a reactive, emulsifying, dispersant, detergent, solvent or corrosion inhibiting agent. Growth in demand for amines is highly correlated with GDP growth due to its strong links to general industrial and consumer products markets. However, certain segments of the amines market, such as polyetheramines, have grown at rates well in excess of GDP growth due to new product development, technical innovation, and substitution and replacement of competing products. For example, polyetheramines are used by customers who demand increasingly sophisticated performance characteristics as an additive in the manufacture of highly customized epoxy formulations, enabling the
103
customers to penetrate new markets and substitute for traditional curing materials. As amines are generally sold based upon the performance characteristics that they provide to customer-specific end use application, pricing for amines tends to be stable and does not generally fluctuate with movements in underlying raw materials.
Morpholine/DGA™. Morpholine and DGA™ are produced as co-products by reacting ammonia with DEG. Morpholine is used in a number of niche industrial applications including rubber curing (as an accelerator) and flocculants for water treatment. DGA™ is primarily used in gas treating, electronics, herbicides and metalworking end-use applications.
Carbonates. Ethylene and propylene carbonates are manufactured by reacting EO and PO with carbon dioxide. Carbonates are used as solvents and as reactive diluents in polymer and coating applications. They are also increasingly being used as a photo-resist solvent in the manufacture of printed circuit boards and the production of lithium batteries. Also, propylene carbonates have recently received EPA approval for use as a solvent in certain agricultural applications. We expect these solvents to replace traditional aromatic solvents that are increasingly subject to legislative restrictions and prohibitions.
Performance Intermediates. The following table sets forth the end markets for products made in our performance intermediates business:
| Product Group |
End Markets |
||
|---|---|---|---|
| Surfactants | |||
| Alkoxylates | household detergents; industrial cleaners; anti-fog chemicals for glass; asphalt emulsions; shampoos; polymerization additives; de-emulsifiers for petroleum production | ||
| Sulfonates/Sulfates | powdered detergents; liquid detergents; shampoos; body washes; dishwashing liquids; industrial cleaners; emulsion polymerization; concrete superplasticizers; gypsum wallboard | ||
| Esters and Derivatives | shampoo; body wash; textile and leather treatment | ||
| Nitrogen Derivatives | bleach thickeners; baby shampoo; fabric conditioners; other personal care products | ||
| Formulated Blends | household detergents; textile and leather treatment; personal care products; pharmaceutical intermediates | ||
| EO/PO Block Co-Polymers | automatic dishwasher detergents | ||
| Ethanolamines | wood preservatives; herbicides; construction; gas treatment; metalworking | ||
| LAB | consumer detergents; industrial and institutional detergents; synthetic lubricants | ||
| EG | polyester fibers and PET bottle resins; antifreeze | ||
Surfactants. Surfactants or "surface active agents" are substances that combine a water-soluble component with a water insoluble component in the same molecule. While surfactants are most commonly used for their detergency in cleaning applications, they are also valued for their emulsification, foaming, dispersing, penetrating and wetting properties in a variety of industries. While
104
growth in demand for surfactants is highly correlated with GDP growth due to its strong links with the household cleaning and general industrial markets, Nexant expects certain segments of the surfactants market, including personal care, to grow faster than GDP.
According to Nexant, global demand in 2003 for surfactants was approximately 24 billion pounds. Demand growth for surfactants is relatively stable and exhibits little cyclicality. The main consumer product applications for surfactants can demand new formulations with unproved performance characteristics, and as a result life cycles for these consumer end products can often be quite short. This affords considerable opportunity for innovative surfactants manufacturers like us to provide surfactants and blends with differentiated specifications and properties. For basic surfactants, pricing tends to have a strong relationship to underlying raw material prices and usually lags petrochemical price movements. However, pricing in recent years has also been adversely affected by the growing purchasing power of "soapers," such as Procter & Gamble and Unilever. The "big box" stores, such as Wal-mart and Costco have also placed pricing pressure along the surfactant value chain.
Ethanolamines. Ethanolamines are a range of chemicals produced by the reaction of EO with ammonia. They are used as intermediates in the production of a variety of industrial, agricultural and consumer products. There are a limited number of competitors due the technical and cost barriers to entry. Growth in this sector has typically been higher than GDP and in the last few years has benefited in particular from the conversion to ethanolamines in the formulation of wood treatment products. The ethanolamine market in North America is tight with industry operating rates currently running in excess of 90% of stated capacity. Despite these high operating rates in ethanolamines, there are no new announced capacity expansions. We expect all producers to evaluate debottlenecking initiatives to meet the expected market demand.
LAB. LAB is a surfactant intermediate which is produced through the reaction of benzene with either normal paraffins or linear alpha olefins. Nearly all the LAB produced globally is converted into LAS, a major anionic surfactant used worldwide for the production of consumer, industrial and institutional laundry detergents.
Four major manufacturers lead the traditional detergency market for LAB in North America: Procter & Gamble, Henkel, Unilever and Colgate Palmolive. According to Nexant, these four largest detergent manufacturers consume approximately 700 million pounds of LAB annually in North America. According to Nexant, worldwide, there are some 22 producers of LAB, but 65% of capacity lies in the hands of seven producers, with two or three major players in each of the three regional markets. According to Nexant, global capacity for LAB is 6.6 billion pounds, approximately 1.9 billion pounds of which is installed in the Americas. Although the North American market for LAB is mature, Nexant expects the South American market to grow as detergent demand grows at a faster rate than in more developed countries. Nexant expects any excess LAB capacity in North America to be sold into the growing South American markets.
For several years through 2002, our LAB business benefited from a market environment where the supply/demand balance for LAB in the Americas was favorable for producers and prices for alternate products had not been very competitive. From a competition perspective, compounds derived from alcohol and its derivatives can be used in place of LAB in certain detergent formulations. In the past year, a significant amount of new alcohol production capacity has come on stream resulting in lower prices for these alcohol-based compounds. As a result, LAB has become less attractive to buyers who have the option to formulate their products with either of these two raw materials and as a result, margins for LAB producers have come under pressure.
EG. We consume our internally produced EO to produce three types of EG: MEG, DEG and TEG. According to Nexant, total demand for MEG in North America in 2003 was 6.2 billion pounds, with demand growing at a compound growth rate of 2.2% since 1992. MEG is consumed primarily in the polyester (fiber and bottle resin) and antifreeze end markets, which, together, according to Nexant,
105
comprised approximately 61% and 30% of MEG demand, respectively, in 2003. EG is also used in a wide variety of industrial applications including synthetic lubricants, plasticizers, solvents and emulsifiers.
The EG supply/demand balance in North America is fairly tight, with average industry operating rates of approximately 90% in the first half of 2004, according to Nexant. Due to continued strong demand for polyester fibers, particularly in Asia, Nexant expects margins to continue to improve in the near term. However, new capacity in Asia and the Middle East will come on line by 2006, alleviating the current tightness in the supply/demand balance.
Maleic Anhydride and Licensing. The following table sets forth the end markets for products made in our maleic anhydride business:
| Product Group |
End Markets |
|
|---|---|---|
| Maleic anhydride | boat hulls; automotive; construction; lubricant and fuel additives; countertops; agrochemicals; paper; and food additives | |
Maleic anhydride catalyst and technology licensing |
maleic anhydride and BDO manufacturers |
Maleic anhydride is a chemical intermediate that is produced by oxidizing either benzene or normal butane through the use of a catalyst. The largest use of maleic anhydride in the U.S. is in the production of UPRs, which we believe account for approximately 57% of U.S. maleic anhydride demand. UPR is the main ingredient in fiberglass reinforced resins, which are used for marine and automotive applications and commercial, and residential construction products.
Our maleic anhydride technology is a proprietary fixed bed process with solvent recovery and is characterized by low butane consumption and an energy-efficient, high-percentage-recovery solvent recovery system. This process competes against two other processes, the fluid bed process and the fixed bed process with water recovery. We believe that our process is superior in the areas of feedstock and energy efficiency and solvent recovery. The maleic anhydride-based route to BDO manufacture is currently the preferred process technology and is favored over the other routes, which include PO, butadiene and acetylene as feedstocks. As a result, the growth in demand for BDO has resulted in increased demand for our maleic anhydride technology.
Total U.S. demand for maleic anhydride is approximately 525 million pounds. Over time, demand for maleic anhydride has generally grown at rates that slightly exceed GDP growth. However, given its dependence on the UPR market, which is heavily influenced by construction end markets, demand can be cyclical. Pricing for maleic anhydride in North America over the past several years has been stable. Generally, changes in price have resulted from changes in industry capacity utilization as opposed to changes in underlying raw material costs.
Sales and Marketing
We sell over 2,000 products to over 4,000 customers globally through our marketing group, which has extensive market knowledge, considerable chemical industry experience and well established customer relationships.
Our performance specialties businesses are organized around end-use market applications, such as coatings, polymers and resins and agrochemical. In these end uses, our marketing efforts are focused on how our product offerings perform in certain customer applications. We believe that this approach enhances the value of our product offerings and creates opportunities for on-going differentiation in our development activities with our customers. Our performance intermediates and maleic anhydride
106
businesses organize their marketing efforts around their products and geographic regions served. We also provide extensive pre-and post-sales technical service support to our customers where our technical service professionals work closely with our research and development functions to tailor our product offerings to meet our customers unique and changing requirements. Finally, these technical service professionals interact closely with our market managers and business leadership teams to help guide future offerings and market approach strategies.
In addition to our focused direct sales efforts, we maintain an extensive global network of distributors and agents that also sell our products. These distributors and agents typically promote our products to smaller end use customers who cannot cost effectively be served by our direct sales forces.
Manufacturing and Operations
Our Performance Products segment has the capacity to produce approximately 6.5 billion pounds annually of a wide variety of specialty, intermediate and commodity products and formulations at 16 manufacturing locations in North America, Europe and Australia.
These production capacities are as follows:
| |
Current capacity |
||||||||
|---|---|---|---|---|---|---|---|---|---|
| Product Area |
North America |
Europe |
Australia |
Total |
|||||
| |
(millions of pounds) |
||||||||
| Performance Specialties | |||||||||
| Amines | 415 | 130 | (1) | 545 | |||||
| Specialty surfactants | 100 | 100 | 100 | 300 | |||||
| Carbonates | 75 | 75 | |||||||
Performance Intermediates |
|||||||||
| EO | 1,000 | 100 | 1,100 | ||||||
| EG | 890 | 55 | 945 | ||||||
| Surfactants | 860 | 1,590 | 2,450 | ||||||
| Ethanolamines | 340 | 340 | |||||||
| LAB | 400 | 400 | |||||||
Maleic anhydride |
240 |
125 |
(2) |
365 |
|||||
Our surfactants and amines facilities are located globally, with broad capabilities in amination, sulfonation and ethoxylation. These facilities have a competitive cost base and use modern manufacturing units that allow for flexibility in production capabilities and technical innovation.
Our primary EO, EG and ethanolamines facilities are located in Port Neches, Texas and adjacent to the olefins facility operated by our Base Chemicals segment, which results in a stable, cost-effective source of raw material for these ethylene derivatives. The Port Neches, Texas facility also benefits from extensive logistics infrastructure, which allows for efficient sourcing of other raw materials and distribution of finished products.
Our LAB facility in Chocolate Bayou, Texas and our maleic anhydride facility in Pensacola, Florida are both located within large, integrated petrochemical manufacturing complexes operated by Solutia. We believe this results in greater scale and lower costs for our products than we would be able to obtain if these facilities were stand-alone operations.
107
We have recently announced our intention to restructure our European surfactants business. This restructuring is expected to result in a significant downsizing of our Whitehaven, U.K. facility. This downsizing, along with actions at other European facilities, is expected to result in the reduction of approximately 320 employees throughout Europe over the next 15 months.
Raw Materials
We currently use approximately 850 million pounds of ethylene produced each year at our Port Arthur and Port Neches, Texas facilities in the production of EO and ethyleneamines. We consume all of our EO in the manufacture of our EG, surfactants and amines products. We also use internally produced PO and DEG in the manufacture of these products.
In addition to internally produced raw materials, our performance specialties business purchases over 250 compounds in varying quantities, the largest of which includes ethylene dichloride, caustic soda, synthetic alcohols, paraffin, nonyl phenol, ammonia, methylamines and acrylonitrile. The majority of these raw materials are available from multiple sources in the merchant market at competitive prices.
In our performance intermediates business, our primary raw materials, in additional to internally produced and third-party sourced EO, are synthetic and natural alcohols, fatty acids, paraffin, benzene and nonyl phenol. All of these raw materials are widely available in the merchant market at competitive prices.
Maleic anhydride is produced by the reaction of n-butane with oxygen using our proprietary catalyst. The principal raw material is n-butane which is purchased pursuant to long-term contracts and delivered to our Pensacola, Florida site by barge. Our maleic anhydride catalyst is toll-manufactured by Engelhard under a long-term contract according to our proprietary methods.
Competition
In our performance specialties business, there are few competitors for many of our products due to the considerable customization of product formulations, the proprietary nature of many of our product applications and manufacturing processes and the relatively high research and development and technical costs involved. Some of our global competitors include BASF, Air Products, Dow, and Akzo. We compete primarily on the basis of product performance, new product innovation and, to a lesser extent, on the basis of price.
There are numerous global producers of many of our performance intermediates products. Our main competitors include global companies such as Dow, Sasol, BASF, Petresa, Equistar, Shell, Cognis, Stepan and Kao, as well as various smaller or more local competitors. We compete on the basis of price with respect to the majority of our product offerings and, to a lesser degree, on the basis of product availability, performance and service with respect to certain of our more value-added products.
In our maleic anhydride business, we compete primarily on the basis of price, customer service and plant location. Our competitors include Lanxess, Koch, Ashland, Lonza and BASF. We are the leading global producer of maleic anhydride catalyst. Competitors in our maleic anhydride catalyst business include Scientific Design and BP. In our maleic anhydride technology licensing business, our primary competitor is Scientific Design. We compete primarily on the basis of technological performance and service.
108
Pigments
General
We are a leading global manufacturer and marketer of titanium dioxide, which is a white pigment used to impart whiteness, brightness and opacity to products such as paints, plastics, paper, printing inks, fibers and ceramics. According to IBMA, our Pigments segment, which operates under the trade name Tioxide®, is the fourth-largest producer of titanium dioxide in the world, with an estimated 12% of global production capacity, and the largest producer of titanium dioxide in Western Europe, with an estimated 23% of Western European production capacity. The global titanium dioxide market is characterized by a small number of large, global producers. We operate eight chloride-based and sulfate-based titanium dioxide manufacturing facilities located in North America, Europe, Asia and Africa.
We offer an extensive range of products that are sold worldwide to approximately 1,500 customers in all major titanium dioxide end markets and geographic regions. The geographic diversity of our manufacturing facilities allows our Pigments segment to service local customers, as well as global customers that require delivery to more than one location. Our diverse customer base includes Ampacet, A. Schulman, Akzo Nobel, Atofina, BASF, Cabot, Clariant, ICI, Jotun and PolyOne. Our pigments business has an aggregate annual nameplate capacity of approximately 590,000 tonnes at our eight production facilities. Five of our titanium dioxide manufacturing plants are located in Europe, one is in North America, one is in Asia, and one is in South Africa. Our North American operation consists of a 50% interest in a manufacturing joint venture with Kronos Worldwide, Inc.
Our Pigments segment is focused on cost control and productivity. In July 2004, we idled 15,000 tonnes of nameplate capacity at our Umbogintwini, South Africa facility, and we have announced that we will idle 40,000 tonnes of nameplate capacity at our Grimsby, U.K. facility by the end of 2004, which together represent about 10% of our total titanium dioxide production capacity. Through these closures and other cost saving measures, we will improve our cost position and enhance our ability to compete in the global marketplace. Our other cost saving measures include the optimization of the geographic distribution of our sales, the consolidation of back-office functions and the continued reduction of our fixed and variable costs at each of our manufacturing facilities.
Industry Overview
Global consumption of titanium dioxide was 4.1 million tonnes in 2003 according to IBMA. Historically, global titanium dioxide demand growth rates tend to closely track global GDP growth rates. However, the demand growth rate and its relationship with the GDP growth rate varies by region. Developed markets such as the U.S. and Western Europe exhibit higher absolute consumption but lower demand growth rates, while emerging markets such as Asia exhibit much higher demand growth rates. The titanium dioxide industry experiences some seasonality in its sales because paint sales generally peak during the spring and summer months in the northern hemisphere, resulting in greater sales volumes during the second and third quarters of the year.
There are two manufacturing processes for the production of titanium dioxide, the sulfate process and the chloride process. Most recent capacity additions have employed the chloride process technology and, currently, the chloride process accounts for approximately 69% of global production capacity according to IBMA. However, the global distribution of sulfate- and chloride-based titanium dioxide capacity varies by region, with the sulfate process being predominant in Europe, our primary market. The chloride process is the predominant process used in North America, and both processes are used in Asia. While most end-use applications can use pigments produced by either process, market preferences typically favor products that are locally available. According to IBMA, the chloride and sulfate manufacturing processes compete effectively in the marketplace.
109
The global titanium dioxide market is characterized by a small number of large global producers. The titanium dioxide industry currently has five major producers (DuPont, Millennium Chemicals, Kerr-McGee, our company and Kronos Worldwide), which accounted for approximately 75% of the global market share in 2003, according to IBMA. Titanium dioxide supply has historically kept pace with increases in demand as producers increased capacity through low cost incremental debottlenecks and efficiency improvements. According to IBMA, this trend is likely to continue with production growth of approximately 2% per year. During periods of low titanium dioxide demand, the industry experiences high stock levels and consequently reduces production to manage working capital. Because pricing in the industry is driven primarily by supply/demand balance, prices have tended to be driven down by lower capacity utilization during periods of weak demand. The last major greenfield titanium dioxide capacity addition was in 1994, and there are no currently announced plans for major greenfield titanium dioxide expansions. Based upon current price levels and the long lead times for planning, governmental approvals and construction, we do not expect significant additional greenfield capacity in the near future.
We believe that demand has recovered in 2004. In addition, capacity additions have been limited. These factors have resulted in higher industry operating rates and lower inventory levels. According to IBMA, in response to these trends, all major producers have recently announced price increases in all major markets, which is expected to result in improved profitability for the global titanium dioxide industry.
Sales and Marketing
Approximately 85% of our titanium dioxide sales are made through our direct sales and technical services network, enabling us to cooperate more closely with our customers and to respond to our increasingly global customer base. Our concentrated sales effort and local manufacturing presence have allowed us to achieve our leading market shares in a number of the countries where we manufacture titanium dioxide.
In addition, we have focused on marketing products to higher growth industries. For example, we believe that our pigments business is well-positioned to benefit from the projected growth in the plastics sector, which, according to IBMA, is expected to grow faster than the overall titanium dioxide market over the next several years. The table below summarizes the major end markets for our pigments products:
| |
2003 Global Market(1) |
Huntsman 2003 Sales |
|
|
|||||||||
|---|---|---|---|---|---|---|---|---|---|---|---|---|---|
| |
|
Global Market Compound Annual Growth Rate from 1992 to 2003(1) |
|||||||||||
| End Markets |
Size |
% of Total |
Volume |
% of Total |
Key Customers |
||||||||
| |
(thousands of tonnes) |
|
|
||||||||||
| Coatings | 2,538 | 62 | % | 304 | 59 | % | Akzo, ICI, Jotun, Sigma Kalon | 2.0 | % | ||||
| Plastics | 815 | 20 | % | 159 | 31 | % | A. Schulman, Ampacet, Cabot, GE, PolyOne | 4.3 | % | ||||
| Papers | 439 | 11 | % | 7 | 1 | % | Rock-Tenn, Portals Holdings | 2.5 | % | ||||
| Other | 289 | 7 | % | 47 | 9 | % | BASF, Sun-DIC, Teijin, Sensient | (1.7 | )% | ||||
| Total | 4,081 | 100 | % | 517 | 100 | % | 2.6 | % | |||||
110
Manufacturing and Operations
Our pigments business has eight manufacturing sites in seven countries with a total capacity of approximately 590,000 tonnes per year. Approximately 74% of our titanium dioxide capacity is located in Western Europe. The following table presents information regarding our titanium dioxide facilities:
| Region |
Site |
Annual Capacity |
Process |
|||
|---|---|---|---|---|---|---|
| |
|
(tonnes) |
|
|||
| Western Europe | Greatham, U.K | 100,000 | Chloride | |||
| Calais, France | 95,000 | Sulfate | ||||
| Grimsby, U.K.(1) | 80,000 | Sulfate | ||||
| Huelva, Spain | 80,000 | Sulfate | ||||
| Scarlino, Italy | 80,000 | Sulfate | ||||
| North America | Lake Charles, Louisiana(2) | 70,000 | Chloride | |||
| Asia | Teluk Kalung, Malaysia | 60,000 | Sulfate | |||
| Southern Africa | Umbogintwini, South Africa(3) | 25,000 | Sulfate | |||
| Total | 590,000 | |||||
We are well positioned to implement a number of low cost expansions of our Greatham, U.K. and Huelva, Spain plants. We are also well positioned to selectively invest in new plant capacity based upon our ICON chloride technology. ICON technology allows for the construction of new capacity with world-scale economics at a minimum nameplate size of 65,000 tonnes. We believe competing chloride technologies typically require a minimum capacity of 100,000 tonnes to achieve comparable economics. Our chloride additions can be more easily absorbed into the market, which provides higher investment returns than larger capacity additions.
Joint Ventures
We own a 50% interest in Louisiana Pigment Company L.P., a manufacturing joint venture located in Lake Charles, Louisiana. The remaining 50% interest is held by our joint venture partner, Kronos Worldwide. We share production offtake and operating costs of the plant equally with Kronos Worldwide, though we market our share of the production independently. The operations of the joint venture are under the direction of a supervisory committee on which each partner has equal representation.
Raw Materials
The primary raw materials used to produce titanium dioxide are titanium-bearing ores. We purchase the majority of our ore under long-term supply contracts with a number of ore suppliers. The majority of titanium-bearing ores are sourced from Australia, South Africa and Canada. Ore accounts for approximately 40% of pigment variable manufacturing costs, while utilities (electricity, gas and steam), sulfuric acid and chlorine collectively account for approximately 25% of our variable manufacturing costs.
The world market for titanium-bearing ores is dominated by Rio Tinto and Iluka, which account for approximately 55% of global supply. Both companies produce a range of ores for use in chloride and sulfate processes. We purchase approximately 75% of our ore from these two producers. New players, such as Taicor in South Africa and VV Minerals in India, have recently entered the market,
111
however, creating an oversupply of most products. Consequently, the price of most titanium-bearing ores has declined in the last five years, and the ability of major producers to control prices has diminished. Given the small number of suppliers and end-users of titanium-bearing ores, we typically enter into longer-term supply agreements with beneficial terms. Approximately 80% of our ore purchases are made under agreements with terms of three to five years.
Titanium dioxide producers extract titanium from ores and process it into pigmentary titanium dioxide using either the chloride or sulfate process. Once an intermediate titanium dioxide pigment has been produced, it is "finished" into a product with specific performance characteristics for particular end-use applications. The finishing process is common to both the sulfate and chloride processes and is a major determinant of the final product's performance characteristics.
The sulfate process generally uses less-refined ores that are cheaper to purchase but produce more co-product than the chloride process. Co-products from both processes require treatment prior to disposal in order to comply with environmental regulations. In order to reduce our disposal costs and to increase our cost competitiveness, we have developed and marketed the co-products of our pigments business. We sell over 50% of the co-products generated by our business.
Competition
The global markets in which our pigments business operates are highly competitive. Competition is based primarily on price. In addition, we also compete on the basis of product quality and service. The major global producers against whom we compete are DuPont, Kerr McGee, Kronos and Millennium. We believe that our competitive product offerings, combined with our presence in numerous local markets, makes us an effective competitor in the global market, particularly with respect to those global customers demanding presence in the various regions in which they conduct business.
Polymers
General
We manufacture and market polypropylene, polyethylene, EPS, EPS packaging and APAO. We consume internally produced and third-party-sourced base petrochemicals, including ethylene and propylene, as our primary raw materials in the manufacture of these products. In our polyethylene, APAO and certain of our polypropylene product lines, we pursue a targeted marketing strategy by focusing on those customers and end use applications that require customized polymer formulations. We produce these products at our smaller and more flexible Polymers manufacturing facilities and generally sell them at premium prices. In our other product lines, including the balance of our polypropylene, EPS and EPS packaging, we maintain leading regional market positions and operate cost-competitive manufacturing facilities. We operate six primary Polymers manufacturing facilities in North America and Australia. We are expanding the geographic scope of our polyethylene business and improving the integration of our European Base Chemicals business through the construction of an integrated, low-cost, world-scale LDPE plant to be located adjacent to our existing olefins facility in Wilton, U.K. Upon completion of this facility, which we expect will occur in late 2007, we will consume approximately 50% of the output from our U.K. ethylene unit in the production of LDPE.
Our Products
We have the capacity to produce approximately 430 million pounds of LDPE and 270 million pounds of LLDPE annually at our integrated Odessa, Texas facility. Our polyethylene customer base includes Ashland, Pliant and Sealed Air.
We produce a variety of grades of LDPE using both the tubular and autoclave processes. Many of the resins are designed to meet specific requirements of particular end users. Various types of
112
conversion equipment, including extension coating, blown and cast film extrusion, injection and blow molding, and other proprietary methods of extrusion, use these differentiated polyethylene resins to provide high clarity, durability and sealability performance characteristics. Liner grade (general-purpose) polyethylene ordinarily competes principally on the basis of price, while more differentiated polyethylene competes principally on the basis of product quality, performance specifications and, to a lesser extent, price. We participate in both market areas, but concentrate our efforts primarily in more differentiated areas.
Our LLDPE products contain octene copolymers and are sold into applications that require high performance properties such as strength, clarity, processability, and contains few resin imperfections (low gel). These products are used in wide variety of applications such as high performance flexible packaging, high clarity shrink films, barrier films, medical, artificial turf, and irrigation tubing. With our higher-performing product line, we compete with a limited number of competitors on the basis of product performance, and to a lesser extent, price.
We have the capacity to produce approximately 1 billion pounds of polypropylene annually at three production facilities: Longview, Texas with a capacity of approximately 720 million pounds per year; Marysville, Michigan with a capacity of approximately 185 million pounds per year; and Odessa, Texas with a capacity of approximately 120 million pounds per year. Our polypropylene customer base includes Advanced Composites, Ashland, Kerr, PolyOne and Precise Technologies.
We employ a variety of technologies to produce different grades of polypropylene, allowing us to participate in a wide range of polypropylene applications. We provide product solutions to processors and OEMs that require special or unique formulations or characteristics. Our products are used extensively in medical applications, caps and closures, higher value automotive parts, consumer durables, and furniture. Our in-reactor TPO products produced at our Marysville, Michigan facility have replaced more expensive compounded plastics. Our Odessa, Texas facility produces grades of polypropylene utilized for medical applications, specialty films and sheets and electronics packaging. These applications have allowed us to realize substantial premium prices over commodity polypropylene.
We have the capacity to produce approximately 95 million pounds of Rextac® APAO annually at our facility in Odessa, Texas. We are one of only two on-purpose producers of APAO in the U.S. Rextac® APAO is a proprietary, patented, low molecular weight, amorphous material that utilizes polypropylene as its primary raw material. It is used extensively in roofing materials, hot melt adhesives, laminations and wire and cable coatings. Our products are sold primarily in the U.S., although we also participate in the rapidly growing Asian market. Our APAO customer base includes Firestone Building Products, Kimberly-Clark and Johns Manville.
We have the capacity to produce approximately 250 million pounds of EPS annually at our facilities in North America and Australia. We sell into the construction industry, where the product is used for insulation, and into the small but rapidly growing insulated concrete form business. The products also are used in electronics and produce packaging applications. Our specialty grades include R-mer™ rubber modified EPS, fire retardant grades and low-pentane formulations. Our EPS customer base includes Aptco, Cellofoam, Life Like Products and Premier Industries.
We believe that the cost position of our Wilton, U.K. olefins facility uniquely positions it to be the site of a world-scale polyethylene production facility. While we export approximately one-third of our ethylene production each year from Wilton, U.K. to continental Europe, incurring significant shipping and handling costs, the U.K. annually imports approximately 1.9 billion pounds of polyethylene. We believe this provides an opportunity to capitalize on the low-cost operating position and extensive petrochemical infrastructure and logistics at the Wilton site. The announced LDPE facility is planned to have the capacity to produce approximately 900 million pounds of LDPE annually and is estimated to cost approximately $330 million to construct. A grant of approximately $30 million has been awarded
113
by the U.K. government, leaving a cost of $300 million to be borne by us. The facility is expected be operational in late 2007.
Industry Overview
Polymers markets are global commodity markets. Demand for polymers tends to be less susceptible to economic cycles than some of our base petrochemicals, as the products are generally sold into the packaging and consumer markets. Demand for LLDPE, which represents the growth segment of the polyethylene sector, and polypropylene has grown at rates well in excess of GDP growth as these products have replaced other polymers and materials (including wood, paper, glass and aluminum) due to their superior performance characteristics. Our polymers are subject to fluctuations in price as a result of supply and demand imbalances and feedstock price movements.
Competition is based on price, product performance, product quality, product deliverability and customer service. Polymers profitability is affected by the worldwide level of demand for polymers, along with vigorous price competition that may result from, among other things, new domestic and foreign industry capacity. In general, demand is a function of economic growth in the U.S., Europe and elsewhere around the world.
Polypropylene is one of the most versatile and among the fastest growing of the major polymers. Polypropylene is used in a wide variety of applications including toys, housewares, bottle caps, outdoor furniture, utensils and packaging film. Although polypropylene comes in many formulations, there are three basic grades: homopolymers (derived from the polymerization of propylene), random copolymers (derived from the polymerization of propylene and a small amount of ethylene), and impact copolymers (derived by first polymerizing propylene and then adding a small amount of polymerized ethylene). Polypropylene is rising in popularity relative to other higher cost polymers due to its overall product performance and its relatively low cost of production. Different polypropylene formulations are custom manufactured with a variety of characteristics to accommodate end users. These characteristics include high stiffness, dimensional stability, low moisture absorption, good electrical insulation and optical properties and resistance to acids, alkalis and solvents. New applications have accounted for significant growth in the past decade in areas such as polypropylene film and automotive parts for the replacement of heavier, more expensive materials.
Polyethylene represents by sales volume the most widely produced thermoplastic resin in the world. There are two basic grades of polyethylene resin, high density and low density. Within low density, there is a further differentiation between LDPE and LLDPE. LDPE is used in a wide variety of applications, including film packaging, molded furniture, toys, wire and cable insulation. While LLDPE is used in many of the same applications as LDPE, it is also used in caps and closures, stretch and shrink binding films and heavy duty shipping sacks due to its high strength characteristics. According to CMAI, during 2003, 27.1 billion pounds of polyethylene were produced in the U.S. The different grades, annual sales volumes and percentages of resins produced include LDPE, 7.1 billion pounds or 26%; LLDPE, 7.6 billion pounds or 28%; and HDPE, 12.4 billion pounds or 46%. LLDPE and LDPE are used in a wide variety of industrial and consumer applications, the largest of which is the film market. Flexible films are used in food and consumer packaging, medical applications and wrap film. Liner grade (general purpose) polyethylene ordinarily competes principally on the basis of price, while more differentiated polyethylene competes principally on the basis of product quality, performance specifications and, to a lesser extent, price.
EPS serves two primary end markets: the "block" EPS market and the "shape" EPS market. Block EPS is used largely by the construction industry and shape EPS is used largely in packaging applications. Historically, EPS has not been traded as an international commodity. As a result, we believe EPS prices have generally been significantly less volatile than those of other petrochemicals. Producers typically maintain strong links to the approximate 400 domestic molders, leading to product
114
differentiation and customization for clients. Molders are typically small, privately held companies that rely on strong supplier relationships.
| Product |
2003 U.S. Market Size (billions of pounds) |
Compound Annual Growth Rate (1992-2003) |
Markets |
Applications |
||||
|---|---|---|---|---|---|---|---|---|
LLDPE |
8.5 |
5.0 |
% |
film; injection molding; extrusion coating |
film packaging (food and medical), caps and closures, heavy duty shipping sacks |
|||
LDPE |
5.8 |
(0.9 |
)% |
film; injection molding; extrusion coating |
film packaging (food and medical), molded furniture, toys, wire and cable insulation |
|||
Polypropylene |
13.9 |
6.1 |
% |
injection molding; fibers and filaments; film |
toys, house-wares, bottle caps, outdoor furniture, utensils, packaging film, and clothing |
|||
EPS |
1.0 |
2.8 |
% |
block; shape |
construction, packaging |
Source: CMAI
Sales and Marketing
Our polymers business markets over 85% of its products through a direct, salaried sales force. Our sales force is organized by product line and by geographic region. We also utilize distributors to market certain of our products to smaller customers. Due to the diversity of products, technologies, and grades, we are able to compete across a broad range of markets without relying upon a few large customers. Approximately 6% of our polymers sales are channeled through two large distributors, which market to many small customers. No one customer constitutes more than 3% of sales.
Manufacturing and Operations
We have the capacity to produce approximately 2.3 billion pounds of polymers at our six plants located in North America and Australia.
Information regarding these facilities is set forth in the following chart:
| |
Odessa, Texas |
Longview, Texas |
Marysville, Michigan |
Peru, Illinois |
Mansonville Quebec, |
West Footscray, Australia |
Total |
|||||||
|---|---|---|---|---|---|---|---|---|---|---|---|---|---|---|
| |
(millions of pounds) |
|||||||||||||
| Ethylene | 800 | 800 | ||||||||||||
| Propylene | 300 | 300 | ||||||||||||
| LDPE | 430 | 430 | ||||||||||||
| LLDPE | 270 | 270 | ||||||||||||
| Polypropylene | 120 | 720 | 185 | 1,025 | ||||||||||
| APAO | 95 | 95 | ||||||||||||
| EPS | 185 | 40 | 25 | 250 | ||||||||||
| Styrene | 250 | 250 | ||||||||||||
115
Our Odessa, Texas olefins plant produces both ethylene and propylene. Ethylene is transferred to LDPE and LLDPE for polymerization, and is also utilized in polypropylene and APAO copolymer production. Ethylene capacity is greater than current polymer capacity. To maximize ethylene production, we produce cryogenic ethylene and sell it via tank car to customers without pipeline access. There are only two significant sellers of liquid ethylene, Sunoco and ourselves. This product is sold at a significant premium to market pricing for pipeline delivered ethylene.
Our Longview, Texas facility is among the newest, most technologically advanced and lowest cost facilities in North America. Incorporating the UNIPOL® gas phase production technology, this facility has the capability to produce a broad range of polypropylene grades. This facility is connected by pipeline to the Mont Belvieu, Texas propylene supply grid and has recently added railcar unloading infrastructure, giving it maximum raw material supply flexibility.
Our Marysville, Michigan facility's technology is ideally suited to produce special grades of co-polymer polypropylene. This technology allows the plant to produce higher value TPOs, which are used extensively in high-value specialty-automotive applications.
Our Peru, Illinois EPS facility is one of the world's largest EPS production facilities, with five reactors. The use of our proprietary one-step EPS production technology keeps production costs at the Peru facility among the lowest in the industry. Our Mansonville, Quebec EPS plant is a smaller plant with three reactors. The EPS is used primarily to produce packaging, which has historically been a premium market.
Our West Footscray, Australia facility, located near Melbourne, is Australia's only producer of styrene and EPS. We also produce phenolic and polyester resins and, in a 50% joint venture with Dow, polystyrene. We also own Australia's largest EPS/EPP molding business, with seven operations around the country.
Raw Materials
Our Odessa, Texas facility has access to numerous sources of NGL feedstocks. We operate a feedstock fractionator which separates ethane from other feedstock streams for use in our olefins unit.
Propylene is the most significant raw material used in the production of polypropylene. At our Longview, Texas and Marysville, Michigan sites we purchase chemical-grade propylene from third parties.
The primary raw material in the production of EPS is styrene. We purchase styrene for our Peru, Illinois and Mansonville, Quebec facilities at market price from unaffiliated third parties.
Competition
In 2003, there were approximately 9 domestic producers of LDPE resins, either as LDPE or as LLDPE. According to CMAI in 2003 these producers had an estimated combined annual rated production capacity of approximately 18 billion pounds. According to CMAI, the five largest domestic producers of both LDPE and LLDPE in 2002 were ExxonMobil, Dow, Equistar, Westlake and ChevronPhillips.
According to CMAI, there are currently 14 U.S. producers of polypropylene, operating 24 plants with approximately 18.3 billion pounds of annual capacity. The largest producer and marketer is ExxonMobil, followed by BP, Basell and Atofina. We are the eighth-largest U.S. producer of polypropylene.
According to CMAI, there are ten producers of EPS in North America, with total annual production capacity of approximately 1.5 billion pounds. We are the second-largest producer of EPS in North America. The other major EPS producers are BASF, NOVA Chemicals, Polioles SA and Styrochem.
116
General
We are a highly integrated North American and European producer of olefins and aromatics. We consume a substantial portion of our Base Chemicals products, such as ethylene, propylene and benzene, in our Performance Products and Polyurethanes segments. We believe this integration leads to higher operating rates for our Base Chemical assets, improved reliability of raw material supply for our other segments and reduced logistics and transportation costs. We operate four Base Chemicals manufacturing facilities located on the Texas Gulf Coast and in northeast England. These facilities are equipped to process a variety of oil- and natural gas-based feedstocks and benefit from their close proximity to multiple sources of these raw materials. This flexibility allows us to optimize our operating costs. These facilities also benefit from extensive underground storage capacity and logistics infrastructure, including pipelines, deepwater jetties and ethylene liquefaction facilities.
Olefins
In the U.S., we produce ethylene and propylene at our Port Arthur and Port Neches, Texas olefins manufacturing facilities. The Port Arthur steam cracker has the capacity to produce approximately 1.4 billion pounds of ethylene and approximately 800 million pounds of propylene per year and has the capability to process both light and heavy feedstock, giving us the opportunity to maximize profitability with an optimal selection of raw materials. The Port Neches facility has the capacity to produce approximately 400 million pounds of ethylene and approximately 400 million pounds of propylene per year and has the capability to process ethane and propane and to recover ethylene and propylene from refinery off-gas. Ethylene production at our Port Neches facility was idled in June 2001 and has been recently restarted, with full production expected in the fourth quarter of 2004. Substantial portions of our ethylene and propylene are used downstream in our Performance Products and Polyurethanes segments.
Our olefins facility at Wilton, U.K. is one of Europe's largest single-site and lowest cost olefins facilities, according to Nexant. Our Wilton facility has the capacity to produce approximately 1.9 billion pounds of ethylene, 880 million pounds of propylene and 225 million pounds of butadiene per year. The Wilton olefins facility benefits from its North Sea location and significant feedstock flexibility, which allows for processing of naphthas, condensates and NGLs. In addition, the facility benefits from extensive underground storage capacity and logistics infrastructure, including pipelines, deepwater jetties and ethylene liquefaction facilities.
We are the fourth-largest U.S. producer of butadiene with annual capacity of approximately 900 million pounds. We sell all the butadiene we produce to several large consumers, including Bayer, Bridgestone/Firestone, Invista and Goodyear, who process it further into products such as synthetic rubber for tires, fiber for nylon carpet and foam for carpet backing. Feedstock for our large U.S. butadiene plant includes all of the crude butadiene produced as a byproduct in our olefins unit and crude butadiene purchased on long-term contracts from other olefin producers. Our U.S. butadiene production facility is located in close proximity to a number of our customers' plant locations, allowing us to connect to these customers by pipelines. Our smaller U.K. facility processes only our byproduct butadiene and ships almost entirely to customers located in the U.K.
Aromatics
We are the second-largest U.S. producer of cyclohexane and have the capacity to produce approximately 630 million pounds of cyclohexane annually at our Port Arthur, Texas facility. Virtually all cyclohexane is converted to other intermediate chemicals used to produce Nylon 6 and Nylon 6,6 synthetic fibers and resins. The nylon fibers are used to manufacture products such as hosiery, upholstery, carpet and tire cord, and the resins are used in engineered plastic applications. The Port
117
Arthur facility extracts benzene from byproduct streams produced by our olefins facility. We also purchase byproduct streams from neighboring facilities.
We produce aromatics in Europe at our two integrated manufacturing facilities located in Wilton, U.K. and North Tees, U.K. According to Nexant, we are a leading European producer of cyclohexane with 725 million pounds of annual capacity, a leading producer of paraxylene with 800 million pounds of annual capacity and are among Europe's larger producers of benzene with 1,200 million pounds of annual capacity. We use most of the benzene produced by our aromatics operations internally in the production of nitrobenzene for our Polyurethanes business and for the production of cyclohexane. The balance of our European aromatics production is sold to several key customers.
We also have the capacity to produce approximately 160 million gallons of MTBE annually at our Port Neches, Texas facility. In 2003, we produced approximately 100 million gallons of MTBE from the conversion of byproduct isobutylenes that we extracted from our unit and neighboring refineries. MTBE is blended into gasoline as an octane enhancer and as an oxygenate, which reduces carbon monoxide and other harmful motor vehicle emissions. See "—Environmental, Health and Safety Matters—MTBE Developments."
Industry Overview
Petrochemical markets are global commodity markets. However, the olefins market is subject to some regional price differences due to the more limited inter-regional trade resulting from the high costs of product transportation. The global petrochemicals market is cyclical and is subject to pricing swings due to supply and demand imbalances, feedstock prices (primarily driven by crude oil and natural gas prices) and general economic conditions.
The following table sets forth the global market size, growth rate, uses and end markets for the major olefins and aromatics we produce:
| Product |
2003 Global Market Size |
Compound Annual Growth Rate (1992-2003) |
Uses |
End Markets |
||||
|---|---|---|---|---|---|---|---|---|
| |
(billions of pounds) |
|
|
|
||||
Ethylene |
212 |
4.4 |
% |
polyethylene, ethylene oxide, polyvinyl chloride, alpha olefins, styrene |
packaging materials, plastics, housewares, beverage containers, personal care |
|||
Propylene |
129 |
6.2 |
% |
polypropylene, propylene oxide, acrylonitrile, isopropanol |
clothing fibers, plastics, automotive parts, foams for bedding and furniture |
|||
Butadiene |
20 |
3.3 |
% |
SBR rubber, polybutadiene, SB latex |
automotive, carpet |
|||
Benzene |
78 |
4.6 |
% |
polyurethanes, polystyrene cyclohexane, cumene, styrene/SBR |
appliances, automotive components, detergents, personal care, packaging materials, carpet |
|||
Paraxylene |
44 |
9.1 |
% |
polyester, PTA |
fibers, textiles, beverage containers |
|||
Cyclohexane |
8.8 |
2.5 |
% |
nylon 6, nylon 6,6 |
fibers, resins |
Source: Nexant
118
The olefins markets in both North America and Western Europe are supplied by numerous producers, none of whom has a dominant position in terms of its share of production capacity. Major producers include BP, Dow, Equistar, ExxonMobil, Sabic and Shell. According to Nexant, global ethylene consumption in 2003 was 212 billion pounds, representing an average industry operating rate of 86%, and global propylene consumption in 2003 was 129 billion pounds, representing an average industry operating rate of 85%.
The aromatics market, which is primarily composed of cyclohexane, benzene and paraxylene, is characterized by several major producers, including BP, ChevronPhillips, Dow, ExxonMobil and Shell. According to Nexant, the global markets for most aromatics products have recently recovered from the cyclical lows experienced over the last several years as demand has increased due to recent growth in demand for certain derivative products, including polyester fibers and PET packaging resins. Also, new capacity additions have been limited, which has resulted in higher industry operating rates. According to Nexant, the current global industry operating rate for benzene is approximately 81%, while the current global industry operating rates for cyclohexane and paraxylene are 80% and 87%, respectively.
Sales and Marketing
In recent years, our sales and marketing efforts have focused on developing long-term contracts with customers to operate our facilities at maximum rates, while maintaining very low selling expenses and administration costs. In 2003, over 61% and 79% of our primary petrochemicals sales volume in North America and Europe, respectively, was made under contracts of a year or more. In addition, we delivered over 84% and 65% of our petrochemical products volume in North America and Europe, respectively, in 2003 by pipeline. Major aromatics customers include BASF, Bayer, DupontSA, Invista, Rhodia and Solutia. Major olefins customers include BP, Dow, DuPont, EVC, Nova, Shell and Solvay.
In North America, we benefit from our pipeline system that extends over 600 miles, which we use to transport feedstocks and intermediate and finished products. In the U.K., we own or have access to major pipeline systems connecting our plants to our customers. Our finished product pipelines allow us to ship ethylene, propylene and butadiene directly to our customers at very low cost. Addition of new pipeline connections represents a significant barrier to potential competitors. We believe that the wide coverage of our pipeline system, coupled with the proximity of both customers and suppliers, gives us a competitive advantage both in receiving raw materials and in delivering ethylene and propylene to our key customers.
Manufacturing and Operations
The annual production capacities of our olefins and aromatics facilities is set forth below:
| |
Port Arthur, Texas |
Port Neches, Texas |
Odessa, Texas(1) |
Wilton, U.K. |
North Tees, U.K. |
Total |
||||||
|---|---|---|---|---|---|---|---|---|---|---|---|---|
| |
(millions of pounds) |
|||||||||||
| Ethylene | 1,400 | 400(2) | 800 | 1,900 | 4,500 | |||||||
| Propylene | 800 | 400(2) | 300 | 880 | 2,380 | |||||||
| Butadiene | 900 | 225 | 1,125 | |||||||||
| Paraxylene | 800 | 800 | ||||||||||
| Benzene | 480 | 1,200 | 1,680 | |||||||||
| Cyclohexane | 630 | 725 | 1,355 | |||||||||
| MTBE(3) | 160 | 160 | ||||||||||
119
Raw Materials
The primary raw materials that we use as feedstocks in our Base Chemicals business are hydrocarbons produced as byproducts of the refining crude oil and natural gas, such as ethane, propane and butane. These materials are actively traded on the spot and futures markets and are readily available from multiple sources. We benefit from our locations in Texas, where we neighbor Mont Belvieu, which is a hub for the distribution of these feedstocks, and in the U.K., where we are able to take advantage of our pipeline system and our proximity to refineries located near the North Sea.
In the U.S., pipelines allow us to transport liquid hydrocarbon feedstocks from Mont Belvieu, Texas to our Port Arthur and Port Neches facilities. We are tied into the extensive industry pipeline grid for receipt of natural gases and NGLs, and have dock and tank facilities for receipt of feedstocks by tanker and barge.
Our North Tees facility, situated on the northeast coast of England, is near a substantial supply of oil, natural gas and chemical feedstocks. Due to our location at North Tees, we have the option to purchase feedstocks from a variety of sources. However, we have elected to procure the majority of our naphtha, condensates and NGLs from local producers as they have been the most economical sources. In order to secure the optimal mix of the required quality and type of feedstock for our petrochemical operations at fully competitive prices, we regularly engage in the purchase and sale of feedstocks.
Competition
The markets in which our base chemicals business operates are highly competitive. Our competitors in the olefins and aromatics business include BP, Dow, Equistar, ExxonMobil, Sabic and Shell. While the market for most of these products is global, prices tend to be set regionally. These industries are characterized by companies that have large market shares in specific regions. The primary factors for competition in this business are price, reliability of supply and customer service. The technology used in these businesses is mature and widely available.
Research and Development
On a historical basis, for the nine months ended September 30, 2004 and the fiscal years 2003, 2002 and 2001, we spent $62.2 million, $65.6 million, $23.8 million, $32.7 million, respectively, on research and development of our products.
We support our business with a major commitment to research and development, technical services and process engineering improvement. Our research and development centers are currently located in Austin, Texas and Everberg, Belgium. Other regional development/technical service centers are located in Odessa, Texas (polymers); Billingham, England (pigments); Auburn Hills, Michigan (polymers and polyurethanes for the automotive industry); West Deptford, New Jersey, Derry, New Hampshire, Shanghai, China, Deggendorf, Germany and Ternate, Italy (polyurethanes); Ascot Vale, Australia (surfactants) and Port Neches, Texas and Wilton, U.K. for process engineering support. We have announced that we intend to close our Austin facility in mid-2005 and our West Deptford facility in late 2005. We intend to relocate the research and development capabilities of these two facilities to a new research and development center in The Woodlands, Texas that we expect to open in 2005.
We have leading technology positions, which contribute to our status as a low cost producer. Coordinated research, engineering and manufacturing activities across production and research and development locations facilitate these low cost positions.
Intellectual Property Rights
Proprietary protection of our processes, apparatuses, and other technology and inventions is important to our businesses. We own approximately 733 unexpired U.S. patents, approximately 181
120
patent applications (including provisionals) currently pending at the U.S. Patent and Trademark Office, and approximately 3,999 foreign counterparts, including both issued patents and pending patent applications. While a presumption of validity exists with respect to issued U.S. patents, we cannot assure that any of our patents will not be challenged, invalidated, circumvented or rendered unenforceable. Furthermore, we cannot assure the issuance of any pending patent application, or that if patents do issue, that these patents will provide meaningful protection against competitors or against competitive technologies. Additionally, our competitors or other third parties may obtain patents that restrict or preclude our ability to lawfully produce or sell our products in a competitive manner.
We also rely upon unpatented proprietary know-how and continuing technological innovation and other trade secrets to develop and maintain our competitive position. There can be no assurance, however, that confidentiality agreements into which we enter and have entered will not be breached, that they will provide meaningful protection for our trade secrets or proprietary know-how, or that adequate remedies will be available in the event of an unauthorized use or disclosure of such trade secrets and know-how. In addition, there can be no assurance that others will not obtain knowledge of these trade secrets through independent development or other access by legal means.
In addition to our own patents and patent applications and proprietary trade secrets and know-how, we are a party to certain licensing arrangements and other agreements authorizing us to use trade secrets, know-how and related technology and/or operate within the scope of certain patents owned by other entities. We also have licensed or sub-licensed intellectual property rights to third parties.
We have associated brand names with a number of our products, and own approximately 110 U.S. trademark registrations, approximately 30 applications for registration currently pending at the U.S. Patent and Trademark Office, and approximately 4,331 foreign counterparts, including both registrations and applications for registration. However, there can be no assurance that the trademark registrations will provide meaningful protection against the use of similar trademarks by competitors, or that the value of our trademarks will not be diluted.
Employees
As of September 30, 2004, we employed approximately 11,600 people in our operations around the world. Approximately 3,200 of these employees are located in the U.S., while approximately 8,400 are located in foreign countries. We are a party to collective bargaining agreements which cover an aggregate of approximately 5,400 employees, approximately 900 of whom are located in the U.S. and approximately 4,500 of whom are located in foreign countries. We believe our relations with our employees are good.
Properties
We own or lease chemical manufacturing and research facilities in the locations indicated in the list below which we currently believe are adequate for our short-term and anticipated long-term needs. We own or lease office space and storage facilities throughout the U.S. and many foreign countries. Our principal executive offices are located at 500 Huntsman Way, Salt Lake City, Utah 84108. The following is a list of our material owned or leased properties where manufacturing, research and main office facilities are located.
121
Principal Facilities
The following table sets forth information regarding our principal facilities.
| Location |
Business Segment |
Description of Facility |
||
|---|---|---|---|---|
| Salt Lake City, Utah | — | Executive Offices | ||
| The Woodlands, Texas(1) | — | Operating Headquarters | ||
| Geismar, Louisiana(2) | Polyurethanes | MDI, TDI, Nitrobenzene(7), Aniline(7) and Polyols Manufacturing Facilities and Polyurethanes Systems House | ||
| Rozenburg, Netherlands(1) | Polyurethanes | MDI Manufacturing Facility, Polyols Manufacturing Facilities and Polyurethanes Systems House | ||
| West Deptford, New Jersey(3) | Polyurethanes | Polyurethane Systems House and Research Facility | ||
| Auburn Hills, Michigan(1) | Polyurethanes | Polyurethane Research Facility | ||
| Deerpark, Australia | Polyurethanes | Polyurethane Systems House | ||
| Cartagena, Colombia | Polyurethanes | Polyurethane Systems House | ||
| Deggendorf, Germany | Polyurethanes | Polyurethane Systems House | ||
| Ternate, Italy | Polyurethanes | Polyurethane Systems House | ||
| Shanghai, China(1) | Polyurethanes | Polyurethane Systems House | ||
| Thane (Maharashtra), India(1) | Polyurethanes | Polyurethane Systems House | ||
| Samuprakam, Thailand(1) | Polyurethanes | Polyurethane Systems House | ||
| Kuan Yin, Taiwan(1) | Polyurethanes | Polyurethane Systems House | ||
| Tlalnepantla, Mexico | Polyurethanes | Polyurethane Systems House | ||
| Mississauga, Ontario(1) | Polyurethanes | Polyurethane Systems House | ||
| Everberg, Belgium | Polyurethanes | Polyurethane Research Facility | ||
| Gateway West, Singapore(1) | Polyurethanes | Polyurethane Commercial Center | ||
| Derry, New Hampshire(1) | Polyurethanes | TPU Research Facility | ||
| Ringwood, Illinois(1) | Polyurethanes | TPU Manufacturing Facility | ||
| Osnabrück, Germany | Polyurethanes | TPU Manufacturing Facility | ||
| Port Neches, Texas(4) | Polyurethanes, Performance Products and Base Chemicals | Olefins, Aromatics, EO, EG, Amines and PO Manufacturing Facilities | ||
| Wilton, U.K. | Polyurethanes and Base Chemicals | Olefins and Aromatics Manufacturing Facilities and Aniline and Nitrobenzene Manufacturing Facilities | ||
| Bergkamen, Germany(5) | Advanced Materials | Synthesis Facility | ||
| Monthey, Switzerland | Advanced Materials | Resins and Synthesis Facility | ||
| Pamplona, Spain | Advanced Materials | Resins and Synthesis Facility | ||
| McIntosh, Alabama | Advanced Materials | Resins and Synthesis Facility | ||
| Chennai, India(6) | Advanced Materials | Resins and Synthesis Facility | ||
| Bad Saeckingen, Germany(1) | Advanced Materials | Formulating Facility | ||
| Duxford, U.K. | Advanced Materials | Formulating Facility | ||
| Sadat City, Egypt | Advanced Materials | Formulating Facility | ||
| Taboão da Serra, Brazil | Advanced Materials | Formulating Facility | ||
| Kaohsiung, Taiwan | Advanced Materials | Formulating Facility | ||
| Panyu, China(1)(7) | Advanced Materials | Formulating Facility | ||
| Thomastown, Australia(8) | Advanced Materials | Formulating Facility | ||
| East Lansing, Michigan | Advanced Materials | Formulating Facility | ||
| Istanbul, Turkey(1) | Advanced Materials | Formulating Facility | ||
| Los Angeles, California | Advanced Materials | Formulating Facility | ||
| Austin, Texas(9) | Performance Products | Research Facility | ||
| Conroe, Texas | Performance Products | Amines Manufacturing Facility | ||
| Dayton, Texas | Performance Products | Surfactant Manufacturing Facility | ||
| Chocolate Bayou, Texas(1)(10) | Performance Products | LAB Manufacturing Facility | ||
| Pensacola, Florida(1)(10) | Performance Products | Maleic anhydride Manufacturing Facility | ||
| St. Louis, Missouri(1)(10) | Performance Products | Maleic anhydride Processing Facility | ||
| Petfurdo, Hungary | Performance Products | Amines Manufacturing Facility | ||
| Botany, Australia | Performance Products | Surfactant Manufacturing Facility | ||
| Llanelli, U.K. | Performance Products | Amines Manufacturing Facility | ||
| Guelph, Ontario(11) | Performance Products | Surfactant Manufacturing Facility | ||
| St. Mihiel, France | Performance Products | Surfactant Manufacturing Facility | ||
| Lavera, France | Performance Products | Surfactant Manufacturing Facility | ||
122
| Castiglione, Italy | Performance Products | Surfactant Manufacturing Facility | ||
| Patrica/Frosinane, Italy | Performance Products | Surfactant Manufacturing Facility | ||
| Barcelona, Spain | Performance Products | Surfactant Manufacturing Facility | ||
| Whitehaven, U.K.(12) | Performance Products | Surfactant Manufacturing Facility | ||
| Freeport, Texas(1) | Performance Products | Amines Manufacturing Facility | ||
| Greatham, U.K. | Pigments | Titanium Dioxide Manufacturing Facility | ||
| Grimsby, U.K. | Pigments | Titanium Dioxide Manufacturing Facility | ||
| Calais, France | Pigments | Titanium Dioxide Manufacturing Facility | ||
| Huelva, Spain | Pigments | Titanium Dioxide Manufacturing Facility | ||
| Scarlino, Italy | Pigments | Titanium Dioxide Manufacturing Facility | ||
| Teluk Kalung, Malaysia | Pigments | Titanium Dioxide Manufacturing Facility | ||
| Lake Charles, Louisiana(13) | Pigments | Titanium Dioxide Manufacturing Facility | ||
| Umbogintwini, South Africa | Pigments | Titanium Dioxide Manufacturing Facility | ||
| Billingham, U.K. | Pigments | Titanium Dioxide Research and Technical Facility | ||
| Warrenville, Illinois(1) | Pigments | Titanium Dioxide North American Technical and Commercial Center | ||
| Peru, Illinois | Polymers | EPS Manufacturing Facility | ||
| Marysville, Michigan | Polymers | Polypropylene Manufacturing Facility | ||
| Longview, Texas(1) | Polymers | Polypropylene Manufacturing Facility | ||
| Odessa, Texas | Polymers | Polyethylene Manufacturing Facility | ||
| Mansonville, Quebec | Polymers | EPS Manufacturing Facility | ||
| West Footscray, Australia | Polymers | Polymers Manufacturing Facility | ||
| Port Arthur, Texas | Base Chemicals | Olefins and Aromatics Manufacturing Facility | ||
| Sour Lake, Texas | Base Chemicals | Various finished raw materials pipelines and storage facilities | ||
| North Tees, U.K.(1) | Base Chemicals | Aromatics Manufacturing Facility and Logistics & Storage Assets |
123
Environmental, Health and Safety Matters
General
We are subject to extensive federal, state, local and foreign laws, regulations, rules and ordinances relating to pollution, protection of the environment and the generation, storage, handling, transportation, treatment, disposal and remediation of hazardous substances and waste materials. In the ordinary course of business, we are subject to frequent environmental inspections and monitoring and occasional investigations by governmental enforcement authorities. In addition, our production facilities require operating permits that are subject to renewal, modification and, in certain circumstances, revocation. Actual or alleged violations of environmental laws or permit requirements could result in restrictions or prohibitions on plant operations, substantial civil or criminal sanctions, as well as, under some environmental laws, the assessment of strict liability and/or joint and several liability. Moreover, changes in environmental regulations could inhibit or interrupt our operations, or require us to modify our facilities or operations. Accordingly, environmental or regulatory matters may cause us to incur significant unanticipated losses, costs or liabilities.
Environmental, Health and Safety Systems
We are committed to achieving and maintaining compliance with all applicable environmental, health and safety ("EHS") legal requirements, and we have developed policies and management systems that are intended to identify the multitude of EHS legal requirements applicable to our operations, enhance compliance with applicable legal requirements, ensure the safety of our employees, contractors, community neighbors and customers and minimize the production and emission of wastes and other pollutants. Although EHS legal requirements are constantly changing and are frequently difficult to comply with, these EHS management systems are designed to assist us in our compliance goals while also fostering efficiency and improvement and minimizing overall risk to us.
EHS Capital Expenditures
We may incur future costs for capital improvements and general compliance under EHS laws, including costs to acquire, maintain and repair pollution control equipment. For the nine months ended September 30, 2004, our capital expenditures for EHS matters totaled $36.9 million. Since capital expenditures for these matters are subject to evolving regulatory requirements and depend, in part, on the timing, promulgation and enforcement of specific requirements, we cannot provide assurance that our recent expenditures will be indicative of future amounts required under EHS laws.
Governmental Enforcement Proceedings
On occasion, we receive notices of violation, enforcement and other complaints from regulatory agencies alleging non-compliance with applicable EHS law. By way of example, we are aware of the individual matters set out below, which we believe to be the most significant presently pending matters. Although we may incur costs or penalties in connection with the governmental proceedings discussed below, based on currently available information and our past experience, we believe that the ultimate resolution of these matters will not have a material impact on our results of operations or financial position.
In May 2003, the State of Texas settled an air enforcement case with us relating to our Port Arthur plant. Under the settlement, we are required to pay a civil penalty of $7.5 million over more than four years, undertake environmental monitoring projects totaling about $1.5 million in costs, and pay $375,000 in attorney's fees to the Texas Attorney General. As of September 30, 2004, we have paid $1.8 million toward the penalty and $375,000 for the attorney's fees. The monitoring projects are underway and on schedule. We do not anticipate that this settlement will have a material adverse effect on our results of operations or financial position.
124
In the third quarter of 2004, our Jefferson County, Texas facilities received notification from the Texas Commission on Environmental Quality ("TCEQ") of potential air emission violations relating to the operation of cooling towers at two of our plants, alleged nuisance odors, and alleged upset air emissions. We have investigated the allegations and responded in writing to TCEQ. TCEQ has proposed a penalty of $9,300 for the alleged nuisance odor violations, $174,219 for the alleged upset violations and $83,250 for the alleged cooling tower violations. Negotiations are anticipated between us and TCEQ with respect to the resolution of these alleged violations. We do not believe that the final cost to resolve these matters will be material.
Our subsidiary Huntsman Advanced Materials (U.K.) Ltd is scheduled to appear in Magistrates Court in the U.K. in November 2004 to answer five charges following an investigation by the U.K. Health and Safety Executive. The charges arise from alleged asbestos contamination caused by construction activity at the Duxford, U.K. Advanced Materials facility between November 2002 and January 2003. We believe that some or all of the alleged violations arise from conduct by a third party contractor occurring before we assumed responsibility for the Duxford facility. Although we do not believe this matter will result in the imposition of costs material to our results of operations or financial position, it is too early to predict the outcome of the case.
See "—Legal Proceedings" for a discussion of environmental lawsuits brought by private party plaintiffs.
Remediation Liabilities
We have incurred, and we may in the future incur, liability to investigate and clean up waste or contamination at our current or former facilities or facilities operated by third parties at which we may have disposed of waste or other materials. Similarly, we may incur costs for the cleanup of wastes that were disposed of prior to the purchase of our businesses. Under some circumstances, the scope of our liability may extend to damages to natural resources. Specifically, under the U.S. Comprehensive Environmental Response, Compensation and Liability Act of 1980, as amended ("CERCLA"), and similar state laws, a current or former owner or operator of real property may be liable for remediation costs regardless of whether the release or disposal of hazardous substances was in compliance with law at the time it occurred, and a current owner or operator may be liable regardless of whether it owned or operated the facility at the time of the release. In addition, under the U.S. Resource Conservation and Recovery Act of 1976, as amended ("RCRA"), and similar state laws, we may be required to remediate contamination originating from our properties as a condition to our hazardous waste permit. For example, our Odessa, Port Arthur, and Port Neches facilities in Texas are the subject of ongoing remediation requirements under RCRA authority. In many cases, our potential liability arising from historical contamination is based on operations and other events occurring prior to our ownership of the relevant facility. In these situations, we frequently obtained an indemnity agreement from the prior owner addressing remediation liabilities arising from pre-closing conditions. We have successfully exercised our rights under these contractual covenants for a number of sites, and where applicable, mitigated our ultimate remediation liability. We cannot assure you, however, that all of such matters will be subject to indemnity or that our existing indemnities will be sufficient to cover our liabilities for such matters.
We have established financial reserves relating to anticipated environmental restoration and remediation programs. Liabilities are recorded when potential liabilities are either known or considered probable and can be reasonably estimated. Our liability estimates are based upon available facts, existing technology and past experience. A total of approximately $37 million has been accrued for environmental-related liabilities as of September 30, 2004. We believe these reserves are sufficient for known requirements relating to these matters. However, no assurance can be given that all potential liabilities arising out of our present or past operations or ownership have been identified or fully assessed or that future environmental liabilities will not be material to us.
125
We have been notified by third parties of claims against us or our subsidiaries for cleanup liabilities at approximately 11 former facilities and other third party sites, including but not limited to sites listed under CERCLA. The North Maybe Canyon CERCLA site includes an abandoned phosphorous mining site located near Soda Springs, Idaho in a U.S. National Forest that may have been operated by one of our predecessors for approximately two years. With respect to this site, for which we received a notice of potential liability in February 2004, we are unable to determine whether the alleged liabilities may be material to us because we do not have information sufficient to evaluate this claim. Based on current information and past experience at other CERCLA sites, however, we do not expect any of these third-party claims to result in material liability to us.
Regulatory Developments
Under the European Union ("EU") Integrated Pollution Prevention and Control Directive ("IPPC"), EU member governments are to adopt rules and implement a cross media (air, water and waste) environmental permitting program for individual facilities. While the EU countries are at varying stages in their respective implementation of the IPPC permit program, we have submitted all necessary IPPC permit applications required to date, and in some cases received completed permits from the applicable government agency. We expect to submit all other IPPC applications and related documents on a timely basis as the various countries implement the IPPC permit program. Although we do not know with certainty what each IPPC permit will require, we believe, based upon our experience with the permits received to date, that the costs of compliance with the IPPC permit program will not be material to our results of operations or financial position.
In October 2003, the European Commission adopted a proposal for a new EU regulatory framework for chemicals. Under this proposed new system called "REACH" (Registration, Evaluation and Authorization of Chemicals), companies that manufacture or import more than one ton of a chemical substance per year would be required to register such manufacture or import in a central database. The REACH initiative, as proposed, would require risk assessment of chemicals, preparations (e.g., soaps and paints) and articles (e.g., consumer products) before those materials could be manufactured or imported into EU countries. Where warranted by a risk assessment, hazardous substances would require authorizations for their use. This regulation could impose risk control strategies that would require capital expenditures by us. As proposed, REACH would take effect in three primary stages over the eleven years following the final effective date (assuming final approval). The impacts of REACH on the chemical industry and on us are unclear at this time because the parameters of the program are still being actively debated.
MTBE Developments
The use of MTBE is controversial in the U.S. and elsewhere and may be substantially curtailed or eliminated in the future by legislation or regulatory action. The presence of MTBE in some groundwater supplies in California and other states (primarily due to gasoline leaking from underground storage tanks) and in surface water (primarily from recreational watercraft) has led to public concern about MTBE's potential to contaminate drinking water supplies. Heightened public awareness regarding this issue has resulted in state, federal and foreign initiatives to rescind the federal oxygenate requirements for reformulated gasoline or restrict or prohibit the use of MTBE in particular. For example, California, New York and Connecticut have adopted rules that prohibit the use of MTBE in gasoline sold in those states as of January 1, 2004. Overall, states that have taken some action to prohibit or restrict the use of MTBE in gasoline account for a substantial portion of the "pre-ban" U.S. MTBE market. Thus far, attempts by others to challenge these state bans in federal court under the reformulated gasoline provisions of the federal Clean Air Act have been unsuccessful.
The U.S. Congress has been considering legislation that would eliminate the oxygenated fuels requirements in the Clean Air Act and phase out or curtail MTBE use over a period of several years.
126
To date, no such legislation has become law. If it were to become law it could result in a federal phase-out of the use of MTBE in gasoline in the U.S., but it would not prevent us from manufacturing MTBE in our plants. In addition, in March 2000, the EPA announced its intention, through an advanced notice of proposed rulemaking, to phase out the use of MTBE under authority of the federal Toxic Substances Control Act. EPA has not yet acted on this proposal, however. In Europe, the EU issued a final risk assessment report on MTBE in September 2002. No ban of MTBE was recommended, though several risk reduction measures relating to storage and handling of MTBE-containing fuel were recommended.
We currently market approximately 95% of our MTBE to customers located in the U.S. for use as a gasoline additive. Any phase-out or other future regulation of MTBE in other jurisdictions, nationally or internationally, may result in a significant reduction in demand for our MTBE and result in a material loss in revenues or material costs or expenditures. In the event that there should be a complete phase-out of MTBE in the U.S., we believe we will be able to export MTBE to Europe, Asia or South America, although this may produce a lower level of cash flow than the sale of MTBE in the U.S. We may also elect to use all or a portion of our precursor TBA to produce saleable products other than MTBE. If we opt to produce products other than MTBE, necessary modifications to our facilities may require significant capital expenditures and the sale of the other products may produce a materially lower level of cash flow than the sale of MTBE.
In addition to the use limitations described above, a number of lawsuits have been filed, primarily against gasoline manufacturers, marketers and distributors, by persons seeking to recover damages allegedly arising from the presence of MTBE in groundwater. While we have not been named as a defendant in any litigation concerning the environmental effects of MTBE, we cannot provide assurances that we will not be involved in any such litigation or that such litigation will not have a material adverse effect on our results of operations or financial position.
Legal Proceedings
We have settled certain Discoloration Claims during and prior to the second quarter of 2004 relating to discoloration of unplasticized polyvinyl chloride products allegedly caused by our titanium dioxide. Substantially all of the titanium dioxide that was the subject of these claims was manufactured prior to our acquisition of our titanium dioxide business from ICI in 1999. Net of amounts we have received from insurers and pursuant to contracts of indemnity, we have paid approximately £8 million ($14.9 million) in costs and settlement amounts for Discoloration Claims.
Certain insurers have denied coverage with respect to certain Discoloration Claims. We brought suit against these insurers to recover the amounts we believe are due to us. The court found in favor of the insurers, and we lodged an application for leave to appeal that decision. Qualified leave to appeal was granted in November 2004. We are considering whether to make a further application to have the qualification removed. We do not expect the appeal to be heard before the end of the first quarter of 2005.
During the second quarter of 2004, we recorded a charge in the amount of $14.9 million with respect to Discoloration Claims. We expect that we will incur additional costs with respect to Discoloration Claims, potentially including additional settlement amounts. However, we do not believe that we have material ongoing exposure for additional Discoloration Claims, after giving effect to our rights under contracts of indemnity, including the rights of indemnity we have against ICI. Nevertheless, we can provide no assurance that our costs with respect to Discoloration Claims will not have a material adverse impact on our financial condition or results of operations.
Vantico concluded that certain of the products of its former Electronics division may have infringed patents owned by Taiyo and it entered into a license agreement with Taiyo to obtain the right to use the Taiyo patents. This license agreement required payment of back royalties and agreement to
127
pay periodic royalties for future use. We believe that Ciba Specialty Chemicals Holdings Inc. ("Ciba") is liable under the indemnity provisions of certain agreements in connection with the leveraged buy out transaction in 2000 involving Ciba and Vantico for certain payments made under the license agreement and related costs and expenses, and we initiated an arbitration proceeding against Ciba. In July 2004, we entered into a settlement agreement with Ciba with respect to this matter. In general, the settlement agreement provided that Ciba would pay us $10.9 million in 2004 and provide us with approximately $11 million of credits over the next five years against payments for certain services provided by Ciba at one of our Advanced Materials facilities. We received additional consideration in the form of modifications to certain agreements between our Advanced Materials business and Ciba. In August 2004, we received payment of the $10.9 million settlement. To date, we have incurred approximately $2.1 million in costs in connection with the arbitration proceedings against Ciba.
We are a party to various lawsuits brought by persons alleging personal injuries and/or property damage based upon alleged exposure to toxic substances. For example, since June 2003, a number of lawsuits have been filed in state district court in Jefferson County, Texas against several local chemical plants and refineries, including our subsidiary Huntsman Petrochemical Corporation. Generally, these lawsuits allege that the refineries and chemical plants located in the vicinity of the plaintiffs' homes discharged chemicals into the air that interfere with use and enjoyment of property and cause health problems and/or property damages. Because these cases are still in the initial stages, we do not have sufficient information at the present time to estimate any liability to us.
In addition, we have been named as a "premises defendant" in a number of asbestos exposure lawsuits. Where the alleged exposure occurred prior to our ownership or operation of the relevant "premises," we generally have indemnity protection from the prior owner or operator. These suits often involve multiple plaintiffs and multiple defendants, and, generally, the complaint in the action does not indicate which plaintiffs are making claims against a specific defendant, where or how the alleged injuries occurred, or what injuries each plaintiff claims. These facts must be learned through discovery. Among the cases currently pending against us for which a prior owner has not accepted defense under our indemnity agreements, we are aware of three claims of mesothelioma. We do not have sufficient information at the present time to estimate any liability in these cases. Based on our past history of settlements and experience in these types of cases, we believe, although we cannot assure you, that our ultimate liability in these cases will not have a material adverse effect on our results of operations or financial position.
We are a party to various other proceedings instituted by private plaintiffs, governmental authorities and others arising under provisions of applicable laws, including various environmental, products liability and other laws. Except as otherwise disclosed in this prospectus, and based in part on the indemnities provided to us in connection with the transfer of businesses to us and our insurance coverage, we do not believe that the outcome of any of these matters will have a material adverse effect on our financial condition or results of operations. See "—Environmental Regulation" above for a discussion of environmental proceedings.
128
Directors and Executive Officers and Other Key Officers
The current members of our board of directors and our current executive officers are listed below. Our directors will serve staggered three-year terms and our executive officers serve at the pleasure of our board of directors.
| Name |
Age |
Position |
||
|---|---|---|---|---|
| Jon M. Huntsman* | 67 | Chairman of the Board and Director | ||
| Peter R. Huntsman* | 41 | President, Chief Executive Officer and Director | ||
| J. Kimo Esplin | 42 | Executive Vice President and Chief Financial Officer | ||
| Samuel D. Scruggs | 45 | Executive Vice President, General Counsel and Secretary | ||
| Anthony P. Hankins | 46 | Division President, Polyurethanes | ||
| Paul G. Hulme | 48 | Division President, Advanced Materials | ||
| Thomas J. Keenan | 52 | Division President, Pigments | ||
| Kevin J. Ninow | 41 | Division President, Base Chemicals and Polymers | ||
| Donald J. Stanutz | 54 | Division President, Performance Products | ||
| Michael J. Kern | 55 | Senior Vice President, Environmental, Health & Safety and Chief Information Officer | ||
| Brian V. Ridd | 46 | Senior Vice President, Purchasing | ||
| L. Russell Healy | 49 | Vice President and Controller | ||
| David J. Matlin | 43 | Director | ||
| Richard Michaelson | 52 | Director, Chairman of the Audit Committee | ||
| Christopher Pechock | 40 | Director |
Our other key officers are listed below.
| Name |
Age |
Position |
||
|---|---|---|---|---|
| Don H. Olsen | 58 | Senior Vice President, Global Public Affairs | ||
| Martin Casey | 56 | Vice President, Strategic Planning | ||
| Sean Douglas | 40 | Vice President and Treasurer | ||
| Kevin C. Hardman | 40 | Vice President, Tax | ||
| John R. Heskett | 35 | Vice President, Corporate Development and Investor Relations | ||
| James R. Moore | 60 | Vice President and Deputy General Counsel | ||
| R. Wade Rogers | 39 | Vice President, Global Human Resources |
Jon M. Huntsman is Chairman of the Board of Directors of our company and has held this position since our company was formed. He has been Chairman of the Board of all Huntsman companies since he founded his first plastics company in 1970. Mr. Huntsman served as Chief Executive Officer of our company and our affiliated companies from 1970 to 2000. In addition, Mr. Huntsman serves or has served as Chairman or as a member of numerous corporate, philanthropic and industry boards, including the American Red Cross, The Wharton School, University of Pennsylvania, Primary Children's Medical Center Foundation, the Chemical Manufacturers Association and the American Plastics Council. Mr. Huntsman was selected in 1994 as the chemical industry's top CEO for all businesses in Europe and North America. Mr. Huntsman formerly served as Special Assistant to the President of the United States and as Vice Chairman of the U.S. Chamber of Commerce. He is the Chairman and Founder of the Huntsman Cancer Institute.
129
Peter R. Huntsman is President, Chief Executive Officer and a Director of our company. Prior to his appointment in July 2000 as Chief Executive Officer, Mr. Huntsman had served as President and Chief Operating Officer since 1994. In 1987, Mr. Huntsman joined Huntsman Polypropylene Corporation as Vice President before serving as Senior Vice President and General Manager. Mr. Huntsman has also served as President of Olympus Oil, as Senior Vice President of Huntsman Chemical Corporation and as a Senior Vice President of Huntsman Packaging Corporation, a former subsidiary of our company. Mr. Huntsman is a director or manager, as applicable, of HMP, HLLC, HIH, HI and certain of our other subsidiaries.
J. Kimo Esplin is Executive Vice President and Chief Financial Officer. Mr. Esplin has served as chief financial officer of all of the Huntsman companies since 1999. From 1994 to 1999, Mr. Esplin served as our Treasurer. Prior to joining Huntsman in 1994, Mr. Esplin was a Vice President in the Investment Banking Division of Bankers Trust Company, where he worked for seven years. Mr. Esplin also serves as a director of Nutraceutical International Corporation, a publicly traded nutrition supplements company.
Samuel D. Scruggs is Executive Vice President, General Counsel and Secretary. Mr. Scruggs served as Vice President and Treasurer from 1999 to 2002 and as Vice President and Associate General Counsel from 1999 to 2000. Prior to joining Huntsman in 1995, Mr. Scruggs was an associate with the law firm of Skadden, Arps, Slate, Meagher & Flom LLP.
Anthony P. Hankins is Division President, Polyurethanes. Mr. Hankins was appointed to this position in March 2004. From May 2003 to February 2004, Mr. Hankins served as President, Performance Products. Prior to May 2003, Mr. Hankins served as Global Vice President, Rigids Division for our polyurethanes business. Mr. Hankins worked for ICI from 1980 to 1999, when he joined our company. At ICI, Mr. Hankins held numerous management positions in the plastics, fibers and polyurethanes businesses. He has extensive international experience, having held senior management positions in Europe, Asia and the U.S.
Paul G. Hulme is Division President, Advanced Materials, and has served in that role or as Senior Vice President and General Manager of Advanced Materials since June 2003. From 2001 to June 2003, Mr. Hulme has served as Vice President, Performance Chemicals. Prior to joining Huntsman in 1999, Mr. Hulme held various positions with ICI in finance, accounting and information systems roles. Mr. Hulme is a Chartered Accountant.
Thomas J. Keenan is Division President, Pigments. Mr. Keenan serves or has served in many executive positions with the Huntsman affiliated companies, including President, North American Petrochemicals and Polymers, Senior Vice President of Huntsman Chemical Company LLC and Huntsman Polymers Corporation. Prior to joining Huntsman in 1994, Mr. Keenan was Vice President and General Manager, Olefins and Polyolefins for Mobil Chemical Company, where he worked for more than sixteen years.
Kevin J. Ninow is Division President, Base Chemicals and Polymers. Since joining Huntsman in 1997, Mr. Ninow has served in a variety of executive, manufacturing and engineering positions in our Company and its subsidiaries, including Senior Vice President, Base Chemicals Manufacturing, Vice President European Petrochemicals, Vice President International Manufacturing, Plant Manager—Oxides and Olefins, Plant Manager—C4's, Operations Manager—C4's, Manager of Technology, Process Control Group Leader, and Project Engineer.
Donald J. Stanutz is Division President, Performance Products. Mr. Stanutz was appointed to this position in March 2004. Mr. Stanutz previously served as Executive Vice President and Chief Operating Officer of HLLC and as Executive Vice President, Global Sales and Marketing and has held several positions with Huntsman that have included the overall management for our performance chemicals
130
business, our specialty polymers business and our olefins, oxides and glycols business. Prior to joining Huntsman in 1994, Mr. Stanutz served in a variety of senior positions with Texaco Chemical Company.
Michael J. Kern is Senior Vice President—Environmental, Health & Safety, and Chief Information Officer. Mr. Kern has held this position since December 2003. Mr. Kern has served in several senior management positions of our company, including Senior Vice President—Environmental, Health & Safety from July 2001 to December 2003 and Senior Vice President, Manufacturing from December 1995 to July 2001. Prior to joining Huntsman, Mr. Kern held a variety of positions within Texaco Chemical Company, including Area Manager—Jefferson County Operations from April 1993 until joining our company, Plant Manager of the Port Neches facility from August 1992 to March 1993, Manager of the PO/MTBE project from October 1989 to July 1992, and Manager of Oxides and Olefins from April 1988 to September 1989.
Brian V. Ridd is Senior Vice President, Purchasing. Mr. Ridd has held this position since 2002. Since joining Huntsman in 1984, Mr. Ridd has served as an officer of many of our subsidiaries, including Vice President of Olympus Oil and Vice President, Purchasing of Huntsman Petrochemical Corporation and Huntsman Chemical Corporation.
L. Russell Healy is Vice President and Controller. Mr. Healy is also Vice President and Controller of HLLC, HIH, HI and Advanced Materials and has served in these capacities since April 2004. In addition, Mr. Healy serves as an officer or director of several of the other Huntsman subsidiaries. Prior to his current role, Mr. Healy served as Vice President, Finance and Risk Management for all of the Huntsman companies. Previously, Mr. Healy also served as Senior Vice President and Finance Director for HIH and HI, and as Vice President, Finance and Vice President, Tax for HLLC. Prior to joining Huntsman in 1995, Mr. Healy was a partner with the accounting firm of Deloitte & Touche, LLP. Mr. Healy is a Certified Public Accountant and holds a master's degree in accounting.
David J. Matlin is a Director. Mr. Matlin also serves as the CEO and Global Portfolio Manager of MatlinPatterson Global Advisors LLC and is the regional trading head for the Americas. Prior to the formation of MatlinPatterson in 2002, Mr. Matlin was responsible for all the activities of the Credit Suisse First Boston Distressed Group since its formation in 1994, managing a global portfolio of distressed assets valued in excess of $2.0 billion as of December 31, 1999. Prior to Credit Suisse First Boston, Mr. Matlin was Managing Director of distressed securities and co-founder of Merrion Group, L.P., a successor to Scully Brothers & Foss L.P. from 1988 to 1994. From 1986 to 1988, he was a securities analyst at Halcyon Investments. Mr. Matlin is a director or manager, as applicable, of HMP, HLLC, HIH and certain of our other subsidiaries.
Richard Michaelson is a Director and Chairman of the Audit Committee. Mr. Michaelson is the Chief Financial Officer and Secretary of Life Sciences Research Inc, a contract research organization providing global outsourcing services to the pharmaceutical industry. Prior to his joining LSR in 1998, he was a partner in Focused Healthcare Partners, a healthcare investment company. Mr. Michaelson was the Chief Financial Officer of Unilab Corporation, California's largest provider of clinical laboratory services, from 1993 to 1997, and held a succession of senior management positions at MetPath (now Quest Diagnostics) between 1982 and 1993. Mr. Michaelson was a financial analyst at IBM from 1979 to 1982. Mr. Michaelson is a director or manager, as applicable, of HMP, HLLC, HIH and certain of our other subsidiaries.
Christopher Pechock is a Director. Mr. Pechock has served as an officer of MatlinPatterson Global Advisors LLC since July 2002. Mr. Pechock has been active in the distressed securities markets for 14 years. Prior to July 2002, Mr. Pechock was a member of Credit Suisse First Boston's Distressed Group which he joined in 1999. Before joining Credit Suisse First Boston, Mr. Pechock was a Portfolio Manager and Research Analyst in distressed securities at Turnberry Capital Management, L.P. from 1997 to 1999, a Portfolio Manager in distressed securities and special situations at Eos Partners, L.P. from 1996 to 1997, a Vice President and high yield analyst at PaineWebber Inc. from 1993 to 1996 and
131
an analyst in risk arbitrage at Wertheim Schroder & Co., Incorporated from 1987 to 1991. Mr. Pechock is a director or manager, as applicable, of HMP, HLLC, HIH and certain of our other subsidiaries.
Don H. Olsen is Senior Vice President, Global Public Affairs. Mr. Olsen also serves as an officer or director of many of Huntsman's affiliated companies. Prior to joining Huntsman in 1988, Mr. Olsen had a 17-year career in broadcast journalism. He also spent three years in Washington, D.C. as Director of Communications for former U.S. Senator Jake Garn.
Martin Casey is Vice President, Strategic Planning. Dr. Casey has held this position since August 2004. Dr. Casey has previously been responsible for planning and business development in Huntsman's Polyurethanes Business, acquired from ICI in 1999. From 1995 to 1999 he was New Business Development Manager for ICI polyurethanes, before which he was Business Manager for ICI's acrylic sheet business and held a variety of earlier positions in technical and business management roles.
Sean Douglas is Vice President and Treasurer of the company. Since joining our company in 1990, he has served in a number of roles, including Vice President Administration and Assistant Treasurer of our company, Vice President of various affiliated companies, Controller of an affiliated company and as a financial analyst for Huntsman's European businesses. Mr. Douglas is a Certified Public Accountant and, prior to joining Huntsman, worked for the accounting firm of Price Waterhouse.
Kevin C. Hardman is Vice President, Tax. Mr. Hardman served as Chief Tax Officer from 1999 until he was appointed to his current position in 2002. Mr. Hardman is also Vice President, Tax of HLLC. Prior to joining Huntsman in 1999, Mr. Hardman was a tax Senior Manager with the accounting firm of Deloitte & Touche, where he worked for 10 years. Mr. Hardman is a Certified Public Accountant and holds a master's degree in tax accounting.
John R. Heskett is Vice President, Corporate Development and Investor Relations. Mr. Heskett has held this position since August 2004. Mr. Heskett was appointed Vice President, Corporate Development in 2002. Mr. Heskett previously served as Assistant Treasurer for our company and several of our subsidiaries, including HI and HLLC. Prior to joining Huntsman in 1997, Mr. Heskett was Assistant Vice President and Relationship Manager for PNC Bank, N.A., where he worked for a number of years.
James R. Moore is Vice President and Deputy General Counsel. Mr. Moore served as Vice President and Chief Environmental Counsel from 2002 until he was appointed to his current position in 2003. Mr. Moore also serves as Vice President and Chief Environmental Counsel of HLLC. From 1989 until joining Huntsman in 1998, Mr. Moore was a partner at the Seattle law firm of Perkins Coie. Mr. Moore also previously served as a trial attorney with the U.S. Department of Justice, an assistant U.S. Attorney and Regional Counsel, Region 10, of the U.S. Environmental Protection Agency.
R. Wade Rogers is Vice President, Global Human Resources. Mr. Rogers has held this position since May 2004. Mr. Rogers previously served as Director, Human Resources—Americas and as Director, Human Resources for our Polymers and Base Chemicals businesses. Prior to joining Huntsman in 1994, Mr. Rogers held a variety of positions with Texaco Chemical Company, including Area Manager, Human Resources—Jefferson County Operations.
Composition of the Board After This Offering
Our board of directors currently consists of five directors, including one independent director, Richard Michaelson. Our board of directors will be composed of a majority of independent directors immediately after the consummation of this offering.
Pursuant to our certificate of incorporation, our board of directors is divided into three classes. The members of each class will serve staggered, three-year terms. Upon the expiration of the term of a
132
class of directors, directors in that class will be elected for three-year terms at the annual meeting of stockholders in the year in which their term expires. The classes are composed as follows:
Any additional directorships resulting from an increase in the number of directors will be distributed among the three classes so that, as nearly as possible, each class will consist of one-third of our directors. This classification of our board of directors may have the effect of delaying or preventing changes in control of our company.
Committees of the Board of Directors
Our board of directors currently has an audit committee, a compensation committee and a nominating and corporate governance committee.
Audit Committee
Our audit committee currently consists of Mr. Michaelson, Mr. and Mr. . Our board of directors has determined that the members of the audit committee are independent and that Mr. is an "audit committee financial expert" as such term is defined in Item 401(h) of Regulation S-K. The principal duties of the audit committee are:
Compensation Committee
Our compensation committee currently consists of Mr. , Mr. and Mr. . Our board of directors has determined that the members of the compensation committee are independent. The principal duties of the compensation committee are to:
133
Nominating and Corporate Governance Committee.
Our nominating and corporate governance committee currently consists of Mr. , Mr. and Mr. . Our board of directors has determined that the members of the nominating and corporate governance committee are independent. The principal duties of the nominating and corporate governance committee are:
Compensation of Directors
Directors who are also our employees do not receive a retainer or fees for service on our board of directors or any committees. Directors who are not employees receive an annual fee of $ , an annual grant of options to purchase shares of our common stock and a fee of $ for attendance at each meeting of our board of directors and each meeting of a committee of our board of directors on which they serve. In addition, the chairperson for each committee of the board of directors receives an annual fee of $ . All of our directors are reimbursed for reasonable out-of-pocket expenses incurred in attending meetings of our board of directors or committees and for other reasonable expenses related to the performance of their duties as directors.
In addition, we have entered into a consulting agreement with Mr. Jon M. Huntsman, pursuant to which Mr. Huntsman receives $950,000 per year. See "Certain Relationships and Related Transactions—HI Consulting Agreement with Jon M. Huntsman."
Summary Executive Compensation
The following summary compensation table sets forth information concerning compensation earned in the fiscal years ended December 31, 2003, 2002 and 2001 by our chief executive officer and our four other most highly compensated executive officers at the end of 2003. Information is also included for the former president of our pigments business, who would have been among the most highly
134
compensated executive officers if he had not ceased to be an executive officer during 2003. We refer to these six persons collectively as our "named executive officers."
| |
|
|
|
|
Long-Term Compensation Awards |
|
|||||||||||
|---|---|---|---|---|---|---|---|---|---|---|---|---|---|---|---|---|---|
| |
|
Annual Compensation(1) |
Number of Securities Underlying Options/EARs Granted(3) |
|
|||||||||||||
| Name and Principal Position |
Year |
Salary |
Bonus |
Other Annual Compensation (2) |
All Other Compensation |
||||||||||||
| Peter R. Huntsman President, Chief Executive Officer and Director |
2003 2002 2001 |
$ $ $ |
1,348,749 1,144,000 1,129,700 |
$ $ $ |
500,000 750,000 500,000 |
$ $ $ |
1,538,136 452,434 678,170 |
(4) (6) (7) |
263,158 |
$ $ $ |
172,340 135,520 1,668,046 |
(5) (5) (5) |
|||||
J. Kimo Esplin Executive Vice President and Chief Financial Officer |
2003 2002 2001 |
$ $ $ |
410,775 397,318 386,250 |
$ $ $ |
300,000 400,000 250,000 |
$ |
381,674 |
(9) |
92,106 |
$ $ $ |
49,336 23,464 92,422 |
(8) (8) (8) |
|||||
Samuel D. Scruggs Executive Vice President and General Counsel |
2003 2002 2001 |
$ $ $ |
342,448 332,350 262,308 |
$ $ $ |
450,000 400,000 300,000 |
19,737 |
$ $ $ |
37,122 22,970 88,873 |
(10) (10) (10) |
||||||||
Douglas A.L. Coombs(11) Former Division President, Pigments |
2003 2002 2001 |
$ $ $ |
333,617 284,928 243,163 |
$ $ $ |
843,270 1,081,227 658,565 |
$ $ $ |
375,620 384,077 354,782 |
(12) (13) (14) |
|||||||||
Paul G. Hulme Division President, Advanced Materials |
2003 2002 2001 |
$ $ $ |
332,040 179,942 146,084 |
$ $ $ |
329,691 167,555 151,247 |
$ $ $ |
91,105 107,714 66,783 |
(15) (16) (17) |
|||||||||
Patrick W. Thomas(18) Former Division President, Polyurethanes |
2003 2002 2001 |
$ $ $ |
554,792 484,544 381,323 |
$ $ $ |
233,000 452,136 385,998 |
$ $ $ |
168,476 143,329 123,699 |
(19) (20) (21) |
$ |
125,000 |
(22) |
||||||
135
$15,488 employer's contribution to the money purchase pension plan portion of the Huntsman SERP for 2003, 2002, and 2001, respectively, and $62,500 employer's contribution to the Equity Deferral Plan for 2001.
Equity Options and Equity Appreciation Rights
Historically, we have not granted equity options to our directors, officers or employees, but we have granted equity appreciation rights ("EARs"). The EARs represent a right to a cash payment upon exercise equal to the difference between the value (determined by a formula) of a share of common stock of HLLC's predecessor (prior to the HLLC Restructuring) at exercise and the dollar amount per share set forth in the EAR at grant, multiplied by the number of shares represented by the EAR. The EARs do not grant the recipient any right to receive any form of stock or equity interest in our company or any other entity. There were no EARs granted or exercised during the fiscal years ended December 31, 2003 or 2002. As of December 31, 2003, the EARs had no value. We have recently implemented the Huntsman Cost Reduction Incentive Plan, and the EARs held by the participants in this plan, including each of our named executive officers, have been canceled in connection with this plan.
Cost Reduction Incentive Plan
In connection with our Project Coronado cost reduction program, we have adopted the Huntsman Cost Reduction Incentive Plan. The purpose of the plan is to encourage key employees to reduce fixed
136
costs by providing incentive pay based upon the reduction in fixed costs for 2005 and 2006 relative to fixed costs for 2002. Fixed costs are calculated in accordance with the plan, on a constant currency basis. There are approximately 63 participants in the plan, including all of our executive officers. Plan participants will receive a bonus for 2005 if our annualized fixed costs as measured at the end of 2005 are at least $150 million less than our fixed costs for 2002 and will receive a bonus for 2006 if our annualized fixed costs as measured at the end of the first half of 2006 are at least $150 million less than our fixed costs for 2002. The aggregate bonus pool amount for each of 2005 and 2006 will be between 5% and 10% of the fixed cost reduction for the applicable period, depending on the amount of the reduction. No bonus will be paid for a period if the amount of the fixed cost reduction for that period is less than $150 million. Each participant's share of the aggregate bonus pool was determined by the compensation committee of HMP. Bonuses for 2005 will be payable no later than March 31, 2006, and bonuses for 2006 will be payable no later than January 7, 2007. However, we have the right to defer payments under certain circumstances. Bonuses will be payable in lump-sum cash payments, subject to our right to pay all or part of a bonus in shares of our common stock. In connection with this right, we intend to reserve up to shares of our common stock for issuance under the plan.
Retirement Plans
Huntsman Pension Plan and Huntsman SERP
We sponsor the Huntsman Defined Benefit Pension Plan (the "Huntsman Pension Plan"), a tax-qualified defined benefit pension plan, and a non-qualified supplemental pension plan (the "Huntsman SERP"). Effective July 1, 2004, the formula used to calculate future benefits under the Huntsman Pension Plan and the Huntsman SERP was changed to a cash balance formula. The benefits accrued under the plans as of June 30, 2004 were used to calculate opening cash balance accounts.
Huntsman Pension Plan. Messrs. Huntsman, Esplin and Scruggs were participants in the Huntsman Pension Plan in 2003. The Huntsman Pension Plan expresses benefits as a hypothetical cash balance account established in each participant's name. A participant's account receives two forms of credits: "pay credits" and "interest credits." Pay credits equal a percentage of a participant's compensation and are credited to a participant's account on an annual basis. "Compensation" for this purpose includes both salary and bonus as described in the Summary Compensation Table, but subject to the compensation limit applicable to tax-qualified plans ($205,000 for 2004). The applicable pay credit percentage ranges between 4% and 12% depending on the participant's combined age and years of service as of the start of each plan year. "Interest credits" for a plan year are based on the 30-year U.S. Treasury yield for November of the prior year. The minimum annual interest credit rate is 5.0%. In addition, plan participants who met certain age and service requirements on July 1, 2004 are entitled to receive "transition credits." Transition credits are payable for up to five years and equal a percentage of a participant's compensation. The applicable transition credit percentage is from 1% to 8% depending on the participant's combined age and years of service as of July 1, 2004.
At termination of employment after having completed at least five years of service, a participant will receive the amount then credited to the participant's cash balance account in an actuarially equivalent joint and survivor annuity (if married) or single life annuity (if not married). Participants may also choose from other optional forms of benefit, including a lump-sum payment in the amount of the cash balance account. The Huntsman Pension Plan also includes a minimum benefit that guarantees that a participant's benefit will not be less than the benefit accrued under the prior formula at transition (July 1, 2004) plus the benefit attributable to pay credits, with interest credits, beginning July 1, 2004.
Huntsman SERP. The Huntsman SERP provides benefits for designated executive officers based on certain compensation amounts not included in the calculation of benefits payable under the Huntsman Pension Plan. Messrs. Huntsman, Esplin, and Scruggs were participants in the Huntsman
137
SERP in 2003. The compensation amounts taken into account for these named executive officers under the Huntsman SERP include compensation in excess of the qualified plan limitations. The Huntsman SERP benefit is calculated as the difference between (1) the benefit determined using the Huntsman Pension Plan formula with unlimited base salary plus bonus, and (2) the benefit determined using base salary plus bonus as limited by federal regulations.
The number of completed years of credited service as of September 30, 2004 for Messrs. Huntsman, Esplin and Scruggs under the Huntsman Pension Plan and Huntsman SERP were 21 years, 10 years and 8 years, respectively. At September 30, 2004, these named executive officers were 41, 42 and 45 years of age, respectively.
Estimated Annual Benefits Payable to Named Executive Officers. The following table provides the estimated projected annual benefits from the Huntsman Pension Plan and the Huntsman SERP, payable as a lifetime annuity, commencing at normal retirement age (age 65) for Messrs. Huntsman, Esplin and Scruggs. These projections are based on continued employment to age 65 and a 5.12% interest credit rate (the rate in effect for 2004).
| Name |
Year of 65th Birthday |
Estimated Annual Benefit |
|||
|---|---|---|---|---|---|
| Peter Huntsman | 2028 | $ | 1,585,000 | ||
| Kimo Esplin | 2027 | 375,000 | |||
| Sam Scruggs | 2024 | 313,000 | |||
The Huntsman SERP also provides benefits not available under the Huntsman Money Purchase Pension Plan (a qualified money purchase pension plan in which Messrs. Huntsman, Esplin and Scruggs participate) because of limits under federal law on compensation that can be counted and amounts that can be allocated to accounts within the Huntsman Money Purchase Pension Plan. The amount of benefits accrued under the Huntsman SERP relating to the Huntsman Money Purchase Pension Plan for these named executive officers is included in the Summary Compensation Table in the "All Other Compensation" column.
Huntsman Belgium Pension Fund
Messrs. Hulme and Thomas participate in the Huntsman Pension Fund VZW in Belgium (the "Huntsman Belgium Pension Fund"). The following table shows the estimated annual benefit payable under the Huntsman Belgium Pension Fund on reaching age 60 in specified final pensionable earnings and years-of-benefit service classifications.
| |
Years of Benefit Service at Retirement |
|||||||||||||||
|---|---|---|---|---|---|---|---|---|---|---|---|---|---|---|---|---|
| Final Pensionable Compensation |
||||||||||||||||
| 5 |
10 |
15 |
20 |
25 |
30 |
35 |
40 |
|||||||||
| $ 200,000 | 12,609 | 25,217 | 37,826 | 50,434 | 63,043 | 75,651 | 88,260 | 100,869 | ||||||||
| 250,000 | 16,364 | 32,728 | 49,092 | 65,456 | 81,820 | 98,184 | 114,548 | 130,912 | ||||||||
| 300,000 | 20,119 | 40,239 | 60,358 | 80,478 | 100,597 | 120,717 | 140,836 | 160,955 | ||||||||
| 350,000 | 23,875 | 47,750 | 71,625 | 95,499 | 119,374 | 143,249 | 167,124 | 190,999 | ||||||||
| 400,000 | 27,630 | 55,261 | 82,891 | 110,521 | 138,151 | 165,782 | 193,412 | 221,042 | ||||||||
| 450,000 | 31,386 | 62,771 | 94,157 | 125,543 | 156,929 | 188,314 | 219,700 | 251,086 | ||||||||
| 500,000 | 35,141 | 70,282 | 105,423 | 140,565 | 175,706 | 210,847 | 245,988 | 281,129 | ||||||||
| 550,000 | 38,897 | 77,793 | 116,690 | 155,586 | 194,483 | 233,379 | 272,276 | 311,173 | ||||||||
| 600,000 | 42,652 | 85,304 | 127,956 | 170,608 | 213,260 | 255,912 | 298,564 | 341,216 | ||||||||
| 650,000 | 46,407 | 92,815 | 139,222 | 185,630 | 232,037 | 278,445 | 324,852 | 371,259 | ||||||||
| 700,000 | 50,163 | 100,326 | 150,489 | 200,651 | 250,814 | 300,977 | 351,140 | 401,303 | ||||||||
| 750,000 | 53,918 | 107,837 | 161,755 | 215,673 | 269,591 | 323,510 | 377,428 | 431,346 | ||||||||
| 800,000 | 57,674 | 115,347 | 173,021 | 230,695 | 288,369 | 346,042 | 403,716 | 461,390 | ||||||||
| 850,000 | 61,429 | 122,858 | 184,287 | 245,717 | 307,146 | 368,575 | 430,004 | 491,433 | ||||||||
| 900,000 | 65,185 | 130,369 | 195,554 | 260,738 | 325,923 | 391,107 | 456,292 | 521,477 | ||||||||
| 950,000 | 68,940 | 137,880 | 206,820 | 275,760 | 344,700 | 413,640 | 482,580 | 551,520 | ||||||||
| 1,000,000 | 72,695 | 145,391 | 218,086 | 290,782 | 363,477 | 436,173 | 508,868 | 581,563 | ||||||||
138
Participants in the Huntsman Belgium Pension Fund may elect a lump sum benefit equal to 8.57% of final pensionable compensation up to the Belgian Social Security earnings ceiling, plus 18.21% of pensionable compensation above the ceiling, times years of service. Final pensionable compensation is 12 times the monthly base salary for the final year of employment. Covered compensation for Messrs. Hulme and Thomas under the plan is reflected in the "Salary" column of the Summary Compensation Table. As of September 30, 2004, Mr. Hulme had approximately 16 years of service in Belgium and was 48 years of age. On July 31, 2004, the date of his separation, Mr. Thomas had 16 years of service in Belgium and was 47 years of age. The benefit amounts for the Huntsman Belgium Pension Fund shown in the table do not include Belgian Social Security benefits, which are payable in addition to such benefit amounts.
Huntsman Pension Scheme
Messrs. Hulme and Thomas also participate in the Huntsman Pension Scheme in the U.K. The following table shows the estimated annual benefit payable under the Huntsman Pension Scheme on reaching age 62 in specified final pensionable earnings and years-of-service classifications.
| |
Years of Benefit Service at Retirement |
|||||||||||||||
|---|---|---|---|---|---|---|---|---|---|---|---|---|---|---|---|---|
| Final Pensionable Compensation |
||||||||||||||||
| 5 |
10 |
15 |
20 |
25 |
30 |
35 |
40 |
|||||||||
| $ 200,000 | 17,920 | 35,840 | 53,760 | 71,680 | 89,599 | 107,519 | 125,439 | 133,333 | ||||||||
| 250,000 | 22,495 | 44,990 | 67,485 | 89,980 | 112,474 | 134,969 | 157,464 | 166,667 | ||||||||
| 300,000 | 27,070 | 54,140 | 81,210 | 108,280 | 135,349 | 162,419 | 189,489 | 200,000 | ||||||||
| 350,000 | 31,645 | 63,290 | 94,935 | 126,580 | 158,224 | 189,869 | 221,514 | 233,333 | ||||||||
| 400,000 | 36,220 | 72,440 | 108,660 | 144,880 | 181,099 | 217,319 | 253,539 | 266,667 | ||||||||
| 450,000 | 40,795 | 81,590 | 122,385 | 163,180 | 203,974 | 244,769 | 285,564 | 300,000 | ||||||||
| 500,000 | 45,370 | 90,740 | 136,110 | 181,480 | 226,849 | 272,219 | 317,589 | 333,333 | ||||||||
| 550,000 | 49,945 | 99,890 | 149,835 | 199,780 | 249,724 | 299,669 | 349,614 | 366,667 | ||||||||
| 600,000 | 54,520 | 109,040 | 163,560 | 218,080 | 272,599 | 327,119 | 381,639 | 400,000 | ||||||||
| 650,000 | 59,095 | 118,190 | 177,285 | 236,380 | 295,474 | 354,569 | 413,664 | 433,333 | ||||||||
| 700,000 | 63,670 | 127,340 | 191,010 | 254,680 | 318,349 | 382,019 | 445,689 | 466,667 | ||||||||
| 750,000 | 68,245 | 136,490 | 204,735 | 272,980 | 341,224 | 409,469 | 477,714 | 500,000 | ||||||||
| 800,000 | 72,820 | 145,640 | 218,460 | 291,280 | 364,099 | 436,919 | 509,739 | 533,333 | ||||||||
| 850,000 | 77,395 | 154,790 | 232,185 | 309,580 | 386,974 | 464,369 | 541,764 | 566,667 | ||||||||
| 900,000 | 81,970 | 163,940 | 245,910 | 327,880 | 409,849 | 491,819 | 573,789 | 600,000 | ||||||||
| 950,000 | 86,545 | 173,090 | 259,635 | 346,180 | 432,724 | 519,269 | 605,814 | 633,333 | ||||||||
| 1,000,000 | 91,120 | 182,240 | 273,360 | 364,480 | 455,599 | 546,719 | 637,839 | 666,667 | ||||||||
The Huntsman Pension Scheme provides benefits equal to 2.2% (1/45th) of final pensionable compensation up to $20,072 (£11,250), plus 1.83% of final pensionable compensation above $20,072 (£11,250), minus 1/50th of the current State pension benefit, times actual years of service; subject to a maximum limit of 2/3rd of final pensionable compensation times actual years of service, divided by total possible service to retirement. Final pensionable compensation is gross salary received during the 12 months prior to retirement less any profit sharing payments. These benefits include U.K. social security benefits. As of September 30, 2004, Mr. Hulme had approximately 5 years of service in the U.K. As of July 31, 2004, Mr. Thomas had approximately 10 years of service in the U.K.
International Pension Plan
Messrs. Hulme and Thomas also participate in the International Pension Plan (the "IPP"), which is a nonregistered plan designed to protect the pension benefits of employees whose service involves participation in pension plans in more than one country. Through the IPP, each of Messrs. Hulme and Thomas at retirement can elect to receive a total pension benefit (which includes retirement benefits
139
being provided by the Huntsman Belgium Pension Fund and the Huntsman Pension Scheme) that is the greater of (1) the benefit under the Huntsman Pension Scheme (with slight modifications if he has less than 10 years of actual U.K. service) based upon his combined service in Belgium and the U.K. and his U.K. notional salary, or (2) the benefit under the Huntsman Belgium Pension Fund based upon his combined service in Belgium and the U.K. Currently, the benefit under the IPP using the Huntsman Belgium Pension Fund is the most beneficial for both Mr. Hulme, who had 21 years of total service as of September 30, 2004, and Mr. Thomas, who had approximately 26 total years of service as of July 31, 2004.
Canadian Pension Plan
Mr. Coombs had a pension promise in respect of service on and after September 1, 1999 that guaranteed him a pension as if he were employed in Canada. Mr. Coombs retired from Huntsman and began drawing a pension benefit effective May 1, 2004. The benefit being paid to Mr. Coombs is C$83,236.44 per year. The pension is in the form of a joint and survivor annuity, which will provide Mr. Coombs with a lifetime pension, with 60% of that pension continuing to his spouse as a survivor benefit.
Stock Incentive Plan
The following contains a summary of the material terms of the Huntsman Stock Incentive Plan (the "Stock Incentive Plan"), which will be adopted by our Board of Directors and approved by our stockholders prior to the completion of this offering. The description of such terms is not complete. For more information, we refer you to the full text of the Stock Incentive Plan, which has been filed as an exhibit to the registration statement of which this prospectus forms a part.
The Stock Incentive Plan permits the grant of non-qualified stock options, incentive stock options, stock appreciation rights, restricted stock, phantom stock, performance awards and other stock-based awards ("Awards") to employees, directors and consultants to us and to our affiliates. A maximum of shares of common stock may be delivered pursuant to Awards under the Stock Incentive Plan. The number of shares deliverable pursuant to the Awards under the Stock Incentive Plan is subject to adjustment on account of mergers, consolidations, reorganizations, stock splits, stock dividends and other dilutive changes in our common stock. Shares of common stock used to pay exercise prices and to satisfy tax withholding obligations with respect to Awards as well as shares covered by Awards that expire terminate or lapse will again be available for Awards under the Stock Incentive Plan.
Administration
The Stock Incentive Plan is administered by a committee of our board of directors. However, our board of directors may take any action designated to the committee. The committee has the sole discretion to determine the employees, directors and consultants to whom Awards may be granted under the Stock Incentive Plan and the manner in which such Awards will vest. Awards are granted by the committee to employees, directors and consultants in such numbers and at such times during the term of the Stock Incentive Plan as the committee shall determine. The committee is authorized to interpret the Stock Incentive Plan, to establish, amend and rescind any rules and regulations relating to the Stock Incentive Plan, and to make any other determinations that it deems necessary or desirable for the administration of the Stock Incentive Plan. The committee may correct any defect, supply any omission or reconcile any inconsistency in the Stock Incentive Plan in the manner and to the extent the committee deems necessary or desirable.
140
Options
The committee determines the exercise price for each option. However, options must generally have an exercise price at least equal to the fair market value of the common stock on the date the option is granted. An option holder may exercise an option by written notice and payment of the exercise price:
Stock Appreciation Rights
The committee may grant stock appreciation rights independent of or in connection with an option. The exercise price per share of a stock appreciation right will be an amount determined by the committee. However, stock appreciation rights must generally have an exercise price at least equal to the fair market value of the common stock on the date the stock appreciation right is granted. Generally, each stock appreciation right will entitle a participant upon exercise to an amount equal to (i) the excess of (1) the fair market value on the exercise date of one share of common stock over (2) the exercise price, times (ii) the number of shares of common stock covered by the stock appreciation right. Payment shall be made in common stock or in cash, or partly in common stock and partly in cash, all as shall be determined by the committee.
Performance Awards
The committee may grant performance awards denominated in dollars or other currencies that vest upon such terms and conditions as the committee may establish, including the achievement of performance criteria. To the extent earned, performance awards may be paid in common stock or in cash or any combination thereof as determined by the committee.
Other Stock-Based Awards
The committee may grant Awards of restricted stock, phantom stock and other Awards that are valued in whole or in part by reference to, or are otherwise based on the fair market value of, shares of common stock, including shares of stock in lieu of cash compensation. Other stock-based awards will be subject to the terms and conditions established by the committee.
Transferability
Unless otherwise determined by the committee, Awards granted under the Stock Incentive Plan are not transferable other than by will or by the laws of descent and distribution.
Change of Control
In the event of a change of control of our company (as defined in the Stock Incentive Plan), the committee may provide for:
141
Amendment and Termination
The board of directors or the committee may amend, alter or discontinue the Stock Plan in any respect at any time, but no amendment may diminish any of the rights of a participant under any Awards previously granted without his or her consent, except as may be necessary to comply with applicable laws.
Federal Income Tax Consequences of Awards Under the Stock Incentive Plan
When a non-qualified stock option is granted, there are no income tax consequences for the option holder or us. When a non-qualified stock option is exercised, the option holder recognizes compensation equal to the excess of the fair market value of the common stock on the date of exercise over the exercise price multiplied by the number of shares of common stock subject to the option that was exercised. In general, we are entitled to a deduction equal to the compensation recognized by the option holder for our taxable year that ends with or within the taxable year in which the option holder recognized the compensation.
When an incentive stock option is granted, there are no income tax consequences for the option holder or us. When an incentive stock option is exercised, the option holder does not recognize income and we do not receive a deduction. The option holder, however, must treat the excess of the fair market value of the common stock on the date of exercise over the exercise price as an item of adjustment for purposes of the alternative minimum tax.
If the option holder disposes of the common stock after the option holder has held the common stock for at least two years after the incentive stock option was granted and one year after the incentive stock option was exercised, the amount the option holder receives upon the disposition over the exercise price is treated as long-term capital gain for the option holder. We are not entitled to a deduction. If the option holder makes a "disqualifying disposition" of the common stock by disposing of the common stock before it has been held for at least two years after the date the incentive option was granted and one year after the date the incentive option was exercised, the option holder recognizes compensation income equal to the excess of (i) the fair market value of the common stock on the date the incentive option was exercised or, if less, the amount received on the disposition over (ii) the exercise price. In general, we are entitled to a deduction equal to the compensation recognized by the option holder for our taxable year that ends with or within the taxable year in which the option holder recognized the compensation.
When a stock appreciation right is granted, there are no income tax consequences for the participant or us. When a stock appreciation right is exercised, the participant recognizes compensation equal to the cash and/or the fair market value of the shares received upon exercise. In general, we are entitled to a deduction equal to the compensation recognized by the participant with respect to an Award.
Generally, when phantom stock, a share of restricted stock, a performance award or other stock-based award (other than unrestricted stock in lieu of cash compensation) is granted, there are no income tax consequences for the participant or us. Upon the payment to the participant of common shares and/or cash in respect of the Award or the release of restrictions on restricted stock, the participant recognizes compensation equal to the fair market value of the cash and/or shares as of the date of delivery or release. Upon the grant of unrestricted stock, a participant will recognize compensation equal to the fair market value of the shares as of the grant date. In general, we are
142
entitled to a deduction equal to the compensation recognized by the participant with respect to other stock-based awards.
Employment Agreements
Mr. Hulme is party to an employment agreement with Huntsman Advanced Materials (Europe) BVBA, which is subject to annual renewal. This agreement currently entitles Mr. Hulme to an annual U.K. base salary of £210,000 or an annual Belgian base salary of €260,000 and a bonus of up to €130,000. Mr. Hulme is required to elect how to receive his annual base salary each year. For the current year, Mr. Hulme has elected to receive 15% of his annual U.K. base salary and 85% of his annual Belgian base salary. We do not have employment agreements with any of our other named executive officers.
143
PRINCIPAL AND SELLING STOCKHOLDERS
The following table sets forth information regarding the beneficial ownership of our common stock, giving effect to the Reorganization Transaction and as adjusted to reflect the sale of common stock in this offering, by:
| |
Shares Beneficially Owned Prior to this Offering |
|
Shares Beneficially Owned After this Offering |
|||||||
|---|---|---|---|---|---|---|---|---|---|---|
| Name of Beneficial Owner(1) |
Number of Shares Being Offered |
|||||||||
| Number |
Percentage |
Number |
Percentage |
|||||||
| HMP Investments LLC | ||||||||||
| Huntsman Family Holdings Company LLC(2) | ||||||||||
| MatlinPatterson Global Opportunities Partners, L.P.(3) | ||||||||||
| MatlinPatterson Global Opportunities Partners B, L.P.(4) | ||||||||||
| MatlinPatterson Global Opportunities Partners (Bermuda), L.P.(5) | ||||||||||
| Jon M. Huntsman(6)(7) | ||||||||||
| Peter R. Huntsman(7)(8)(9) | ||||||||||
| David J. Matlin(7)(10) | ||||||||||
| Richard Michaelson(7)(11) | ||||||||||
| Christopher Pechock(7)(9) | ||||||||||
| J. Kimo Esplin(7)(9) | ||||||||||
| Samuel D. Scruggs(7)(9) | ||||||||||
| Douglas A. L. Coombs(12) | ||||||||||
| Paul G. Hulme(7)(9) | ||||||||||
| Patrick W. Thomas(13) | ||||||||||
| All directors and executive officers as a group (15 persons)(7) | ||||||||||
144
may be deemed to have voting and dispositive power over the shares owned by HMP Investments LLC. The address of MatlinPatterson Global Opportunities B, L.P. is 520 Madison Avenue, New York, New York 10022.
145
CERTAIN RELATIONSHIPS AND RELATED TRANSACTIONS
Aircraft Sublease
On December 29, 2000, Jstar Corporation ("Jstar"), a Utah corporation wholly owned by Jon M. Huntsman, purchased for the amount of $8.753 million the interest of Airstar Corporation ("Airstar"), a subsidiary of HLLC, in a lease (the "Mellon Lease") pursuant to which Airstar leased a Gulfstream IV-SP Aircraft (the "Aircraft"), and in a sublease (the "Prior Sublease") under which certain of our subsidiaries subleased the Aircraft from Airstar. The consideration for this transaction was consistent with that amount opined as fair by Gulfstream Aerospace Corporation in its opinion letter to Airstar dated December 29, 2000. Sublease payments from Airstar to Jstar during the period beginning December 29, 2000, and ending September 14, 2001, totaled $1.7 million. On September 14, 2001, the Mellon Lease and the Prior Sublease were terminated and Jstar entered into a new lease of the Aircraft. In connection therewith, Airstar and Jstar entered into a new sublease regarding the Aircraft. Monthly sublease payments from Airstar to Jstar are in the amount of approximately $195,000. These monthly sublease payments are used to fund financing costs paid by Jstar to a leasing company. An unrelated third party pays $2 million per year to HLLC for such third-party's part-time use of the Aircraft (or an alternate owned by us if the Aircraft is unavailable), subject to an annual adjustment, which we believe to be at least fair market value for the number of flight hours used by such third party. We bear all other costs of operating the Aircraft.
Subordinated Loan
On July 2, 2001, we borrowed $25.0 million from Horizon Ventures LLC, an affiliated entity controlled by Jon M. Huntsman, and executed a note payable in the same amount. The note bears interest at a rate of 15% per year and is due and payable on the earlier of: (1) July 2, 2011, (2) repayment in full in cash of all indebtedness under the HLLC Credit Facilities and the HLLC Subordinated Notes, or (3) commencement of a voluntary case under Title 11 of the U.S. Code or any similar law for the relief of debtors or our consent to the institution of a bankruptcy or an insolvency proceeding against us, or the making of a general assignment for the benefit of our creditors. Interest is not paid in cash, but is accrued at a designated rate of 15% per year, compounded annually. As of September 30, 2004 and December 31, 2003, accrued interest added to the principal balance was $14.5 million and $10.5 million, respectively. We intend to use a portion of the net proceeds of this offering to repay this note in full.
Consulting Agreement with Jon M. Huntsman
We entered into an agreement with Jon M. Huntsman on June 3, 2003, pursuant to which Mr. Huntsman provides consulting services to us at our request. Mr. Huntsman, who is the Chairman of the Board of our company but is not our employee, provides advice and other business consulting services at our request regarding our products, customers, commercial and development strategies, financial affairs, and administrative matters based upon his experience and knowledge of our business, the industry, and the markets within which we compete. Mr. Huntsman's services are utilized both with respect to the conduct of our business in the ordinary course and with respect to strategic development and specific projects. Under the terms of the agreement, which renews automatically for successive one-year terms and which may be terminated by either party at any time, Mr. Huntsman receives $950,000 annually in exchange for his services.
Salt Lake City Office Building
We have agreed with the Jon and Karen Huntsman Foundation, a private charitable foundation established by Jon M. Huntsman, that we will donate our Salt Lake City office building to the
146
foundation, free of debt, at the earlier of such time as we, in our sole discretion, no longer occupy the building or November 30, 2009.
Other Transactions with the Huntsman Family
The following table shows the compensation in excess of $60,000 paid to members of the Huntsman family for services as officers of our company or our subsidiaries in each of the last three fiscal years.
| Name |
Year |
Salary |
Bonus |
Other Compensation |
|||||||
|---|---|---|---|---|---|---|---|---|---|---|---|
| Jon M. Huntsman | 2003 2002 2001 |
$ $ $ |
— — 1,000,000 |
$ $ $ |
— — — |
$ $ $ |
— — 443,359 |
||||
Karen H. Huntsman |
2003 2002 2001 |
$ $ $ |
186,049 182,000 180,250 |
$ $ $ |
20,000 20,000 — |
$ $ $ |
36,437 29,329 45,655 |
||||
Jon M. Huntsman, Jr. |
2003 2002 2001 |
$ $ $ |
262,500 — 408,633 |
$ $ $ |
75,000 — — |
$ $ $ |
125,202 416,000 402,184 |
||||
James H. Huntsman |
2003 2002 2001 |
$ $ $ |
230,024 208,000 205,999 |
$ $ $ |
105,000 100,000 60,000 |
$ $ $ |
619,442 642,052 264,297 |
||||
David H. Huntsman |
2003 2002 2001 |
$ $ $ |
292,449 286,000 283,249 |
$ $ $ |
75,000 100,000 50,000 |
$ $ $ |
53,975 73,011 109,211 |
||||
Paul C. Huntsman |
2003 2002 2001 |
$ $ $ |
178,900 153,125 108,333 |
$ $ $ |
75,000 100,000 50,000 |
$ $ $ |
58,971 61,044 144,831 |
||||
James A. Huffman |
2003 2002 2001 |
$ $ $ |
265,850 260,000 257,500 |
$ $ $ |
75,000 100,000 50,000 |
$ $ $ |
117,342 124,100 162,517 |
||||
David S. Parkin |
2003 2002 2001 |
$ $ $ |
230,025 208,000 206,000 |
$ $ $ |
115,000 100,000 75,000 |
$ $ $ |
157,132 183,660 283,861 |
||||
Karen H. Huntsman is the wife of Jon M. Huntsman, our Chairman of the Board and a director, and the mother of Peter R. Huntsman, our President and Chief Executive Officer and a director. Each of Jon M. Huntsman, Jr., James H. Huntsman, David H. Huntsman and Paul C. Huntsman is a son of Jon M. Huntsman and a brother of Peter R. Huntsman. Each of James A. Huffman and David S. Parkin is a son-in-law of Jon M. Huntsman and a brother-in-law of Peter R. Huntsman. For compensation information relating to Peter R. Huntsman, see "Management—Summary Executive Compensation."
In addition, we made payments to Huntsman Financial Consulting, L.C., of which Jon M. Huntsman is the sole member, in the amounts of $475,000, $314,094, $475,456 and $119,838 in 2004, 2003, 2002 and 2001, respectively. These amounts and the amounts shown in the "Other Compensation" column in the table above include some or all of the following: company contributions to employee benefit plans, housing and education allowances for overseas assignments, travel
147
allowances, automobile and aircraft usage, administrative and security services, and perquisites and personal benefits.
Senior Management Investment
In connection with the HLLC Restructuring, certain of our directors, executive officers and other related persons contributed an aggregate of $2.25 million and certain equity interests in one of our subsidiaries in exchange for approximately 0.7% of the voting membership interests of our predecessor, and, indirectly, 0.6% of the non-voting preferred units of our predecessor. The following table shows the amounts paid and membership interests received by such persons:
| |
Membership Interests Purchased |
|
||||||
|---|---|---|---|---|---|---|---|---|
| Purchaser |
Class A Common |
Preferred |
Amount Paid |
|||||
| Peter R. Huntsman | 28,993 | 1,122,065 | $ | 1,000,000 | ||||
| J. Kimo Esplin | 14,497 | 561,032 | 500,000 | |||||
| Samuel D. Scruggs | 14,497 | 561,032 | 500,000 | |||||
| David S. Parkin | 4,349 | 168,310 | 150,000 | |||||
| L. Russell Healy | 2,899 | 112,206 | 100,000 | |||||
| Total | 65,235 | 2,524,645 | $ | 2,250,000 | ||||
These persons will receive shares of our common stock in exchange for their HLLC membership interests in the Reorganization Transaction. See "Our Company—The Reorganization Transaction."
The HLLC Restructuring
On September 30, 2002, HLLC, various members of the Huntsman family (including Jon M. Huntsman and Peter R. Huntsman), MatlinPatterson, Consolidated Press Holdings Limited ("Consolidated Press") and other persons (including the persons described under "—Senior Management Investment" above) completed the HLLC Restructuring, which included a debt for equity exchange and the acquisition of Consolidated Press' interests in certain of our subsidiaries, including HCCA, HCA and Huntsman Petrochemical Corporation.
Pursuant to the HLLC Restructuring:
148
The AdMat Transaction
On June 30, 2003, in the AdMat Transaction, ownership of Vantico was transferred to Advanced Materials in exchange for substantially all of Vantico's issued and outstanding 12% senior secured notes and approximately $165 million of additional equity provided by MatlinPatterson and other Vantico investors. MatlinPatterson contributed its approximately 88% ownership interest in Advanced Materials to Huntsman Holdings, LLC in exchange for the issuance to MatlinPatterson and other members of Huntsman Holdings, LLC of the following membership interests in Huntsman Holdings, LLC which track the performance of Advanced Materials:
| Membership Interest |
Holder (percentage held) |
|
|---|---|---|
| Series A Tracking Preferred | MatlinPatterson (98.1%) CPH (1.9%) |
|
Series B Tracking Preferred |
Huntsman Family (97%) CPH (3%) |
|
Series C Tracking Preferred |
MatlinPatterson (98.1%) CPH (1.9%) |
|
Series D Tracking Preferred |
Huntsman Family (97%) CPH (3%) |
On March 19, 2004, we acquired an additional 2.1% interest in Advanced Materials from Morgan Grenfell Private Equity Limited in exchange for $7.2 million.
The Reorganization Transaction
We will consummate the Reorganization Transaction in connection with the completion of this offering. In the Reorganization Transaction, Huntsman Holdings, LLC will merge into us, and the existing holders of the common and preferred membership interests in Huntsman Holdings, LLC, including the mandatorily redeemable preferred interests, will receive, directly or indirectly, shares of our common stock in exchange for their interests. In addition, the holders of the HMP Warrants will exchange all of their warrants for shares of our common stock. Immediately prior to the merger, Huntsman Family Holdings and MatlinPatterson will contribute all of their membership interests in Huntsman Holdings, LLC to Investments LLC, which will receive shares of our common stock in exchange for these interests. Huntsman Family Holdings will control Investments LLC, including the voting of the shares of our common stock held by Investments LLC. However, Investments LLC will not be able to vote its shares of our common stock in favor of certain corporate actions without the consent of MatlinPatterson. MatlinPatterson will have control over the disposition of the shares of our common stock held by Investments LLC that are allocated to MatlinPatterson's membership interest in Investments LLC. In addition, Huntsman Family Holdings has agreed to cause all of the shares of our common stock held by Investments LLC to be voted in favor of the election to our board of directors of two nominees designated by MatlinPatterson. Immediately following the Reorganization Transaction and this offering, Investments LLC will hold a majority of our outstanding common stock.
149
Registration Rights Agreement
In connection with the Reorganization Transaction, we intend to enter into a registration rights agreement with Investments LLC and its owners pursuant to which they will have demand and piggyback registration rights for the shares of our common stock that Investments LLC receives in the Reorganizaton Transaction. The agreement will also provide that we will pay the costs and expenses, other than underwriting discounts and commissions, related to the registration and sale of shares of our common stock by Investments LLC that are registered pursuant to this agreement. The agreement will contain customary registration procedures and indemnification and contribution provisions for the benefit of Investments LLC, its owners and us.
150
Our authorized capital stock consists of shares of common stock, par value $0.01 per share, and shares of preferred stock, par value $0.01 per share.
Upon completion of this offering, we expect shares of common stock and no shares of preferred stock will be issued and outstanding.
Common Stock
Holders of common stock are entitled to one vote per share on all matters to be voted upon by the stockholders. The holders of common stock do not have cumulative voting rights in the election of directors. Holders of common stock are entitled to receive ratably dividends if, as and when dividends are declared from time to time by our board of directors out of funds legally available for that purpose, after payment of dividends required to be paid on outstanding preferred stock, as described below, if any. Our senior credit facilities and indentures impose restrictions on our ability to declare dividends with respect to our common stock. Upon liquidation, dissolution or winding up, any business combination or a sale or disposition of all or substantially all of the assets, the holders of common stock are entitled to receive ratably the assets available for distribution to the stockholders after payment of liabilities and accrued but unpaid dividends and liquidation preferences on any outstanding preferred stock. The common stock has no preemptive or conversion rights and is not subject to further calls or assessment by us. There are no redemption or sinking fund provisions applicable to the common stock. All outstanding shares of our common stock, including the common stock offered in this offering, are fully paid and non-assessable.
Preferred Stock
Our certificate of incorporation authorizes our board of directors, without stockholder approval, to establish one or more series of preferred stock and to determine, with respect to any series of preferred stock, the terms and rights of that series, including:
151
The issuance of shares of preferred stock by our board of directors as described above may adversely affect the rights of the holders of our common stock. For example, preferred stock may rank prior to the common stock as to dividend rights, liquidation preference or both, may have full or limited voting rights and may be convertible into shares of common stock. The issuance of shares of preferred stock may discourage third-party bids for our common stock or may otherwise adversely affect the market price of the common stock. In addition, the preferred stock may enable our board of directors to make more difficult or to discourage attempts to obtain control of our company through a hostile tender offer, proxy contest, merger or otherwise, or to make changes in our management.
Anti-Takeover Effects of Certain Provision of Our Certificate of Incorporation and Bylaws
Certain provisions of our certificate of incorporation and bylaws, which are summarized in the following paragraphs, may have an anti-takeover effect and may delay, defer or prevent a tender offer or takeover attempt that a stockholder might consider in its best interest, including those attempts that might result in a premium over the market price for the shares held by stockholders.
Classified Board
Our certificate of incorporation provides that our board of directors will be divided into three classes of directors, with the classes to be as nearly equal in number as possible. As a result, approximately one-third of our board of directors will be elected each year. The classification of directors will have the effect of making it more difficult for stockholders to change the composition of our board. Our certificate of incorporation and the bylaws provide that the number of directors will be fixed from time to time exclusively pursuant to a resolution adopted by the board, but must consist of not less than three or more than fifteen directors.
Removal of Directors; Vacancies
Under the Delaware General Corporation Law ("DGCL"), unless otherwise provided in our certificate of incorporation, directors serving on a classified board may be removed by the stockholders only for cause. Our certificate of incorporation and the bylaws provide that unless otherwise provided in the stockholders agreement, directors may be removed only for cause. In addition, our certificate of incorporation and bylaws also provide that unless otherwise provided in the stockholders agreement, any vacancies on our board of directors will be filled only by the affirmative vote of a majority of the remaining directors, although less than a quorum.
No Stockholder Action by Written Consent; Calling of Special Meetings of Stockholders
Our certificate of incorporation prohibits stockholder action by written consent. It also provides that special meetings of our stockholders may be called only by the chairman of our board or the President or Secretary at the direction of the board of directors.
Advance Notice Requirements for Stockholder Proposals and Director Nominations
Our bylaws provide that stockholders seeking to nominate candidates for election as directors or to bring business before an annual meeting of stockholders must provide timely notice of their proposal in writing to the corporate secretary.
Generally, to be timely, a stockholder's notice must be received at our principal executive offices not less than 90 days nor more than 120 days prior to the first anniversary date of the previous year's annual meeting. Our bylaws also specify requirements as to the form and content of a stockholder's
152
notice. These provisions may impede stockholders' ability to bring matters before an annual meeting of stockholders or make nominations for directors at an annual meeting of stockholders.
Limitations on Liability and Indemnification of Officers and Directors
The DGCL authorizes corporations to limit or eliminate the personal liability of directors to corporations and their stockholders for monetary damages for breaches of directors' fiduciary duties. Our certificate of incorporation includes a provision that eliminates the personal liability of directors for monetary damages for actions taken as a director, except for liability:
Our certificate of incorporation and bylaws provide that we must indemnify our directors and officers to the fullest extent authorized by the DGCL. We are also expressly authorized to carry directors' and officers' insurance providing indemnification for our directors, officers and certain employees for some liabilities. We believe that these indemnification provisions and insurance are useful to attract and retain qualified directors and executive officers.
The limitation of liability and indemnification provisions in our certificate of incorporation and bylaws may discourage stockholders from bringing a lawsuit against directors for breach of their fiduciary duty. These provisions may also have the effect of reducing the likelihood of derivative litigation against directors and officers, even though such an action, if successful, might otherwise benefit us and our stockholders. In addition, your investment may be adversely affected to the extent we pay the costs of settlement and damage awards against directors and officers pursuant to these indemnification provisions.
We also intend to enter into customary indemnification agreements with each of our officers and directors.
There is currently no pending material litigation or proceeding involving any of our directors, officers or employees for which indemnification is sought.
In the opinion of the SEC, indemnification provisions that purport to include indemnification for liabilities arising under the Securities Act are contrary to public policy and are, therefore, unenforceable.
Delaware Anti-Takeover Statute
We are subject to Section 203 of the DGCL. Subject to specified exceptions, Section 203 prohibits a publicly held Delaware corporation from engaging in a "business combination" with an "interested stockholder" for a period of three years after the date of the transaction in which the person became an interested stockholder without the approval of our board of directors or stockholders. "Business combinations" include mergers, asset sales and other transactions resulting in a financial benefit to the "interested stockholder." Subject to various exceptions, an "interested stockholder" is a person who together with his or her affiliates and associates, owns, or within three years did own, 15% or more of the corporation's outstanding voting stock. These restrictions generally prohibit or delay the accomplishment of mergers or other takeover or change in control attempts.
153
Transfer Agent and Registrar
is the transfer agent and registrar for our common stock.
Listing
We have applied to include our common stock for listing on the New York Stock Exchange under the symbol "HUN."
Authorized but Unissued Capital Stock
The DGCL does not require stockholder approval for any issuance of authorized shares. However, the listing requirements of the New York Stock Exchange, which would apply so long as our common stock is listed on the New York Stock Exchange, require stockholder approval of certain issuances equal to or exceeding 20% of the then-outstanding voting power or then outstanding number of shares of common stock. These additional shares may be used for a variety of corporate purposes, including future public offerings, to raise additional capital or to facilitate acquisitions.
One of the effects of the existence of unissued and unreserved common stock or preferred stock may be to enable our board of directors to issue shares to persons friendly to current management, which issuance could render more difficult or discourage an attempt to obtain control of our company by means of a merger, tender offer, proxy contest or otherwise, and thereby protect the continuity of our management and possibly deprive the stockholders of opportunities to sell either shares of common stock at prices higher than prevailing market prices.
154
SHARES ELIGIBLE FOR FUTURE SALE
Upon completion of this offering, we will have shares of common stock outstanding, assuming no exercise of outstanding options. Of these shares, the shares sold in this offering will be available for immediate sale in the public market as of the date of this prospectus. The remaining shares are "restricted securities" under Rule 144 of the Securities Act. Generally, restricted securities that have been owned for two years may be sold immediately after the completion of this offering and restricted securities that have been owned for at least one year may be sold 90 days after completion of this offering subject to compliance with the volume and other limitations of Rule 144. Following this offering, shares will be eligible for sale in the public market beginning 180 days after the date of this prospectus, or earlier with the consent of Citigroup Global Markets, Inc., and common shares will become eligible for sale in the public market at various times following 180 days after the date of this prospectus, subject in each case to the limitations of Rule 144.
Lock-Up Agreements
Pursuant to certain "lock-up" agreements, we and our executive officers, directors, Investments LLC and our other stockholders have agreed, subject to limited exceptions, not to offer, sell, contract to sell, pledge or otherwise dispose of, directly or indirectly, including the filing (or participation in the filing) of a registration statement under the Securities Act relating to, any shares of common stock or securities convertible into or exchangeable or exercisable for any shares of common stock without the prior written consent of Citigroup Global Markets, Inc. for a period of 180 days after the date of this prospectus (subject to extension as described in "Underwriting").
Rule 144
In general, under Rule 144 as currently in effect, beginning 90 days after the date of this prospectus, a person who has beneficially owned restricted shares for at least one year would be entitled to sell in any three- month period up to the greater of:
Sales under Rule 144 are also subject to certain manner of sale and notice requirements and to the availability of current public information about us.
Under Rule 144(k), a person who has not been one of our affiliates during the preceding 90 days and who has beneficially owned the restricted shares for at least two years is entitled to sell them without complying with the manner of sale, public information, volume limitation or notice provisions of Rule 144.
Rule 701
Any of our employees, directors, officers, consultants or advisors who purchased shares from us in connection with a written stock or option plan before the effective date of this offering is entitled to rely on the resale provisions of Rule 701, subject to the lock-up agreements described above. In general, Rule 701 permits non-affiliates to sell their Rule 701 shares 90 days after the effectiveness of a registration statement relating to a company's initial public offering without having to comply with the public information, holding period, volume limitation or notice provisions of Rule 144 and permits affiliates to sell their Rule 701 shares without having to comply with the holding period of Rule 144.
155
Registration Rights
After this offering, the holders of common shares will be entitled to rights with respect to the registration of these shares under the Securities Act. If these shares are registered under these laws, they would become freely tradable immediately upon the effectiveness of the registration, except for shares purchased by affiliates.
Investments LLC. In connection with the Reorganization Transaction, we intend to enter into a registration rights agreement with Investments LLC and its owners pursuant to which they will have demand and piggyback registration rights for the shares of our common stock that Investments LLC receives in the Reorganizaton Transaction. The agreement will also provide that we will pay the costs and expenses, other than underwriting discounts and commissions, related to the registration and sale of shares of our common stock by Investments LLC that are registered pursuant to this agreement. The agreement will contain customary registration procedures and indemnification and contribution provisions for the benefit of Investments LLC, its owners and us.
Former HMP Warrant Holders. Pursuant to a registration rights agreement between us and the former holders of the HMP Warrants (the "Former HMP Warrant Holders"), the holders of at least 25% of the shares of our common stock that are exchanged for the HMP Warrants in the Reorganization Transaction have the right, on one occasion following the one-year anniversary of this offering, to demand that we register all or any portion of their shares of our common stock for sale in a shelf registration statement under the Securities Act. Despite a registration demand, we may delay filing of the registration statement for a reasonable time not to exceed 60 days if, in the judgment of our board of directors, filing the registration statement would require the disclosure of pending or contemplated matters or information which would have a material adverse effect on the business, operations or prospects of our company or the disclosure otherwise relates to a material business transaction which has not yet been publicly disclosed. Further, if we propose to register any shares of our common stock under the Securities Act, except for shares of common stock issued in connection with acquisitions and benefit plans, the Former HMP Warrant Holders will have the right to include their shares of common stock in the registration, subject to certain limitations.
The agreement provides for customary registration procedures. We will pay all costs and expenses, other than underwriting discounts and commissions, fees of counsel to the Former HMP Warrant Holders and transfer taxes, if any, related to the registration and sale of shares of our common stock by any Former HMP Warrant Holder that are registered pursuant to this agreement.
The agreement contains customary indemnification and contribution provisions by us for the benefit of the Former HMP Warrant Holders. Each Former HMP Warrant Holder has agreed to indemnify us and the other Former HMP Warrant Holders solely with respect to information provided by such holder, with such indemnification being limited to the proceeds from the offering received by such holder.
Stock Options
In connection with the consummation of this offering, we will grant options to purchase a total of common shares under the Stock Incentive Plan to our directors, executive officers and employees. Additional common shares will be available for future option grants under the Stock Plan. We intend to file a registration statement on Form S-8 to register common shares issued or reserved for issuance under our existing stock option plan within 180 days after the date of this prospectus, thus permitting the resale of such shares by nonaffiliates in the public market without restriction under the Securities Act.
156
MATERIAL UNITED STATES FEDERAL TAX CONSEQUENCES TO
NON-U.S. HOLDERS OF COMMON STOCK
The following is a general discussion of the material U.S. federal income and estate tax considerations with respect to the ownership and disposition of common stock applicable to Non-U.S. Holders. Unless otherwise stated, this discussion is limited to the tax consequences to those Non-U.S. Holders who hold such common stock as capital assets. For purposes of this discussion a "Non-U.S. Holder" is any beneficial owner of common stock other than:
In the case of shares of our common stock held by a partnership, the tax treatment of a partner generally will depend upon the status of the partner and the activities of the partnership. This discussion is based on current provisions of the Internal Revenue Code, Treasury Regulations promulgated under the Internal Revenue Code, judicial opinions, published positions of the Internal Revenue Service, and other applicable authorities, all of which are subject to change or differing interpretations, possibly with retroactive effect. This discussion does not address all aspects of income and estate taxation or any aspects of state, local, or non-U.S. taxes, nor does it consider any specific facts or circumstances that may apply to particular Non-U.S. Holders that may be subject to special treatment under the U.S. federal tax laws, such as insurance companies, tax-exempt organizations, financial institutions, brokers, dealers in securities, and U.S. expatriates.
You are urged to consult your tax advisor regarding the U.S. federal, state, local and non-U.S. income and other tax considerations of acquiring, holding and disposing of shares of our common stock.
Dividends
In general, dividends paid to a Non-U.S. Holder will be subject to U.S. withholding tax at a rate of 30% of the gross amount, or a lower rate prescribed by an applicable income tax treaty, unless the dividends are effectively connected with a trade or business carried on by the Non-U.S. Holder within the United States (or, in the case of an applicable income tax treaty, are attributable to a permanent establishment in the United States). Dividends that are effectively connected with such a U.S. trade or business (or attributable to a permanent establishment in the United States) generally will not be subject to U.S. withholding tax if the Non-U.S. Holder files the required forms, including Internal Revenue Service Form W-8ECI or any successor form, with the payor of the dividend, and instead will be subject to U.S. federal income tax on a net income basis, in the same manner as if the Non-U.S. Holder were a resident of the United States. A Non-U.S. Holder that is a corporation may be subject to an additional branch profits tax at a rate of 30%, or such lower rate as may be specified by an applicable income tax treaty. A Non-U.S. Holder is required to satisfy certification requirements in order to claim a reduced rate of withholding tax under an applicable income tax treaty, including the filing of Internal Revenue Service Form W-8BEN or any successor form.
157
A Non-U.S. Holder of common stock that is eligible for a reduced rate of U.S. federal income tax withholding under a tax treaty may obtain a refund of any excess amounts withheld by filing an appropriate claim for refund with the Internal Revenue Service.
Gain on Sale or Other Disposition of Common Stock
In general, a Non-U.S. Holder will not be subject to U.S. federal income tax on any gain realized upon the sale or other taxable disposition of shares of common stock so long as:
We believe that we have not been and are not currently a United States real property holding corporation, and we do not expect to become one in the future based on our anticipated business operations.
Estate Tax
Common stock owned or treated as owned by an individual who is not a citizen or resident, as defined for U.S. federal estate tax purposes, of the United States at the time of death will be includible in the individual's gross estate for U.S. federal estate tax purposes and therefore may be subject to U.S. federal estate tax, unless an applicable estate tax treaty provides otherwise.
Information Reporting, Backup Withholding and Other Reporting Requirements
We must report annually to the Internal Revenue Service and to each Non-U.S. Holder the amount of dividends paid to, and the tax withheld with respect to, each Non-U.S. Holder. These reporting requirements apply regardless of whether withholding was reduced or eliminated by an applicable tax treaty. Copies of this information also may be made available under the provisions of a specific treaty or agreement with the tax authorities in the country in which the Non-U.S. Holder resides or is established.
U.S. backup withholding tax is currently imposed at the rate of 28% on applicable payments to persons that fail to furnish the information required under the U.S. information reporting requirements. The payment of dividends or the payment of proceeds from the disposition of common stock to a Non-U.S. Holder may be subject to backup withholding unless the recipient certifies under penalties of perjury as to its foreign status and certain other requirements are met, or the Non-U.S. Holder otherwise establishes an exemption. The payment of proceeds from the disposition of common stock to or through a non-U.S. office of a broker generally will not be subject to backup withholding or information reporting; however, such a payment of proceeds may be subject to information reporting, but generally not backup withholding, if the broker is:
158
Backup withholding is not an additional tax. Any amounts withheld under the backup withholding rules from a payment to a Non-U.S. Holder can be refunded or credited against the Non-U.S. Holder's U.S. federal income tax liability, if any, provided that the required information is furnished to the Internal Revenue Service in a timely manner.
Each prospective Non-U.S. Holder of common stock should consult that holder's own tax adviser with respect to the federal, state, local and foreign tax consequences of the acquisition, ownership and disposition of our common stock.
159
Citigroup Global Markets Inc., Credit Suisse First Boston LLC, Merrill Lynch, Pierce Fenner & Smith Incorporated and Deutsche Bank Securities Inc. are acting as joint bookrunning managers of the offering, and are acting as representatives of the underwriters named below. Subject to the terms and conditions stated in the underwriting agreement dated the date of this prospectus, each underwriter named below has agreed to purchase, and we and the selling stockholder have agreed to sell to that underwriter, the number of shares set forth opposite the underwriter's name.
| Underwriter |
|
Number of Shares |
||
|---|---|---|---|---|
| Citigroup Global Markets Inc. | ||||
| Credit Suisse First Boston LLC | ||||
| Merrill Lynch, Pierce, Fenner & Smith Incorporated |
||||
| Deutsche Bank Securities Inc. | ||||
| Total | ||||
The underwriting agreement provides that the obligations of the underwriters to purchase the shares included in this offering are subject to approval of legal matters by counsel and to other conditions. The underwriters are obligated to purchase all the shares (other than those covered by the over-allotment option described below) if they purchase any of the shares. If an underwriter defaults, the underwriting agreement provides that the purchase commitments of the non-defaulting underwriters may be increased or the underwriting agreement may be terminated.
The underwriters propose to offer some of the shares directly to the public at the public offering price set forth on the cover page of this prospectus and some of the shares to dealers at the public offering price less a concession not to exceed $ per share. The underwriters may allow, and dealers may reallow, a concession not to exceed $ per share on sales to other dealers. If all the shares are not sold at the initial offering price, the representatives may change the public offering price and the other selling terms. The representatives have advised us and the selling stockholder that the underwriters do not intend sales to discretionary accounts to exceed five percent of the total number of shares of our common stock offered by them.
We and the selling stockholder have granted to the underwriters an option, exercisable for 30 days from the date of this prospectus, to purchase up to additional shares of common stock at the public offering price less the underwriting discount. The underwriters may exercise the option solely for the purpose of covering over-allotments, if any, in connection with this offering. To the extent the option is exercised, each underwriter must purchase a number of additional shares approximately proportionate to that underwriter's initial purchase commitment.
We, our executive officers and directors, the selling stockholder and our other stockholders have agreed that, for a period of 180 days from the date of this prospectus, we and they will not, subject to limited exceptions, without the prior written consent of Citigroup Global Markets Inc., offer, sell, contract to sell, pledge or otherwise dispose of, directly or indirectly, including the filing (or participation in the filing) of a registration statement under the Securities Act relating to, any shares of our common stock or any securities convertible into or exchangeable for our common stock. Citigroup Global Markets Inc. in its sole discretion may release any of the securities subject to these lock-up agreements at any time without notice. In the event that either (x) during the last 17 days of the
160
180-day period referred to above, we issue an earnings release or a press release announcing a significant event or (y) prior to the expiration of such 180 days, we announce that we will release earnings or issue a press release announcing a significant event during the 17-day period beginning on the last day of such 180-day period, the restrictions described above shall continue to apply until the expiration of the 17-day period beginning on the date of the earnings or the significant event press release.
At our request, the underwriters have reserved up to % of the shares of common stock for sale at the initial public offering price to persons who are directors, officers or employees, or who are otherwise associated with us through a directed share program. The number of shares of common stock available for sale to the general public will be reduced by the number of directed shares purchased by participants in the program. Any directed shares not purchased will be offered by the underwriters to the general public on the same basis as all other shares of common stock offered. Participants in the directed share program must agree, subject to limited exceptions, not to offer, sell, contract to sell, pledge or otherwise dispose of, directly or indirectly, including the filing (or participation in the filing) of a registration statement under the Securities Act relating to, any shares of our common stock or any securities convertible into or exchangeable for our common stock without the prior written consent of Citigroup Global Markets Inc. for a period of days after the date of this prospectus. We have agreed to indemnify the underwriters against certain liabilities and expenses, including liabilities under the Securities Act, in connection with the sales of the directed shares.
Each underwriter has represented, warranted and agreed that:
Prior to this offering, there has been no public market for our common stock. Consequently, the initial public offering price for the shares was determined by negotiations among us, the selling stockholder and the representatives. Among the factors considered in determining the initial public offering price were our record of operations, our current financial condition, our future prospects, our
161
markets, the economic conditions in and future prospects for the industry in which we compete, our management, and currently prevailing general conditions in the equity securities markets, including current market valuations of publicly traded companies considered comparable to our company. We cannot assure you, however, that the prices at which the shares will sell in the public market after this offering will not be lower than this initial public offering price or that an active trading market in our common stock will develop and continue after this offering.
The following table shows the underwriting discounts and commissions that we and the selling stockholder are to pay to the underwriters in connection with this offering. These amounts are shown assuming both no exercise and full exercise of the underwriters' option to purchase additional shares of common stock.
| |
Paid by us |
Paid by selling stockholder |
||||||||||
|---|---|---|---|---|---|---|---|---|---|---|---|---|
| |
No Exercise |
Full Exercise |
No Exercise |
Full Exercise |
||||||||
| Per Share | $ | $ | $ | $ | ||||||||
| Total | $ | $ | $ | $ | ||||||||
In connection with the offering, Merrill Lynch, Pierce, Fenner & Smith Incorporated, on behalf of the underwriters, may purchase and sell shares of common stock in the open market. These transactions may include short sales, syndicate covering transactions and stabilizing transactions. Short sales involve syndicate sales of common stock in excess of the number of shares to be purchased by the underwriters in the offering, which creates a syndicate short position. "Covered" short sales are sales of shares made in an mount up to the number of shares represented by the underwriters' over-allotment option. In determining the source of shares to close out the covered syndicate short position, the underwriters will consider, among other things, the price of shares available for purchase in the open market as compared to the price at which they may purchase shares through the over-allotment option. Transactions to close out the covered syndicate short involve either purchasers of the common stock in the open market after the distribution has been completed or the exercise of the over-allotment option. The underwriters may also make "naked" short sales of shares in excess of the over-allotment option. The underwriters must close out any naked short position by purchasing shares of common stock in the open market. A naked short position is more likely to be created if the underwriters are concerned that there may be downward pressure on the price of the shares in the open market after pricing that could adversely affect investors who purchase in the offering. Stabilizing transactions consist of bids for or purchases of shares in the open market while the offering is in progress.
The underwriters also may impose a penalty bid. Penalty bids permit the underwriters to reclaim a selling concession from a syndicate member when an underwriter repurchases shares originally sold by that syndicate member in order to cover syndicate short positions or make stabilizing purchases.
Any of these activities may have the effect of preventing or retarding a decline in the market price of the common stock. They may also cause the price of the common stock to be higher than the price that would otherwise exist in the open market in the absence of these transactions. The underwriters may conduct these transactions on the New York Stock Exchange or in the over-the-counter market, or otherwise. If the underwriters commence any of these transactions, they may discontinue them at any time.
We expect the shares to be approved for listing on the New York Stock Exchange under the symbol "HUN."
We and the selling stockholder estimate that our respective portions of the total expenses of this offering will be $ and $ .
An affiliate of Deutsche Bank Securities Inc. is an agent and lender under the HLLC Credit Facilities. An affiliate of Deutsche Bank Securities Inc. is an agent and a lender, and affiliates of Credit
162
Suisse First Boston LLC, Citigroup Global Markets Inc. and Merrill Lynch, Pierce, Fenner & Smith Incorporated are lenders, under the HI Credit Facility. In such capacities each has received customary fees for such services. In addition, Credit Suisse First Boston LLC and certain of its affiliates and employees are limited partners in MatlinPatterson Global Opportunities Partners, L.P. and, therefore, have an indirect economic interest in our company. Affiliates of Credit Suisse First Boston LLC provide private banking services to Jon M. Huntsman and other members of the Huntsman family from time to time, including asset management, retail brokerage and margin lending services on customary terms. Credit Suisse First Boston LLC, Deutsche Bank Securities Inc. and Citigroup Global Markets Inc. acted as initial purchasers in the HLLC Senior Secured Notes offerings in September 2003 and December 2003, and Credit Suisse First Boston LLC, Citigroup Global Markets Inc., Deutsche Bank Securities Inc. and Merrill Lynch, Pierce, Fenner & Smith Incorporated acted as initial purchasers in the HLLC Senior Notes offering in June 2004. In such capacities each has received customary fees and commissions for such services.
Credit Suisse First Boston LLC acted as an initial purchaser in the HMP Discount Notes offering in May 2003, and Deutsche Bank Securities Inc. and Credit Suisse First Boston LLC acted as initial purchasers in the HI Senior Notes offering in April 2003. In such capacities each received customary fees and commissions for such services. Deutsche Bank Securities Inc. acted as an initial purchaser in connection with the AdMat Senior Secured Notes offering in June 2003, and an affiliate of Deutsche Bank Securities Inc. is an agent and a lender, and affiliates of Credit Suisse First Boston LLC are lenders, under the AdMat Revolving Credit Facility. In such capacities each has received customary fees and commissions.
The underwriters and their affiliates have performed investment banking and advisory services for us and our affiliates from time to time for which they received customary fees and expenses. The underwriters may, from time to time, engage in transactions and perform services for us, our subsidiaries or our affiliates in the ordinary course of their business.
A prospectus in electronic format may be made available on the websites maintained by one or more of the underwriters. The representatives may agree to allocate a number of shares to underwriters for sale to their online brokerage account holders. The representatives will allocate shares to underwriters that may make Internet distributions on the same basis as other allocations. In addition, shares may be sold by the underwriters to securities dealers who resell shares to online brokerage account holders.
We and the selling stockholder have agreed to indemnify the underwriters against certain liabilities, including liabilities under the Securities Act of 1933, or to contribute to payments the underwriters may be required to make because of any of those liabilities.
163
The validity of the common stock offered by this prospectus will be passed upon for us by Vinson & Elkins L.L.P., Houston, Texas. The underwriters have been represented by Skadden, Arps, Slate, Meagher & Flom LLP, New York, New York.
The consolidated financial statements of Huntsman Holdings, LLC and subsidiaries as of December 31, 2003 and 2002 and for each of the three years in the period ended December 31, 2003, included in this prospectus and the related financial statement schedules have been audited by Deloitte & Touche LLP, an independent registered public accounting firm, as stated in their report appearing herein (which report expresses an unqualified opinion and includes an explanatory paragraphs regarding (i) the change in method of computing depreciation expense in 2003 and (ii) the adoption of SFAS Nos. 141 and 142 in 2002 and SFAS No. 133 in 2001), and have been so included in reliance upon the report of such firm given upon their authority as experts in accounting and auditing.
The financial statements of Huntsman Advanced Materials LLC and subsidiaries as of December 31, 2003 and for the six months ended December 31, 2003, included in this prospectus have been audited by Deloitte & Touche LLP, an independent registered public accounting firm, as stated in their report appearing herein (which report expresses an unqualified opinion and includes an explanatory paragraph regarding the restatement of the consolidated statements of equity and cash flows), and have been so included in reliance upon the report of such firm given upon their authority as experts in accounting and auditing.
The financial statements of Vantico Group S.A. and subsidiaries as of December 31, 2002 and for the six months ended June 30, 2003 and for the years ended December 31, 2002 and 2001, included in this prospectus have been audited by Deloitte S.A., an independent registered public accounting firm, as stated in their report appearing herein (which report expresses an unqualified opinion and includes an explanatory paragraph regarding the adoption of SFAS No. 142 in 2002), and have been so included in reliance upon the report of such firm given upon their authority as experts in accounting and auditing.
The financial statements of Huntsman International Holdings LLC as of December 31, 2002 and 2001 and for each of the three years in the period ended December 31, 2002, included in this prospectus have been audited by Deloitte & Touche LLP, an independent registered public accounting firm, as stated in their report appearing herein (which report expresses an unqualified opinion and includes explanatory paragraphs regarding (i) the adoption of SFAS No. 142 in 2002 and SFAS No. 133 in 2001 and (ii) the restatement of the consolidated statements of cash flows), and have been so included in reliance upon the report of such firm given upon their authority as experts in accounting and auditing.
The balance sheet of Huntsman Corporation as of October 31, 2004 included in this prospectus has been audited by Deloitte & Touche LLP, an independent registered public accounting firm, as stated in their report appearing herein, and has been so included in reliance upon the report of such firm given upon their authority as experts in accounting and auditing.
WHERE YOU CAN FIND MORE INFORMATION
We have filed with the SEC a registration statement on Form S-1. This prospectus, which forms a part of the registration statement, does not contain all the information included in the registration statement. Certain information is omitted and you should refer to the registration statement and its exhibits. With respect to references made in this prospectus to any of our contracts or other documents, such references are not necessarily complete and you should refer to the exhibits attached
164
to the registration statement for copies of the actual contract or document. You may read and copy the registration statement, including exhibits and schedules filed with it, at the SEC's public reference facilities in Room 1024, Judiciary Plaza, 450 Fifth Street, N.W., Washington, D.C. 20549. You may obtain information on the operation of the SEC's public reference facilities by calling the SEC at 1-800-SEC-0330. The SEC maintains a website (http://www.sec.gov) that contains reports, proxy and information statements and other information regarding registrants, such as us, that file electronically with the SEC.
Upon completion of this offering, we will become subject to the information and periodic reporting requirements under the Exchange Act and, in accordance with this law, will file periodic reports, proxy statements and other information with the SEC. These periodic reports, proxy statements and other information will be available for inspection and copying at the SEC's public reference facilities and the website of the SEC referred to above.
165
GLOSSARY OF CHEMICAL ABBREVIATIONS
| APAO | Amorphous polyalphaolefin | |
| BDO | Butadienol | |
| BLR | Basic liquid epoxy resin | |
| DEG | Diethylene glycol | |
| DGA™ | DiGlycolAmine | |
| DPA | Diphenylamine | |
| EG | Ethylene glycol | |
| EO | Ethylene oxide | |
| EPP | Expandable polypropylene | |
| EPS | Expandable polystyrene | |
| HDPE | High-density polyethylene | |
| LAB | Linear alkylbenezene | |
| LAS | Linear alkylbenzene sulfonate | |
| LDPE | Low-density polyethylene | |
| LLDPE | Linear low-density polyethylene | |
| LNG | Liquefied natural gas | |
| MDI | Diphenylmethane diisocyanate | |
| MEG | Monoethylene glycol | |
| MNB | Mononitrobenzene | |
| MTBE | Methyl tertiary butyl ether | |
| NGL | Natural gas liquid | |
| PET | Polyethylene terephthalate | |
| PG | Propylene glycol | |
| PO | Propylene oxide | |
| PTA | Purified terephthalic acid | |
| PVC | Polyvinyl chloride | |
| SB | Styrene-butadiene | |
| SBR | Styrene-butadiene rubber | |
| TBA | Tertiary butyl alcohol | |
| TBHP | Tertiary butyl hydroperoxide | |
| TDI | Toluene diisocyanate | |
| TEG | Triethylene glycol | |
| TPO | Thermoplastic polyolefin | |
| TPU | Thermoplastic polyurethane | |
| UPR | Unsaturated polyester resin |
166
F-1
HUNTSMAN HOLDINGS, LLC AND SUBSIDIARIES
CONSOLIDATED BALANCE SHEETS
(UNAUDITED)
(Dollars in Millions)
| |
September 30, 2004 |
December 31, 2003 |
||||||
|---|---|---|---|---|---|---|---|---|
| ASSETS | ||||||||
| Current assets: | ||||||||
| Cash and cash equivalents | $ | 239.1 | $ | 208.3 | ||||
| Accounts and notes receivables (net of allowance for doubtful accounts of $23.7 and $26.5, respectively) | 1,395.8 | 1,096.1 | ||||||
| Accounts receivable from affiliates | 7.5 | 6.6 | ||||||
| Inventories | 1,132.6 | 1,039.3 | ||||||
| Prepaid expenses | 70.6 | 39.6 | ||||||
| Deferred income taxes | 20.6 | 14.7 | ||||||
| Other current assets | 69.5 | 108.3 | ||||||
| Total current assets | 2,935.7 | 2,512.9 | ||||||
| Property, plant and equipment, net | 5,014.8 | 5,079.3 | ||||||
| Investment in unconsolidated affiliates | 167.5 | 158.0 | ||||||
| Intangible assets, net | 264.8 | 316.8 | ||||||
| Goodwill | 3.3 | 3.3 | ||||||
| Deferred income taxes | 21.3 | 28.8 | ||||||
| Notes receivable from affiliates | 28.9 | 25.3 | ||||||
| Other noncurrent assets | 557.5 | 613.0 | ||||||
| Total assets | $ | 8,993.8 | $ | 8,737.4 | ||||
| LIABILITIES AND STOCKHOLDERS' DEFICIT | ||||||||
| Current liabilities: | ||||||||
| Accounts payable, including overdraft of $nil and $7.5, respectively | $ | 887.1 | $ | 812.0 | ||||
| Accounts payable to affiliates | 32.6 | 20.1 | ||||||
| Accrued liabilities | 689.8 | 702.0 | ||||||
| Deferred income taxes | 18.9 | 15.1 | ||||||
| Current portion of long-term debt | 54.8 | 137.1 | ||||||
| Total current liabilities | 1,683.2 | 1,686.3 | ||||||
| Long-term debt | 6,106.4 | 5,737.5 | ||||||
| Long-term debt—affiliates | 39.5 | 35.5 | ||||||
| Deferred income taxes | 242.1 | 234.8 | ||||||
| Other noncurrent liabilities | 653.2 | 584.7 | ||||||
| Total liabilities | 8,724.4 | 8,278.8 | ||||||
| Minority interest in common stock of consolidated subsidiary | 29.2 | 30.5 | ||||||
| Minority interest in warrants of consolidated subsidiary | 128.7 | 128.7 | ||||||
| Manditorily redeemable preferred member's interest | 552.9 | 487.1 | ||||||
| Commitments and contingencies (Note 16, 17 and 18) | ||||||||
Stockholders' deficit: |
||||||||
| Preferred members' interest (liquidation preference of $513.3) | 195.7 | 194.4 | ||||||
| Common members' interest: | ||||||||
| Class A units, 10,000,000 issued and outstanding | — | — | ||||||
| Class B units, 10,000,000 issued and outstanding | — | — | ||||||
| Additional paid-in capital | 734.4 | 800.2 | ||||||
| Accumulated deficit | (1,470.0 | ) | (1,243.5 | ) | ||||
| Accumulated other comprehensive income | 98.5 | 61.2 | ||||||
| Total stockholders' deficit | (441.4 | ) | (187.7 | ) | ||||
| Total liabilities and stockholders' deficit | $ | 8,993.8 | $ | 8,737.4 | ||||
See accompanying notes to consolidated financial statements
F-2
HUNTSMAN HOLDINGS, LLC AND SUBSIDIARIES
CONSOLIDATED STATEMENTS OF OPERATIONS AND COMPREHENSIVE LOSS
(UNAUDITED)
(Dollars in Millions)
| |
Nine Months Ended September 30, |
|||||||
|---|---|---|---|---|---|---|---|---|
| |
2004 |
2003 |
||||||
| Revenues: | ||||||||
| Trade sales | $ | 8,323.6 | $ | 4,632.5 | ||||
| Related party sales | 34.1 | 78.6 | ||||||
| Total revenues | 8,357.7 | 4,711.1 | ||||||
| Cost of goods sold | 7,358.0 | 4,258.7 | ||||||
| Gross profit | 999.7 | 452.4 | ||||||
| Expenses: | ||||||||
| Selling, general and administrative | 512.1 | 313.0 | ||||||
| Research and development | 62.2 | 42.9 | ||||||
| Other operating expense (income) | 6.6 | (22.6 | ) | |||||
| Restructuring and plant closing costs | 202.4 | 27.2 | ||||||
| Total expenses | 783.3 | 360.5 | ||||||
| Operating income | 216.4 | 91.9 | ||||||
| Interest expense, net | (459.5 | ) | (260.7 | ) | ||||
| Loss on accounts receivable securitization program | (10.2 | ) | (11.9 | ) | ||||
| Equity in income (losses) of investment in unconsolidated affiliates | 3.0 | (38.2 | ) | |||||
| Other (expense) income | (0.8 | ) | 0.4 | |||||
| Loss before income taxes and minority interests | (251.1 | ) | (218.5 | ) | ||||
| Income tax benefit | 25.7 | 3.8 | ||||||
| Loss before minority interest | (225.4 | ) | (214.7 | ) | ||||
| Minority interest in subsidiaries' (income) loss | (1.1 | ) | 0.5 | |||||
| Net loss | (226.5 | ) | (214.2 | ) | ||||
| Preferred members' interest dividend | (58.4 | ) | (55.7 | ) | ||||
| Net loss available to common equity holders | $ | (284.9 | ) | $ | (269.9 | ) | ||
| Net loss | $ | (226.5 | ) | $ | (214.2 | ) | ||
| Other comprehensive (loss) income | (12.0 | ) | 101.6 | |||||
| Comprehensive loss | $ | (238.5 | ) | $ | (112.6 | ) | ||
See "Note 1—General" concerning the consolidation of HIH and AdMat and the resulting effect on the comparability of amounts.
See accompanying notes to consolidated financial statements
F-3
HUNTSMAN HOLDINGS, LLC AND SUBSIDIARIES
CONSOLIDATED STATEMENT OF STOCKHOLDERS' DEFICIT
(UNAUDITED)
(Dollars and Shares in Millions)
| |
Preferred member's interest |
Class A and Class B common members' units |
Additional paid-in capital |
Accumulated deficit |
Accumulated other comprehensive income |
Total |
Manditorily redeemable preferred member's interest |
||||||||||||||
|---|---|---|---|---|---|---|---|---|---|---|---|---|---|---|---|---|---|---|---|---|---|
| Balance, January 1, 2004 | $ | 194.4 | $ | — | $ | 800.2 | $ | (1,243.5 | ) | $ | 61.2 | $ | (187.7 | ) | $ | 487.1 | |||||
| Net loss | — | — | — | (226.5 | ) | — | (226.5 | ) | — | ||||||||||||
| Purchase accounting adjustment | 1.3 | — | — | — | 49.3 | 50.6 | — | ||||||||||||||
| Other comprehensive loss | — | — | — | — | (12.0 | ) | (12.0 | ) | — | ||||||||||||
| Dividends accrued on manditorily redeemable preferred member's interest | — | — | (65.8 | ) | — | — | (65.8 | ) | 65.8 | ||||||||||||
| Balance, September 30, 2004 | $ | 195.7 | $ | — | $ | 734.4 | $ | (1,470.0 | ) | $ | 98.5 | $ | (441.4 | ) | $ | 552.9 | |||||
See accompanying notes to consolidated financial statements
F-4
HUNTSMAN HOLDINGS, LLC AND SUBSIDIARIES
CONSOLIDATED STATEMENTS OF CASH FLOWS
(UNAUDITED)
(Dollars in Millions)
| |
Nine Months Ended September 30, 2004 |
Nine Months Ended September 30, 2003 |
|||||
|---|---|---|---|---|---|---|---|
| Cash Flows From Operating Activities: | |||||||
| Net loss | $ | (226.5 | ) | $ | (214.2 | ) | |
| Adjustments to reconcile net income (loss) to net cash used in operating activities: | |||||||
| Equity in (income) losses of investment in unconsolidated affiliates | (3.0 | ) | 38.2 | ||||
| Depreciation and amortization | 410.3 | 230.5 | |||||
| Noncash restructuring, plant closing, and asset impairment charges | 109.0 | 12.3 | |||||
| Provision for losses on accounts receivable | 2.1 | 3.8 | |||||
| Loss on early extinguishment of debt | 1.9 | — | |||||
| Loss on disposal of plant and equipment | 1.3 | 3.0 | |||||
| Noncash interest expense | 118.0 | 44.5 | |||||
| Deferred income taxes | (55.8 | ) | (17.4 | ) | |||
| Unrealized gain on foreign currency transactions | (26.1 | ) | (17.4 | ) | |||
| Minority interests in subsidiaries | 1.1 | (0.5 | ) | ||||
| Changes in operating assets and liabilities: | |||||||
| Accounts and notes receivables | (231.8 | ) | 14.7 | ||||
| Change in receivables sold, net | (64.9 | ) | (10.2 | ) | |||
| Inventories | (97.7 | ) | 51.8 | ||||
| Prepaid expenses | 12.2 | (34.9 | ) | ||||
| Other current assets | 16.9 | (9.4 | ) | ||||
| Other noncurrent assets | (39.8 | ) | (28.3 | ) | |||
| Accounts payable | 104.3 | (101.6 | ) | ||||
| Accrued liabilities | (2.2 | ) | (2.9 | ) | |||
| Other noncurrent liabilities | 26.6 | 1.4 | |||||
| Net cash used in operating activities | 55.9 | (36.6 | ) | ||||
| Investing Activities: | |||||||
| Capital expenditures | (145.0 | ) | (129.9 | ) | |||
| Investment in unconsolidated affiliate | (11.8 | ) | (292.1 | ) | |||
| Acquisition of minority interests | (7.3 | ) | — | ||||
| Net cash received from unconsolidated affiliates | 10.1 | 2.4 | |||||
| Proceeds from sale of fixed assets | 3.3 | 0.1 | |||||
| Acquisition of business, net of cash acquired | — | (397.6 | ) | ||||
| Purchase of Vantico senior notes | — | (22.7 | ) | ||||
| Advances to unconsolidated affiliates | (2.4 | ) | (3.2 | ) | |||
| Net cash used in investing activities | (153.1 | ) | (843.0 | ) | |||
| Financing Activities: | |||||||
| Net borrowings under revolving loan facilities | 70.8 | 59.3 | |||||
| Repayment of overdraft | (7.5 | ) | — | ||||
| Proceeds from issuance of long-term debt | 1,827.5 | 1,034.3 | |||||
| Repayment of long-term debt | (1,729.3 | ) | (251.9 | ) | |||
| Principal payments on notes payable | (10.5 | ) | (104.3 | ) | |||
| Proceeds from issuance of warrants | — | 104.2 | |||||
| Cost of raising capital | — | (10.1 | ) | ||||
| Cash contributions to subsidiary, later exchanged for preferred members' interest | — | 164.4 | |||||
| Distribution to member | — | (2.2 | ) | ||||
| Capital contribution by minority shareholder | 2.7 | 1.8 | |||||
| Debt issuance costs paid | (25.5 | ) | (47.8 | ) | |||
| Net cash provided by financing activities | 128.2 | 947.7 | |||||
| Effect of exchange rate changes on cash | (0.2 | ) | 5.3 | ||||
| Increase in cash and cash equivalents | 30.8 | 73.4 | |||||
| Cash and cash equivalents at beginning of period | 208.3 | 31.4 | |||||
| Cash and cash equivalents of HIH at May 1, 2003 (date of consolidation) | — | 62.2 | |||||
| Cash and cash equivalents at end of period | $ | 239.1 | $ | 167.0 | |||
| Supplemental cash flow information: | |||||||
| Cash paid for interest | $ | 372.1 | 218.3 | ||||
| Cash paid for income taxes | 22.5 | 7.7 | |||||
See "Note 1—General" concerning the consolidation of HIH and AdMat and the resulting effect on the comparability of amounts.
See accompanying notes to consolidated financial statements
F-5
HUNTSMAN HOLDINGS, LLC AND SUBSIDIARIES
NOTES TO CONSOLIDATED FINANCIAL STATEMENTS (UNAUDITED)
1. General
Description of Business
Huntsman Holdings, LLC (the "Company" and, unless the context otherwise requires, its subsidiaries) is a global manufacturer and marketer of differentiated and commodity chemicals. The Company produces a wide range of products for a variety of global industries, including the chemical, plastics, automotive, aviation, footwear, paints and coatings, construction, technology, agriculture, healthcare, consumer products, textile, furniture, appliance and packaging industries. The Company operates at facilities located in North America, Europe, Asia, Australia, South America and Africa. The Company's business is organized into six reportable operating segments: Polyurethanes, Advanced Materials, Performance Products, Polymers, Pigments and Base Chemicals.
In this report, "HGI" refers to Huntsman Group, Inc. "HMP" refers to HMP Equity Holdings Corporation and, unless the context otherwise requires, its subsidiaries "HLLC" or "Huntsman LLC" refers to Huntsman LLC and, unless the context otherwise requires, its subsidiaries, "Huntsman Polymers" refers to Huntsman Polymers Corporation and, unless the context otherwise requires, its subsidiaries, "Huntsman Specialty" refers to Huntsman Specialty Chemicals Corporation, "HCCA" refers to Huntsman Chemical Company Australia Pty. Ltd. and, unless the context otherwise requires, its subsidiaries, "HI" refers to Huntsman International LLC and, unless the context otherwise requires, its subsidiaries, "HIH" refers to Huntsman International Holdings LLC and, unless the context otherwise requires, its subsidiaries, "HGI" refers to Huntsman Group, Inc., LLC, "AdMat" refers to Huntsman Advanced Materials LLC and, unless the context otherwise requires, its subsidiaries, "AdMat Investment" refers to Huntsman Advanced Materials Investment LLC, "AdMat Holdings" refers to Huntsman Advanced Materials Holdings LLC, "Vantico" refers to Vantico Group S.A. and, unless the context otherwise requires, its subsidiaries, "MatlinPatterson" refers to MatlinPatterson Global Opportunities Partners, L.P. and its affiliates, "Consolidated Press" refers to Consolidated Press Holdings Limited and its subsidiaries, "SISU" refers to SISU Capital Limited and its affiliates, "MGPE" refers to Morgan Grenfell Private Equity Limited and its affiliates and "ICI" refers to Imperial Chemical Industries PLC and its subsidiaries.
Company
The Company is a Delaware limited liability company, and the voting membership interests of the Company are owned by the Huntsman family, MatlinPatterson, Consolidated Press and certain members of the Company's senior management. In addition, the Company has issued certain non-voting preferred units to Huntsman Holdings Preferred Member LLC, which, in turn, is owned, by MatlinPatterson (indirectly), Consolidated Press, the Huntsman Cancer Foundation, certain members of the Company's senior management and the Huntsman family. The Company has also issued certain non-voting preferred units to the Huntsman family, MatlinPatterson and Consolidated Press that track the performance of AdMat, the Company's indirect subsidiary. The Huntsman family has board and operational control of the Company.
The Company operates its businesses through three principal operating subsidiaries, Huntsman LLC, HIH and AdMat. Each of the Company's principal operating subsidiaries is separately financed, its debt is non-recourse to the Company and the Company has no contractual obligations to fund its respective operations. Moreover, the debt of Huntsman LLC is non-recourse to HIH and AdMat, the debt of HIH is non-recourse to Huntsman LLC and AdMat, and the debt of AdMat is non-recourse to Huntsman LLC and HIH.
F-6
The Company was formed on September 30, 2002 to hold, among other things, the equity interests of Huntsman LLC. Prior to September 30, 2002, Huntsman LLC was owned by members of the Huntsman family and by certain affiliated entities. On September 30, 2002, Huntsman LLC and its subsidiary, Huntsman Polymers, completed debt for equity exchanges (the "Restructuring"). Pursuant to the Restructuring, the Huntsman family contributed all their equity interests in Huntsman LLC and its subsidiaries, including minority interests acquired from Consolidated Press and the interests described in the second following paragraph, to the Company in exchange for equity interests in the Company. MatlinPatterson and Consolidated Press exchanged approximately $679 million in principal amount of Huntsman LLC's outstanding subordinated notes and Huntsman Polymers' outstanding senior notes they held into equity interests in the Company. There was also approximately $84 million in accrued interest that was cancelled as a result of the exchange. The net book value of the $763 million of principal and accrued interest, after considering debt issuance costs, was $753 million. The Company contributed its investment in Huntsman LLC to HMP.
In the Restructuring, the effective cancellation of debt was recorded as a capital contribution because MatlinPatterson and Consolidated Press received equity of the Company in exchange. The fair value of the equity received approximated the carrying value of the debt exchanged. No gain was recorded on the Restructuring.
Also related to the Restructuring, in June 2002, MatlinPatterson entered into an agreement with ICI (the "Option Agreement"). The Option Agreement provided BNAC, Inc. ("BNAC"), then a MatlinPatterson subsidiary, with an option to acquire the ICI subsidiary that held a 30% membership interest in HIH (the "ICI 30% Interest") on or before May 15, 2003 upon the payment of $180 million plus accrued interest from May 15, 2002, and subject to completion of the purchase of the senior subordinated reset discount notes due 2009 of HIH that were originally issued to ICI (the "HIH Senior Subordinated Discount Notes"). Concurrently, BNAC paid ICI $160 million to acquire the HIH Senior Subordinated Discount Notes, subject to certain conditions, including the obligation to make an additional payment of $100 million plus accrued interest to ICI. The HIH Senior Subordinated Discount Notes were pledged to ICI as collateral security for such additional payment.
In connection with the Restructuring, all the shares in BNAC were contributed to the Company. The Company caused BNAC to be merged into HMP. As a result of its merger with BNAC, HMP held the interests formerly held by BNAC in the HIH Senior Subordinated Discount Notes and the option to acquire the subsidiary of ICI that held the ICI 30% Interest. The HIH Senior Subordinated Discount Notes were valued at $273.1 million (including accrued interest of $13.1 million) and the note payable to ICI of $103.5 million (including accrued interest of $3.5 million) was recorded by the Company. The net contribution of $169.7 million was accounted for as an equity contribution.
Prior to May 9, 2003, the Company owned, directly and indirectly, approximately 61% of the membership interests of HIH. The Company accounted for its investment in HIH on the equity method due to the significant management participation rights formerly granted to ICI pursuant to the HIH limited liability company agreement. On May 9, 2003, the Company exercised an option and purchased the ICI subsidiary that held ICI's 30% membership interest in HIH, and, at that time, the Company also purchased approximately 9% of the HIH membership interests held by institutional investors (the "HIH Consolidation Transaction"). The total consideration paid in connection with the HIH Consolidation Transaction was $286.0 million. As a result of the HIH Consolidation Transaction, the Company, directly, and indirectly, owns 100% of the HIH membership interests, and, as of May 1,
F-7
2003, HIH is a consolidated subsidiary of the Company and is no longer accounted for on an equity basis.
The Company accounted for this acquisition using the purchase method; accordingly, the results of operations and cash flows of the acquired interests were consolidated with those of the Company beginning in May 2003. During the second quarter of 2004, the Company finalized the allocation of the purchase price. As part of its final purchase price allocation, the Company valued the related pension liabilities, recorded deferred taxes and reclassified certain other amounts resulting in a corresponding increase in property, plant and equipment of $285.0 million. The following is a summary of the final allocation of the purchase price to assets acquired and liabilities assumed (dollars in millions):
| Current assets | $ | 533.6 | ||
| Property, plant and equipment | 1,605.9 | |||
| Noncurrent assets | 194.5 | |||
| Current liabilities | (344.3 | ) | ||
| Long-term debt | (1,427.6 | ) | ||
| Deferred taxes | (145.4 | ) | ||
| Noncurrent liabilities | (130.7 | ) | ||
| Cash paid for acquisition | $ | 286.0 | ||
On June 30, 2003, the Company, MatlinPatterson, SISU Capital Ltd. ("SISU"), HGI, and Morgan Grefell Private Equity Limited ("MGPE") completed a restructuring and business combination involving Vantico, whereby ownership of the equity of Vantico was transferred to AdMat in exchange for substantially all of the issued and outstanding Vantico senior notes ("Vantico Senior Notes") and approximately $165 million of additional equity (the "AdMat Transaction"). In connection with the AdMat Transaction, AdMat issued $250 million aggregate principal amount of its 11% senior secured notes due 2010 (the "AdMat Fixed Rate Notes") and $100 million aggregate principal amount of its senior secured floating rate notes due 2008 at a discount of 2%, or for $98 million (the "AdMat Floating Rate Notes" and, collectively with the AdMat Fixed Rate Notes, the "AdMat Senior Secured Notes"). Proceeds from the issuance of the AdMat Senior Secured Notes, along with a portion of the additional equity, were used to purchase 100% of the Vantico senior secured credit facilities (the "Vantico Credit Facilities"). Also in connection with the AdMat Transaction, AdMat entered into a $60 million senior secured revolving credit facility (the "AdMat Revolving Credit Facility"). The AdMat Transaction was completed as follows:
F-8
The AdMat Transaction has been accounted for as follows:
F-9
The Company has completed its allocation of the purchase price to the assets and liabilities of AdMat, which is summarized as follows (dollars in millions):
| Current assets | $ | 415.8 | ||
| Current liabilities | (242.4 | ) | ||
| Property, plant and equipment, net | 397.9 | |||
| Intangible assets, net | 37.0 | |||
| Deferred tax | (8.6 | ) | ||
| Other noncurrent assets | 44.2 | |||
| Other noncurrent liabilities | (122.1 | ) | ||
| Minority interest | (29.2 | ) | ||
| HGI's interest in preferred stock | (195.7 | ) | ||
| Net assets acquired | $ | 296.9 | ||
The acquired intangible assets represent trademarks and patents which have a weighted-average useful life of approximately 15-30 years. The following table reflects the Company's results of operations on a pro forma basis as if the business combination of HIH and AdMat had been completed at the beginning of the periods presented utilizing HIH and Vantico's historical results (dollars in millions):
| |
Nine Months Ended September 30, 2003 |
|||
|---|---|---|---|---|
| Revenue | $ | 6,885.2 | ||
| Loss before income tax benefit and minority interest | (300.6 | ) | ||
| Net loss | (329.5 | ) | ||
The pro forma information is not necessarily indicative of the operating results that would have occurred had the AdMat Transaction been consummated on January 1, 2003, nor are they necessarily indicative of future operating results.
On March 19, 2004, the Company acquired an additional 2.1% equity interest in AdMat Holdings from MGPE for $7.3 million.
Interim Financial Statements
The unaudited consolidated financial statements of the Company were prepared in accordance with accounting principles generally accepted in the United States of America ("GAAP") and, in management's opinion, all adjustments, consisting only of normal recurring adjustments necessary for a fair presentation of results of operations, financial position and cash flows for the periods shown, have been made. Results for interim periods are not necessarily indicative of those to be expected for the full year. These financial statements should be read in conjunction with the audited consolidated financial statements and notes to consolidated financial statements included elsewhere in this registration statement.
F-10
Use of Estimates
The preparation of financial statements in conformity with GAAP requires management to make estimates and assumptions that affect the reported amounts of assets and liabilities and disclosure of contingent assets and liabilities at the date of the financial statements and the reported amounts of revenues and expenses during the reporting period. Actual results could differ from those estimates.
Reclassifications
Certain amounts in the consolidated financial statements for prior periods have been reclassified to conform with the current presentation.
2. Recently Issued Financial Accounting Standards
In January 2003, the Financial Accounting Standards Board ("FASB") issued Financial Interpretation No. ("FIN") 46, "Consolidation of Variable Interest Entities." FIN 46 addresses the requirements for business enterprises to consolidate related entities, for which they do not have controlling interests through voting or other rights, if they are determined to be the primary beneficiary as a result of variable economic interests. Transfers to a qualifying special purpose entity are not subject to this interpretation. In December 2003, the FASB issued a complete replacement of FIN 46 (FIN 46R), to clarify certain complexities. The Company is required to adopt this standard on January 1, 2005 and is currently evaluating its impact. While the Company's evaluation of this interpretation is ongoing, it is possible that its implementation may require the de-consolidation of the results of operations of AdMat Investment and its wholly-owned subsidiaries, including AdMat, and accounting for the results of this investment on the equity method. The adoption of the standard may also require the consolidation of HI's Rubicon Inc. joint venture; however, the consolidation of the joint venture will not be significant to the financial statements.
3. Securitization of Accounts Receivable
On December 21, 2000, HI initiated an accounts receivable securitization program under which it grants an undivided interest in certain of its trade receivables to a qualified off-balance sheet entity (the "Receivables Trust") at a discount. This undivided interest serves as security for the issuance of commercial paper and medium term notes by the Receivables Trust. At September 30, 2004, the Receivables Trust had outstanding approximately $197 million in U.S. dollar equivalents in medium term notes and approximately $37 million in commercial paper. Under the terms of the agreements, HI and its subsidiaries continue to service the receivables in exchange for a 1% fee of the outstanding receivables, and HI is subject to recourse provisions.
HI's retained interest in receivables (including servicing assets) subject to the program was approximately $251.5 million and $153.4 million as of September 30, 2004 and December 31, 2003, respectively. The value of the retained interest is subject to credit and interest rate risk. For the nine months ended September 30, 2004 and 2003, new sales of accounts receivable sold into the program totaled approximately $3,669.1 million and $3,085.2 million, respectively, and cash collections from receivables sold into the program that were reinvested totaled approximately $3,635.5 million and $3,074.1 million, respectively. Servicing fees received during the nine months ended September 30, 2004 and 2003 were approximately $4.0 million and $3.6 million, respectively.
F-11
HI incurs losses on the accounts receivable securitization program for the discount on receivables sold into the program and fees and expenses associated with the program. HI also retains responsibility for the economic gains and losses on forward contracts mandated by the terms of the program to hedge the currency exposures on the collateral supporting the off-balance sheet debt issued. Gains and losses on forward contracts included as a component of the loss on accounts receivable securitization program are a loss of $1.0 million and a loss of $14.2 million for the nine months ended September 30, 2004 and 2003, respectively. As of September 30, 2004 and December 31, 2003, the fair value of the open forward currency contracts was $0.3 million and $6.8 million, respectively, which is included as a component of the residual interest that is included as a component of trade receivables on HI's balance sheet. On April 16, 2004, HI amended the commercial paper facility. Pursuant to the amendment, the maturity of the commercial paper facility was extended to March 31, 2007. In addition, the amendment permits the issuance of euro-denominated commercial paper.
The key economic assumptions used in valuing the residual interest at September 30, 2004 are presented below:
| Weighted average life (in months) | Approx. 1.5 | |
| Credit losses (annual rate) | Less than 1% | |
| Discount rate (annual rate) | Approx. 1% |
A 10% and 20% adverse change in any of the key economic assumptions would not have a material impact on the fair value of the retained interest. Total receivables over 60 days past due as of September 30, 2004 and December 31, 2003 were $13.4 million and $15.6 million, respectively.
4. Inventories
Inventories consist of the following (dollars in millions):
| |
September 30, 2004 |
December 31, 2003 |
|||||
|---|---|---|---|---|---|---|---|
| Raw materials and supplies | $ | 296.7 | $ | 283.6 | |||
| Work in progress | 192.4 | 32.7 | |||||
| Finished goods | 721.9 | 749.5 | |||||
| Total | 1,211.0 | 1,065.8 | |||||
| LIFO reserves | (77.9 | ) | (15.5 | ) | |||
| Lower of cost or market reserves | (0.5 | ) | (11.0 | ) | |||
| Net | $ | 1,132.6 | $ | 1,039.3 | |||
In the normal course of operations, the Company at times exchanges raw materials and finished goods with other companies for the purpose of reducing transportation costs. The net open exchange positions are valued at the Company's cost. Net amounts deducted from or added to inventory under open exchange agreements, which represent the net amounts payable or receivable by the Company under open exchange agreements, were approximately $5.4 million receivable and $8.2 million payable (32.8 million and 26.9 million pounds, respectively) at September 30, 2004 and December 31, 2003, respectively.
F-12
5. Property, Plant and Equipment
The cost and accumulated depreciation of property, plant and equipment consist of the following (dollars in millions):
| |
September 30, 2004 |
December 31, 2003 |
|||||
|---|---|---|---|---|---|---|---|
| Land | $ | 123.4 | $ | 118.6 | |||
| Buildings | 488.2 | 517.8 | |||||
| Plant and equipment | 6,250.4 | 6,387.3 | |||||
| Construction in progress | 233.1 | 253.8 | |||||
| Total | 7,095.1 | 7,277.5 | |||||
| Less accumulated depreciation | (2,080.3 | ) | (2,198.2 | ) | |||
| Net | $ | 5,014.8 | $ | 5,079.3 | |||
6. Investments in Unconsolidated Affiliates
The Company's ownership percentage and investments in unconsolidated affiliates, primarily manufacturing joint ventures, consist of the following (dollars in millions):
| |
September 30, 2004 |
December 31, 2003 |
||||
|---|---|---|---|---|---|---|
| Equity Method: | ||||||
| Polystyrene Australia Pty Ltd. | $ | 4.5 | $ | 3.6 | ||
| Sasol-Huntsman GmbH and Co. KG (50%) | 14.5 | 13.2 | ||||
| Louisiana Pigment Company, L.P. (50%) | 121.3 | 130.4 | ||||
| Rubicon, LLC (50%) | 5.6 | 1.0 | ||||
| BASF Huntsman Shanghai Isocyanate Investment BV (50%) (1) | 17.9 | 6.1 | ||||
| Others | 1.2 | 1.2 | ||||
| Total equity method investments | 165.0 | 155.5 | ||||
| Cost Method: | ||||||
| Gulf Advanced Chemicals Industry Corporation (4%) | 2.5 | 2.5 | ||||
| Total investments | $ | 167.5 | $ | 158.0 | ||
F-13
7. Intangible Assets
The gross carrying amount and accumulated amortization of intangible assets consist of the following (dollars in millions):
| |
September 30, 2004 |
December 31, 2003 |
||||||||||||||||
|---|---|---|---|---|---|---|---|---|---|---|---|---|---|---|---|---|---|---|
| |
Gross Carrying Amount |
Accumulated Amortization |
Net |
Gross Carrying Amount |
Accumulated Amortization |
Net |
||||||||||||
| Patents, trademarks, and technology | $ | 414.8 | $ | 171.5 | $ | 243.3 | $ | 427.0 | $ | 144.5 | $ | 282.5 | ||||||
| Licenses and other agreements | 18.3 | 10.7 | 7.6 | 18.3 | 9.5 | 8.8 | ||||||||||||
| Non-compete agreements | 49.6 | 42.5 | 7.1 | 49.6 | 38.5 | 11.1 | ||||||||||||
| Other intangibles | 7.5 | 0.7 | 6.8 | 16.8 | 2.4 | 14.4 | ||||||||||||
| Total | $ | 490.2 | $ | 225.4 | $ | 264.8 | $ | 511.7 | $ | 194.9 | $ | 316.8 | ||||||
Amortization expense for intangible assets for the nine month period ended September 30, 2004 and 2003 was $25.8 million and $32.4 million, respectively. Estimated future amortization expense for intangible assets over the next five years is as follows (dollars in millions):
| Year Ended December 31 |
Estimated Expense |
||
|---|---|---|---|
| 2004 | $ | 31 | |
| 2005 | 31 | ||
| 2006 | 28 | ||
| 2007 | 26 | ||
| 2008 | 26 | ||
8. Other Noncurrent Assets
Other noncurrent assets consist of the following (dollars in millions):
| |
September 30, 2004 |
December 31, 2003 |
||||
|---|---|---|---|---|---|---|
| Prepaid pension assets | $ | 178.9 | $ | 254.4 | ||
| Debt issuance costs | 107.8 | 105.9 | ||||
| Capitalized turnaround expense | 105.2 | 83.9 | ||||
| Spare parts inventory | 96.1 | 100.5 | ||||
| Other noncurrent assets | 69.5 | 68.3 | ||||
| Total | $ | 557.5 | $ | 613.0 | ||
F-14
9. Accrued Liabilities
Accrued liabilities consist of the following (dollars in millions):
| |
September 30, 2004 |
December 31, 2003 |
||||
|---|---|---|---|---|---|---|
| Payroll, severance and related costs | $ | 129.1 | $ | 150.1 | ||
| Interest | 87.0 | 121.4 | ||||
| Volume and rebates accruals | 89.9 | 89.5 | ||||
| Income taxes | 36.2 | 53.0 | ||||
| Taxes (property and VAT) | 73.5 | 63.3 | ||||
| Pension liabilities | 22.8 | 21.3 | ||||
| Restructuring and plant closing costs | 117.3 | 74.1 | ||||
| Environmental accruals | 7.1 | 8.6 | ||||
| Interest and commodity hedging accruals | 2.0 | 11.3 | ||||
| Other miscellaneous accruals | 124.9 | 109.4 | ||||
| Total | $ | 689.8 | $ | 702.0 | ||
10. Other Noncurrent Liabilities
Other noncurrent liabilities consist of the following (dollars in millions):
| |
September 30, 2004 |
December 31, 2003 |
||||
|---|---|---|---|---|---|---|
| Pension liabilities | $ | 406.8 | $ | 332.9 | ||
| Other postretirement benefits | 81.5 | 86.3 | ||||
| Loss contingency | 16.9 | 12.1 | ||||
| Environmental accruals | 27.5 | 26.3 | ||||
| Other postretirement benefit of unconsolidated affiliate | 43.8 | 42.6 | ||||
| Restructuring and plant closing costs | — | 2.7 | ||||
| Fair value of interest derivative | 18.3 | 9.5 | ||||
| Other noncurrent liabilities | 58.4 | 72.3 | ||||
| Total | $ | 653.2 | $ | 584.7 | ||
11. Restructuring and Plant Closing Costs
As of September 30, 2004 and December 31, 2003, the Company had reserves for restructuring and plant closing costs of $117.3 million and $76.8 million, respectively. During the nine months ended September 30, 2004, the Company, on a consolidated basis, recorded additional reserves of $93.4 million, including reserves for workforce reductions, demolition and decommissioning and other restructuring costs. During the 2004 period, the Company made cash payments against these reserves of $55.5 million.
F-15
As of September 30, 2004, accrued restructuring and plant closing costs by type of cost consist of the following (dollars in millions):
| |
Workforce reductions |
Demolition and decommissioning |
Non-cancelable lease costs |
Other restructuring costs |
Total |
||||||||||||
|---|---|---|---|---|---|---|---|---|---|---|---|---|---|---|---|---|---|
| Accrued liabilities as of December 31, 2003 | $ | 66.4 | $ | 4.1 | $ | 0.2 | $ | 6.1 | $ | 76.8 | |||||||
| Adjustment to the opening balance sheet of AdMat | 0.6 | — | — | 2.0 | 2.6 | ||||||||||||
| Charges (1) | 88.0 | 1.9 | — | 3.5 | 93.4 | ||||||||||||
| Payments (2) | (47.6 | ) | (0.2 | ) | (0.2 | ) | (7.5 | ) | (55.5 | ) | |||||||
| Accrued liabilities as of September 30, 2004 | $ | 107.4 | $ | 5.8 | $ | — | $ | 4.1 | $ | 117.3 | |||||||
Details with respect to the Company's reserves for restructuring and plant closing costs are provided below by segments (dollars in millions):
| |
Polyurethanes |
AdMat |
Performance Products |
Pigments |
Base Chemicals |
Polymers |
Total |
||||||||||||||||
|---|---|---|---|---|---|---|---|---|---|---|---|---|---|---|---|---|---|---|---|---|---|---|---|
| Accrued liabilities as of December 31, 2003 |
$ | 15.8 | $ | 51.5 | $ | 2.4 | $ | 4.3 | $ | — | $ | 2.8 | $ | 76.8 | |||||||||
| Adjustments to the opening balance sheet of AdMat | — | 2.6 | — | — | — | — | 2.6 | ||||||||||||||||
| Charges (1) | 24.8 | — | 24.8 | 30.6 | 9.1 | 4.1 | 93.4 | ||||||||||||||||
| Payments (2) | (12.3 | ) | (23.0 | ) | (4.1 | ) | (12.2 | ) | — | (3.9 | ) | (55.5 | ) | ||||||||||
| Accrued liabilities as of September 30, 2004 | $ | 28.3 | $ | 31.1 | $ | 23.1 | $ | 22.7 | $ | 9.1 | $ | 3.0 | $ | 117.3 | |||||||||
As of December 31, 2003, the Polyurethanes segment reserve consisted of $15.8 million related to the restructuring activities at the Rozenburg, Netherlands site (as announced in 2003), the workforce reductions throughout the Polyurethanes segment (as announced in 2003), and the closure of the Shepton Mallet, U.K. site (as announced in 2002). During the nine months ended September 30, 2004, the Polyurethanes segment recorded additional restructuring charges of $24.8 million and made cash payments of $12.3 million. In the first quarter of 2004, the Polyurethanes segment recorded restructuring expenses of $4.8 million, all of which are payable in cash. In the second quarter of 2004, the Polyurethanes segment announced restructuring charges of $18.1 million, all of which are payable in cash. During the third quarter of 2004, the Polyurethanes segment recorded additional restructuring expenses of $9.9 million, $1.9 million of which are payable in cash and the remainder is an impairment of its West Deptford, New Jersey site. These restructuring activities are expected to result in additional restructuring charges of approximately $9 million through 2005 and result in workforce reductions of approximately 160 positions, of which 52 positions have been reduced during the nine months ended September 30, 2004. As of September 30, 2004, the Polyurethanes segment restructuring reserve totaled $28.3 million.
F-16
In connection with the AdMat Transaction, the Company is implementing a substantial cost reduction program. The program includes reductions in costs in the Advanced Materials segment's global supply chain, reductions in general and administrative costs across the business and the centralization of operations where efficiencies may be achieved. The cost reduction program is expected to continue through June 2005 and is estimated to involve $63.5 million in total restructuring costs, all of which were recorded in the opening balance sheet. The program will result in approximately $53.9 million in costs for workforce reduction and approximately $9.6 million in costs to close plants and discontinue certain service contracts worldwide. The Advanced Materials segment reduced workforce by 188 positions and 151 positions during the six months ended December 31, 2003 and the nine months ended September 30, 2004, respectively.
As of December 31, 2003, the Performance Products segment reserve consisted of $2.4 million relating to the closure of a number of plants at the Whitehaven, U.K. facility, the closure of an administrative office in London, U.K., the rationalization of a surfactants technical center in Oldbury, U.K., and the restructuring of a facility in Barcelona, Spain. During the nine months ended September 30, 2004, the Performance Products segment accrued restructuring charges of $41.2 million consisting of cash charges of $24.8 million and $16.4 million of asset write offs. During the second quarter 2004, the Performance Products segment recorded charges of $20.9 million, of which $5.1 million were payable in cash. These charges primarily related to the announced the closure of the Company's Guelph, Ontario, Canada Performance Products manufacturing facility, involving a restructuring charge of $20.2 million consisting of a $15.8 million asset write down and $4.4 million of charges payable in cash. Production will be moved to the Company's other larger, more efficient facilities. Workforce reductions of approximately 66 positions are anticipated. During the third quarter of 2004, the Company adopted a plan to reduce the workforce across all locations in its European surfactants business by approximately 250 positions. A restructuring charge of $17.5 million was recorded consisting entirely of severance charges to be paid in cash. During the third quarter of 2004, the Company also announced the closure of its maleic anhydride plant in Queeny, Missouri and recorded a restructuring charge of $1.5 million which consisted of a $0.6 million asset write off and a charge payable in cash of $0.9 million. During the third quarter of 2004, the Company also announced the closure of its technical facility in Austin, Texas and recorded a restructuring charge of $1.3 million which is payable in cash. During the nine months ended September 30, 2004, the Company made cash payments of $4.1 million related to restructuring activities. These restructuring activities are not expected to result in additional charges. The Performance Products segment reserve totaled $23.1 million as of September 30, 2004.
On October 27, 2004, the Company adopted a plan to rationalize the Whitehaven, U.K. surfactants operations of its Performance Products segment. The plan includes the closure of substantially all of the Company's Whitehaven, U.K. surfactants manufacturing facility and the reduction of approximately 70 positions at the facility. The rationalization is part of a reorganization of the Company's European surfactants business which is expected to reduce an additional 250 positions over a period of 15 months at facilities throughout Europe. In connection with the rationalization of the Whitehaven facility, the Company expects to recognize a restructuring charge of approximately $51 million in the fourth quarter of 2004, of which approximately $20 million is expected to be payable in cash.
As of December 31, 2003, the Polymers segment reserve consisted of $2.8 million related to its demolition and decommissioning of the Odessa, Texas styrene manufacturing facility and non-cancelable lease costs. During the nine months ended September 30, 2004, the Polymers segment recorded
F-17
restructuring expenses related to the closure of an Australian manufacturing unit of $7.6 million and made cash payments of $3.9 million related to these restructuring activities. Of the $7.6 million of restructuring expenses, $5.2 million were recorded in the second quarter and $2.4 million were recorded in the third quarter, and $4.1 million are payable in cash. These restructuring activities are expected to result in additional charges of less than $1.0 million through 2005 and in workforce reductions of approximately 23 positions. The Polymers segment reserve totaled $3.0 million as of September 30, 2004.
As of September 30, 2004 and December 31, 2003, the Pigments segment reserve consisted of $22.7 million and $4.3 million, respectively. During the nine months ended September 30, 2004, the Pigments segment recorded additional restructuring charges of $111.7 million and made cash payments of $12.2 million. In the first quarter 2004, the Pigments segment recorded restructuring expenses of $3.9 million, all of which are payable in cash. In the second quarter 2004, the Pigments segment recorded restructuring expenses of $104.2 million, of which $81.1 million is not payable in cash. In April 2004, the Company announced that, following a review of the Pigments business, it will idle approximately 55,000 tonnes, or about 10%, of its total titanium dioxide ("TiO2") production capacity in the fourth quarter of 2004. As a result of this decision, the Company has recorded a restructuring charge of $17.0 million to be paid in cash, a $77.2 million asset impairment charge and a $3.9 million charge for the write off of spare parts inventory and other assets. Concerning the impairment charge, the Company determined that the value of the related long-lived assets was impaired and recorded the non-cash charge to earnings for the impairment of these assets. The fair value of these assets for purposes of measuring the impairment was determined using the present value of expected cash flows. Additional second quarter 2004 restructuring activities resulted in a charge of $6.1 million, all of which is payable in cash. In the third quarter of 2004, the Pigments segment recorded restructuring expenses of $3.6 million, all of which are payable in cash, related to workforce reductions at several of its locations worldwide. These restructuring activities are expected to result in additional restructuring charges of approximately $9 million through 2005 and result in workforce reductions of approximately 475 positions, of which 180 positions have been reduced during the nine months ended September 30, 2004.
As of September 30, 2004 and December 31, 2003, the Base Chemicals segment reserve consisted of $9.1 million and nil, respectively, related to workforce reductions arising from the announced change in work shift schedules and in the engineering and support functions at the Wilton and North Tees, U.K. facilities. During the nine months ended September 30, 2004, the Base Chemicals segment recorded restructuring charges of $9.1 million, all of which is payable in cash; $2.2 million of these charges were recorded in the second quarter and $6.9 million were recorded in the third quarter of 2004. These restructuring activities are expected to result in additional charges of approximately $5 million and in workforce reductions of approximately 100 positions.
F-18
12. Debt
Debt outstanding consists of the following (dollars in millions):
| |
September 30, 2004 |
December 31, 2003 |
|||||
|---|---|---|---|---|---|---|---|
| Huntsman LLC Debt, excluding HIH and HI: | |||||||
| Senior secured credit facilities: | |||||||
| Term Loan A | $ | 606.3 | $ | 606.3 | |||
| Term Loan B | 96.1 | 459.0 | |||||
| Revolving facility | 105.0 | 12.2 | |||||
| Other debt: | |||||||
| Huntsman LLC senior secured notes | 451.0 | 450.5 | |||||
| Huntsman Polymers senior unsecured notes | — | 36.8 | |||||
| HLLC senior unsecured fixed rate notes | 300.0 | — | |||||
| HLLC senior unsecured floating rate notes | 100.0 | — | |||||
| Huntsman LLC senior subordinated fixed rate notes | 44.2 | 44.2 | |||||
| Huntsman LLC senior subordinated floating rate notes | 15.1 | 15.1 | |||||
| Huntsman Specialty Chemicals Corporation subordinated note | 100.8 | 99.7 | |||||
| Huntsman Corporation Australia Pty Ltd. (HCA) credit facilities | 41.9 | 44.5 | |||||
| Huntsman Chemical Company Australia (HCCA) credit facilities | 12.3 | 48.7 | |||||
| Subordinated note and accrued interest—affiliate | 39.5 | 35.5 | |||||
| Term note payable to a bank | 9.2 | 9.5 | |||||
| Other | 28.2 | 5.6 | |||||
| Total Huntsman LLC Debt, excluding HIH and HI | 1,949.6 | 1,867.6 | |||||
HI: |
|||||||
| Senior secured credit facilities: | |||||||
| Term B loan | 1,366.6 | 620.1 | |||||
| Term C loan | — | 620.1 | |||||
| Revolving facility | — | 22.0 | |||||
| Other debt: | |||||||
| HI Senior unsecured notes | 456.3 | 457.1 | |||||
| HI Senior subordinated notes | 1,159.6 | 1,169.8 | |||||
| Other long-term debt | 38.4 | 38.0 | |||||
| Total HI debt | 3,020.9 | 2,927.1 | |||||
HIH: |
|||||||
| Senior discount notes | 479.2 | 434.6 | |||||
| Senior subordinated discount notes—affiliate | 400.5 | 358.3 | |||||
| Total HIH debt | 879.7 | 792.9 | |||||
| Total HIH consolidated debt | 3,900.6 | 3,720.0 | |||||
AdMat debt: |
|||||||
| Senior secured notes | 348.5 | 348.2 | |||||
| Other debt | 3.0 | 3.2 | |||||
| Total AdMat debt | 351.5 | 351.4 | |||||
HMP debt: |
|||||||
| HMP Senior Secured Notes (1) (Principal amount $518.2) | 389.5 | 329.4 | |||||
| Total HMP debt | 389.5 | 329.4 | |||||
| Fair value adjustment of HIH debt | 10.0 | — | |||||
| Elimination of HIH Senior subordinated discount notes owned by HMP | (400.5 | ) | (358.3 | ) | |||
| Total debt | $ | 6,200.7 | $ | 5,910.1 | |||
| Current portion | $ | 54.8 | $ | 137.1 | |||
| Long-term portion—excluding affiliate | 6,106.4 | 5,737.5 | |||||
| Total debt—excluding affiliate | 6,161.2 | 5,874.6 | |||||
| Long-term debt—affiliate | 39.5 | 35.5 | |||||
| Total debt | $ | 6,200.7 | $ | 5,910.1 | |||
F-19
HMP Equity Holdings Corporation Debt (excluding Huntsman LLC, HI, HIH and AdMat)
On May 9, 2003, the Company issued units consisting of 15% senior secured discount notes due 2008 (the "HMP Senior Discount Notes") with an accreted value of $423.5 million and 875,000 warrants to purchase approximately 12% of the Company's common stock. Of the $423.5 million, $8.5 million was recorded to reflect a discount of 2%, $285.0 million has been recorded as the initial carrying value for the HMP Senior Discount Notes and $130.0 million was recorded as the carrying value of the warrants. The HMP Senior Discount Notes were issued with original issue discount for U.S. federal income tax purposes. The aggregate proceeds from the units were allocated to the HMP Senior Discount Notes and warrants based upon the relative fair value of each security. Interest on the HMP Senior Discount Notes is paid in kind. The effective interest rate based on the initial carrying value is 23.7%. The HMP Senior Discount Notes are secured by a first priority lien on the HIH Senior Subordinated Discount Notes, the 10% direct and 30% indirect equity interests held by the Company in HIH, the Company's common stock outstanding as of May 9, 2003, and the Company's equity interests in Huntsman LLC. The HMP Senior Discount Notes are redeemable beginning November 15, 2004 at stipulated redemption prices declining from 107.5% to 100% of accreted value by May 15, 2007. The HMP Senior Discount Notes contain certain restrictions including limits on the incurrence of debt, restricted payments, liens, transactions with affiliates, and merger and sales of assets. Management believes that the Company is in compliance with the covenants of the HMP Senior Discount Notes as of September 30, 2004.
The Company issued 875,000 warrants in connection with the HMP Senior Discount Notes, each of which entitled the holder to purchase 2.8094 shares of the Company's common stock for an exercise price of $0.01 per share. On August 7, 2004, the Company completed a 10 for 1 reverse stock split which reduced the number of shares outstanding as of that date from 18,027,214 to 1,802,721. As a result of this reverse stock split, the holders of the warrants are now entitled to purchase 0.28094 shares for each warrant held at an exercise price of $0.10 per share. The warrants became separately transferable from the HMP Senior Discount Notes 180 days after issuance on May 9, 2003, and the warrants become exercisable on November 15, 2004. In certain events, the Company has the right to require the holders of the warrants to exercise or exchange them for other equity securities. The warrants expire on May 15, 2011. On December 23, 2003, the Company repurchased 14,145 warrants at a value of $1.3 million. There are currently 860,855 warrants outstanding. The aggregate number of shares of Company common stock issueable to the warrant holders is 241,849.
Subsidiary Debt
The Company's three principal operating subsidiaries are separately financed, their debt is non-recourse to the Company and the Company has no contractual obligation to fund their respective operations. Moreover, notwithstanding that HIH is consolidated with Huntsman LLC for financial accounting purposes, Huntsman LLC is financed separately from HIH, HIH's debt is non-recourse to Huntsman LLC and Huntsman LLC has no contractual obligation to fund HIH's operations. AdMat is also financed separately from Huntsman LLC and HIH, Huntsman LLC and HIH's debt is non-recourse to AdMat and AdMat has no contractual obligation to fund Huntsman LLC or HIH's operations. The following is a discussion of the debt and liquidity of the Company's three primary subsidiaries.
F-20
Huntsman LLC Debt (Excluding HIH and HI)
Senior Secured Credit Facilities (HLLC Credit Facilities)
As of September 30, 2004, Huntsman LLC's senior secured credit facilities consisted of a $275 million revolving credit facility maturing in 2006 and two term loan facilities maturing in 2007 in the amount of $606.3 million and $96.1 million. On October 14, 2004, Huntsman LLC completed a $1.065 billion refinancing of its senior credit facilities. The new credit facilities (the "HLLC Credit Facilities") consist of a $350 million revolving credit facility due October 2009 (the "HLLC Revolving Facility") and a $715 million term loan B facility due March 2010 (the "HLLC Term Facility"). Proceeds of the refinancing were used to repay in full the outstanding borrowings under Huntsman LLC's prior senior secured credit facilities.
The HLLC Revolving Facility is secured by a first priority lien on substantially all the current and intangible assets of Huntsman LLC and its domestic restricted subsidiaries; and is secured by a second priority lien on substantially all the property, plant and equipment of Huntsman LLC and its restricted domestic subsidiaries and its indirect equity interest in HIH. The HLLC Term Facility is secured by a first priority lien on substantially all of the property, plant and equipment of Huntsman LLC and its restricted domestic subsidiaries and its indirect equity interest in HIH; and by a second priority lien on substantially all of the current and intangible assets of Huntsman LLC and its restricted domestic subsidiaries. The HLLC Credit Facilities are also guaranteed by Huntsman Specialty Chemicals Holdings Corporation ("HSCHC") and Huntsman Specialty Chemicals Corporation ("Huntsman Specialty") and by Huntsman LLC's domestic restricted subsidiaries (collectively, the "HLLC Guarantors"). Neither HIH nor HI are restricted subsidiaries of Huntsman LLC or HLLC Guarantors. As of September 30, 2004 and December 31, 2003, prior to the October 14, 2004 refinancing, the weighted average interest rates on Huntsman LLC's senior credit facilities were 6.4% and 7.3%, respectively, excluding the impact of interest rate hedges.
The HLLC Revolving Facility is subject to a borrowing base of accounts receivable and inventory and is available for general corporate purposes. Borrowings under the HLLC Revolving Facility bear interest, at Huntsman LLC's option, at a rate equal to (i) a LIBOR-based eurocurrency rate plus an applicable margin of 2.25% or (ii) a prime-based rate plus an applicable margin of 1.25%. As of September 30, 2004, prior to the October 14, 2004 refinancing, the interest rate on Huntsman LLC's $275 million revolving facility was LIBOR plus 3.50%.
Borrowings under the HLLC Term Facility bear interest, at Huntsman LLC's option, at a rate equal to (i) a LIBOR-based eurocurrency rate plus an applicable margin of 3.50% or (ii) a prime-based rate plus an applicable margin of 2.50%. The HLLC Term Facility provides for a 0.50% reduction in interest rate margin upon the application of proceeds of a qualified public offering to permanently reduce at least $200 million of indebtedness at Huntsman LLC, of which at least $150 million must be senior secured indebtedness. As of September 30, 2004, prior to the October 14, 2004 refinancing, the interest rates on Huntsman LLC's $606.3 million term loan A and $96.1 million term loan B facilities were LIBOR plus 4.0% and LIBOR plus 9.75%, respectively.
The HLLC Term Facility contains financial covenants including a minimum interest coverage ratio and a maximum debt to EBITDA ratio, as defined, and limits on capital expenditures. The HLLC Revolving Facility contains financial covenants, including a minimum fixed charge coverage ratio, as defined, and limits on capital expenditures. In addition to financial covenants, the HLLC Credit Facilities contain other customary covenants relating to the incurrence of debt, purchase and sale of
F-21
assets, limitations on investments, affiliate transactions, change in control provisions, events of default and acceleration provisions. Management believes that Huntsman LLC is in compliance with the covenants of its senior secured credit facilities as of September 30, 2004.
Senior Secured Notes (HLLC Senior Secured Notes)
On September 30, 2003, Huntsman LLC sold $380 million aggregate principal amount of 11.625% senior secured notes due October 15, 2010 at an issue price of 98.8% (the "September 2003 Offering"). On December 3, 2003, Huntsman LLC sold an additional $75.4 million aggregate principal amount of its senior secured notes (collectively with the notes sold in the September 2003 Offering, the "HLLC Senior Secured Notes") at an issue price of 99.5%. Interest on the HLLC Senior Secured Notes is payable semi-annually on April 15 and October 15. The HLLC Senior Secured Notes are effectively subordinated to all Huntsman LLC's obligations under the HLLC Revolving Facility and rank pari passu with the HLLC Term Facility. The HLLC Senior Secured Notes are guaranteed by the HLLC Guarantors.
The HLLC Senior Secured Notes are redeemable after October 15, 2007 at 105.813% of the principal amount thereof, declining ratably to par on and after October 15, 2009. At any time prior to October 15, 2006, Huntsman LLC may redeem up to 35% of the aggregate principal amount of the HLLC Senior Secured Notes at a redemption price of 111.625% with net cash proceeds of a qualified equity offering.
The indenture governing the HLLC Senior Secured Notes contains covenants relating to the incurrence of debt, limitations on distributions, asset sales and affiliate transactions, among other things. The indenture also requires Huntsman LLC to offer to repurchase the HLLC Secured Notes upon a change of control. Management believes that Huntsman LLC is in compliance with the covenants of the HLLC Secured Notes as of September 30, 2004.
Senior Unsecured Notes (HLLC Senior Notes)
On June 22, 2004, Huntsman LLC sold $300 million of senior unsecured fixed rate notes that bear interest at 11.5% and mature on July 15, 2012 (the "HLLC Unsecured Fixed Rate Notes") and $100 million of senior unsecured floating rate notes that bear interest at a rate equal to LIBOR plus 7.25% and mature on July 15, 2011 (the "HLLC Unsecured Floating Rate Notes," and together with the HLLC Unsecured Fixed Rate Notes, the "HLLC Senior Notes"). The interest rate on the HLLC Unsecured Floating Rate Notes as of September 30, 2004 was 8.80%. The proceeds from the offering were used to repay $362.9 million on Huntsman LLC's prior term loan B and $25 million to repay indebtedness at HCCA. See "Other Debt" below. The HLLC Senior Notes are unsecured obligations of Huntsman LLC and are guaranteed by the HLLC Guarantors.
The HLLC Unsecured Fixed Rate Notes are redeemable after July 15, 2008 at 105.75% of the principal amount thereof, declining ratably to par on and after July 15, 2010. The HLLC Unsecured Floating Rate Notes are redeemable after July 15, 2006 at 104.0% of the principal amount thereof, declining ratably to par on and after July 15, 2008. At any time prior to July 15, 2007, Huntsman LLC may redeem up to 40% of the aggregate principal amount of the HLLC Unsecured Fixed Rate Notes at a redemption price of 111.5% with proceeds of a qualified equity offering. At any time prior to July 15, 2006, Huntsman LLC may redeem up to 40% of the aggregate principal amount of the HLLC
F-22
Unsecured Floating Rate Notes with the proceeds of a qualified equity offering at a redemption price equal to the par value plus LIBOR plus 7.25%.
The indenture governing the HLLC Senior Notes contains covenants relating to the incurrence of debt, limitations on distributions, asset sales and affiliate transactions, among other things. The indenture also requires Huntsman LLC to offer to repurchase the HLLC Senior Notes upon a change of control. Management believes that Huntsman LLC is in compliance with the covenants of the HLLC Senior Notes as of September 30, 2004.
Senior Subordinated Fixed And Floating Rate Notes (HLLC Notes) And Huntsman Polymers Senior Unsecured Notes (Huntsman Polymers Notes)
Huntsman LLC's 9.5% fixed and variable subordinated notes due 2007 (the "HLLC Notes") with an outstanding principal balance of $59.3 million as of September 30, 2004 are unsecured subordinated obligations of Huntsman LLC and are junior in right of payment to all existing and future secured or unsecured senior indebtedness of Huntsman LLC and effectively junior to any secured indebtedness of Huntsman LLC to the extent of the collateral securing such indebtedness. Interest is payable on the HLLC Notes semiannually on January 1 and July 1 at an annual rate of 9.5% on the fixed rate notes and LIBOR plus 3.25% on the floating rate notes. The HLLC Notes are redeemable at the option of Huntsman LLC after July 2002 at a price declining from 104.75% to 100% of par value as of July 1, 2005. The weighted average interest rate on the floating rate notes was 5.2% and 4.4% as of September 30, 2004 and December 31, 2003, respectively. As a result of previously executed amendments to the indentures, virtually all the restrictive covenants contained in the indentures have been eliminated.
On January 28, 2004, Huntsman LLC used $37.5 million of the net cash proceeds from the December 2003 Offering to redeem, in full, Huntsman Polymers' senior unsecured notes (the "Huntsman Polymers Notes") with a principal amount of $36.8 million plus accrued interest. The Huntsman Polymers Notes were unsecured senior obligations of Huntsman Polymers; they had an original maturity of December 2004, and a fixed interest rate of 11.75%.
Other Debt
Huntsman Specialty's subordinated note, in the aggregate principal amount of $75.0 million, accrued interest until April 15, 2002 at 7% per annum. Pursuant to the note agreement, effective April 15, 2002, all accrued interest was added to the principal of the note for a total principal amount of $106.6 million. Such principal balance will be payable in a single installment on April 15, 2008. Interest has been payable quarterly in cash, commencing July 15, 2002. For financial reporting purposes, the note was initially recorded at its estimated fair value of $58.2 million, based on prevailing market rates as of the effective date. As of September 30, 2004 and December 31, 2003, the unamortized discount on the note was $5.8 million and $6.9 million, respectively.
Huntsman Corporation Australia Pty Ltd. ("HCA"), Huntsman LLC's indirect Australian subsidiary that holds its Australian surfactants assets, maintains credit facilities (the "HCA Facilities"). As of September 30, 2004, borrowings under the HCA Facilities totaled A$58.6 million ($41.9 million), which include A$44.0 million ($31.4 million) on the term loan facility and A$14.6 million ($10.5 million) on the revolving credit line. On August 31, 2004, HCA refinanced the previously existing debt facilities with an A$30.0 million ($21.4 million) revolving credit line supported by a
F-23
borrowing base of eligible accounts receivable and inventory and an A$44.0 million ($31.4 million) term facility.
Huntsman Chemical Company Australia Pty Ltd. ("HCCA") and certain Australian affiliates hold Huntsman LLC's Australian styrenics assets. On August 31, 2004, HCCA refinanced the previously existing debt facilities of HCCA with an A$30.0 million ($21.4 million) revolving credit line supported by a borrowing base of eligible accounts receivable (the "HCCA Facility"). As of September 30, 2004 borrowings under the HCCA Facility totaled A$17.2 million ($12.3 million).
The HCA Facilities and the HCCA Facility are secured by a lien on substantially all their respective assets, bear interest at a rate of 2.9% above the Australian base rate, mature in August 2007 and are non-recourse to Huntsman LLC. As of September 30, 2004, the interest rate on the HCA Facilities and the HCCA Facility was 8.38%. On June 24, 2004, Huntsman LLC used $25 million of proceeds from the offering of the HLLC Senior Unsecured Notes to repay a portion of the previously existing debt facilities of HCCA. Management believes that HCA and HCCA are in compliance with the covenants of the HCA Facilities and the HCCA Facility as of September 30, 2004.
On July 2, 2001, Huntsman LLC entered into a 15% note payable with an affiliated entity in the amount of $25.0 million. The note is due and payable on the earlier of: (1) the tenth anniversary of the issuance date, or (2) the date of the repayment in full in cash of all indebtedness of Huntsman LLC under its senior secured credit facilities. Interest is not paid in cash, but is accrued at a designated rate of 15% per annum, compounded annually. As of September 30, 2004 and December 31, 2003, accrued interest added to the principal balance was $14.5 million and $10.5 million, respectively.
As of September 30, 2004, Huntsman LLC has $24.3 million outstanding on short term notes payable for financing a portion of its insurance premiums. Such notes have monthly scheduled amortization payments through April 1, 2005, bear interest at rates ranging from 3.65% to 4.0%, and are secured by unearned insurance premiums.
HI Debt
Senior Secured Credit Facilities (HI Credit Facilities)
As of September 30, 2004, HI had senior secured credit facilities (the "HI Credit Facilities") which consisted of a revolving loan facility of up to $375 million maturing in September 2008 (the "HI Revolving Facility"), which includes a $50 million multicurrency revolving loan facility available in euros, GBP Sterling and U.S. dollars, and a term loan B facility consisting of a $1,305 million term portion and a €50 million (approximately $61.6 million) term portion (the "HI Term Facility"). On July 13, 2004, HI amended and restated the HI Credit Facilities. Prior to the amendment and restatement, the HI Credit Facilities consisted of a $400 million revolving facility that was scheduled to mature on June 30, 2005, a $620.1 million term loan B facility that was scheduled to mature on June 30, 2007, and a $620.1 million term loan C facility that was scheduled to mature on June 30, 2008. At the closing of the amendment and restatement of the HI Credit Facilities on July 13, 2004, HI raised approximately $126.6 million of net proceeds from the issuance of additional term loan borrowings, of which $82.4 million was applied to repay all outstanding borrowings on the HI Revolving Facility and the balance, net of fees, increased cash and cash equivalents. The increase in cash and availability under the HI Revolving Facility is available for general corporate purposes and to provide a portion of funds for the construction of a polyethylene production facility at HI's Wilton, U.K. facility. Scheduled amortization of the HI Term Facility is 1% (approximately $13.7 million) per annum,
F-24
commencing June 30, 2005, with the remaining unpaid balance due at maturity. The maturity of the HI Term Facility is December 31, 2010; provided that the maturity will be accelerated to December 31, 2008 if HI has not refinanced all of the outstanding HI Senior Notes and the HI Subordinated Notes (as defined below) on or before December 31, 2008 on terms satisfactory to the administrative agent under the HI Credit Facilities.
Interest rates for the amended and restated HI Credit Facilities are based upon, at HI's option, either a eurocurrency rate (LIBOR) or a base rate (prime) plus the applicable spread. The applicable spreads vary based on a pricing grid, in the case of eurocurrency-based loans, from 2.25% to 3.25% per annum depending on the loan facility and whether specified conditions have been satisfied, and, in the case of base rate loans, from 1.00% to 2.00% per annum. As of September 30, 2004 and December 31, 2003 (which was prior to the amendment and restatement of the HI Credit Facilities), the average interest rates on the HI Credit Facilities were 5.1% and 5.6%, respectively, excluding the impact of interest rate hedges.
The HI Credit Facilities are secured by a first priority lien on substantially all the assets of HIH, its domestic subsidiaries and certain of HIH's foreign subsidiaries. The HI Credit Facilities are also guaranteed by HIH, HI's domestic subsidiaries and certain of its foreign subsidiaries (the "HI Guarantors").
The HI Credit Facilities contain financial covenants including a minimum interest coverage ratio and a maximum debt to EBITDA ratio, as defined, and limits on capital expenditures. In addition to financial covenants, the HI Credit Facilities contain other customary covenants relating to the incurrence of debt, the purchase and sale of assets, limitations on investments, affiliate transactions, change in control provisions, events of default and acceleration provisions. Management believes that the Company was in compliance with the covenants of the HI Credit Facilities as of September 30, 2004.
HI Senior Notes and HI Senior Subordinated Notes
In March 2002, HI issued $300 million in aggregate principal amount of senior unsecured notes due 2009 at an interest rate of 9.875% per annum (the "HI Senior Notes"). On April 11, 2003, HI sold an additional $150 million in aggregate principal amount of the HI Senior Notes at an issue price of 105.25%. Interest on the HI Senior Notes is payable semi-annually and the HI Senior Notes mature on March 1, 2009. The HI Senior Notes are unsecured and are fully and unconditionally guaranteed on a joint and several basis by the HI Guarantors. The HI Senior Notes are redeemable after March 1, 2006 at a redemption price that declines from 104.937% of the principal amount thereof, declining ratably to par on and after March 1, 2008.
HI also has outstanding $600 million and €450 million ($559.6 million as of September 30, 2004, which includes $5.2 million of unamortized premium) 10.125% Senior Subordinated Notes (the "HI Subordinated Notes"). Interest on the HI Subordinated Notes is payable semi-annually and the HI Subordinated Notes mature on July 1, 2009. The HI Subordinated Notes are unsecured and are fully and unconditionally guaranteed on a joint and several basis by the HI Guarantors. On or after July 1, 2004 the HI Subordinated Notes may be redeemed at 105.063% of the principal amount thereof, declining ratably to par on and after July 1, 2007.
F-25
The HI Senior Notes and the HI Subordinated Notes contain covenants relating to the incurrence of debt, limitations on distributions, asset sales and affiliate transactions, among other things. They also contain a change of control provision requiring HI to offer to repurchase the HI Senior Notes and the HI Subordinated Notes upon a change of control. Management believes that HI was in compliance with the covenants of the HI Senior Notes and the HI Subordinated Notes as of September 30, 2004.
Other Debt
HI maintains a $25 million multicurrency overdraft facility for its European subsidiaries (the "HI European Overdraft Facility"), all of which was available as of September 30, 2004. As of December 31, 2003, HI had approximately $7.5 million outstanding under the HI European Overdraft Facility included within trade payables. The HI European Overdraft Facility is used for daily working capital needs.
Included within other debt is debt associated with one of HI's Chinese MDI joint ventures. In January 2003, HI entered into a joint venture agreement with Shanghai Chlor-Alkali Chemical Company, Ltd. to build MDI production facilities near Shanghai, China. HI owns 70% of the joint venture, Huntsman Polyurethanes Shanghai Ltd. (the "Chinese Splitting JV"), which is a consolidated affiliate. On September 19, 2003, the Chinese Splitting JV obtained secured financing for the construction of the production facilities, consisting of various committed loans in the aggregate amount of approximately $119 million in U.S. dollar equivalents. As of September 30, 2004, there were $7.0 million outstanding in U.S. dollar borrowings and 10.0 million in RMB borrowings ($1.2 million) under these facilities. The interest rate on these facilities is LIBOR plus 0.48% for U.S. dollar borrowings and 90% of the Peoples Bank of China rate for RMB borrowings. As of September 30, 2004, the interest rate for U.S. dollar borrowings was approximately 2.6% and 5.2% for RMB borrowings. The loans are secured by substantially all the assets of the Chinese Splitting JV and will be repaid in 16 semi-annual installments, beginning no later than June 30, 2007. The financing is non-recourse to HI, but is guaranteed during the construction phase by affiliates of the Chinese Splitting JV, including Huntsman Holdings. Huntsman Holdings unconditionally guarantees 70% of any amounts due and unpaid by the Chinese Splitting JV under the loans described above (except for the VAT facility which is not guaranteed). Huntsman Holdings' guarantees remain in effect until the Chinese Splitting JV has (i) commenced production of at least 70% of capacity for at least 30 days, and (ii) achieved a debt service cover ratio of at least 1.5:1.
HIH Debt
On June 30, 1999, HIH issued senior discount notes ("HIH Senior Discount Notes") and senior subordinated discount notes (the "HIH Senior Subordinated Discount Notes" and, collectively with the HIH Senior Discount Notes, the "HIH Discount Notes") to ICI with initial stated values of $242.7 million and $265.3 million, respectively. The HIH Discount Notes are due December 31, 2009. Interest on the HIH Discount Notes is paid in kind. The HIH Discount Notes contain limits on the incurrence of debt, restricted payments, liens, transactions with affiliates, and merger and sales of assets. Management believes that HIH was in compliance with the covenants of the HIH Discount Notes as of September 30, 2004.
F-26
Interest on the HIH Senior Discount Notes accrues at 13.375% per annum. The HIH Senior Discount Notes are redeemable after July 1, 2004 at 106.688% of the principal amount thereof, declining ratably to par on and after July 1, 2007.
The HIH Senior Subordinated Discount Notes have a stated rate of 8% that was reset to a market rate of 13.125% effective September 30, 2004. For financial reporting purposes, the HIH Senior Subordinated Discount Notes were initially recorded at their estimated fair value of $223 million based upon prevailing market rates at June 30, 1999. On December 31, 2001, the terms of the HIH Senior Subordinated Discount Notes were modified, resulting in a significant decrease in the present value of the debt and, as a result, the modification was treated effectively as an extinguishment and reissuance of the debt. The debt was recorded using a 16% interest rate, the estimated market rate for the debt as of December 20, 2001. In connection with the financial restructuring of the Company on September 30, 2002, MatlinPatterson contributed its interest in the HIH Senior Subordinated Discount Notes to HMP. On May 9, 2003, HMP completed the purchase of the HIH Senior Subordinated Discount Notes from ICI. As of September 30, 2004, the HIH Senior Subordinated Discount Notes are held by HMP.
As of September 30, 2004 and December 31, 2003, the HIH Senior Discount Notes included $236.5 million and $191.9 million of accrued interest, respectively. As of September 30, 2004 and December 31, 2003, the HIH Senior Subordinated Discount Notes included $135.3 million and $112.3 million of accrued interest, respectively, and $19.2 million of discount as of December 31, 2003.
AdMat Debt
Revolving Credit Facility (AdMat Revolving Credit Facility)
On June 30, 2003, AdMat entered into a revolving credit facility (the "AdMat Revolving Credit Facility") that provides up to $60 million of borrowings and is secured by a first lien on substantially all of AdMat's assets and those of certain of its subsidiaries. The collateral includes substantially all real property and equipment relating to AdMat's manufacturing plants located at Bergkamen, Germany; Monthey, Switzerland; McIntosh, Alabama; and Duxford, U.K. The collateral also includes certain capital stock and intercompany notes of certain subsidiaries of AdMat, and certain other assets, principally including inventory and accounts receivable. AdMat's obligations under the AdMat Revolving Credit Facility have been initially guaranteed by all of AdMat's U.S. subsidiaries and certain of its non-U.S. subsidiaries (collectively, the "AdMat Guarantors"). The agent for the lenders under the AdMat Revolving Credit Facility and the trustee under the indenture governing the AdMat Senior Secured Notes (as defined below) are parties to an intercreditor agreement (the "AdMat Intercreditor Agreement").
The AdMat Revolving Credit Facility matures on June 30, 2007. Interest rates, at AdMat's option, are based upon either a eurocurrency rate (LIBOR) or a base rate (prime), plus an applicable spread. The applicable spreads vary based on a pricing grid. In the case of the eurocurrency based loans, spreads range from 3.0% to 4.5% per annum, depending on whether specified conditions have been satisfied, and, in the case of base rate loans, from 2.0% to 3.5% per annum. As of September 30, 2004, AdMat had nothing drawn on the AdMat Revolving Credit Facility and had approximately $10.9 million of letters of credit issued and outstanding under the AdMat Revolving Credit Facility.
The AdMat Revolving Credit Facility contains covenants relating to incurrence of additional debt, purchase and sale of assets, limitations on investments, affiliate transactions, change in control and
F-27
maintenance of certain financial ratios. The financial covenants include a leverage ratio, fixed charge coverage ratio and a limit on capital expenditures. The AdMat Revolving Credit Facility also limits the payment of dividends and distributions generally to the amount required by AdMat's members to pay income taxes. Management believes that AdMat is in compliance with the covenants of the AdMat Revolving Credit Facility as of September 30, 2004.
There are no scheduled debt amortization payments on the AdMat Revolving Credit Facility until its maturity date.
Senior Secured Notes (AdMat Senior Secured Notes)
In connection with the AdMat Transaction, on June 30, 2003, AdMat issued $250 million of fixed rate notes due 2010 ("AdMat Fixed Rate Notes") and $100 million of floating rate notes due 2008 ("AdMat Floating Rate Notes," and, collectively with the AdMat Fixed Rate Notes, the "AdMat Senior Secured Notes"). The $250 million AdMat Fixed Rate Notes bear a fixed rate of interest of 11%, and the AdMat Floating Rate Notes bear interest at a rate per annum equal to LIBOR plus 8.0%, subject to a floor with respect to LIBOR of 2.0%. As of September 30, 2004, the interest rate on the AdMat Floating Rate Notes was 10%. Interest on the AdMat Floating Rate Notes resets semi-annually. The $100 million AdMat Floating Rate Notes were issued with an original issue discount of 2.0%, or for $98 million. The $2 million discount is being amortized to interest expense over the term of the AdMat Floating Rate Notes. Interest is payable on the AdMat Senior Secured Notes semiannually on January 15 and July 15 of each year.
The AdMat Senior Secured Notes are secured by a second lien, subject to the AdMat Intercreditor Agreement, on substantially all of the assets that secure the AdMat Revolving Credit Facility. The AdMat Senior Secured Notes effectively rank senior in right of payment to all existing and future obligations of AdMat that are unsecured or secured by liens on the collateral junior to the liens securing the AdMat Senior Secured Notes. The AdMat Senior Secured Notes are initially guaranteed on a senior basis by the AdMat Guarantors and are also supported by liens on substantially all of the assets of the AdMat Guarantors.
The AdMat Fixed Rate Notes are redeemable on or after July 15, 2007 at the option of AdMat at a price declining ratably from 105.5% to 100.0% of par value by the year 2009. AdMat The Floating Rate Notes are redeemable on or after July 15, 2005 at the option of AdMat at a price declining ratably from 105.0% to 100.0% of par value by the year 2007. At any time prior to July 15, 2007 for the AdMat Fixed Rate Notes and July 15, 2005 for the AdMat Floating Rate Notes, AdMat may redeem all or part of such notes at 100% of their principal amount, plus a "make whole" premium, as defined in the indenture. In addition, at any time prior to July 15, 2006 for the AdMat Fixed Rate Notes and July 15, 2005 for the AdMat Floating Rate Notes, AdMat may redeem up to 35% of the aggregate principal amount of the AdMat Senior Secured Notes at a redemption price of 111% of the principal thereof with the net cash proceeds of one or more qualified equity offerings, subject to certain conditions and limitations.
The indenture governing the AdMat Senior Secured Notes contains covenants relating to the incurrence of debt, limitations on distributions, asset sales and affiliate transactions, among other things. The indenture also contains a change of control provision requiring AdMat to offer to repurchase the AdMat Senior Secured Notes upon a change of control. Management believes that AdMat was in compliance with the covenants of the indenture as of September 30, 2004.
F-28
Under the terms of a registration rights agreement among AdMat, the AdMat Guarantors and the initial purchasers of the AdMat Senior Secured Notes, AdMat was required to cause a registration statement relating to an exchange offer for the AdMat Senior Secured Notes to become effective on or before July 9, 2004 (the "Effectiveness Date") and to complete the exchange offer on or before August 23, 2004 (the "Completion Date"). Due to a delay in the completion of predecessor company prior period audited financial statements for certain of AdMat's subsidiaries, the registration statement did not become effective by the Effectiveness Date and the exchange offer was not completed by the Completion Date. Accordingly, under the registration rights agreement, AdMat was required to pay additional interest on the AdMat Senior Secured Notes at a rate of 0.25% per annum for the first 90 day period following the Effectiveness Date, and this rate increased by 0.25% per annum for the immediately following 90 day period. Once the registration statement becomes effective, AdMat will be required to continue paying additional interest at a rate of 0.25% per annum until the end of the first 90 day period following the Completion Date, and this rate will increase by 0.25% per annum for the immediately following 90 day period, until the exchange offer is completed. AdMat anticipates that an amended registration statement will be filed during the fourth quarter of 2004 and that the exchange offer will be completed approximately 30 days after the registration statement becomes effective.
There are no scheduled debt amortization payments on the AdMat Senior Secured Notes until their maturity date.
Other Debt
As of September 30, 2004 and December 31, 2003, AdMat also had $1.6 million and $3.1 million, respectively, of other debt outstanding under credit facilities in Brazil and Turkey. These facilities are primarily revolving credit lines that support the working capital needs of the business and the issuance of certain letters of credit and guarantees. A portion of the other debt is backed by letters of credit issued and outstanding under the AdMat Revolving Credit Facility.
Maturities
The scheduled maturities of the Company's debt, after giving effect to the refinancing of the HLLC Credit Facilities on October 14, 2004, are as follows (dollars in millions):
| Year ended December 31: |
|
||
|---|---|---|---|
| 2005 | $ | 62.5 | |
| 2006 | 35.2 | ||
| 2007 | 129.4 | ||
| 2008 | 612.3 | ||
| 2009 | 2,128.8 | ||
| Later Years | 3,232.5 | ||
| $ | 6,200.7 | ||
F-29
13. Derivatives and Hedging Activities
Interest Rate Hedging
Through the Company's borrowing activities, it is exposed to interest rate risk. Such risk arises primarily due to the structure of the HLLC Credit Facilities, the HI Credit Facilities and the Company's debt portfolio, including the duration of the portfolio and the mix of fixed and floating interest rates. Actions taken to reduce interest rate risk include managing the mix and rate characteristics of various interest bearing liabilities as well as entering into interest rate swaps, collars and options.
As of September 30, 2004 and December 31, 2003, the Company had entered into various types of interest rate contracts to manage its interest rate risk on its long-term debt as indicated below (dollars in millions):
| |
September 30, 2004 |
December 31, 2003 |
||||||
|---|---|---|---|---|---|---|---|---|
| Interest rate swaps | ||||||||
| Notional amount | $ | 184.3 | $ | 447.5 | ||||
| Fair value | (5.1 | ) | (14.4 | ) | ||||
| Weighted average pay rate | 4.44 | % | 5.49 | % | ||||
| Maturing | 2005-2007 | 2004-2007 | ||||||
Interest rate collars |
||||||||
| Notional amount | $ | — | $ | 150.0 | ||||
| Fair value | — | (4.8 | ) | |||||
| Weighted average cap rate | — | 7.00 | % | |||||
| Weighted average floor rate | — | 6.25 | % | |||||
| Maturing | — | 2004 | ||||||
Under interest rate swaps, the Company agrees with other parties to exchange, at specified intervals, the difference between fixed-rate and floating-rate interest amounts calculated by reference to an agreed notional principal amount.
The Company has purchased certain interest rate cap and interest rate collar agreements to reduce the impact of changes in interest rates on its floating-rate long-term debt. The cap agreements entitle the Company to receive from the counterparties (major banks) the amounts, if any, by which the Company's interest payments on certain of its floating-rate borrowings exceed a certain rate. The floor agreements require the Company to pay to the counterparties (major banks) the amount, if any, by which the Company's interest payments on certain of its floating-rate borrowings are less than a certain rate.
As of December 31, 2003, the majority of the interest rate contracts have been designated as cash flow hedges of future interest payments on the Company's variable rate debt. The fair value of these interest rate contracts designated as hedges as of September 30, 2004 and December 31, 2003 was a loss of approximately $3.2 million and $13.0 million, respectively, which is recorded in other accrued liabilities and in accumulated other comprehensive income (loss) to the extent of the effective portions of the hedging instruments. Gains and losses related to these contracts will be reclassified from other comprehensive income (loss) into earnings in the periods in which the related hedged interest payments are made. As of September 30, 2004, losses of approximately $1.0 million are expected to be
F-30
reclassified into earnings over the remainder of 2004. Gains and losses on these agreements, including amounts recorded related to hedge ineffectiveness, are reflected as interest expense in the statement of operations. A net loss of $0.5 million and $0.5 million was recorded in interest expense in the nine months ended September 30, 2004 and 2003, respectively.
As of September 30, 2004 and December 31, 2003, swap agreement liabilities with a fair value of $1.8 million and $6.2 million, respectively, have not been designated as hedges for financial reporting purposes. The change in the liability resulted in interest income of $0.9 million.
The Company is exposed to credit losses in the event of nonperformance by a counterparty to the derivative financial instruments. The Company anticipates, however, that the counterparties will be able to fully satisfy obligations under the contracts.
Commodity Price Hedging
As of September 30, 2004 and December 31, 2003, there were no cash flow commodity price hedging contracts recorded in other current assets and other comprehensive income.
As of September 30, 2004 there were no commodity price hedging contracts designated as fair value hedges. As of December 31, 2003, commodity price hedging contracts designated as fair value hedges are included in the balance sheet as $0.8 million in accrued liabilities and $0.5 million reduction in inventory.
Commodity price contracts not designated as hedges as defined by SFAS No. 133 are reflected in the balance sheet as $1.0 million and $2.0 million in other current assets and accrued liabilities, respectively, as of September 30, 2004, and as $0.5 million and $0.3 million in other current assets and accrued liabilities, respectively, as of December 31, 2003.
During the three months ended September 30, 2004 and the three months ended September 30, 2003, the Company recorded and decrease of $0.8 million and an increase of $0.7 million, respectively, in cost of goods sold related to net gains and losses from settled contracts, net gains and losses in fair value price hedges, and the change in fair value on commodity price hedges not designated as hedges as defined in SFAS No. 133. During the nine months ended September 30, 2004 and the nine months ended September 30, 2003, the Company recorded an increase of $2.5 million and a reduction of $1.8 million, respectively, in cost of goods sold related to net gains and losses from settled contracts, net gains and losses in fair value price hedges, and the change in fair value on commodity price hedges not designated as hedges as defined in SFAS No. 133.
Foreign Currency Rate Hedging
The Company may enter into foreign currency derivative instruments to minimize the short-term impact of movements in foreign currency rates. These contracts are not designated as hedges for financial reporting purposes and are recorded at fair value. As of September 30, 2004 and December 31, 2003 and for the nine months ended September 30, 2004 and 2003, the fair value, change in fair value, and realized gains (losses) of outstanding foreign currency rate hedging contracts was not material.
F-31
Net Investment Hedging
Currency effects of net investment hedges produced a gain of $9.6 million and a loss of $57.5 million in other comprehensive income (loss) (foreign currency translation adjustments) for the nine months ended September 30, 2004 and 2003, respectively. As of September 30, 2004 and December 31, 2003, the Company had a cumulative net loss of approximately $116.7 million and $126.3 million, respectively.
14. Income Taxes
Huntsman Holdings, LLC is treated as a partnership for U.S. federal income tax purposes and as such is generally not subject to U.S. income tax. Income of the Company is taxed directly to its owners. Income from the Company's subsidiaries is taxed under consolidated corporate income tax rules. These subsidiaries file a U.S. Federal consolidated tax return with HGI as the parent. HGI and all of its U.S. subsidiaries are parties to various tax sharing agreements which generally provide that entities will pay their own tax (as computed on a separate-company basis) and be compensated for the use of tax attributes, including NOLs.
The Company's tax obligations are affected by the mix of income and losses in the tax regimes of the jurisdictions in which it operates. The Company has established valuation allowances against its U.S. and a material portion of its non-U.S deferred tax assets due to an uncertainty of realization. Substantially all non-U.S. operations of the Company's AdMat subsidiary are treated as branches for U.S. income tax purposes and are, therefore, subject to both U.S. and non-U.S. income tax. The U.S. tax implications of income from AdMat operations are offset by other U.S. losses, which results in no U.S. tax expense or benefit, net of valuation allowances. Application of the statutory rate would result in non-U.S. tax expense of approximately $17 million on $50.0 million of AdMat pre-tax income. An additional $15.3 million of tax expense was primarily the result of the Company recognizing losses in jurisdictions where little or no tax benefit was provided. In addition the company recognized a $55.0 million benefit attributable to non-AdMat foreign operations. In particular, during the nine months ended September 30, 2004, the Company recognized non-recurring benefits in Spain, France and Holland of approximately $27 million associated with enacted changes in tax rates, the settlement of tax authority examinations and the reversal of previously established valuation allowances. In addition, the Company recognized approximately $24 million of benefit from losses in jurisdictions not subject to valuation allowances as well as treaty negotiated reductions in statutory rates.
F-32
15. Employee Benefit Plans
Components of the net periodic benefit costs for the nine months ended September 30, 2004 and 2003, were as follows (dollars in millions):
| |
Defined Benefit Plans |
Other Postretirement Benefit Plans |
||||||||||||
|---|---|---|---|---|---|---|---|---|---|---|---|---|---|---|
| |
Nine Months Ended September 30, |
Nine Months Ended September 30, |
||||||||||||
| |
2004 |
2003 |
2004 |
2003 |
||||||||||
| Components of net periodic benefit cost | ||||||||||||||
| Service cost | $ | 46.7 | $ | 27.1 | $ | 2.6 | $ | 2.4 | ||||||
| Interest cost | 83.1 | 47.6 | 5.6 | 6.0 | ||||||||||
| Expected return on assets | (83.9 | ) | (43.1 | ) | — | — | ||||||||
| Amortization of transition obligation | 1.2 | 1.2 | — | — | ||||||||||
| Amortization of prior service cost | 1.1 | 1.0 | (1.2 | ) | (0.2 | ) | ||||||||
| Amortization of actuarial loss | 17.1 | 11.5 | 2.5 | 2.1 | ||||||||||
| Net periodic benefit cost | $ | 65.3 | $ | 45.3 | $ | 9.5 | $ | 10.3 | ||||||
The Company's employees participate in a trusteed, non-contributory defined benefit pension plan (the "Plan") that covers substantially all full-time U.S. employees of the Company. The Plan provides benefits based on years of service and final average salary. However, effective July 1, 2004, the existing Plan formula for employees not covered by a collective bargaining agreement was converted to a cash balance design. For represented employees, participation in the cash balance design is subject to the terms of negotiated contracts, and as of July 1, 2004, one collectively bargained unit had negotiated to participate. For participating employees, benefits accrued as of June 30, 2004 under the prior formula were converted to opening cash balance accounts. The new cash balance benefit formula provides annual pay credits from 4% to 12% of eligible pay, depending on age and service, plus accrued interest. Participants in the plan on July 1, 2004 may be eligible for additional annual pay credits from 1% to 8%, depending on their age and service as of that date, for up to five years.
In May 2004, the FASB issued FASB Staff Position (FSP) No. 106-2, "Accounting and Disclosure Requirements Related to the Medicare Prescription Drug, Improvement and Modernization Act of 2003." The FSP provides accounting guidance for the effects of the Medicare Prescription Drug, Improvement and Modernization Act of 2003 (the "Act") to a sponsor of a postretirement health care plan. On July 1, 2004 the Company adopted the provisions of FSP No. 106-2. The adoption of FSP No. 106-2 reduced the Company's non-pension postretirement accumulated benefit obligation by approximately $4.7 million, which has been recognized as a change in the Company's unrecognized actuarial gain/loss. The adoption of FSP No. 106-2 reduced the net periodic postretirement benefit cost recognized during the three months ended September 30, 2004 by approximately $0.5 million.
16. Commitments and Contingencies
The Company has various purchase commitments extending through 2017 for materials, supplies and services entered into in the ordinary course of business. The purchase commitments are contracts that require minimum volume purchases. Certain contracts allow for changes in minimum required purchase volumes in the event of a temporary or permanent shutdown of a facility. The contractual
F-33
purchase price for substantially all of these contracts is variable based upon market prices, subject to annual negotiations. The Company has also entered into a limited number of contracts which require minimum payments, even if no volume is purchased. These contracts approximate $35 million annually through 2005, declining to approximately $16 million after 2011. Historically, the Company has not made any minimum payments under its take or pay contracts.
17. Legal Matters
HI settled certain claims during and prior to the second quarter of 2004 relating to discoloration of unplasticized polyvinyl chloride products allegedly caused by HI's TiO2 ("Discoloration Claims"). Substantially all of the TiO2 that was the subject of these claims was manufactured prior to HI's acquisition of its TiO2 business from ICI in 1999. Net of amounts it has received from insurers and pursuant to contracts of indemnity, HI has paid approximately £8 million ($14.9 million) in costs and settlement amounts for Discoloration Claims.
Certain insurers have denied coverage with respect to certain Discoloration Claims. HI brought suit against these insurers to recover the amounts HI believes are due to it. The court found in favor of the insurers, but HI has lodged an application for leave to appeal that decision. Qualified leave to appeal was granted in November 2004. HI is considering whether to make a further application to have the qualification removed. HI does not expect the appeal to be heard before the end of the first quarter of 2005.
During the second quarter 2004, HI recorded a charge in the amount of $14.9 million with respect to Discoloration Claims. HI expects that it will incur additional costs with respect to Discoloration Claims, potentially including additional settlement amounts. However, HI does not believe that it has material ongoing exposure for additional Discoloration Claims, after giving effect to its rights under contracts of indemnity, including the rights of indemnity it has against ICI. Nevertheless, HI can provide no assurance that its costs with respect to Discoloration Claims will not have a material adverse impact on its financial condition, results of operations or cash flows.
Vantico concluded that certain of the products of its former Electronics division may have infringed patents owned by Taiyo and it entered into a license agreement with Taiyo to obtain the right to use the Taiyo patents. This license agreement required payment of back royalties and agreement to pay periodic royalties for future use. AdMat believes that Ciba Specialty Chemicals Holdings Inc. ("Ciba") is liable under the indemnity provisions of certain agreements in connection with the leveraged buy out transaction in 2000 involving Ciba and Vantico for certain payments made under the license agreement and related costs and expenses, and AdMat initiated an arbitration proceeding against Ciba. In July 2004, AdMat entered into a settlement agreement with Ciba with respect to this matter. In general, the settlement agreement provided that Ciba would pay AdMat $10.9 million in 2004 and provide AdMat with approximately $11 million of credits over the next five years against payments for certain services provided by Ciba at one of AdMat's facilities. AdMat received additional consideration in the form of modifications to certain agreements between AdMat's business and Ciba. In August 2004, AdMat received payment of the $10.9 million settlement. To date, AdMat has incurred approximately $2.1 million in costs in connection with the arbitration proceedings against Ciba.
Huntsman LLC is a party to various lawsuits brought by persons alleging personal injuries and/or property damage based upon alleged exposure to toxic substances. For example, since June 2003, a number of lawsuits have been filed in state district court in Jefferson County, Texas against several
F-34
local chemical plants and refineries, including Huntsman LLC's subsidiary, Huntsman Petrochemical Corporation. Generally, these lawsuits allege that the refineries and chemical plants located in the vicinity of the plaintiffs' homes discharged chemicals into the air that interfere with use and enjoyment of property and cause health problems and/or property damages. Because these cases are still in the initial stages, Huntsman LLC does not have sufficient information at the present time to estimate any liability to it.
F-35
In addition, Huntsman LLC has been named as a "premises defendant" in a number of asbestos exposure lawsuits. Where the alleged exposure occurred prior to our ownership or operation of the relevant "premises," Huntsman LLC generally has indemnity protection from the prior owner or operator. These suits often involve multiple plaintiffs and multiple defendants, and, generally, the complaint in the action does not indicate which plaintiffs are making claims against a specific defendant, where or how the alleged injuries occurred, or what injuries each plaintiff claims. These facts must be learned through discovery. Among the cases currently pending against Huntsman LLC for which a prior owner has not accepted defense under its indemnity agreements, it is aware of three claims of mesothelioma. Huntsman LLC does not have sufficient information at the present time to estimate any liability in these cases. Based on past history of settlements and experience in these types of cases, the Company believes, although it can give no assurances, that its ultimate liability in these cases will not have a material adverse effect on its results of operations or financial position.
The Company is a party to various other proceedings instituted by private plaintiffs, governmental authorities and others arising under provisions of applicable laws, including various environmental, products liability and other laws. Except as otherwise disclosed in this report, and based in part on the indemnities provided to the Company in connection with the transfer of businesses to it and its insurance coverage, the Company does not believe that the outcome of any of these matters will have a material adverse effect on its financial condition or results of operations.
18. Environmental, Health and Safety Matters
General
The Company is subject to extensive federal, state, local and foreign laws, regulations, rules and ordinances relating to pollution, protection of the environment and the generation, storage, handling, transportation, treatment, disposal and remediation of hazardous substances and waste materials. In the ordinary course of business, the Company is subject to frequent environmental inspections and monitoring and occasional investigations by governmental enforcement authorities. In addition, the Company's production facilities require operating permits that are subject to renewal, modification and, in certain circumstances, revocation. Actual or alleged violations of environmental laws or permit requirements could result in restrictions or prohibitions on plant operations, substantial civil or criminal sanctions, as well as, under some environmental laws, the assessment of strict liability and/or joint and several liability. Moreover, changes in environmental regulations could inhibit or interrupt the Company's operations, or require it to modify its facilities or operations. Accordingly, environmental or regulatory matters may cause the Company to incur significant unanticipated losses, costs or liabilities.
Environmental, Health and Safety Systems
The Company is committed to achieving and maintaining compliance with all applicable environmental, health and safety ("EHS") legal requirements, and the Company has developed policies and management systems that are intended to identify the multitude of EHS legal requirements applicable to its operations, enhance compliance with applicable legal requirements, ensure the continuing safety of its employees, contractors, community neighbors and customers and minimize the production and emission of wastes and other pollutants. Although EHS legal requirements are constantly changing and are frequently difficult to comply with, these EHS management systems are
F-36
designed to assist the Company in its compliance goals while also fostering efficiency and improvement and minimizing overall risk to the Company.
EHS Capital Expenditures
The Company may incur future costs for capital improvements and general compliance under EHS laws, including costs to acquire, maintain and repair pollution control equipment. For the nine months ended September 30, 2004 and 2003, the Company's EHS capital expenditures were $36.9 million and $44.6 million, respectively. Since capital expenditures for these matters are subject to evolving regulatory requirements and depend, in part, on the timing, promulgation and enforcement of specific requirements, the Company cannot provide assurance that its recent expenditures will be indicative of future amounts required under EHS laws.
Governmental Enforcement Proceedings
On occasion, the Company receives notices of violation, enforcement and other complaints from regulatory agencies alleging non-compliance with applicable EHS law. By way of example, the Company is aware of the individual matters set out below, which the Company believes to be the most significant presently pending matters. Although the Company may incur costs or penalties in connection with the governmental proceedings discussed below, based on currently available information and its past experience, the Company believes that the ultimate resolution of these matters will not have a material impact on its results of operations or financial position.
In May 2003, the State of Texas settled an air enforcement case with the Company relating to its Port Arthur plant. Under the settlement, the Company is required to pay a civil penalty of $7.5 million over more than four years, undertake environmental monitoring projects totaling about $1.5 million in costs, and pay $0.4 million in attorney's fees to the Texas Attorney General. As of September 2004, the Company has paid $1.8 million toward the penalty and $0.4 million for the attorney's fees. The monitoring projects are underway and on schedule. The Company does not anticipate that this settlement will have a material adverse effect on its results of operations or financial position.
In the third quarter of 2004, the Company's Jefferson County, Texas facilities received notification from the Texas Commission on Environmental Quality ("TCEQ") of potential air emission violations relating to the operation of cooling towers at two of its plants, alleged nuisance odors, and alleged upset air emissions. The Company has investigated the allegations and responded in writing to TCEQ. TCEQ has proposed a penalty of $9,300 for the alleged nuisance odor violations, $0.2 million for the alleged upset violations and $0.1 million for the alleged cooling tower violations. Negotiations are anticipated between the Company and TCEQ with respect to the resolution of these alleged violations. The Company does not believe that the final cost to resolve these matters will be material.
The Company's subsidiary, Huntsman Advanced Materials (U.K.) Ltd, is scheduled to appear in Magistrates Court in the U.K. in November 2004 to answer five charges following an investigation by the U.K. Health and Safety Executive. The charges arise from alleged asbestos contamination caused by construction activity at the Duxford, U.K. AdMat facility between November 2002 and January 2003. The Company believes that some or all of the alleged violations arise from conduct by a third party contractor occurring before it assumed responsibility for the Duxford facility. Although the Company does not believe this matter will result in the imposition of costs material to its results of operations or financial position, it is too early to predict the outcome of the case.
F-37
Remediation Liabilities
The Company has incurred, and the Company may in the future incur, liability to investigate and clean up waste or contamination at its current or former facilities or facilities operated by third parties at which the Company may have disposed of waste or other materials. Similarly, the Company may incur costs for the cleanup of wastes that were disposed of prior to the purchase of its businesses. Under some circumstances, the scope of the Company's liability may extend to damages to natural resources. Specifically, under the U.S. Comprehensive Environmental Response, Compensation and Liability Act of 1980, as amended ("CERCLA"), and similar state laws, a current or former owner or operator of real property may be liable for remediation costs regardless of whether the release or disposal of hazardous substances was in compliance with law at the time it occurred, and a current owner or operator may be liable regardless of whether it owned or operated the facility at the time of the release. In addition, under the U.S. Resource Conservation and Recovery Act of 1976, as amended ("RCRA"), and similar state laws, the Company may be required to remediate contamination originating from its properties as a condition to its hazardous waste permit. For example, the Company's Odessa, Port Arthur, and Port Neches facilities in Texas are the subject of ongoing remediation requirements under RCRA authority. In many cases, the Company's potential liability arising from historical contamination is based on operations and other events occurring prior to its ownership of the relevant facility. In these situations, the Company frequently obtained an indemnity agreement from the prior owner addressing remediation liabilities arising from pre-closing conditions. The Company has successfully exercised its rights under these contractual covenants for a number of sites, and where applicable, mitigated its ultimate remediation liability. The Company can give no assurance, however, that such matters will be subject to indemnity or that its existing indemnities will be sufficient to cover its liabilities for such matters.
The Company has established financial reserves relating to anticipated environmental restoration and remediation programs. Liabilities are recorded when potential liabilities are either known or considered probable and can be reasonably estimated. The Company's liability estimates are based upon available facts, existing technology and past experience. On a consolidated basis, a total of approximately $37 million has been accrued for environmental-related liabilities as of September 30, 2004. The Company believes these reserves are sufficient for known requirements. However, no assurance can be given that all potential liabilities arising out of the Company's present or past operations or ownership have been identified or fully assessed or that future environmental liabilities will not be material to the Company.
The Company has been notified by third parties of claims against it or its subsidiaries for cleanup liabilities at approximately 11 former facilities and other third party sites, including but not limited to sites listed under CERCLA. The North Maybe Canyon CERCLA site includes an abandoned phosphorous mining site located near Soda Springs, Idaho, in a U.S. National Forest that may have been operated by one of the Company's predecessors for approximately two years. With respect to this site, for which the Company received a notice of potential liability in February 2004, the Company is unable to determine whether the alleged liabilities may be material to it because the Company does not have information sufficient to evaluate the claim. Based on current information and past experience at other CERCLA sites, however, the Company does not expect any of these third party claims to result in material liability to it.
F-38
Regulatory Developments
Under the European Union ("EU") Integrated Pollution Prevention and Control Directive ("IPPC"), EU member governments are to adopt rules and implement a cross media (air, water and waste) environmental permitting program for individual facilities. While the EU countries are at varying stages in their respective implementation of the IPPC permit program, the Company has submitted all necessary IPPC permit applications required to date, and in some cases received completed permits from the applicable government agency. The Company expects to submit all other IPPC applications and related documents on a timely basis as the various countries implement the IPPC permit program. Although the Company does not know with certainty what each IPPC permit will require, the Company believes, based upon its experience with the permits received to date, that the costs of compliance with the IPPC permit program will not be material to its results of operations or financial position.
In October 2003, the European Commission adopted a proposal for a new EU regulatory framework for chemicals. Under this proposed new system called "REACH" (Registration, Evaluation and Authorization of Chemicals), companies that manufacture or import more than one ton of a chemical substance per year would be required to register such manufacture or import in a central database. The REACH initiative, as proposed, would require risk assessment of chemicals, preparations (e.g., soaps and paints) and articles (e.g., consumer products) before those materials could be manufactured or imported into EU countries. Where warranted by a risk assessment, hazardous substances would require authorizations for their use. This regulation could impose risk control strategies that would require capital expenditures by the Company. As proposed, REACH would take effect in three primary stages over the eleven years following the final effective date (assuming final approval). The impacts of REACH on the chemical industry and on the Company are unclear at this time because the parameters of the program are still being actively debated.
MTBE Developments
The use of MTBE is controversial in the U.S. and elsewhere and may be substantially curtailed or eliminated in the future by legislation or regulatory action. The presence of MTBE in some groundwater supplies in California and other states (primarily due to gasoline leaking from underground storage tanks) and in surface water (primarily from recreational watercraft) has led to public concern about MTBE's potential to contaminate drinking water supplies. Heightened public awareness regarding this issue has resulted in state, federal and foreign initiatives to rescind the federal oxygenate requirements for reformulated gasoline or restrict or prohibit the use of MTBE in particular. For example, California, New York and Connecticut have adopted rules that prohibit the use of MTBE in gasoline sold in those states as of January 1, 2004. Overall, states that have taken some action to prohibit or restrict the use of MTBE in gasoline account for a substantial portion of the "pre-ban" U.S. MTBE market. Thus far, attempts by others to challenge these state bans in federal court under the reformulated gasoline provisions of the federal Clean Air Act have been unsuccessful.
The U.S. Congress has been considering legislation that would eliminate the oxygenated fuels requirements in the Clean Air Act and phase out or curtail MTBE use over a period of several years. To date, no such legislation has become law. If it were to become law it could result in a federal phase-out of the use of MTBE in gasoline in the U.S., but it would not prevent the Company from manufacturing MTBE in its plants. In addition, in March 2000, the EPA announced its intention,
F-39
through an advanced notice of proposed rulemaking, to phase out the use of MTBE under authority of the federal Toxic Substances Control Act. EPA has not yet acted on this proposal, however. In Europe, the EU issued a final risk assessment report on MTBE in September 2002. No ban of MTBE was recommended, though several risk reduction measures relating to storage and handling of MTBE-containing fuel were recommended.
The Company currently markets approximately 95% of its MTBE to customers located in the U.S. for use as a gasoline additive. Any phase-out or other future regulation of MTBE in other jurisdictions, nationally or internationally, may result in a significant reduction in demand for the Company's MTBE and result in a material loss in revenues or material costs or expenditures. In the event that there should be a complete phase-out of MTBE in the U.S., the Company believes it will be able to export MTBE to Europe, Asia or South America, although this may produce a lower level of cash flow than the sale of MTBE in the U.S. The Company may also elect to use all or a portion of its precursor TBA to produce saleable products other than MTBE. If the Company opts to produce products other than MTBE, necessary modifications to its facilities may require significant capital expenditures and the sale of the other products may produce a materially lower level of cash flow than the sale of MTBE.
In addition to the use limitations described above, a number of lawsuits have been filed, primarily against gasoline manufacturers, marketers and distributors, by persons seeking to recover damages allegedly arising from the presence of MTBE in groundwater. While the Company has not been named as a defendant in any litigation concerning the environmental effects of MTBE, the Company cannot provide assurances that it will not be involved in any such litigation or that such litigation will not have a material adverse effect on its results of operations or financial position.
19. Preferred Interest, Common Interests and Tracking Preferred Interests
Preferred Interest
On September 30, 2002, the Company authorized the issuance of 18% cumulative preferred member's interest. The preferred member's interest has a liquidation preference of $395.0 million and is entitled to a cumulative preferred return equal to 18% per annum, compounded annually. The Company has the right to redeem the preferred member's interest after five years, for an amount equal to the unpaid liquidation preference plus any unpaid preferred return. As of September 30, 2004, the accumulated liquidation preference was $552.9 million. The preferred member's interest does not have voting rights. After 10 years, at the option of the preferred member, the preferred member's interest is redeemable for an amount equal to the unpaid liquidation preference plus any unpaid preferred return.
Common Interest
On September 30, 2002, the Company authorized and issued 10,000,000 Class A Common Units and 10,000,000 million Class B Common Units. Both Class A and Class B Common Units have voting rights. There are special provisions governing distributions to the members which are not necessarily pro rata with respect to members' unit ownership.
Tracking Preferred Interests
On June 30, 2003, the Company authorized and issued four series of tracking preferred interests (Series A, B, C and D), that track the performance of the AdMat business (collectively, "Tracking
F-40
Preferred Interests"). The Series A Tracking Preferred Interests have a liquidation preference equal to $128.3 million. The Series B Preferred Tracking Interests have a liquidation preference equal to $77.0 million, reduced by the amount of certain distributions to the holders of certain Class A Common Units. The Series C Preferred Tracking Interests have a liquidation preference equal to $77.0 million, reduced by the amount of certain distributions to the holders of certain Class A Common Units. The Tracking Preferred Interests are not entitled to any return other than their liquidation preference. The Tracking Preferred Interests do not have voting rights, and may be redeemed by the Company in connection with certain sale transactions for an amount equal to their unpaid liquidation preference.
20. Other Comprehensive Income
The components of other comprehensive income (loss) consist of the following (dollars in millions):
| |
Accumulated income |
Income |
|||||||||||
|---|---|---|---|---|---|---|---|---|---|---|---|---|---|
| |
|
|
Nine months ended September 30, |
||||||||||
| |
September 30, 2004 |
December 31, 2003 |
|||||||||||
| |
2004 |
2003 |
|||||||||||
| Foreign currency translation adjustments | $ | 152.6 | $ | 167.1 | $ | (20.2 | ) | $ | 75.5 | ||||
| Unrealized loss on nonqualified plan investments | 0.6 | 0.6 | — | — | |||||||||
| Unrealized loss on derivative instruments | (0.4 | ) | (14.6 | ) | 8.9 | 12.0 | |||||||
| Minimum pension liability, net of tax | (60.2 | ) | (95.2 | ) | — | (3.8 | ) | ||||||
| Minimum pension liability unconsolidated affiliate | (3.4 | ) | (5.6 | ) | — | — | |||||||
| Unrealized loss on securities | 1.0 | 0.2 | (0.3 | ) | 2.8 | ||||||||
| Other comprehensive income (loss) of minority interest | 0.2 | (0.5 | ) | 0.7 | |||||||||
| Other comprehensive income (loss) of unconsolidated affiliates | 8.1 | 9.2 | (1.1 | ) | 15.1 | ||||||||
| Total | $ | 98.5 | $ | 61.2 | $ | (12.0 | ) | $ | 101.6 | ||||
21. Operating Segment Information
The Company derives its revenues, earnings and cash flows from the manufacture and sale of a wide variety of differentiated and commodity chemical products. The HIH Consolidation Transaction and the AdMat Transaction have caused changes in the Company's operating segments. Prior to the HIH Consolidation Transaction, the Company reported its operations through three principal operating segments. After the HIH Consolidation Transaction, but prior to the AdMat Transaction, the Company reported its operations through five segments. Following the AdMat Transaction, the Company reports its operations through six segments: Polyurethanes, Advanced Materials, Performance Products, Polymers, Pigments and Base Chemicals.
F-41
The major products of each reportable operating segment are as follows:
| Segment |
Products |
|
|---|---|---|
| Polyurethanes | MDI, TDI, TPU, polyols, aniline, PO and MTBE | |
| Advanced Materials | Epoxy resin compounds, cross-linkers, matting agents, curing agents, epoxy, acrylic and polyurethane-based adhesives and tooling resins and sterolithography tooling resins | |
| Performance Products | Amines, surfactants, linear alkylbenzene, maleic anhydride, other performance chemicals, and glycols | |
| Polymers | Ethylene (produced at the Odessa, Texas facilities primarily for internal use), polyethylene, polypropylene, expandable polystyrene, styrene and other polymers | |
| Pigments | TiO2 | |
| Base Chemicals | Olefins (primarily ethylene and propylene), butadiene, MTBE, benzene, cyclohexane and paraxylene |
Sales between segments are generally recognized at external market prices.
The Company uses EBITDA to measure the financial performance of its global business units and for reporting the results of its operating segments. This measure includes all operating items relating to the businesses. The EBITDA of operating segments excludes items that principally apply to the Company as a whole. The Company believes that EBITDA is useful in helping investors assess the
F-42
results of its business operations. The revenues and EBITDA for each of the Company's reportable operating segments are as follows (dollars in millions):
| |
Nine Months Ended September 30, |
||||||||
|---|---|---|---|---|---|---|---|---|---|
| |
2004 |
2003(3) |
|||||||
| Revenues: | |||||||||
| Polyurethanes | $ | 2,117.4 | $ | 983.0 | |||||
| Advanced Materials | 866.4 | 258.7 | |||||||
| Performance Products | 1,399.7 | 1,084.4 | |||||||
| Polymers | 1,019.6 | 847.7 | |||||||
| Pigments | 794.7 | 421.4 | |||||||
| Base Chemicals | 2,755.8 | 1,467.0 | |||||||
| Eliminations | (595.9 | ) | (351.1 | ) | |||||
| Total | $ | 8,357.7 | $ | 4,711.1 | |||||
| Segment EBITDA (1) | |||||||||
| Polyurethanes | $ | 270.7 | $ | 100.8 | |||||
| Advanced Materials | 121.3 | 19.5 | |||||||
| Performance Products | 82.9 | 87.7 | |||||||
| Polymers | 45.6 | 53.4 | |||||||
| Pigments | (53.6 | ) | 47.6 | ||||||
| Base Chemicals | 204.8 | 24.8 | |||||||
| Corporate and other (2) | (54.1 | ) | (60.6 | ) | |||||
| Total Segment EBITDA | 617.6 | 273.2 | |||||||
| Interest income (expense), net | (459.5 | ) | (260.7 | ) | |||||
| Income tax benefit (expense) | 25.7 | 3.8 | |||||||
| Depreciation and amortization | (410.3 | ) | (230.5 | ) | |||||
| Net income (loss) | $ | (226.5 | ) | $ | (214.2 | ) | |||
F-43
REPORT OF INDEPENDENT REGISTERED PUBLIC ACCOUNTING FIRM
To the Board of Managers and Members of
Huntsman Holdings, LLC and Subsidiaries:
We have audited the accompanying consolidated balance sheets of Huntsman Holdings, LLC, the ultimate parent of Huntsman LLC (formerly Huntsman Corporation), and subsidiaries (the "Company") as of December 31, 2003 and 2002, and the related consolidated statements of operations and comprehensive loss, equity, and cash flows for each of the three years in the period ended December 31, 2003. These financial statements are the responsibility of the Company's management. Our responsibility is to express an opinion on these financial statements based on our audits.
We conducted our audits in accordance with the standards of the Public Company Accounting Oversight Board (United States). Those standards require that we plan and perform the audit to obtain reasonable assurance about whether the financial statements are free of material misstatement. An audit includes examining, on a test basis, evidence supporting the amounts and disclosures in the financial statements. An audit also includes assessing the accounting principles used and significant estimates made by management, as well as evaluating the overall financial statement presentation. We believe that our audits provide a reasonable basis for our opinion.
In our opinion, such consolidated financial statements present fairly, in all material respects, the financial position of Huntsman Holdings, LLC and subsidiaries as of December 31, 2003 and 2002, and the results of their operations and their cash flows for each of the three years in the period ended December 31, 2003, in conformity with accounting principles generally accepted in the United States of America.
As discussed in Note 1 to the consolidated financial statements of Huntsman Holdings, LLC presented herein, the consolidated financial statements reflect the financial position and results of operations and cash flows as if Huntsman Corporation and Huntsman Holdings, LLC were combined for all periods presented.
As discussed in Note 2 to the consolidated financial statements, the Company changed its method of computing depreciation for certain assets effective January 1, 2003. In addition, the Company adopted Financial Accounting Standard Nos. 141 and 142 effective January 1, 2002 and changed its method of accounting for derivative financial instruments effective January 1, 2001, to conform to Statement of Financial Accounting Standards No. 133, as amended.
/s/ DELOITTE & TOUCHE LLP
Houston,
Texas
November 23, 2004
F-44
HUNTSMAN HOLDINGS, LLC AND SUBSIDIARIES
CONSOLIDATED BALANCE SHEETS (Dollars in Millions)
| |
December 31, 2003 |
December 31, 2002 |
|||||||
|---|---|---|---|---|---|---|---|---|---|
| ASSETS | |||||||||
| Current assets: | |||||||||
| Cash and cash equivalents | $ | 197.8 | $ | 22.5 | |||||
| Restricted cash | 10.5 | 9.1 | |||||||
| Accounts and notes receivables (net of allowance for doubtful accounts of $26.5 and $7.5, respectively) | 1,096.1 | 325.4 | |||||||
| Accounts receivable from affiliates | 6.6 | 70.8 | |||||||
| Inventories | 1,039.3 | 298.1 | |||||||
| Prepaid expenses | 39.6 | 27.7 | |||||||
| Deferred income taxes | 14.7 | 13.0 | |||||||
| Other current assets | 108.3 | 2.2 | |||||||
| Total current assets | 2,512.9 | 768.8 | |||||||
Property, plant and equipment, net |
5,079.3 |
1,287.2 |
|||||||
| Investment in unconsolidated affiliates | 158.0 | 242.9 | |||||||
| Intangible assets, net | 316.8 | 39.6 | |||||||
| Goodwill | 3.3 | 3.3 | |||||||
| Deferred income taxes | 28.8 | — | |||||||
| Notes receivable from affiliates | 25.3 | 296.0 | |||||||
| Other noncurrent assets | 613.0 | 109.4 | |||||||
| Total assets | $ | 8,737.4 | $ | 2,747.2 | |||||
| LIABILITIES AND DEFICIT | |||||||||
| Current liabilities: | |||||||||
| Accounts payable | $ | 812.0 | $ | 226.2 | |||||
| Accounts payable to affiliates | 20.1 | 16.4 | |||||||
| Accrued liabilities | 702.0 | 200.3 | |||||||
| Deferred income taxes | 15.1 | — | |||||||
| Notes payable to Imperial Chemical Industries PLC | — | 105.7 | |||||||
| Current portion of long-term debt | 135.8 | 63.8 | |||||||
| Current portion of long-term debt—affiliates | 1.3 | — | |||||||
| Total current liabilities | 1,686.3 | 612.4 | |||||||
Long-term debt |
5,737.5 |
1,641.4 |
|||||||
| Long-term debt—affiliates | 35.5 | 30.9 | |||||||
| Deferred income taxes | 234.8 | 13.0 | |||||||
| Other noncurrent liabilities | 584.7 | 234.3 | |||||||
| Total liabilities | 8,278.8 | 2,532.0 | |||||||
| Minority interests in common stock of consolidated subsidiary | 30.5 | — | |||||||
| Warrants issued by consolidated subsidiary | 128.7 | — | |||||||
| Mandatorily redeemable preferred member's interest | 487.1 | 412.8 | |||||||
| Commitments and contingencies (Notes 20 and 22) | |||||||||
Deficit: |
|||||||||
| Preferred members' interest (liquidation preference of $513.3) | 194.4 | — | |||||||
| Common members' interest: | |||||||||
| Class A units, 110,000,000 issued and outstanding, no par value | — | — | |||||||
| Class B units, 110,000,000 issued and outstanding, no par value | — | — | |||||||
| Additional paid-in capital | 800.2 | 857.2 | |||||||
| Accumulated other comprehensive income (loss) | 61.2 | (131.1 | ) | ||||||
| Accumulated deficit | (1,243.5 | ) | (923.7 | ) | |||||
| Total deficit | (187.7 | ) | (197.6 | ) | |||||
| Total liabilities and deficit | $ | 8,737.4 | $ | 2,747.2 | |||||
See accompanying notes to consolidated financial statements
F-45
HUNTSMAN HOLDINGS, LLC AND SUBSIDIARIES
CONSOLIDATED STATEMENTS OF OPERATIONS AND
COMPREHENSIVE LOSS (Dollars in Millions)
| |
Year ended December 31, |
|||||||||||
|---|---|---|---|---|---|---|---|---|---|---|---|---|
| |
2003 |
2002 |
2001 |
|||||||||
| Revenues: | ||||||||||||
| Trade sales | $ | 6,990.2 | $ | 2,494.8 | $ | 2,577.1 | ||||||
| Related party sales | 90.7 | 166.2 | 180.3 | |||||||||
| Total revenues | 7,080.9 | 2,661.0 | 2,757.4 | |||||||||
| Cost of goods sold | 6,373.1 | 2,421.0 | 2,666.6 | |||||||||
| Gross profit | 707.8 | 240.0 | 90.8 | |||||||||
Expenses: |
||||||||||||
| Selling, general and administrative | 482.8 | 151.9 | 181.0 | |||||||||
| Research and development | 65.6 | 23.8 | 32.7 | |||||||||
| Other operating income | (55.0 | ) | (1.0 | ) | (2.0 | ) | ||||||
| Restructuring and plant closing costs (credit) | 37.9 | (1.0 | ) | 66.7 | ||||||||
| Goodwill impairment | — | — | 33.8 | |||||||||
| Other asset impairment charges | — | — | 488.0 | |||||||||
| Total expenses | 531.3 | 173.7 | 800.2 | |||||||||
| Operating income (loss) | 176.5 | 66.3 | (709.4 | ) | ||||||||
Interest expense |
(428.3 |
) |
(195.0 |
) |
(239.3 |
) |
||||||
| Interest income—affiliate | 19.2 | 13.1 | — | |||||||||
| Loss on accounts receivable securitization program | (20.4 | ) | — | (5.9 | ) | |||||||
| Equity in losses of investment in | ||||||||||||
| unconsolidated affiliates | (37.5 | ) | (31.4 | ) | (86.8 | ) | ||||||
| Other income (expense) | — | (7.6 | ) | 0.6 | ||||||||
| Loss before income tax benefit, minority interests, and cumulative effect of accounting changes | (290.5 | ) | (154.6 | ) | (1,040.8 | ) | ||||||
| Income tax (benefit) expense | 30.8 | 8.5 | (184.9 | ) | ||||||||
| Loss before minority interest and cumulative effect of accounting changes | (321.3 | ) | (163.1 | ) | (855.9 | ) | ||||||
| Minority interest in subsidiaries' (income) loss | 1.5 | (28.8 | ) | 13.1 | ||||||||
| Cumulative effect of accounting changes | — | 169.7 | 0.1 | |||||||||
| Net loss | (319.8 | ) | (22.2 | ) | (842.7 | ) | ||||||
Preferred members' interest dividend |
(74.3 |
) |
(17.8 |
) |
— |
|||||||
| Net loss available to common equity holders | $ | (394.1 | ) | $ | (40.0 | ) | $ | (842.7 | ) | |||
| Net Loss | $ | (319.8 | ) | $ | (22.2 | ) | $ | (842.7 | ) | |||
| Other comprehensive income (loss) | 241.6 | 10.2 | (73.5 | ) | ||||||||
| Comprehensive loss | $ | (78.2 | ) | $ | (12.0 | ) | $ | (916.2 | ) | |||
See accompanying notes to consolidated financial statements
F-46
HUNTSMAN HOLDINGS, LLC AND SUBSIDIARIES
CONSOLIDATED STATEMENTS OF EQUITY
(Dollars in Millions)
| |
Common stock |
Preferred members' interest |
Class A Common members' interest |
Class B Common members' interest |
Additional paid-in capital |
Retained earnings / (Accumulated deficit) |
Accumulated other comprehen-sive income (loss) |
Total |
Mandatorily redeemable preferred member's interest |
||||||||||||||||||||
|---|---|---|---|---|---|---|---|---|---|---|---|---|---|---|---|---|---|---|---|---|---|---|---|---|---|---|---|---|---|
| Balance, January 1, 2001 | $ | 181.0 | $ | 88.5 | $ | — | $ | — | $ | — | $ | (58.8 | ) | $ | (67.8 | ) | $ | 142.9 | $ | — | |||||||||
| Issuance of preferred stock | — | 11.5 | — | — | — | — | — | 11.5 | — | ||||||||||||||||||||
| Net loss | — | — | — | — | — | (842.7 | ) | — | (842.7 | ) | — | ||||||||||||||||||
| Other comprehensive loss | — | — | — | — | — | — | (73.5 | ) | (73.5 | ) | — | ||||||||||||||||||
| Balance, December 31, 2001 | 181.0 | 100.0 | — | — | — | (901.5 | ) | (141.3 | ) | (761.8 | ) | — | |||||||||||||||||
Recapitalization and member contribution for/of: |
|||||||||||||||||||||||||||||
| Initial capitalization of Huntsman Holdings | (181.0 | ) | (100.0 | ) | — | — | 274.0 | — | — | (7.0 | ) | 7.0 | |||||||||||||||||
| Exchange of debt for equity | — | — | — | — | 361.7 | — | — | 361.7 | 391.4 | ||||||||||||||||||||
| Expenses of exchange of debt | — | — | — | — | (4.9 | ) | — | — | (4.9 | ) | (5.2 | ) | |||||||||||||||||
| Acquisition of minority interests in affiliates (Note 1) | — | — | — | — | 71.1 | — | — | 71.1 | — | ||||||||||||||||||||
| Notes receivable from HIH and payable to ICI | — | — | — | — | 169.7 | — | — | 169.7 | — | ||||||||||||||||||||
| Cash contribution | — | — | — | — | 3.4 | — | — | 3.4 | — | ||||||||||||||||||||
| Net loss | — | — | — | — | — | (22.2 | ) | — | (22.2 | ) | — | ||||||||||||||||||
| Other comprehensive income | — | — | — | — | — | — | 10.2 | 10.2 | 1.8 | ||||||||||||||||||||
| Dividends accrued on manditorily redeemable preferred member's interest | — | — | — | — | (17.8 | ) | — | — | (17.8 | ) | 17.8 | ||||||||||||||||||
| Balance, December 31, 2002 | — | — | — | — | 857.2 | (923.7 | ) | (131.1 | ) | (197.6 | ) | 412.8 | |||||||||||||||||
| Acquistion of subsidiary debt at less than carrying amount | — | — | — | — | 19.5 | — | — | 19.5 | — | ||||||||||||||||||||
| Distribution to member | — | — | — | — | (2.2 | ) | — | — | (2.2 | ) | — | ||||||||||||||||||
| Preferred shares issued in exchange for investment in Advanced Materials Investment | — | 194.4 | — | — | — | — | — | 194.4 | — | ||||||||||||||||||||
| Net loss | — | — | — | — | — | (319.8 | ) | — | (319.8 | ) | — | ||||||||||||||||||
| Other comprehensive income | — | — | — | — | — | — | 241.6 | 241.6 | — | ||||||||||||||||||||
| Accumulated other comprehensive loss of HIH at May 1, 2003 (date of consolidation) | — | — | — | — | — | — | (49.3 | ) | (49.3 | ) | — | ||||||||||||||||||
| Dividends accrued on manditorily redeemable preferred member's interest | — | — | — | — | (74.3 | ) | — | — | (74.3 | ) | 74.3 | ||||||||||||||||||
| Balance, December 31, 2003 | $ | — | $ | 194.4 | $ | — | $ | — | $ | 800.2 | $ | (1,243.5 | ) | $ | 61.2 | $ | (187.7 | ) | $ | 487.1 | |||||||||
See accompanying notes to consolidated financial statements
F-47
HUNTSMAN HOLDINGS, LLC AND SUBSIDIARIES
CONSOLIDATED STATEMENTS OF CASH FLOWS
(Dollars in Millions)
| |
Year ended December 31, |
||||||||||
|---|---|---|---|---|---|---|---|---|---|---|---|
| |
2003 |
2002 |
2001 |
||||||||
| Cash Flows From Operating Activities: | |||||||||||
| Net loss | $ | (319.8 | ) | $ | (22.2 | ) | $ | (842.7 | ) | ||
| Adjustments to reconcile net loss to net cash provided by (used in) operating activities: | |||||||||||
| Cumulative effect of accounting change | — | (169.7 | ) | (0.1 | ) | ||||||
| Equity in losses of investment in unconsolidated affiliates | 37.5 | 31.4 | 86.8 | ||||||||
| Depreciation and amortization | 353.4 | 152.7 | 197.5 | ||||||||
| Provision for losses on accounts receivable | 11.3 | (1.8 | ) | 1.3 | |||||||
| Noncash restructuring, plant closing, and asset impairment charges | 9.7 | (5.3 | ) | 528.2 | |||||||
| Loss (gain) on disposal of plant and equipment | 2.4 | 0.5 | (4.8 | ) | |||||||
| Loss on disposal of exchangeable preferred stock | — | — | 7.0 | ||||||||
| Loss on sale of nonqualified plan securities | — | — | 4.2 | ||||||||
| Loss on early extinguishment of debt | — | 6.7 | 1.1 | ||||||||
| Noncash interest expense | 111.8 | 7.6 | 10.4 | ||||||||
| Noncash interest on affiliate debt | (21.1 | ) | (13.1 | ) | — | ||||||
| Deferred income taxes | (3.6 | ) | — | (184.5 | ) | ||||||
| Unrealized gains on foreign currency transactions | (58.3 | ) | — | — | |||||||
| Minority interests in subsidiaries income (loss) | (1.5 | ) | 28.8 | (13.1 | ) | ||||||
| Changes in operating assets and liabilities (net of acquisitions): | |||||||||||
| Accounts and notes receivables | 81.0 | (48.2 | ) | 3.6 | |||||||
| Change in receivables sold, net | (11.5 | ) | — | — | |||||||
| Inventories | 87.8 | 1.3 | 62.0 | ||||||||
| Prepaid expenses | (2.8 | ) | (12.3 | ) | 21.2 | ||||||
| Other current assets | (15.9 | ) | — | — | |||||||
| Other noncurrent assets | (24.3 | ) | (6.4 | ) | 83.4 | ||||||
| Accounts payable | (71.5 | ) | 56.9 | (167.0 | ) | ||||||
| Accrued liabilities | 71.5 | 67.5 | (11.6 | ) | |||||||
| Other noncurrent liabilities | (10.7 | ) | 14.3 | (69.9 | ) | ||||||
| Net cash provided by (used in) operating activities | 225.4 | 88.7 | (287.0 | ) | |||||||
| Investing Activities: | |||||||||||
| Capital expenditures | (191.0 | ) | (70.2 | ) | (76.4 | ) | |||||
| Proceeds from sale of plant & equipment | 0.3 | — | 17.2 | ||||||||
| Cash paid for intangible asset | (2.3 | ) | — | — | |||||||
| Advances to unconsolidated affiliates | (7.8 | ) | (7.5 | ) | (6.1 | ) | |||||
| Acquisition of minority interest in HIH | (286.0 | ) | — | — | |||||||
| Cash portion of AdMat acquisition | (397.6 | ) | |||||||||
| Purchase of Vantico senior notes | (22.7 | ) | — | — | |||||||
| Proceeds from sale of nonqualified plan assets | — | — | 191.0 | ||||||||
| Proceeds from sale of exchangeable preferred stock | — | — | 22.8 | ||||||||
| Net cash provided by (used in) investing activities | (907.1 | ) | (77.7 | ) | 148.5 | ||||||
| Financing Activities: | |||||||||||
| Net borrowings (repayment) under revolving loan facilities | (201.4 | ) | 32.1 | 202.8 | |||||||
| Net borrowings on overdraft | 7.5 | — | — | ||||||||
| Repayment of long-term debt | (426.6 | ) | (121.6 | ) | (166.8 | ) | |||||
| Proceeds from long-term debt | 1,288.6 | — | 110.0 | ||||||||
| Repayment of note payable to ICI | (105.7 | ) | — | — | |||||||
| Proceeds from issuance of warrants | 130.0 | ||||||||||
| Cash paid for reacquired warrants | (1.3 | ) | |||||||||
| Proceeds from subordinated note issued to an affiliated entity | — | — | 25.0 | ||||||||
| Shares of subsidiary issued to minority interests for cash | 1.7 | — | — | ||||||||
| Cost of raising equity capital | (10.1 | ) | — | — | |||||||
| Debt issuance costs | (58.2 | ) | (16.6 | ) | (0.3 | ) | |||||
| (Distribution to) capital contribution from members | (2.2 | ) | 5.2 | — | |||||||
| Cash contributed to subsidiary later exchanged for preferred tracking stock | 164.4 | — | — | ||||||||
| Cash acquired in acquisition of equity method affiliate | — | 7.9 | — | ||||||||
| Proceeds from issuance of preferred stock | — | — | 11.5 | ||||||||
| Net cash provided by (used in) financing activities | 786.7 | (93.0 | ) | 182.2 | |||||||
| Effect of exchange rate changes on cash | 9.5 | 3.6 | (6.4 | ) | |||||||
| Increase (decrease) in cash and cash equivalents, including restricted cash | 114.5 | (78.4 | ) | 37.3 | |||||||
| Cash and cash equivalents at beginning of period, including restricted cash | 31.6 | 110.0 | 72.7 | ||||||||
| Cash and cash equivalents of HIH at May 1, 2003 (date of consolidation) | 62.2 | — | — | ||||||||
| Cash and cash equivalents at end of period, including restricted cash | $ | 208.3 | $ | 31.6 | $ | 110.0 | |||||
Supplemental cash flow information: |
|||||||||||
| Cash paid for interest | 263.9 | 104.4 | 217.2 | ||||||||
| Cash paid for income taxes | 8.4 | (1.5 | ) | (10.3 | ) | ||||||
F-48
Supplemental non-cash investing and financing activities:
The Company finances a portion of its property and liability insurance premiums with third parties. During the year ended December 31, 2003, 2002 and 2001, the Company issued notes payable for approximately $9.3 million, $2.3 million and $2.5 million, respectively, and recorded prepaid insurance for the same amount, which will be amortized over the period covered.
On June 30, 2003, MatlinPatterson Global Opportunities Partners, L.P. contributed its 100% of Huntsman Advanced Materials Investment LLC's common equity to the Company in exchange for $194.4 million of preferred members' interests
On September 30, 2002, the Company issued common units of membership interests and the unit of mandatorily redeemable preferred membership interest in exchange for subordinated notes payable of its wholly owned subsidiaries, Huntsman LLC and Huntsman Polymers Corporation. The value assigned to the units was equal to the net book value of the debt exchanged of $753.1 million including accrued interest, less deferred debt issuance costs.
On September 30, 2002, the Company issued common units of membership interest in exchange for the following interests: (1) the remaining 20% interest in JK Holdings Corporation and the remaining 20% interest in Huntsman Surfactants Technology Corporation, both previously accounted for as consolidated subsidiaries, (2) the remaining 50% interest in Huntsman Chemical Australia Unit Trust and HCPH Holdings Pty Limited, formerly accounted for as an investment in unconsolidated affiliates using equity method accounting; and (3) the remaining 19.9% interest in Huntsman Specialty Chemicals Holding Corporation. The value assigned to the units issued was equal to the fair value of the assets acquired (including cash of $7.9 million and net debt assumed of $35.3 million).
On September 30, 2002, the Company issued common units of membership interest in exchange for subordinated discount notes receivable of Huntsman International Holdings LLC valued at $273.1 million (including accrued interest of $13.1 million) and a payable to Imperial Chemical Industries PLC of $103.5 million (including accrued interest of $3.5 million). The net contribution to the Company of $169.7 million has been assigned as the value of the units issued.
During 2001, the Company executed a capital lease and recorded a $4.9 million increase to long-term debt and property, plant and equipment.
See accompanying notes to consolidated financial statements
F-49
HUNTSMAN HOLDINGS, LLC AND SUBSIDIARIES
NOTES TO CONSOLIDATED FINANCIAL STATEMENTS
1. General
Description of Business
Huntsman Holdings, LLC (the "Company" and, unless the context otherwise requires, including its subsidiaries) is a global manufacturer and marketer of differentiated and commodity chemicals. The Company produces a wide range of products for a variety of global industries, including the chemical, plastics, automotive, aviation, footwear, paints and coatings, construction, technology, agriculture, healthcare, consumer products, textile, furniture, appliance and packaging industries. The Company operates at facilities located in North America, Europe, Asia, Australia, South America and Africa. The Company's business is organized into six reportable operating segments: Polyurethanes, Advanced Materials, Performance Products, Polymers, Pigments and Base Chemicals.
In this report, "HGI" refers to Huntsman Group, Inc., "HMP" refers to HMP Equity Holdings Corporation and, unless the context otherwise requires, its subsidiaries, "HLLC" or "Huntsman LLC" refers to Huntsman LLC and, unless the context otherwise requires, its subsidiaries, "Huntsman Polymers" refers to Huntsman Polymers Corporation and, unless the context otherwise requires, its subsidiaries, "Huntsman Specialty" refers to Huntsman Specialty Chemicals Corporation, "HCCA" refers to Huntsman Chemical Company Australia Pty. Ltd. and, unless the context otherwise requires, its subsidiaries, "HI" refers to Huntsman International LLC and, unless the context otherwise requires, its subsidiaries, "HIH" refers to Huntsman International Holdings LLC and, unless the context otherwise requires, its subsidiaries, "AdMat" refers to Huntsman Advanced Materials LLC and, unless the context otherwise requires, its subsidiaries, "AdMat Investment" refers to Huntsman Advanced Materials Investment LLC, "AdMat Holdings" refers to Huntsman Advanced Materials Holdings LLC, "Vantico" refers to Vantico Group S.A. and, unless the context otherwise requires, its subsidiaries, "MatlinPatterson" refers to MatlinPatterson Global Opportunities Partners, L.P. and its affiliates, "Consolidated Press" refers to Consolidated Press Holdings Limited and its subsidiaries, and "ICI" refers to Imperial Chemical Industries PLC and its subsidiaries.
Company
The Company is a Delaware limited liability company, and the voting membership interests of the Company are owned by the Huntsman family, MatlinPatterson, Consolidated Press and certain members of the Company's senior management. In addition, the Company has issued a non-voting preferred unit to Huntsman Holdings Preferred Member LLC, which, in turn, is owned by MatlinPatterson (indirectly), Consolidated Press, the Huntsman Cancer Foundation, certain members of the Company's senior management, certain members of the Huntsman family and an individual investor. The Company has issued certain other non-voting preferred units to the Huntsman family, MatlinPatterson and Consolidated Press that track the performance of the AdMat business. The Huntsman family has board and operational control of the Company.
The Company operates its businesses through three principal operating subsidiaries: Huntsman LLC, HIH and AdMat. Each of the Company's principal operating subsidiaries is separately financed, its debt is non-recourse to the Company (with the exception of certain limited guarantees executed by the Company in connection with the construction financing of certain manufacturing facilities in China), and the Company has no contractual obligations to fund its respective operations. Moreover, the debt of Huntsman LLC is non-recourse to HIH and AdMat, the debt of HIH is non-recourse to Huntsman LLC and AdMat, and the debt of AdMat is non-recourse to Huntsman LLC and HIH.
F-50
The Company was formed on September 30, 2002 to hold, among other things, the equity interests of Huntsman LLC. The formation was between entities under common control. The transfer of the net assets of Huntsman LLC was recorded at historical carrying value. The consolidated financial statements of HMP presented herein reflect the financial position, results of operations and cash flows as if Huntsman LLC and the Company were combined for all periods presented. Prior to September 30, 2002, Huntsman LLC was owned by members of the Huntsman family and by certain affiliated entities. On September 30, 2002, Huntsman LLC and its subsidiary, Huntsman Polymers, completed debt for equity exchanges (the "Restructuring"). Pursuant to the Restructuring, the Huntsman family contributed all their equity interests in Huntsman LLC and its subsidiaries, including minority interests acquired from Consolidated Press and the interests described in the second following paragraph, to the Company in exchange for equity interests in the Company. MatlinPatterson and Consolidated Press exchanged approximately $679 million in principal amount of Huntsman LLC's outstanding subordinated notes and Huntsman Polymers' outstanding senior notes they held into equity interests in the Company. There was also approximately $84 million in accrued interest that was cancelled as a result of the exchange. The net book value of the $763 million of principal and accrued interest, after considering debt issuance costs, was $753 million. The Company contributed its investment in Huntsman LLC to HMP.
In the Restructuring, the effective cancellation of debt was recorded as a capital contribution because MatlinPatterson and Consolidated Press received equity of the Company in exchange. The fair value of the equity received approximated the carrying value of the debt exchanged. No gain was recorded on the Restructuring.
Also related to the Restructuring, in June 2002, MatlinPatterson entered into an agreement with ICI (the "Option Agreement"). The Option Agreement provided BNAC, Inc. ("BNAC"), then a MatlinPatterson subsidiary, with an option to acquire the ICI subsidiary that held a 30% membership interest in HIH (the "ICI 30% Interest") on or before May 15, 2003 upon the payment of $180 million plus accrued interest from May 15, 2002, and subject to completion of the purchase of the senior subordinated reset discount notes due 2009 of HIH that were originally issued to ICI (the "HIH Senior Subordinated Discount Notes"). Concurrently, BNAC paid ICI $160 million to acquire the HIH Senior Subordinated Discount Notes, subject to certain conditions, including the obligation to make an additional payment of $100 million plus accrued interest to ICI. The HIH Senior Subordinated Discount Notes were pledged to ICI as collateral security for such additional payment.
In connection with the Restructuring, all the shares in BNAC were contributed to HMP. The Company caused BNAC to be merged into HMP. As a result of its merger with BNAC, HMP held the interests formerly held by BNAC in the HIH Senior Subordinated Discount Notes and the option to acquire the subsidiary of ICI that held the ICI 30% Interest. The HIH Senior Subordinated Discount Notes were valued at $273.1 million (including accrued interest of $13.1 million) and the note payable to ICI of $103.5 million (including accrued interest of $3.5 million) was recorded by the Company. The net contribution to HMP of $169.7 million was accounted for as an equity contribution.
Prior to May 9, 2003, the Company owned, indirectly, approximately 61% of the membership interests of HIH. The Company accounted for its investment in HIH on the equity method due to the significant management participation rights formerly granted to ICI pursuant to the HIH limited liability company agreement. On May 9, 2003, the Company's indirect subsidiary, HMP, exercised the option under the Option Agreement and purchased the ICI subsidiary that held ICI's 30% membership interest in HIH, and, at that time, HMP also purchased approximately 9% of the HIH membership
F-51
interests held by institutional investors (the "HIH Consolidation Transaction"). The total consideration paid in connection with the HIH Consolidation Transaction was approximately $286 million. As a result of the HIH Consolidation Transaction, the Company (indirectly through HMP and its subsidiaries) owns 100% of the HIH membership interests. Accordingly, as of May 1, 2003, HIH is a consolidated subsidiary of the Company and is no longer accounted for on an equity basis. The following table is a summarization of the net assets of HIH as of May 1, 2003 (dollars in millions):
| Current assets | $ | 1,364.5 | |
| Property, plant and equipment, net | 3,082.2 | ||
| Other noncurrent assets | 740.4 | ||
| Total assets | $ | 5,187.1 | |
Current liabilities |
$ |
885.0 |
|
| Long term debt (including current portion) | 3,638.1 | ||
| Other noncurrent liabilities | 366.1 | ||
| Total liabilities | $ | 4,889.2 | |
The Company accounted for the acquisition using the purchase method. Accordingly, the results of operation and cash flows of the acquired interests were consolidated with those of the Company beginning in May 2003. During the second quarter of 2004, the Company finalized the allocation of the purchase price. As part of its final purchase price allocation, the Company valued the related pension liabilities, recorded deferred taxes and reclassified certain other amounts resulting in a corresponding increase in property, plant and equipment of approximately $286 million.
On June 30, 2003, the Company, MatlinPatterson, HGI, SISU Capital Ltd. ("SISU") and Morgan Grenfell Private Equity Limited ("MGPE") completed a restructuring and business combination involving Vantico, whereby ownership of the equity of Vantico was transferred to AdMat (the "AdMat Transaction"). In the AdMat Transaction,
F-52
The AdMat Transaction has been accounted for as follows:
In connection with the AdMat Transaction, the Company has determined the fair value of assets acquired. The preliminary allocation of the purchase price is summarized as follows (dollars in millions):
| Current assets (including cash of $34.7 million) | $ | 415.8 | |||
| Current liabilities | (239.8 | ) | |||
| Property, plant and equipment, net | 397.4 | ||||
| Intangible assets, net | 34.9 | ||||
| Deferred tax | (8.6 | ) | |||
| Other noncurrent assets | 44.2 | ||||
| Other noncurrent liabilities | (122.1 | ) | |||
| Net assets acquired | $ | 521.8 | |||
The acquired intangible assets represent trademarks and patents which have a weighted-average useful life of approximately 15-30 years. The following table reflects the Company's results of operations on a pro forma basis as if the business combination of HIH and AdMat had been completed at the beginning of the periods presented utilizing HIH and AdMat's historical results (dollars in millions):
| |
Year Ended December 31, |
||||||
|---|---|---|---|---|---|---|---|
| |
2003 |
2002 |
|||||
| Revenue | $ | 9,252.4 | $ | 8,012.2 | |||
| Loss before minority interest and cumulative effect of accounting change | 369.6 | (359.3 | ) | ||||
| Net loss | (395.6 | ) | (166.8 | ) | |||
The pro forma information is not necessarily indicative of the operating results that would have occurred had the HIH Consolidation Transaction and the AdMat Transaction been consummated on January 1, 2002, nor are they necessarily indicative of future operating results.
The HIH Consolidation Transaction and the AdMat Transaction have resulted in changes in the Company's operating segments. Prior to the HIH Consolidation Transaction, the Company reported its operations through three principal operating segments. After the HIH Consolidation Transaction but prior to the AdMat Transaction, the Company reported its operations through five segments. The
F-53
Company now reports its operations through six segments: Polyurethanes, Advanced Materials, Performance Products, Polymers, Pigments and Base Chemicals.
On March 19, 2004, the Company acquired MGPE's 2.1% equity in AdMat Holdings for $7.2 million.
As of March 31, 2004, the Company owns approximately 90% of AdMat Holdings, directly and indirectly. The remaining 9.8% of the equity of AdMat Holdings is owned by unrelated third parties.
2. Summary of Significant Accounting Policies
Principles of Consolidation
The consolidated financial statements of the Company include the accounts of the Company and its majority-owned subsidiaries. All intercompany accounts and transactions have been eliminated.
Revenue Recognition
The Company generates substantially all of its revenues through sales in the open market and long-term supply agreements. The Company recognizes revenue when it is realized or realizable, and earned. Revenue for product sales is recognized as risk and title to the product transfer to the customer, collectibility is reasonably assured, and pricing is fixed or determinable. Generally, this occurs at the time shipment is made.
Cost of Goods Sold
The Company classifies the costs of manufacturing and distributing its products as cost of goods sold. Manufacturing costs include variable costs, primarily raw materials and energy, and fixed expenses directly associated with production. Manufacturing costs include, among other things, plant site operating costs and overhead, production planning and logistics costs, repair and maintenance costs, plant site purchasing costs, and engineering and technical support costs. Distribution, freight and warehousing costs are also included in cost of goods sold.
Use of Estimates
The preparation of financial statements in conformity with generally accepted accounting principles in the United States requires management to make estimates and assumptions that affect the reported amounts of assets and liabilities and disclosure of contingent assets and liabilities at the date of the financial statements and the reported amounts of revenues and expenses during the reporting period. Actual results could differ from those estimates.
Cash and Cash Equivalents
The Company considers cash in checking accounts and cash in short-term highly liquid investments with an original maturity of three months or less to be cash and cash equivalents. The Company has a master collection account that receives funds from the various lockboxes maintained by the Company that are subject to certain restrictive lockbox agreements. Cash held in both the lockboxes and the master collection account is considered as restricted cash in the accompanying consolidated balance sheet.
F-54
Securitization of Accounts Receivable
HI securitizes certain trade receivables in connection with a revolving accounts receivable securitization program in which HI grants a participating undivided interest in certain of its trade receivables to a qualified off-balance sheet entity. HI retains the servicing rights and a retained interest in the securitized receivables. Losses are recorded on the sale and are based on the carrying value of the receivables as allocated between the receivables sold and the retained interests and their relative fair value at the date of the transfer. Retained interests are subsequently carried at fair value which is estimated based on the present value of expected cash flows, calculated using management's best estimates of key assumptions including credit losses and discount rates commensurate with the risks involved. For more information, see "Note 11 Securitization of Accounts Receivable."
Inventories
Inventories are stated at the lower of cost or market, with cost determined using last-in first-out, first-in first-out, and average costs methods for different components of inventory.
Property, Plant and Equipment
Property, plant and equipment is stated at cost less accumulated depreciation. Depreciation is computed using the straight-line method over the estimated useful lives or lease term as follows:
| Buildings and equipment | 10 - 60 years | |
| Plant and equipment | 3 - 25 years | |
| Furniture, fixtures and leasehold improvements | 5 - 20 years |
Until January 1, 2003, approximately $1.3 billion of the total plant and equipment was depreciated using the straight-line method on a group basis at a 4.7% composite rate. When capital assets representing complete groups of property were disposed of, the difference between the disposal proceeds and net book value was credited or charged to income. When miscellaneous assets were disposed of, the difference between asset costs and salvage value was charged or credited to accumulated depreciation. Effective January 1, 2003, the Company changed its method of accounting for depreciation for the assets previously recorded on a group basis to the component method. Specifically, the net book value of all the assets on January 1, 2003 were allocated to individual components and are being depreciated over their remaining useful lives and gains and losses are recognized when a component is retired. This change decreased depreciation for the year ended December 31, 2003 by $43.0 million.
Interest expense capitalized as part of plant and equipment was $5.1 million, $3.3 million and $3.7 million for the years ended December 31, 2003, 2002 and 2001, respectively.
Periodic maintenance and repairs applicable to major units of manufacturing facilities are accounted for on the prepaid basis by capitalizing the costs of the turnaround and amortizing the costs over the estimated period until the next turnaround. Normal maintenance and repairs of plant and equipment are charged to expense as incurred. Renewals, betterments and major repairs that materially extend the useful life of the assets are capitalized, and the assets replaced, if any, are retired.
F-55
Investment in Exchangeable Preferred Stock
The Company's investment consisted of 100,000 shares of Series A Cumulative Participating Retractable Preferred Stock of NOVA Chemicals (USA) (the "NOVA Preferred Stock") with an aggregate liquidation value of $198.0 million. These shares had no voting rights. Dividends accrued at a rate of 6.95% of the aggregate liquidation preference annually through April 1, 2001, when the rate decreased to 5.95%.
The Company sold the NOVA Preferred Stock during June 2001 to NOVA for $191.0 million, realizing a loss of $7.0 million, which is recorded as other expense.
Investment in Unconsolidated Affiliates
Investments in companies in which the Company exercises significant management influence are accounted for using the equity method.
Intangible Assets and Goodwill
Intangible assets are stated at cost (fair value at the time of acquisition) and are amortized using the straight-line method over the estimated useful lives or the life of the related agreement as follows:
| Patents and technology | 5 - 30 years | |
| Trademarks | 15 - 30 years | |
| Licenses and other agreements | 5 - 15 years | |
| Other intangibles | 5 - 15 years |
Prior to January 2002, the Company amortized goodwill over periods ranging from 10-20 years. Effective January 1, 2002, the Company ceased amortizing goodwill in accordance with SFAS No. 142. All goodwill is recorded within the Base Chemicals segment.
Other Noncurrent Assets
Other noncurrent assets consist primarily of deposits, spare parts, debt issuance costs, notes receivable, process catalysts, employee benefit assets and turnaround costs. Debt issuance costs are amortized using the interest method over the term of the related debt.
Non-qualified employee benefit plan trust assets were classified as available for sale until such trusts were terminated and the securities were sold in September 2001. Available for sale securities were carried at fair value with net unrealized gains or losses (net of taxes) excluded from income and recorded as a component of other comprehensive income (loss).
During September 2001, the non-qualified employee benefit plan trusts were terminated and paid out to the employees participating in the plans.
Carrying Value of Long-Term Assets
The Company evaluates the carrying value of long-term assets based upon current and anticipated undiscounted cash flows and recognizes an impairment when such estimated cash flows will be less than the carrying value of the asset. Measurement of the amount of impairment, if any, is based upon the difference between carrying value and fair value. Fair value is determined by discounting estimated
F-56
future cash flows using a discount rate commensurate with the risks involved. See "Note 10—Restructuring, Plant Closing and Impairment Costs."
Financial Instruments
The carrying amount reported in the balance sheet for cash and cash equivalents, accounts receivable and accounts payable approximates fair value because of the immediate or short-term maturity of these financial instruments. The carrying value of the senior secured credit facilities of the Company's subsidiaries approximates fair value since they bear interest at a floating rate plus an applicable margin. The fair value of the fixed rate and floating rate notes of the Companies subsidiaries is estimated based on interest rates that are currently available to the Company for issuance of debt with similar forms and remaining maturities. See "Note 21—Fair Value of Financial Instruments."
Income Taxes
Huntsman Holdings, LLC is treated as a partnership for U.S. federal income tax purposes and as such is generally not subject to U.S. income tax. Income of the Company is taxed directly to its owners. Income from the Company's subsidiaries is taxed under consolidated corporate income tax rules. These subsidiaries file a U.S. Federal consolidated tax return with HGI as the parent. HGI and all of its U.S. subsidiaries are parties to various tax sharing agreements which generally provide that entities will pay their own tax (as computed on a separate-company basis) and be compensated for the use of tax attributes, including NOLs.
The Company uses the asset and liability method of accounting for income taxes. Deferred income taxes reflect the net tax effects of temporary differences between the carrying amounts of assets and liabilities for financial and tax reporting purposes. The Company evaluates the resulting deferred tax assets to determine whether it is more likely than not that they will be realized. Valuation allowances have been established against the entire U.S. and a material portion of the non-U.S. deferred tax assets due to the uncertainty of realization.
Subsequent to the AdMat Transaction, substantially all non-U.S. operations of AdMat are treated as branches of the Company's subsidiaries for U.S. income tax purposes and are, therefore, subject to both U.S. and non-U.S. income tax. Until the Company's subsidiaries have sufficient U.S. taxable income to utilize foreign tax credits, most income will continue to be effectively taxed in both U.S. and non-U.S. jurisdictions in which it is earned.
Prior and subsequent to the AdMat Transaction, for non-U.S. entities that are not treated as branches for U.S. tax purposes, the Company does not provide for income taxes or benefits on the undistributed earnings of these subsidiaries as earnings are reinvested and, in the opinion of management, will continue to be reinvested indefinitely. Upon distribution of these earnings, certain of the Company's subsidiaries would be subject to both income taxes and withholding taxes in the various international jurisdictions. It is not practical to estimate the amount of taxes that might be payable upon such distributions.
Derivatives and Hedging Activities
Effective January 1, 2001, the Company adopted Statement of Financial Accounting Standards ("SFAS") No. 133, "Accounting For Derivative Instruments And Hedging Activities." SFAS No. 133, as amended and interpreted, establishes accounting and reporting standards for derivative instruments,
F-57
including certain derivative instruments embedded in other contracts, and for hedging activities. All derivatives, whether designated in hedging relationships or not, are required to be recorded on the balance sheet at fair value. If the derivative is designated in a fair-value hedge, the changes in the fair value of the derivative and the hedged items are recognized in earnings. If the derivative is designated in a cash-flow hedge, changes in the fair value of the derivative are recorded in other comprehensive income and will be recognized in the income statement when the hedged item affects earnings. SFAS No. 133 defines new requirements for designation and documentation of hedging relationships as well as ongoing effectiveness assessments in order to use hedge accounting. For a derivative that does not qualify as a hedge, changes in fair value are recognized in earnings.
In 2001, the adoption of SFAS No. 133 resulted in a cumulative increase in net gain of $0.1 million, a cumulative decrease to accumulated other comprehensive loss of $1.8 million and an increase in total liabilities of $3.1 million for derivatives designated as cash flow-type hedges. See "Note 13—Derivative Instruments and Hedging Activities."
Environmental Expenditures
Environmental related restoration and remediation costs are recorded as liabilities when site restoration and environmental remediation and clean-up obligations are either known or considered probable and the related costs can be reasonably estimated. Other environmental expenditures that are principally maintenance or preventative in nature are recorded when expended and expensed or capitalized as appropriate. See "Note 22—Environmental Matters."
Research and Development
Research and development costs are expensed as incurred.
Foreign Currency Translation
The accounts of the Company's subsidiaries outside of the United States, except for those operating in highly inflationary economic environments, consider local currency to be the functional currency. Accordingly, assets and liabilities are translated at rates prevailing at the balance sheet date. Revenues, expenses, gains and losses are translated at a weighted average rate for the period. Cumulative translation adjustments are recorded to stockholder's equity as a component of accumulated other comprehensive income (loss).
Subsidiaries that operate in economic environments that are highly inflationary consider the U.S. dollar to be the functional currency and include gains and losses from translation to the U.S. dollar from the local currency in the statement of operations.
Transaction gains and losses are recorded in the statement of operations and were a net gain of $44.5 million, a net loss of $1.5 million and a net gain of $2.0 million for the years ended December 31, 2003, 2002 and 2001, respectively.
Earnings per Unit of Membership Interest
Earnings per unit of membership interest is not presented because it is not considered meaningful information due to the Company's capital structure.
F-58
Recently Issued Accounting Standards
On January 1, 2002, the Company adopted SFAS No. 141, "Business Combinations" and SFAS No. 142, "Goodwill and Other Intangible Assets." SFAS No. 141 requires, among other things, that the purchase method be used for business combinations after June 30, 2001. SFAS No. 142 changes the accounting for goodwill and intangible assets with indefinite lives from an amortization method to an impairment-only approach. Upon adoption of SFAS No. 142, the Company is required to reassess the useful lives of all acquired intangible assets and perform an impairment test on goodwill. In the first quarter 2002, the Company completed the assessment of useful lives and concluded that no adjustments to the amortization period of intangible assets were necessary. The Company also completed its initial assessment of goodwill impairment and concluded that there is no indication of impairment. The Company has elected to test goodwill for impairment annually as of April 1, as required by SFAS No. 142. The annual assessment has been completed as of April 1, 2003 and 2002 and the Company has concluded that there is no indication of impairment. The initial adoption of SFAS No. 142 had no impact on the Company's consolidated financial statements for the year ended December 31, 2002. The pro forma net loss, assuming the change in accounting principle was applied retroactively to January 1, 2001, would not have been materially different for the year ended December 31, 2001.
The initial adoption of SFAS No. 141 increased net income by $169.7 million for the year ended December 31, 2002. This increase resulted from increasing the carrying value of the investments in HIH to reflect the proportionate share of the underlying assets as required by SFAS No. 141. Effective June 30, 1999, Huntsman Specialty Chemicals Corporation ("Huntsman Specialty"), a consolidated subsidiary of the Company, transferred its propylene oxide business to HIH. The transfer of the Company's propylene oxide business was recorded at the net book value of the assets and liabilities transferred. The carrying value of the Company's investment in HIH was less than its proportionate share of the underlying net assets of HIH at December 31, 2001 by approximately $176.1 million. Such difference was being accreted to income over a 20 year period. See "Note 5—Investment in Unconsolidated Affiliates."
In August 2001, the Financial Accounting Standards Board ("FASB") issued SFAS No. 143, "Accounting for Asset Retirement Obligations." SFAS No. 143 addresses financial accounting and reporting for obligations associated with the retirement of tangible, long-lived assets and the associated asset retirement costs. This statement requires that the fair value of a liability for an asset retirement obligation be recognized in the period in which it is incurred by capitalizing it as part of the carrying amount of the long-lived assets. As required by SFAS No. 143, the Company adopted this new accounting standard on January 1, 2003. The adoption of this statement had no impact since the timing of any ultimate obligation is indefinite.
On January 1, 2002, the Company adopted SFAS No. 144, "Accounting for The Impairment or Disposal of Long-Lived Assets." This statement establishes a single accounting model for the impairment or disposal of long-lived assets. The impact of adopting this pronouncement was not material.
In April 2002, the FASB issued SFAS No. 145, "Rescission of FASB Statements No. 4, 44 And 64, Amendment Of FASB Statement No. 13, And Other Technical Corrections." In addition to amending or rescinding pronouncements to make various technical corrections, clarify meanings or describe applicability, SFAS No. 145 precludes companies from recording gains or losses from extinguishment of debt as an extraordinary item. The Company was required to adopt this statement as of January 1, 2003. The adoption of SFAS No. 145 resulted in a $6.7 million reclassification of losses from
F-59
extinguishment of debt from extraordinary items to other income and expense in the year ended December 31, 2002.
In June 2002, the FASB issued SFAS No. 146, "Accounting for Costs Associated With Exit or Disposal Activities."SFAS No. 146 requires recording costs associated with exit or disposal activities at their fair values when a liability has been incurred. Under previous guidance, certain exit or disposal costs were accrued upon management's commitment to an exit or disposal plan, which is generally before an actual liability has been incurred. The Company adopted this pronouncement in the first quarter of 2003. The adoption of SFAS No. 146 did not have a material effect on the Company's consolidated financial statements.
In January 2003, the FASB issued Financial Interpretation ("FIN") No. 45, "Guarantor's Accounting and Disclosure Requirements for Guarantees, Including Guarantees of Indebtedness of Others." FIN No. 45 requires recognition of a liability for the obligation undertaken upon issuing a guarantee. This liability would be recorded at the inception date of the guarantee and would be measured at fair value. The disclosure provisions of the interpretation are effective for the financial statements as of December 31, 2002. The liability recognition provisions apply prospectively to any guarantees issued or modified after December 31, 2002. The adoption of FIN No. 45 did not have a material effect on the Company's consolidated financial statements.
In January 2003, the FASB issued FIN 46, "Consolidation of Variable Interest Entities." FIN 46 addresses the requirements for business enterprises to consolidate related entities, for which they do not have controlling interests through voting or other rights, if they are determined to be the primary beneficiary as a result of variable economic interests. Transfers to a qualifying special purpose entity are not subject to this interpretation. In December 2003, the FASB issued a complete replacement of FIN 46 ("FIN 46R"), to clarify certain complexities. The Company is required to adopt this standard on January 1, 2005. The impact of FIN 46R on the Company's financial statements will not be significant.
In May 2003, the FASB issued SFAS No. 149, "Amendment of Statement 133 on Derivative Instruments and Hedging Activities." SFAS No. 149 amends and clarifies accounting for derivative instruments and hedging activities under SFAS No. 133. This statement is effective for contracts entered into or modified after June 30, 2003 and for hedging relationships designated after June 30, 2003, with this guidance applied prospectively. This statement had no impact on the Company's results of operations or financial position at December 31, 2003 and the Company does not expect this statement to have a material impact on its consolidated financial statements.
In May 2003, the FASB issued SFAS No. 150, "Accounting for Certain Financial Instruments with Characteristics of Both Liabilities and Equity." SFAS No. 150 establishes standards for classifying and measuring as liabilities certain financial instruments that embody obligations of the issuer and have characteristics of both liabilities and equity. SFAS No. 150 is effective for all financial instruments created or modified after May 31, 2003 and otherwise is effective at the beginning of the first interim period beginning after June 15, 2003. The adoption of SFAS No. 150 did not have a material impact on the Company's consolidated financial statements.
Other accounting pronouncements that have been issued subsequent to December 31, 2003 and become effective in the years after December 31, 2003 are not expected to have any significant effect on the Company's financial position or results of operations.
F-60
3. Inventories
Inventories consist of the following (dollars in millions):
| |
December 31, 2003 |
December 31, 2002 |
|||||
|---|---|---|---|---|---|---|---|
| Raw materials and supplies | $ | 283.6 | $ | 77.8 | |||
| Work in progress | 32.7 | 13.1 | |||||
| Finished goods | 749.5 | 216.2 | |||||
| Total | 1,065.8 | 307.1 | |||||
LIFO reserves |
(15.5 |
) |
(7.1 |
) |
|||
| Lower of cost or market reserves | (11.0 | ) | (1.9 | ) | |||
| Net | $ | 1,039.3 | $ | 298.1 | |||
As of December 31, 2003 and 2002, approximately 16% and 53%, respectively, of inventories were recorded using the last-in, first-out cost method ("LIFO").
For the years ended December 31, 2002 and 2001, respectively, inventory quantities were reduced resulting in a liquidation of certain LIFO inventory layers carried at costs that were lower than the cost of current purchases, the effect of which reduced the net loss by approximately $1.7 million and $2.0 million, respectively.
In the normal course of operations, the Company at times exchanges raw materials and finished goods with other companies for the purpose of reducing transportation costs. The net open exchange positions are valued at the Company's cost. Net amounts deducted from or added to inventory under open exchange agreements, which represent the net amounts payable or receivable by the Company under open exchange agreements, were approximately $8.2 million payable and $12.4 million payable (26,910,072 and 89,359,629 pounds) at December 31, 2003 and 2002, respectively.
4. Property, Plant and Equipment
The cost and accumulated depreciation of property, plant and equipment are as follows (dollars in millions):
| |
December 31, 2003 |
December 31, 2002 |
|||||
|---|---|---|---|---|---|---|---|
| Land | $ | 118.6 | $ | 31.2 | |||
| Buildings | 517.8 | 192.1 | |||||
| Plant and equipment | 6,387.3 | 2,053.8 | |||||
| Construction in progress | 253.8 | 89.2 | |||||
| Total | 7,277.5 | 2,366.3 | |||||
| Less accumulated depreciation | (2,198.2 | ) | (1,079.1 | ) | |||
| Net | $ | 5,079.3 | $ | 1,287.2 | |||
Property, plant and equipment includes gross assets acquired under capital leases of $23.9 million at December 31, 2003 and 2002; related amounts included in accumulated depreciation were $5.4 million and $0.7 million at December 31, 2003 and 2002, respectively.
F-61
5. Investment in Unconsolidated Affiliates
The Company's ownership percentage and investment in unconsolidated affiliates were as follows (dollars in millions):
| |
December 31, 2003 |
December 31, 2002 |
||||
|---|---|---|---|---|---|---|
| Equity Method: | ||||||
| HIH (60%)(1) | $ | — | $ | 228.2 | ||
| Polystyrene Australia Pty Ltd. (50%) | 3.6 | 3.0 | ||||
| Sasol-Huntsman GmbH and Co. KG (50%) | 13.2 | 9.2 | ||||
| Louisiana Pigment Company, L.P. (50%) | 130.4 | — | ||||
| Rubicon, LLC (50%) | 1.0 | — | ||||
| BASF Huntsman Shanghai Isocyanate Investment BV (50%)(2) | 6.1 | — | ||||
| Others | 1.2 | — | ||||
| Total equity method investments | $ | 155.5 | $ | 240.4 | ||
Cost Method: |
||||||
| Gulf Advanced Chemicals Industry Corporation (10%) | $ | 2.5 | $ | 2.5 | ||
| Total investments | $ | 158.0 | $ | 242.9 | ||
Summarized Financial Information of Unconsolidated Affiliates
Summarized financial information of Sasol-Huntsman GmbH and Co. KG ("Sasol"), Louisiana Pigment Company, Rubicon, LLC, BASF AG ("BASF"), Huntsman Shanghai Isocyanate Investment BV and Polystyrene Australia Pty Ltd. as of December 31, 2003 and Sasol, and Polystyrene Australia Pty Ltd. as of December 31, 2002 and for the years then ended is presented below (dollars in millions):
| |
December 31, 2003 |
December 31, 2002 |
|||||
|---|---|---|---|---|---|---|---|
| Assets | $ | 186.3 | $ | 75.8 | |||
| Liabilities | 135.9 | 67.5 | |||||
| Revenues | 100.0 | 85.8 | |||||
| Net income | 3.4 | 11.7 | |||||
The Company's equity in: |
|||||||
| Net assets | $ | 155.5 | $ | 12.2 | |||
| Net income | 2.2 | 10.0 | |||||
F-62
Investment in HIH
Effective June 30, 1999, Huntsman Specialty, a consolidated unrestricted subsidiary of the Company, transferred its propylene oxide business to HIH. ICI transferred its polyurethane chemicals, selected petrochemicals (including ICI's 80% interest in the Wilton olefins facility) and titanium dioxide businesses to HIH. In addition, HIH also acquired the remaining 20% ownership interest in the Wilton olefins facility from BP Chemicals Limited for approximately $117.0 million.
In exchange for transferring its business, Huntsman Specialty retained a 60% common equity interest in HIH and received approximately $360.0 million in cash as a distribution from HIH. In exchange for transferring its businesses, ICI received a 30% common equity interest in HIH, approximately $2 billion in cash and discount notes of HIH with approximately $508.0 million of accreted value at issuance. Institutional investors acquired the remaining 10% common equity interest in HIH for $90.0 million in cash.
The transfer of Huntsman Specialty's propylene oxide business was recorded at the net book value of the assets and liabilities transferred. Prior to the HIH Consolidation Transaction, Huntsman LLC accounted for its investment in HIH on the equity method due to the significant management participation rights of ICI in HIH pursuant to HIH's limited liability company agreement.
The carrying value of Huntsman LLC's investment in HIH was less than its proportionate share of the underlying net assets of HIH at December 31, 2001 by approximately $176.1 million. Such difference was being accreted to income over a 20 year period. Management recorded an adjustment to reflect the accretion of the difference of $7.4 million in the investment basis in Huntsman LLC's consolidated financial statements for December 31, 2001. As discussed in "Note 2—Summary of Significant Accounting Policies" above, Huntsman LLC adopted SFAS No. 141 and increased its investment by $169.7 million as of January 1, 2002 to reflect its proportionate share of the underlying net assets of HIH.
On September 30, 2002, Huntsman LLC acquired the 19.9% interest in HSCHC which was previously owned by the Huntsman family directly. HSCHC holds 60% of the Company's investment in HIH. The estimated fair value of the 19.9% interest of $37.9 million has been recorded as an increase in the investment in HIH. The excess of $23.3 million over the Company's proportionate share of the net assets of HIH was accounted for as equity basis property and is being depreciated over the average useful life of property.
On November 2, 2000, ICI, Huntsman Specialty, HIH and HI entered into agreements (the "ICI Agreements") pursuant to which ICI had an option to transfer to Huntsman Specialty or its permitted designated buyers the 30% membership interest in HIH that ICI indirectly held (the "ICI 30% Interest"). Pursuant to these agreements, on October 30, 2001, ICI exercised its put right requiring Huntsman Specialty or its nominee to purchase the ICI 30% Interest. On December 20, 2001, ICI and Huntsman Specialty amended ICI's put option arrangement under the ICI Agreements to, among other things, provide that the purchase of the ICI 30% Interest would occur on July 1, 2003, or earlier under certain circumstances, and to provide for certain discounts to the purchase price for the ICI 30% Interest. The amended option agreement also required Huntsman Specialty to cause HIH to pay up to $112 million of dividends to its members, subject to certain conditions. These conditions included the receipt of consent from HI's senior secured lenders and HI's ability to make restricted payments under the indentures governing its outstanding senior notes and senior subordinated notes, as well as the
F-63
outstanding high yield notes of HIH. In addition, in order to secure its obligation to pay the purchase price for the ICI 30% Interest under the ICI Agreements, Huntsman Specialty granted ICI a lien on 30% of the outstanding membership interests in HIH.
As discussed in "Note 1—General" above, MatlinPatterson also entered into the Option Agreement with ICI in June 2002. The Option Agreement provided BNAC, then a MatlinPatterson subsidiary, with an option to acquire the ICI subsidiary that held the ICI 30% Interest on or before May 15, 2003 upon the payment of $180 million plus accrued interest from May 15, 2002, and subject to completion of the purchase of the HIH Senior Subordinated Discount Notes. Concurrently, BNAC paid ICI $160 million to acquire the HIH Senior Subordinated Discount Notes, subject to certain conditions, including the obligation to make an additional payment of $100 million plus accrued interest to ICI. The HIH Senior Subordinated Discount Notes were pledged to ICI as collateral security for such additional payment.
In connection with the Restructuring, all the shares in BNAC were contributed to the Company. The Company then caused BNAC to be merged into HMP. As a result of its merger with BNAC, HMP held the interests formerly held by BNAC in the HIH Senior Subordinated Discount Notes and the option to acquire the subsidiary of ICI that held the ICI 30% Interest.
Prior to May 9, 2003, the Company owned approximately 61% of the HIH membership interests. On May 9, 2003, the Company exercised its option under the Option Agreement and completed the HIH Consolidation Transaction. As a result, as of May 9, 2003, the Company indirectly owns 100% of the HIH membership interests. Prior to May 1, 2003, the Company accounted for its investment in HIH using the equity method of accounting due to the significant management participation rights formerly granted to ICI pursuant to the HIH limited liability company agreement. As a consequence of the Company's 100% indirect ownership of HIH and the resulting termination of ICI's management participation rights, the Company is considered to have a controlling financial interest in HIH. Accordingly, the Company no longer accounts for HIH using the equity method of accounting, but effective May 1, 2003 HIH's results of operations are consolidated with the Company's results of operations. Consequently, results of HIH through April 30, 2003 are recorded using the equity method of accounting, and results of HIH beginning May 1, 2003 are recorded on a consolidated basis. As a result, the summary historical financial data for periods ending prior to May 1, 2003 are not comparable to financial periods ending on or after May 1, 2003.
Summarized information for HIH as of December 31, 2002 and for the year then ended and the income statement information for the four months ended April 30, 2003 (balance sheet information on
F-64
HIH is not relevant in this table after April 30, 2003 because HIH has been consolidated after that date) is as follows (dollars in millions):
| |
Four months ended April 30, 2003 |
December 31, 2002 |
||||||
|---|---|---|---|---|---|---|---|---|
| Assets | $ | 5,044.1 | ||||||
| Liabilities | 4,706.1 | |||||||
| Revenues | $ | 1,733.4 | 4,518.1 | |||||
| Net income (loss) | (65.2 | ) | (68.5 | ) | ||||
The Company's equity in: |
||||||||
| Net assets | $ | 223.8 | ||||||
| Net loss | $ | (39.0 | ) | (41.1 | ) | |||
6. Intangible Assets
The gross carrying amount and accumulated amortization of intangible assets are as follows (dollars in millions):
| |
December 31, 2003 |
December 31, 2002 |
||||||||||||||||
|---|---|---|---|---|---|---|---|---|---|---|---|---|---|---|---|---|---|---|
| |
Carrying Amount |
Accumulated Amortization |
Net |
Carrying Amount |
Accumulated Amortization |
Net |
||||||||||||
| Patents, trademarks, and technology | $ | 427.0 | $ | 144.5 | $ | 282.5 | $ | 57.8 | $ | 28.0 | $ | 29.8 | ||||||
| Licenses and other agreements | 18.3 | 9.5 | 8.8 | 15.8 | 7.5 | 8.3 | ||||||||||||
| Non-compete agreements | 49.6 | 38.5 | 11.1 | — | — | — | ||||||||||||
| Other intangibles | 16.8 | 2.4 | 14.4 | 2.2 | 0.7 | 1.5 | ||||||||||||
| Total | $ | 511.7 | $ | 194.9 | $ | 316.8 | $ | 75.8 | $ | 36.2 | $ | 39.6 | ||||||
Amortization expense was $32.0 million, $6.4 million and $7.3 million for the years ended December 31, 2003, 2002 and 2001, respectively. Estimated future amortization expense for intangible assets over the next five years is as follows (dollars in millions):
| Year ending December 31: | ||||
| 2004 | $ | 31 | ||
| 2005 | 31 | |||
| 2006 | 28 | |||
| 2007 | 26 | |||
| 2008 | 26 | |||
F-65
7. Other Noncurrent Assets
Other noncurrent assets consist of the following (dollars in millions):
| |
December 31, 2003 |
December 31, 2002 |
||||
|---|---|---|---|---|---|---|
| Prepaid pension assets | $ | 254.4 | $ | — | ||
| Debt issuance costs | 105.9 | 6.9 | ||||
| Capitalized turnaround expense | 83.9 | 11.8 | ||||
| Spare parts inventory | 100.5 | 43.1 | ||||
| Other noncurrent assets | 68.3 | 47.6 | ||||
| Total | $ | 613.0 | $ | 109.4 | ||
8. Accrued Liabilities
Accrued liabilities consist of the following (dollars in millions):
| |
December 31, 2003 |
December 31, 2002 |
||||
|---|---|---|---|---|---|---|
| Payroll, severance and related costs | $ | 150.1 | $ | 49.9 | ||
| Interest | 121.4 | 19.9 | ||||
| Volume and rebates accruals | 89.5 | 20.8 | ||||
| Income taxes | 53.0 | 8.1 | ||||
| Taxes (property and VAT) | 63.3 | 21.1 | ||||
| Pension liabilities | 21.3 | 21.1 | ||||
| Restructuring and plant closing costs | 74.1 | 7.8 | ||||
| Environmental accruals | 8.6 | 4.8 | ||||
| Interest and commodity hedging accruals | 11.3 | — | ||||
| Other miscellaneous accruals | 109.4 | 46.8 | ||||
| Total | $ | 702.0 | $ | 200.3 | ||
9. Other Noncurrent Liabilities
Other noncurrent liabilities consist of the following (dollars in millions):
| |
December 31, 2003 |
December 31, 2002 |
||||
|---|---|---|---|---|---|---|
| Pension liabilities | $ | 345.3 | $ | 102.0 | ||
| Other postretirement benefits | 86.3 | 61.9 | ||||
| Environmental accruals | 26.3 | 13.5 | ||||
| Other post retirement benefit of unconsolidated affiliate | 29.1 | — | ||||
| Restructuring and plant closing costs | 2.7 | — | ||||
| Fair value of interest derivatives | 9.5 | 20.5 | ||||
| Other noncurrent liabilities | 85.5 | 36.4 | ||||
| Total | $ | 584.7 | $ | 234.3 | ||
F-66
10. Restructuring, Plant Closing and Impairment Costs
2003 Restructuring Charges
On March 11, 2003 (before HIH was consolidated into the Company), the Polyurethanes segment announced that it would integrate its global flexible products unit into its urethane specialties unit, and recorded a restructuring charge of $19.2 million for workforce reductions of approximately 118 employees. During the remainder of the year, charges of $8.9 million were taken for workforce reductions relating to this restructuring at the Rozenberg, Netherlands site.
In June 2003, the Company announced that its Performance Products segment would close a number of plants at its Whitehaven, U.K. facility and recorded a charge of $20.1 million in the second quarter 2003. This charge represents $11.4 million relating to an impairment of assets at Whitehaven (in connection with the plant shutdowns) and $8.7 million of workforce reduction costs. The Company also recorded a $2.0 million charge in respect of severance costs arising from the closure of an administrative office in London, U.K., the rationalization of our surfactants technical center in Oldbury, U.K., and the restructuring of our facility in Barcelona, Spain. These charges are part of an overall cost reduction program for this segment that is expected to be implemented from 2003 to 2005.
In August 2003, the Company recorded a restructuring charge of $6.5 million related to workforce reductions of approximately 63 employees across its global Pigments operations. The overall cost reduction program to be completed from 2003 to 2005 for the Pigments segment will involve 250 employees and is estimated to cost an additional $16.5 million. At December 31, 2003, $4.3 million remains in the reserve for restructuring and plant closing costs related to these restructuring activities.
In connection with the AdMat Transaction, the Company is implementing a substantial cost reduction program. The program will include reductions in costs of the Company's global supply chain, reductions in general and administrative costs across the business and the centralization of operations where efficiencies may be achieved. The cost reduction program is expected to be implemented from June 2003 to June 2005 and is estimated to involve $60.8 million in total restructuring costs. As part of the program, the Company expects to incur approximately $53.2 million to reduce headcount and to incur approximately $7.6 million to close plants and discontinue certain service contracts worldwide. The Company reduced 188 staff in the six months ended December 31 2003. Payments of restructuring and plant closing costs were recorded against reserves established in connection with recording the AdMat Transaction as a purchase business combination. At December 31, 2003, $51.5 million remains in the reserve for restructuring and plant closing costs related to the cost reduction program. The Company expects to finalize its restructuring plans by June 30, 2004. Accordingly, the reserve for restructuring and plant closing costs are subject to revision based on final assessment.
2002 Restructuring Charges
During 2002, the Company announced that it would be closing certain units at its Jefferson County and Canadian plants, primarily in the Performance Products business. As a result, the Company recorded accrued severance and shutdown costs of $4.3 million substantially all of which had not been paid at December 31, 2002. The net effect of 2002 unit closing costs and the reversal of restructuring charges discussed in "—2001 Restructuring Activities" below is to reflect $1.0 million in income in 2002 and to reflect a $7.8 million accrual at December 31, 2002.
F-67
2001 Restructuring Charges
During 2001, the Company initiated a restructuring plan closing certain manufacturing units and eliminating sales and administrative positions. In addition, the Company recorded an asset impairment charge related to fixed assets and goodwill. The restructuring charge, which was recorded in several phases during the year, included the closure of a styrene production unit located in Odessa, Texas, the closure of the polypropylene Line 1 unit located in Odessa, Texas (which represents approximately 30% of the Odessa facility's current total capacity), the write off of the flexible polyolefins unit located in Odessa, Texas which was under evaluation for alternative product use and the write off of the manufacturing facility in Austin, Texas. The total write off of property, plant and equipment as a result of the closures was $102.6 million.
In connection with the closures, the Company recorded accruals for decommissioning costs, non-cancelable lease charges and provided for the write off of unusable material and supplies inventory. The Company also wrote off $33.8 million of goodwill related to the closures.
As a result of the plant closings and the elimination of redundant costs in the maintenance, technical services and overhead cost structure, approximately $44.2 million was accrued for severance, fringe benefits and outplacement costs. The program resulted in a workforce reduction of approximately 800 manufacturing, sales, general and administrative and technical employees. The restructuring plan was substantially completed by the second quarter of 2002.
Under SFAS No. 121, "Accounting for the Impairment of Long-Lived Assets and for Long-Lived Assets to be Disposed Of," companies must review the carrying amount of long-lived assets and certain intangibles, including related goodwill, whenever events or changes in circumstances indicate that the carrying amount of an asset or a group of assets may not be recoverable.
The Company recorded an asset impairment charge of $385.4 million in the fourth quarter of 2001 related to its property, plant and equipment of the Polymers segment. During 2001, the Polymers segment experienced significant declines in sales prices and operating cash flow. The declining results were primarily due to lower sales prices, coupled with difficulty in passing on raw material and energy costs to customers. The lower sales prices were primarily due to decreased demand in industrial and consumer related applications, which resulted in increased competition and reduced operating rates. In early October 2001, as a result of the above factors and as part of the Company's restructuring efforts, the Company performed a review of its remaining polyethylene, polypropylene and amorphous polyalphaolefin businesses. During this time, the Company engaged a financial advisor and investment banker to assist it and its domestic subsidiaries in identifying and exploring strategic alternatives, including developing out of court or court sanctioned financial restructuring plans. In February 2002, the financial advisor provided a valuation report to the Company's management, which indicated an impairment of Polymers' assets. As a result, in the fourth quarter of 2001 it became necessary to assess Polymers' fixed assets for impairment as required under SFAS No. 121.
The Company performed an evaluation of the recoverability of all the assets of Polymers' business as described in SFAS No. 121. Management concluded from the results of this evaluation that a significant impairment of long-lived assets had occurred. An impairment charge was required because the estimated fair value of these assets was less than their carrying value. The fair value of Polymers' net assets was determined by discounting estimated future cash flows using a discount rate commensurate with the risks involved. Fair value estimates, by their very nature, rely upon considerable management judgment; accordingly, actual results may vary significantly from the Company's estimates.
F-68
The Company's revised restructuring costs and impairment charges have been recorded against the following accounts: $488.0 million against property, plant and equipment; $33.8 million against goodwill; $6.4 million against inventories; and $55.0 million against cash and accrued liabilities.
As of December 31, 2002, accrued restructuring and plant closing costs consist of the following (dollars in millions):
| |
2001 Total Charge |
2002 Restructuring charges (revisions) |
Total Revised Charge |
Non-cash Charges |
Total Cash Payments |
Restructuring liabilities December 31, 2002 |
||||||||||||
|---|---|---|---|---|---|---|---|---|---|---|---|---|---|---|---|---|---|---|
| Work force reduction | $ | 44.2 | $ | 1.6 | $ | 45.8 | $ | — | $ | 41.9 | $ | 3.9 | ||||||
| Plant decomissioning and demolition | 2.8 | 3.7 | 6.5 | — | 3.2 | 3.3 | ||||||||||||
| Non-cancelable lease costs | 6.9 | (4.6 | ) | 2.3 | — | 1.7 | 0.6 | |||||||||||
| Property, plant and equipment | 488.0 | — | 488.0 | 488.0 | — | — | ||||||||||||
| Goodwill | 33.8 | — | 33.8 | 33.8 | — | — | ||||||||||||
| Inventories | 12.0 | (1.7 | ) | 10.3 | 6.4 | 3.9 | — | |||||||||||
| Other charges | 0.8 | — | 0.8 | — | 0.8 | — | ||||||||||||
| Total restructuring costs | $ | 588.5 | $ | (1.0 | ) | $ | 587.5 | $ | 528.2 | $ | 51.5 | $ | 7.8 | |||||
F-69
As of December 31, 2003, accrued restructuring and plant closing costs consist of the following (dollars in millions):
| |
Accrued liabilities as of December 31, 2002 |
HIH charges prior to May 1, 2003(1) |
AdMat charges as of June 30, 2003(2) |
2003 charge |
Non-cash portion |
Cash payments |
Accrued liabilities as of December 31, 2003 |
|||||||||||||||
|---|---|---|---|---|---|---|---|---|---|---|---|---|---|---|---|---|---|---|---|---|---|---|
| Huntsman International | ||||||||||||||||||||||
| Property, plant and equipment | $ | — | $ | — | $ | — | $ | 11.4 | $ | (11.4 | ) | $ | — | $ | — | |||||||
| Workforce reductions | — | 24.2 | — | 28.2 | — | (29.9 | ) | 22.5 | ||||||||||||||
| — | 24.2 | — | 39.6 | (11.4 | ) | (29.9 | ) | 22.5 | ||||||||||||||
| Huntsman LLC | ||||||||||||||||||||||
| Property, plant and equipment | — | — | — | 0.9 | (0.9 | ) | — | — | ||||||||||||||
| Plant decommisioning and demolition | 3.3 | — | — | (0.3 | ) | — | (0.4 | ) | 2.6 | |||||||||||||
| Non-cancelable lease costs | 0.6 | — | — | (0.2 | ) | — | (0.2 | ) | 0.2 | |||||||||||||
| Workforce reductions | 3.9 | — | — | (2.1 | ) | — | (1.8 | ) | — | |||||||||||||
| Other | — | — | — | — | — | — | — | |||||||||||||||
| 7.8 | — | — | (1.7 | ) | (0.9 | ) | (2.4 | ) | 2.8 | |||||||||||||
| AdMat | ||||||||||||||||||||||
| Property, plant and equipment | — | — | 1.5 | — | — | — | 1.5 | |||||||||||||||
| Workforce reductions | — | — | 53.2 | — | — | (9.3 | ) | 43.9 | ||||||||||||||
| Other | — | — | 6.1 | — | — | — | 6.1 | |||||||||||||||
| — | — | 60.8 | — | — | (9.3 | ) | 51.5 | |||||||||||||||
| Total | $ | 7.8 | $ | 24.2 | $ | 60.8 | $ | 37.9 | $ | (12.3 | ) | $ | (41.6 | ) | $ | 76.8 | ||||||
11. Securitization of Accounts Receivable
HI Accounts Receivable Securitization Program
On December 21, 2000, HI initiated an accounts receivable securitization program under which it grants an undivided interest in certain of its trade receivables to a qualified off-balance sheet entity (the "Receivables Trust") at a discount. This undivided interest serves as security for the issuance of commercial paper and medium term notes by the Receivables Trust. The following discussion of the HI accounts receivable securitization program covers the eight month period from the effective date of the HIH Consolidation Transaction.
At December 31, 2003, the Receivables Trust had approximately $198 million in U.S. dollar equivalents in medium term notes outstanding and approximately $100 million in commercial paper outstanding. Under the terms of the agreements, HI and its subsidiaries continue to service the
F-70
receivables in exchange for a 1% fee of the outstanding receivables, and HI is subject to recourse provisions.
HI's retained interest in receivables (including servicing assets) subject to the program was approximately $154 million as of December 31, 2003. The value of the retained interest is subject to credit and interest rate risk. For the eight months ended December 31, 2003, new sales totaled approximately $2,773 million and cash collections reinvested totaled approximately $2,794 million, respectively. Servicing fees received during 2003 were approximately $3.4 million.
HI incurs losses on the accounts receivable securitization program for the discount on receivables sold into the program and fees and expenses associated with the program. HI also retains responsibility for the economic gains and losses on forward contracts mandated by the terms of the program to hedge the currency exposures on the collateral supporting the off-balance sheet debt issued. Gains and losses on forward contracts are a loss of $13.8 million for the eight months ended December 31, 2003. As of December 31, 2003, the fair value of the open forward currency contracts is $6.8 million which is included as a component of the residual interest.
The key economic assumptions used in valuing the residual interest at December 31, 2003 are presented below:
| Weighted average life (in months) | 3 | ||
| Credit losses (annual rate) | Less than 1 | % | |
| Discount rate (annual rate) | 2 | % |
A 10% and 20% adverse change in any of the key economic assumptions would not have a material impact on the fair value of the retained interest. Total receivables over 60 days past due as of December 31, 2003 were $15.6 million.
Huntsman LLC Accounts Receivable Securitization Program
Huntsman LLC formerly had an accounts receivable agreement with Windmill Funding Corporation ("Windmill") and ABN-AMRO Bank under which it had the right to sell trade accounts receivable of certain subsidiaries to Windmill on a continuing basis subject to limited recourse. Receivables sold under the terms of the agreement were removed from Huntsman LLC's consolidated financial statements at the time of sale. Huntsman LLC retained certain receivables as additional collateral to ABN-AMRO Bank. Huntsman LLC serviced the trade receivables it had sold to Windmill. The fair value of the retained servicing interest approximated cost due to the short term nature of the receivables. The weighted average life of the receivables was approximately two months and credit losses were expected to be less than 1%. The Company recorded a loss on the sale of receivables of $5.9 million for the year ended December 31, 2001.
In December 2001, Huntsman LLC terminated the agreement with Windmill and ABN-AMRO Bank, and it repurchased the outstanding receivables balance of $73.7 million.
F-71
12. Long-Term Debt
Long-term debt outstanding as of December 31, 2003 and December 31, 2002 is as follows (dollars in millions):
| |
December 31, 2003 |
December 31, 2002 |
||||||
|---|---|---|---|---|---|---|---|---|
| Huntsman LLC Debt, excluding HIH and HI: | ||||||||
| Senior secured credit facilities: | ||||||||
| Term Loan A | $ | 606.3 | $ | 938.0 | ||||
| Term Loan B | 459.0 | 450.0 | ||||||
| Revolving facility | 12.2 | 32.1 | ||||||
| Other debt: | ||||||||
| Huntsman LLC senior secured notes | 450.5 | — | ||||||
| Huntsman Polymers senior unsecured notes | 36.8 | 36.8 | ||||||
| Huntsman LLC senior subordinated fixed rate notes | 44.2 | 44.2 | ||||||
| Huntsman LLC senior subordinated floating rate notes | 15.1 | 15.1 | ||||||
| Huntsman Specialty Chemicals Corporation subordinated note | 99.7 | 98.1 | ||||||
| Huntsman Australia Holdings Corporation (HAHC) credit facilities | 44.5 | 38.9 | ||||||
| Huntsman Chemical Company Australia (HCCA) credit facilities | 48.7 | 36.6 | ||||||
| Subordinated note and accrued interest—affiliate | 35.5 | 30.9 | ||||||
| Term note payable to a bank | 9.5 | 10.4 | ||||||
| Other | 5.6 | 5.0 | ||||||
| Total Huntsman LLC Debt, excluding HIH and HI | 1,867.6 | 1,736.1 | ||||||
HI: |
||||||||
| Senior secured credit facilities: | ||||||||
| Term B loan | 620.1 | — | ||||||
| Term C loan | 620.1 | — | ||||||
| Revolving facility | 22.0 | — | ||||||
| Other debt: | ||||||||
| Senior unsecured notes | 457.1 | — | ||||||
| Senior subordinated notes | 1,169.8 | — | ||||||
| Other long-term debt | 38.0 | — | ||||||
| Total HI debt | 2,927.1 | — | ||||||
HIH: |
||||||||
| Senior discount notes | 434.6 | — | ||||||
| Senior subordinated discount notes—affiliate | 358.3 | — | ||||||
| Total HIH debt | 792.9 | — | ||||||
| Total HIH consolidated debt | 3,720.0 | — | ||||||
AdMat: |
||||||||
| Senior secured notes | 348.2 | — | ||||||
| Other long-term debt | 3.2 | — | ||||||
| Total AdMat debt | 351.4 | — | ||||||
HMP: |
||||||||
| HMP Senior Secured Notes (Principal amount $464.9)(1) | 329.4 | — | ||||||
| Total HMP debt | 329.4 | — | ||||||
| Elimination of HIH Senior subordinated discount notes owned by HMP | (358.3 | ) | — | |||||
| Total debt | $ | 5,910.1 | $ | 1,736.1 | ||||
| Current portion | $ | 137.1 | $ | 63.8 | ||||
| Long-term portion | 5,737.5 | 1,641.4 | ||||||
| Total long-term debt—excluding affiliate | 5,874.6 | 1,705.2 | ||||||
| Long-term debt—affiliate | 35.5 | 30.9 | ||||||
| Total debt | $ | 5,910.1 | $ | 1,736.1 | ||||
F-72
HMP Equity Holdings Corporation Debt (excluding Huntsman LLC, HI, HIH and AdMat)
On May 9, 2003, HMP issued units consisting of 15% senior secured discount notes due 2008 (the "HMP Senior Discount Notes") with an accreted value of $423.5 million and 875,000 warrants to purchase approximately 12% of HMP's common stock. Of the $423.5 million, $8.5 million was recorded to reflect a discount of 2%, $285.0 million has been recorded as the initial carrying value for the HMP Senior Discount Notes and $130.0 million was recorded as the carrying value of the warrants. The HMP Senior Discount Notes were issued with original issue discount for U.S. federal income tax purposes. The aggregate proceeds from the units were allocated to the HMP Senior Discount Notes and warrants based upon the relative fair value of each security. Interest on the HMP Senior Discount Notes is paid in kind. As of December 31, 2003 payment in kind interest of $40.4 and accretion of the discount of $3.9 million has been added to the original amount of $285.0 million. The effective interest rate based on the carrying amount at December 31, 2003 was 23.7%. The HMP Senior Discount Notes are secured by a first priority lien on the HIH Senior Subordinated Discount Notes, the 10% direct and 30% indirect equity interests held by HMP in HIH, HMP's common stock outstanding as of May 9, 2003, and HMP's equity interests in Huntsman LLC. The HMP Senior Discount Notes are redeemable beginning November 15, 2004 at stipulated redemption prices declining from 107.5% to 100% of accreted value by May 15, 2007. The HMP Senior Discount Notes contain certain restrictions including limits on the incurrence of debt, restricted payments, liens, transactions with affiliates, and merger and sales of assets. Management believes that HMP is in compliance with the covenants of the HMP Senior Discount Notes as of December 31, 2003.
875,000 warrants were issued in connection with the 15% senior secured discount notes, each of which entitles the holder of each to purchase 2.8094 shares of HMP common stock for an exercise price of $0.01 per share. The aggregate number of shares issueable is 2,458,257. The warrants expire on May 15, 2011. The warrants are not exercisable until the earlier of: certain initial public offerings of HMP or the Company; the occurrence of an event of default or change of control under, or the redemption, repayment or defeasance of the HMP Senior Discount Notes; any merger or consolidation of the HMP's parent companies; the sale of substantially all of the HMP's assets; or November 15, 2004. In certain events HMP has the right to require the holders of the warrants to exercise or exchange them for other equity securities. The warrants became separately transferable from the HMP Senior Discount Notes 180 days after issuance on May 9, 2003.
On December 23, 2003, HMP repurchased 14,145 warrants at a value of $1.3 million. The transaction was recorded as a reduction of warrants in the consolidated balance sheet.
Subsidiary Debt
The Company's three principal operating subsidiaries are separately financed, their debt is non-recourse to the Company and the Company has no contractual obligations to fund its respective operations. Moreover, notwithstanding that HIH is consolidated with HLLC for financial accounting purposes, HLLC is financed separately from HIH, HIH's debt is non-recourse to HLLC and HLLC has no contractual obligation to fund HIH's operations. AdMat is also financed separately from Huntsman LLC and HIH, Huntsman LLC and HIH's debt is non-recourse to AdMat and AdMat has no contractual obligation to fund Huntsman LLC or HIH's operations. The following is a discussion of the debt and liquidity of the Company's three primary subsidiaries.
Huntsman LLC Debt (Excluding HI and HIH). Senior Secured Credit Facilities (HLLC Credit Facilities). Huntsman LLC's senior secured credit facilities (the "HLLC Credit Facilities") consist of a
F-73
$275 million revolving credit facility maturing in 2006 (the "HLLC Revolving Facility") and two term loan facilities maturing in 2007, initially in the amount of $938 million ("HLLC Term Loan A") and $450 million ("HLLC Term Loan B" and, collectively with HLLC Term Loan A, the "HLLC Term Facilities"). On May 31, 2003, the principal amount of HLLC Term Loan B was increased to $459 million; the additional $9 million was a supplemental fee imposed because $350 million of HLLC Term Loan B was not repaid on May 31, 2003. The HLLC Revolving Facility is secured by a first lien on substantially all the assets of Huntsman LLC, HSCHC, Huntsman Specialty and Huntsman LLC's domestic restricted subsidiaries, which does not include HIH or HI. The HLLC Term Facilities are secured by a second lien on substantially the same assets that secure the HLLC Revolving Facility. The HLLC Credit Facilities are also guaranteed by HSCHC and Huntsman Specialty and by Huntsman LLC's domestic restricted subsidiaries (collectively, the "HLLC Guarantors"). Neither HIH nor HI are HLLC Guarantors. As of December 31, 2003 and December 31, 2002, the weighted average interest rates on the HLLC Credit Facilities were 7.28% and 6.55%, respectively, excluding the impact of interest rate hedges.
The HLLC Revolving Facility is subject to a borrowing base of accounts receivable and inventory and is available for general corporate purposes. Borrowings under the HLLC Revolving Facility bear interest, at Huntsman LLC's option, at a rate equal to (i) a LIBOR-based eurocurrency rate plus an applicable margin ranging from 2.75% to 3.50% as based on the Huntsman LLC's most recent ratio of total debt to "EBITDA," as defined, or (ii) a prime-based rate plus an applicable margin ranging from 1.75% to 2.50%, also based on Huntsman LLC's most recent ratio of total debt to EBITDA.
As of December 31, 2003, borrowings under the HLLC Term Facilities bear interest, at Huntsman LLC's option, at a rate equal to (i) a LIBOR-based eurocurrency rate plus an applicable margin of 4.75% and 7.75% for HLLC Term Loan A and HLLC Term Loan B, respectively, or (ii) a prime-based rate plus an applicable margin of 3.75% and 6.75% for HLLC Term Loan A and HLLC Term Loan B, respectively. This agreement also provides for quarterly escalating interest rates on HLLC Term Loan B of up to maximum LIBOR and prime based margins of 9.75% and 8.75%, respectively by July 2004.
The HLLC Credit Facilities contain financial covenants including a minimum interest coverage ratio, a minimum fixed charge ratio and maximum debt to EBITDA ratio, as defined, and limits on capital expenditures, in addition to restrictive covenants customary to financings of these types, including limitations on liens, debt and the sale of assets. Management believes that Huntsman LLC is in compliance with the covenants of the HLLC Credit Facilities as of December 31, 2003.
On April 25, 2003, Huntsman LLC entered into amendments to both the HLLC Revolving Facility and the HLLC Term Facilities that, among other things, amended certain financial covenants through the fourth quarter of 2004. The fixed charge and debt to EBITDA covenants were suspended from the second through fourth quarters of 2003 and a minimum revolver availability covenant of $70 million was adopted through May 15, 2004. Also, in connection with the amendment, Huntsman LLC obtained a waiver from its senior secured lenders to permit a pledge of its equity to secure certain indebtedness issued by the Company. On May 20, 2003, Huntsman LLC entered into amendments to both the HLLC Revolving Facility and the HLLC Term Facilities that, among other things, modified provisions relating to certain mandatory repayments. On September 12, 2003 and on November 20, 2003, Huntsman LLC entered into amendments to the HLLC Credit Facilities that, among other things, permitted it to issue the 2003 HLLC Secured Notes and to grant security in connection with the 2003 HLLC Secured Notes.
F-74
On October 14, 2004, Huntsman LLC completed a $1.065 billion refinancing of the HLLC Credit Facilities. The new credit facilities consist of a $350 million revolving credit facility due October 2009 and a $715 million term loan B facility due March 2010. Proceeds of the refinancing were used to repay in full the outstanding borrowings under Huntsman LLC's prior senior secured credit facilities.
Senior Secured Notes (2003 HLLC Secured Notes). On September 30, 2003, Huntsman LLC sold $380 million aggregate principal amount of its 115/8% senior secured notes due 2010 at a discount to yield 117/8% in a private offering. The proceeds from the offering were used to repay $65.0 million on the HLLC Revolving Facility, without reducing commitments, and $296.6 million on HLLC Term Loan A. On December 3, 2003, Huntsman LLC sold an additional $75.4 million aggregate principal amount of its 115/8% senior secured notes due 2010 (collectively with the notes sold in the September 2003 offering, the "2003 HLLC Secured Notes") at a discount to yield 11.72% in a private offering. The proceeds of this offering were used to repay $35.2 million on HLLC Term Loan A. The combined total repayment on HLLC Term Loan A included a prepayment of $165.2 million of scheduled amortization payments in the direct order of maturity such that the next scheduled quarterly amortization payment under the HLLC Credit Facilities is due March 2006. The remaining proceeds of the December 2003 offering were temporarily applied to reduce outstanding borrowings under the HLLC Revolving Facility, and Huntsman LLC, on January 28, 2004, used $37.5 million of the net cash proceeds to redeem the Huntsman Polymers Notes (representing principal of $36.8 million plus accrued interest). The Huntsman Polymers Notes would have been due in December 2004 and were redeemed at 100% of their aggregate principal amount.
The 2003 HLLC Secured Notes bear interest at a rate of 115/8% per annum and interest is payable semi-annually on April 15 and October 15. The 2003 HLLC Secured Notes mature on October 15, 2010 and are secured by a second lien on substantially all the assets of Huntsman LLC, HSCHC, Huntsman Specialty and Huntsman LLC's domestic restricted subsidiaries (which do not include HIH or HI). The 2003 HLLC Secured Notes are effectively subordinated to all Huntsman LLC's obligations under the HLLC Revolving Facility and rank pari passu with the HLLC Term Facilities. The 2003 HLLC Secured Notes are also guaranteed by the HLLC Guarantors. In accordance with Huntsman LLC's contractual obligation to register the 2003 HLLC Secured Notes, Huntsman LLC's registration statement on Form S-4/A filed with the Securities and Exchange Commission became effective on February 13, 2004 and the exchange offer of unregistered 2003 HLLC Secured Notes for registered 2003 HLLC Secured Notes was completed on March 29, 2004.
The 2003 HLLC Secured Notes are redeemable
The indenture governing the 2003 HLLC Secured Notes contains covenants relating to the incurrence of debt, limitations on distributions, asset sales and affiliate transactions, among other things. The indenture also requires Huntsman LLC to offer to repurchase the 2003 HLLC Secured Notes upon a change of control. Management believes that Huntsman LLC is in compliance with the covenants of the 2003 HLLC Secured Notes as of December 31, 2003.
F-75
Senior Subordinated Fixed and Floating Rate Notes (HLLC Notes) and Huntsman Polymers Senior Unsecured Notes (Huntsman Polymers Notes). Huntsman LLC's 9.5% fixed and variable subordinated notes due 2007 (the "HLLC Notes") with an outstanding principal balance of $59.3 million as of December 31, 2003 are unsecured subordinated obligations of Huntsman LLC and are junior in right of payment to all existing and future secured or unsecured senior indebtedness of Huntsman LLC and effectively junior to any secured indebtedness of Huntsman LLC to the extent of the collateral securing such indebtedness. Interest is payable on the HLLC Notes semiannually on January 1 and July 1 at an annual rate of 9.5% on the fixed rate notes and LIBOR plus 3.25% on the floating rate notes. The HLLC Notes are redeemable at the option of Huntsman LLC after July 2002 at a price declining from 104.75% to 100% of par value as of July 1, 2005. The weighted average interest rate on the floating rate notes was 4.4% and 5.2% as of December 31, 2003 and December 31, 2002, respectively.
The Huntsman Polymers Notes were unsecured senior obligations of Huntsman Polymers; they had an original maturity of December 2004, a fixed rate coupon of 11.75%, and an outstanding balance of $36.8 million as of December 31, 2003. On January 28, 2004, the Huntsman Polymers Notes were redeemed in full.
Prior to the Restructuring completed September 30, 2002, the indentures governing the HLLC Notes and Huntsman Polymers Notes contained certain restrictive covenants. Concurrently with the closing of the Restructuring, previously executed amendments to the indentures became effective and virtually all the restrictive covenants contained in the indentures were eliminated.
Senior Notes (HLLC Senior Notes)
On June 22, 2004 Huntsman LLC sold $300 million of senior unsecured fixed rate notes that bear interest at 11.5% and mature on July 15, 2012 (the "HLLC Unsecured Fixed Rate Notes") and $100 million of senior unsecured floating rate notes that bear interest at a rate equal to LIBOR plus 7.25% and mature on July 15, 2011 (the "HLLC Unsecured Floating Rate Notes," and together with the HLLC Unsecured Fixed Rate Notes, the "HLLC Senior Notes"). The interest rate on the HLLC Unsecured Floating Rate Notes as of September 30, 2004 was 8.80%. The proceeds from the offering were used to repay $362.9 million on Huntsman LLC's prior term loan B and $25 million to repay indebtedness at HCCA. See "Other Debt" below. The HLLC Senior Notes are unsecured obligations of Huntsman LLC and are guaranteed by the HLLC Guarantors.
Other Debt. Huntsman Specialty's subordinated note in the aggregate principal amount of $75.0 million accrued interest until April 15, 2002 at 7% per annum. Pursuant to the note agreement, effective April 15, 2002, all accrued interest was added to the principal of the note for a total principal amount of $106.6 million. Such principal balance will be payable in a single installment on April 15, 2008. Interest has been payable quarterly in cash, commencing July 15, 2002. For financial reporting purposes, the note was initially recorded at its estimated fair value of $58.2 million, based on prevailing market rates as of the effective date. As of December 31, 2003 and December 31, 2002, the unamortized discount on the note is $6.9 million and $8.5 million, respectively.
Certain of Huntsman LLC's Australian subsidiaries maintain credit facilities that are non-recourse to Huntsman LLC. The Australian subsidiaries are currently not in compliance with covenants contained in these credit facilities. The outstanding debt balances of our Australian subsidiaries have been classified in current portion of long-term debt.
F-76
Huntsman Chemical Company Australia Pty. ("HCCA"), a subsidiary that holds Huntsman LLC's Australian styrenics assets, maintains a facility consisting of a term facility and a working capital facility (collectively, the "HCCA Facilities"). The term facility (A$55 million, or $41.2 million) has semiannual scheduled amortization payments with a balloon payment due at maturity in July 2005. The working capital facility (A$10 million, or $7.5 million) is fully drawn and renews annually. Borrowings under the HCCA Facilities bear interest at a base rate plus a spread of 1.25%, plus an additional 0.5% line use fee. As of December 31, 2003, the weighted average interest rate for the HCCA Facilities was 6.7%. The HCCA Facilities are secured by effectively all the assets of HCCA, including a floating lien on inventory and receivables. As of December 31, 2003, there were no financial covenants in place. Such covenants were being negotiated. HCCA failed to make its semiannual scheduled amortization payments of A$5 million (approximately $3.7 million) each due in July 2003 and January 2004 under its term facility. On August 31, 2004, HCCA refinanced the HCCA Facilities with a A$30.0 million ($21.4 million) revolving credit line supported by a borrowing base of eligible accounts receivable.
Huntsman Australia Holdings Corporation ("HAHC") and certain of its subsidiaries hold Huntsman LLC's Australian surfactants assets. HAHC and certain of its subsidiaries are parties to credit facilities established in December 1998 (the "HAHC Facilities"). As of December 31, 2003, borrowings under the HAHC Facilities total A$59.5 million, or $44.5 million, and bear interest at a base rate plus a spread of 2%. As of December 31, 2003 the weighted average interest rate for the HAHC Facilities was 6.9%. Principal payments are due semiannually through December 2005. The HAHC Facilities are collateralized by effectively all of the assets of the HAHC subsidiaries in addition to a U.S. stock pledge of the shares of one of its U.S. subsidiaries. The HAHC Facilities are subject to financial covenants, including leverage ratio, interest coverage ratio and limits on capital expenditures, in addition to restrictive covenants customary to financings of this type, including limitations on liens, debt and the sale of assets. As of December 31, 2003, HAHC was current on all scheduled amortization and interest payments under the HAHC Facilities but was not in compliance with certain financial covenants in the agreements governing the HAHC Facilities. On August 31, 2004, Huntsman Corporation Australia Pty Ltd ("HCA"), an indirect subsidiary of HAHC, refinanced the secured credit facility of HAHC with a A$30.0 million ($21.4 million) revolving credit line supported by a borrowing base of eligible accounts receivable and inventory, and a A$44.0 million ($31.4 million) term facility.
On July 2, 2001, Huntsman LLC entered into a 15% note payable with an affiliated entity in the amount of $25.0 million. The note is due and payable on the earlier of the tenth anniversary of the issuance date or the date of the repayment in full in cash of all indebtedness of Huntsman LLC under its senior secured credit facilities. Interest is not paid in cash, but is accrued at a designated rate of 15% per annum, compounded annually. As of December 31, 2003 and December 31, 2002, accrued interest added to the principal balance was $10.5 million and $5.9 million, respectively.
HI Debt. The HIH and HI debt transactions and balances prior to the HIH Consolidation Transaction, effective May 1, 2003, are not included in the accompanying financial statements.
Senior Secured Credit Facilities (HI Credit Facilities). As of December 31, 2003, HI had senior secured credit facilities (the "HI Credit Facilities") which consisted of a revolving loan facility of up to $400 million that matures on June 30, 2005 (the "HI Revolving Facility"), a term B loan facility that matures on June 30, 2007, and a term C loan facility that matures on June 30, 2008. On October 22, 2003, HI issued $205 million of additional term B and term C loans, the net proceeds of which were applied to pay down HI's revolving loan facility by approximately $53 million, and the remainder of the
F-77
net proceeds, net of fees, were applied to repay, in full, the term A loan which had an initial maturity of June 2005.
Interest rates for the HI Credit Facilities are based upon, at HI's option, either a eurocurrency rate (LIBOR) or a base rate (prime) plus the applicable spread. The applicable spreads vary based on a pricing grid, in the case of eurocurrency based loans, from 1.50% to 4.50% per annum depending on the loan facility and whether specified conditions have been satisfied, and, in the case of base rate loans, from 0.25% to 3.25% per annum. As of December 31, 2003 and December 31, 2002, the average interest rates on the HI Credit Facilities were 5.6% and 5.8%, respectively, excluding the impact of interest rate hedges.
HI's obligations under the HI Credit Facilities are supported by guarantees of HIH and HI's domestic and certain foreign subsidiaries (collectively, the "HI Guarantors") and HIH, as well as pledges of substantially all their assets, including 65% of the voting stock of certain non-U.S. subsidiaries. Neither Huntsman LLC nor any member of its restricted group is an HI Guarantor.
The HI Credit Facilities contain covenants relating to incurrence of debt, purchase and sale of assets, limitations on investments, affiliate transactions, change in control provisions and maintenance of certain financial ratios. The financial covenants include a leverage ratio, interest coverage ratio, minimum consolidated net worth level and a limit on capital expenditures. The HI Credit Facilities also limit the payment of dividends generally to the amount required by the members to pay income taxes. Management believes that, as of December 31, 2003, HI is in compliance with the covenants of the HI Credit Facilities.
On July 13, 2004, HI amended and restated the HI Credit Facilities. In connection with this amendment and restatement, HI raised approximately $126.6 million of net proceeds from the issuance of additional term loan borrowings, of which $82.4 million was applied to repay all outstanding borrowings on the HI Revolving Facility and the balance, net of fees, increased cash and cash equivalents. The amendment and restatement reduced the revolving loan facility from $400.0 million to $375.0 million, maturing September 2008, and also provided for, among other things, changes to the applicable interest rate spreads, the amendment of certain financial covenants, including changes to the maximum leverage ratio, the minimum interest coverage ratio, and an increase in the permitted amount of annual consolidated capital expenditures.
Senior Unsecured Notes (HI Senior Notes). In March 2002, HI issued $300 million 9.875% senior notes (collectively with the 2003 HI Senior Notes, the "HI Senior Notes"). Interest on the HI Senior Notes is payable semi-annually and the HI Senior Notes mature on March 1, 2009. The HI Senior Notes are fully and unconditionally guaranteed on a joint and several basis by the HI Guarantors. The HI Senior Notes are redeemable, in whole or in part, at any time by HI on or prior to March 1, 2006 at 100% of the face value plus a "make whole" premium, as defined in the applicable indenture. After March 1, 2006, the HI Senior Notes may be redeemed, in whole or in part, at a redemption price that declines from 104.937% to 100% after March 1, 2008.
On April 11, 2003, HI sold an additional $150 million in aggregate principal amount of 9.875% senior notes due 2009 (the "2003 HI Senior Notes"). The offering was priced at 105.25% plus accrued interest from March 1, 2003. HI used approximately $26 million of the net proceeds to repay part of the revolving portion of the HI Credit Facilities. The balance of the net proceeds was used primarily to
F-78
prepay the next 16 months of scheduled amortization due under the term portion of the HI Credit Facilities.
Senior Subordinated Notes (HI Subordinated Notes). HI also has outstanding $600 million and €450 million 10.125% senior subordinated notes (the "HI Subordinated Notes"). As of December 31, 2003 the aggregate U.S. dollar equivalent of the outstanding HI Subordinated Notes was $1,169.8 million. Interest on the HI Subordinated Notes is payable semi-annually and the HI Subordinated Notes mature on July 1, 2009. The HI Subordinated Notes are fully and unconditionally guaranteed on a joint and several basis by the HI Guarantors. The HI Subordinated Notes are redeemable, in whole or in part, at any time by HI prior to July 1, 2004 at 100% of the face value plus a "make whole" premium, as defined in the applicable indenture. On or after July 1, 2004 the HI Senior Subordinated Notes may be redeemed at 105.063% of the principal amount thereof, declining ratably to par on and after July 1, 2007
The HI Senior Notes and the HI Subordinated Notes contain covenants relating to the incurrence of debt, limitations on distributions, asset sales and affiliate transactions, among other things. They also contain a change of control provision requiring HI to offer to repurchase the HI Senior Notes and the HI Subordinated Notes upon a change of control. Management believes that HI is in compliance with the covenants of the HI Senior Notes and the HI Subordinated Notes as of December 31, 2003.
Other Debt. Included within other debt is debt associated with HI's China MDI project. In January 2003, HI entered into two related joint venture agreements to build MDI production facilities near Shanghai, China. HI owns 70% (a consolidating interest) of one of the joint ventures with Shanghai Chlor-Alkali Chemical Company, Ltd. (the "Chinese Splitting JV").
On September 19, 2003, the Chinese Splitting JV obtained secured financing for the construction of the production facilities. The Chinese Splitting JV obtained term loans for the construction of its plant in the maximum principal amount of approximately $82.4 million, a working capital credit line in the amount of approximately $35.1 million, and a facility for funding VAT payments in the amount of approximately $0.6 million. As of December 31, 2003, there was $5.0 million in total outstanding debt under the working capital facility. The interest rate on the working capital facility is LIBOR plus 48 basis points, and as of December 31, 2003 was 1.7%. The loans are secured by substantially all the assets of the venture and will be repaid in 16 semi-annual installments, beginning no later than June 30, 2007. The financing is non-recourse to both HI and the Company, but will be guaranteed during the construction phase by affiliates of the joint venture, including Huntsman Holdings. Huntsman Holdings unconditionally guarantees 70% of any amounts due and unpaid by the Chinese Splitting JV under the loans described above (except for the VAT facility which is not guaranteed). Huntsman Holdings' guarantees remain in effect until the relevant joint venture has (i) commenced production at least 70% of capacity for at least 30 days, and (ii) achieved a debt service cover ratio of at least 1:1.
Included within accounts payable, HI maintains a $25 million multicurrency overdraft facility for its European subsidiaries (the "European Overdraft Facility"). As of December 31, 2003, HI had approximately $7.5 million outstanding under the European Overdraft Facility. The European Overdraft Facility is used for daily working capital needs.
HIH Debt. Senior Discount Notes and Senior Subordinated Discount Notes (HIH Discount Notes). On June 30, 1999, HIH issued senior discount notes ("HIH Senior Discount Notes") and the
F-79
HIH Senior Subordinated Discount Notes (collectively with the HIH Senior Discount Notes, the "HIH Discount Notes") to ICI with initial stated values of $242.7 million and $265.3 million, respectively. The HIH Discount Notes are due December 31, 2009. Interest on the HIH Discount Notes is paid in kind. The HIH Discount Notes contain limits on the incurrence of debt, restricted payments, liens, transactions with affiliates, and merger and sales of assets. Management believes that HIH is in compliance with the covenants of the HIH Discount Notes as of December 31, 2003.
Interest on the HIH Senior Discount Notes accrues at 13.375% per annum. The HIH Senior Discount Notes are redeemable prior to July 2004 for an amount equal to the net present value of 106.688% of the projected July 1, 2004 accreted value and thereafter at stipulated redemption prices declining to 100% of accreted value in 2007.
The HIH Senior Subordinated Discount Notes had a stated rate of 8% that originally was to reset to a market rate in June 2002 and can be redeemed at 100% of accreted value at any time until June 30, 2004. On December 21, 2001, the terms of the HIH Senior Subordinated Discount Notes were modified, including deferring the reset date until September 2004, at which time the interest rate will reset to a market rate. For financial reporting purposes, the HIH Senior Subordinated Discount Notes were initially recorded at their estimated fair value of $224 million based upon prevailing market rates at June 30, 1999. The modification of the terms resulted in a significant decrease in the present value of the debt and, as a result, the debt was treated effectively as an extinguishment and reissuance of the debt. The debt was recorded using a 16% interest rate, the estimated market rate for the debt as of December 20, 2001.
As of December 31, 2003 and December 31, 2002, the HIH Senior Discount Notes included $191.9 million and $139.1 million of accrued interest, respectively. As of December 31, 2003 and December 31, 2002, the HIH Senior Subordinated Discount Notes included $112.3 million and $83.8 million of accrued interest, respectively, and $19.2 million and $40.2 million of discount, respectively.
In connection with the Restructuring, on September 30, 2002, MatlinPatterson contributed its interest in the HIH Senior Subordinated Discount Notes to the Company. On May 9, 2003, the Company completed the purchase of the HIH Senior Subordinated Discount Notes from ICI. As of December 31, 2003, the HIH Senior Subordinated Discount Notes are held by the Company.
In connection with the restructuring of Huntsman LLC on September 30, 2002, MatlinPatterson contributed its interest in the HIH Senior Subordinated Discount Notes to the Company. On May 9, 2003, the Company completed the purchase of the HIH Senior Subordinated Discount Notes from ICI. As a consequence, the HIH Senior Subordinated Discount Notes are eliminated in consolidation. The difference between the acquisition price and the carrying amount of the HIH Senior Subordinated Discount Notes of $19.5 million has been accounted for as an equity contribution.
AdMat Debt. Senior Secured Revolving Credit Facility. On June 30, 2003, AdMat entered into a senior secured revolving credit facility (the "AdMat Revolving Credit Facility") that provides up to $60 million of borrowing and is secured by a first lien on substantially all of AdMat's assets and those of certain of its subsidiaries. The collateral includes substantially all real property and equipment relating to AdMat's manufacturing plants located at Bergkamen, Germany; Monthey, Switzerland; McIntosh, Alabama; and Duxford, UK. The collateral also includes certain capital stock and intercompany notes of certain subsidiaries of AdMat, and certain other assets, principally including
F-80
inventory and accounts receivable. AdMat's obligations under the AdMat Revolving Credit Facility have been initially guaranteed by AdMat's U.S. subsidiary and certain of its non-U.S. subsidiaries (the "AdMat Guarantors"). The AdMat Revolving Credit Facility lenders are parties to an intercreditor agreement (the "AdMat Intercreditor Agreement") with the holders of the AdMat Senior Secured Notes.
The Revolving Credit Facility matures on June 30, 2007. Interest rates, at AdMat's option, are based upon either a Eurocurrency rate (LIBOR) or a base rate (prime), plus an applicable spread. The applicable spreads vary based on a pricing grid. In the case of the Eurocurrency based loans, spreads range from 3.0% to 4.5% per annum depending on whether specified conditions have been satisfied, and, in the case of base rate loans, from 2.0% to 3.5% per annum. As of December 31, 2003, AdMat had not drawn on the AdMat Revolving Credit Facility, but had approximately $16 million of letters of credit issued and outstanding thereunder.
The AdMat Revolving Credit Facility contains covenants relating to incurrence of additional debt, purchase and sale of assets, limitations on investments, affiliate transactions, change in control and maintenance of certain financial ratios. The financial covenants include a leverage ratio, fixed charge coverage ratio and a limit on capital expenditures. The AdMat Revolving Credit Facility also limits the payment of dividends and distributions generally to the amount required by AdMat's members to pay income taxes. Management believes that AdMat is in compliance with the covenants of the AdMat Revolving Credit Facility As of December 31, 2003.
Senior Secured Notes. In connection with the AdMat Transaction, on June 30, 2003, AdMat issued $250 million in aggregate principal amount of its 11% senior secured notes due 2010 (the "AdMat Fixed Rate Notes") and $100 million in aggregate principal amount of its Senior Secured Floating Rate Notes due 2008 (the "AdMat Floating Rate Notes" and, collectively with the AdMat Fixed Rate Notes, the "AdMat Senior Secured Notes"). The $250 million AdMat Fixed Rate Notes bear a fixed rate of interest of 11%, and the AdMat Floating Rate Notes bear interest at a rate per annum equal to LIBOR plus 8.0%, subject to a floor with respect to LIBOR of 2%. As of December 31, 2003, the interest rate on the AdMat Floating Rate Notes was 10%. Interest on the AdMat Floating Rate Notes resets semi-annually. The $100 million of AdMat Floating Rate Notes were issued with an original issue discount of 2%, or for $98 million. The $2 million discount will be amortized to interest expense over the term of the AdMat Floating Rate Notes. Interest is payable on the AdMat Senior Secured Notes semiannually on January 15 and July 15.
The AdMat Senior Secured Notes are secured by a second lien, subject to the Intercreditor Agreement, on substantially all the assets that secure the AdMat Revolving Credit Facility. The AdMat Senior Secured Notes effectively rank senior in right of payment to all existing and future obligations of AdMat that are unsecured or secured by liens on the collateral junior to the liens securing the AdMat Senior Secured Notes. The AdMat Senior Secured Notes are initially guaranteed on a senior basis by the AdMat Guarantors.
The AdMat Fixed Rate Notes are redeemable on or after July 15, 2007 at AdMat's option at a price declining from 105.5% to 100.0% of par value by the year 2009. The AdMat Floating Rate Notes are redeemable on or after July 15, 2005 at AdMat's option at a price declining from 105.0% to 100.0% of par value by the year 2007. At any time prior to July 15, 2007 for the AdMat Fixed Rate Notes and July 15, 2005 for the AdMat Floating Rate Notes, AdMat may redeem all or part of such
F-81
notes at 100% of their principal amount, plus a "make whole" premium, as defined in the indenture. In addition, AdMat may redeem up to 35% of the aggregate principal amount of the AdMat Senior Secured Notes at a redemption price of 111% of the principal amount thereof with the net cash proceeds of one or more equity offerings, subject to certain conditions and limitations.
The AdMat Senior Secured Notes contain covenants relating to the incurrence of debt, limitations on distributions, asset sales and affiliate transactions, among other things. The AdMat Senior Secured Notes also contain a change of control provision requiring AdMat to offer to repurchase the AdMat Senior Secured Notes upon a change of control. Management believes that AdMat is in compliance with the covenants of the AdMat Senior Secured Notes As of December 31, 2003.
Other Debt. As of December 31, 2003, AdMat also had $3.1 million of other debt outstanding under credit facilities in Brazil and Turkey. These facilities are primarily revolving credit lines that primarily support the working capital needs of the business and the issuance of letters of credit. A portion of the $3.1 million is backed by letters of credit issued and outstanding under the Revolving Credit Facility.
Scheduled Maturities
The scheduled maturities of long-term debt by year at December 31, 2003 are as follows (dollars in millions):
| Year ending December 31: | |||
| 2004 | $ | 137.1 | |
| 2005 | 45.1 | ||
| 2006 | 139.0 | ||
| 2007 | 1,637.3 | ||
| 2008 | 1,131.8 | ||
| Thereafter | 2,819.8 | ||
| Total | $ | 5,910.1 | |
13. Derivative Instruments and Hedging Activities
The Company is exposed to market risks, such as changes in interest rates, foreign exchange rates and commodity pricing risks. From time to time, the Company enters into transactions, including transactions involving derivative instruments, to manage interest rate exposure, but does not currently hedge for movements in commodities or foreign exchange rates. The Company manages interest rate exposure through a program designed to reduce the impact of fluctuations in variable interest rates and to meet the requirements of certain credit agreements.
Through the Company's borrowing activities, it is exposed to interest rate risk. Such risk arises due to the structure of the Company's debt portfolio, including the duration of the portfolio and the mix of fixed and floating interest rates. Actions taken to reduce interest rate risk include managing the mix and rate characteristics of various interest bearing liabilities as well as entering into interest rate swaps, collars and options.
F-82
Interest Rate Hedging
As of December 31, 2003 and 2002, the Company had entered into various types of interest rate contracts to manage its interest rate risk on its long-term debt as indicated below (dollars in millions):
| |
December 31, 2003 |
December 31, 2002 |
||||||
|---|---|---|---|---|---|---|---|---|
| Pay fixed swaps | ||||||||
| Notional amount | $ | 447.5 | $ | 258.9 | ||||
| Fair value (loss) | (14.4 | ) | (20.5 | ) | ||||
| Weighted average pay rate | 5.49 | % | 5.60 | % | ||||
| Maturing | 2004 - 2007 | 2003 - 2007 | ||||||
Interest rate collars |
||||||||
| Notional amount | $ | 150.0 | $ | 14.1 | ||||
| Fair value (loss) | (4.8 | ) | — | |||||
| Weighted average cap rate | 7.00 | % | 6.50 | % | ||||
| Weighted average floor rate | 6.25 | % | 4.50 | % | ||||
| Maturing | 2004 | 2003 | ||||||
The Company purchases both interest rate swaps and interest rate collars to reduce the impact of changes in interest rates on its floating-rate long-term debt. Under interest rate swaps, the Company agrees with other parties to exchange, at specified intervals, the difference between fixed-rate and floating-rate interest amounts calculated by reference to an agreed notional principal amount. The collars entitle the Company to receive from the counterparties (major banks) the amounts, if any, by which the Company's interest payments on certain of its floating-rate borrowings exceed a certain rate, and require the Company to pay to the counterparties (major banks) the amount, if any, by which the Company's interest payments on certain of its floating-rate borrowings are less than a certain rate.
Interest rate contracts with a fair value of $19.2 million and $20.5 million were recorded as a component of other noncurrent liabilities as of December 31, 2003 and December 31, 2002, respectively. The fair value of cash flow hedges and interest rate contracts not designated as hedges are $13.0 million and $6.2 million as of December 31, 2003 and $14.8 million and $5.7 million as of December 31, 2002. The changes in the fair value of cash flow hedges resulted in a $4.8 million decrease in interest expense, a $3.4 million increase in interest expense and a $0.1 million increase in interest expense, and a $12.4 million decrease, a $3.5 million increase and a $9.4 million decrease in other comprehensive income for the year ended December 31, 2003, 2002 and 2001, respectively. The changes in the fair value of interest rate contracts not designated as hedges resulted in a $6.5 million decrease in expense, a $3.5 million increase in interest expense and a $0.9 million increase in expense for the year ended December 31, 2003, 2002 and 2001, respectively.
The Company is exposed to credit losses in the event of nonperformance by a counterparty to the derivative financial instruments. The Company anticipates, however, that the counterparties will be able to fully satisfy obligations under the contracts. Market risk arises from changes in interest rates.
Commodity Price Hedging
As of December 31, 2003, there were no cash flow commodity price hedging contracts recorded in other current assets and other comprehensive income.
F-83
As of December 31, 2003 commodity price hedging contracts designated as fair value hedges are included in the balance sheet as an increase of $0.8 million to other current liabilities and an increase in inventory of $0.5 million.
Commodity price contracts not designated as hedges are reflected in the balance sheet as $0.5 million and $0.3 million in other current assets and liabilities, respectively, as of December 31, 2003.
During the year ended December 31, 2003, the Company recorded an increase of $3.0 million in cost of goods sold related to net gains and losses from settled contracts, net gains and losses in fair value price hedges, and the change in fair value on commodity price hedging contracts not designated as hedges.
Foreign Currency Rate Hedging
The Company may enter into foreign currency derivative instruments to minimize the short-term impact of movements in foreign currency rates. These contracts are not designated as hedges for financial reporting purposes and are recorded at fair value. As of December 31, 2003 and 2002 and for the year ended December 31, 2003 and 2002, the fair value, change in fair value, and realized gains (losses) of outstanding foreign currency rate hedging contracts was not material.
Net Investment Hedging
Currency effects of net investment hedges produced losses of approximately $68.1 million in other comprehensive income (loss) (foreign exchange translation adjustments) for the years ended December 31, 2003. As of December 31, 2003, there was a cumulative net loss of approximately $126.3 million.
14. Operating Leases
The Company leases certain railcars, aircraft, equipment and facilities under long-term lease agreements. The total expense recorded under operating lease agreements in the accompanying consolidated statements of operations is approximately $38.4 million, $36.5 million and $50.0 million for the years ended December 31, 2003, 2002 and 2001, respectively.
Future minimum lease payments under operating leases as of December 31, 2003 are as follows (dollars in millions):
| Year ending December 31: | |||
| 2004 | $ | 44.4 | |
| 2005 | 38.5 | ||
| 2006 | 30.2 | ||
| 2007 | 26.5 | ||
| 2008 | 21.1 | ||
| Thereafter | 111.7 | ||
| $ | 272.4 | ||
F-84
15. Income Taxes
The following is a summary of U.S. and non-U.S. provisions for current and deferred income taxes (dollars in millions) of the Company's subsidiaries:
| |
December 31, 2003 |
December 31, 2002 |
December 31, 2001 |
||||||||
|---|---|---|---|---|---|---|---|---|---|---|---|
| Income tax expense (benefit): | |||||||||||
| U.S. | |||||||||||
| Current | $ | 8.4 | $ | 8.1 | $ | (0.4 | ) | ||||
| Deferred | (12.8 | ) | — | (184.5 | ) | ||||||
| Non-U.S. | |||||||||||
| Current | 26.0 | 0.4 | — | ||||||||
| Deferred | 9.2 | — | — | ||||||||
| Total | $ | 30.8 | $ | 8.5 | $ | (184.9 | ) | ||||
F-85
The following schedule reconciles the differences between the United States federal income taxes at the United States statutory rate to the provision (benefit) for income taxes of the Company's subsidiaries (dollars in millions):
| |
December 31, 2003 |
December 31, 2002 |
December 31, 2001 |
|||||||
|---|---|---|---|---|---|---|---|---|---|---|
| Loss before income tax, minority interests and cumulative effect of accounting changes | $ | (290.5 | ) | $ | (154.6 | ) | $ | (1,040.8 | ) | |
| Expected benefit at U.S. statutory rate of 35% | $ | (101.7 | ) | $ | (54.1 | ) | $ | (364.2 | ) | |
Change resulting from: |
||||||||||
| State taxes net of federal benefit | (5.6 | ) | (4.6 | ) | (31.2 | ) | ||||
| Effect of equity method accounting | 5.2 | 14.9 | 5.2 | |||||||
| Cancellation of indebtedness income | — | 73.8 | — | |||||||
| Disallowance of deductions—Tax authority audits | 3.6 | 22.9 | — | |||||||
| Other—net | 0.9 | 10.6 | (2.3 | ) | ||||||
| IRS exam interest | 3.6 | 4.4 | — | |||||||
| Change in valuation allowance | 124.8 | (59.4 | ) | 207.6 | ||||||
| Total income tax expense (benefit) | $ | 30.8 | $ | 8.5 | $ | (184.9 | ) | |||
The components of (losses) earnings from continuing operations before taxes were as follows (dollars in millions):
| |
December 31, 2003 |
December 31, 2002 |
December 31, 2001 |
||||||||
|---|---|---|---|---|---|---|---|---|---|---|---|
| Loss before income taxes: | |||||||||||
| U.S. | $ | (202.7 | ) | $ | (154.2 | ) | $ | (1,035.6 | ) | ||
| Non-U.S. | (87.8 | ) | (0.4 | ) | (5.2 | ) | |||||
| Total | $ | (290.5 | ) | $ | (154.6 | ) | $ | (1,040.8 | ) | ||
Subsequent to the AdMat Transaction, substantially all non-U.S. operations of AdMat are treated as branches of the Company's subsidiaries for U.S. income tax purposes and are, therefore, subject to both U.S. and non-U.S. income tax. The pre-tax income by jurisdictional location and the preceding analysis of the income tax provision by taxing jurisdiction may, therefore, not be directly related.
F-86
Components of deferred income tax assets and liabilities are as follows (dollars in millions):
| |
December 31, 2003 |
December 31, 2002 |
||||||
|---|---|---|---|---|---|---|---|---|
| Deferred income tax assets: | ||||||||
| Net operating loss and alternative minimum tax credit carryforwards | $ | 1,212.7 | $ | 413.4 | ||||
| Employee benefits | 65.1 | 53.0 | ||||||
| Intangible assets | 148.5 | 26.1 | ||||||
| Other—net | 58.6 | 51.6 | ||||||
| Total | 1,484.9 | 544.1 | ||||||
| Deferred income tax liabilities: | ||||||||
| Tax depreciation in excess of book depreciation | (1,000.9 | ) | (308.6 | ) | ||||
| Other—net | (87.1 | ) | (137.6 | ) | ||||
| Total | (1,088.0 | ) | (446.2 | ) | ||||
| Net deferred tax asset before valuation allowance | 396.9 | 97.9 | ||||||
| Valuation allowance: | ||||||||
| Operations | (603.3 | ) | (83.7 | ) | ||||
| Other comprehensive income | — | (14.2 | ) | |||||
| Net deferred tax liability | $ | (206.4 | ) | $ | — | |||
| Current tax asset | $ | 14.7 | $ | 13.0 | ||||
| Current tax liability | (15.1 | ) | — | |||||
| Non-current tax asset | 28.8 | — | ||||||
| Non-current tax liability | (234.8 | ) | (13.0 | ) | ||||
| Total | $ | (206.4 | ) | $ | — | |||
Huntsman Holdings, LLC is treated as a partnership for U.S. federal income tax purposes and as such is generally not subject to U.S. income tax. Income of the Company is taxed directly to its owners. Income from the Company's subsidiaries is taxed under consolidated corporate income tax rules. These subsidiaries file a U.S. Federal consolidated tax return with HGI as the parent. HGI and all of its U.S. subsidiaries are parties to various tax sharing agreements which generally provide that entities will pay their own tax (as computed on a separate-company basis) and be compensated for the use of tax attributes, including NOLs.
As of December 31, 2003, the Company's subsidiaries had U.S. Federal net operating loss carryforwards ("NOLs") of approximately $1,330 million. The NOLs begin to expire in 2020 and fully expire in 2023. The Company's subsidiaries also had NOLs of approximately $2,231 million in various non-U.S. jurisdictions. While the majority of the non-U.S. NOLs have no expiration date, $282 million have a limited life and begin to expire in 2004. Because substantially all of the AdMat non-U.S. operations are treated as branches of the Company's subsidiaries for U.S. income tax purposes, approximately $10 million of NOLs are reflected in both the U.S. and non-U.S. NOLs.
AdMat's Luxembourg entities have combined tax net operating loss carryforwards of $1,071 million. As of December 31, 2003, there is a valuation allowance of $301 million against the net tax-effected NOLs of $321 million. The Company is currently exploring initiatives that may result in the
F-87
dissolution of these entities. The net operating loss carryforwards of these entities would be lost on dissolution.
The Company's subsidiaries have a valuation allowance against their entire U.S. and a material portion of their non-U.S. net deferred tax assets. The first $34.9 million of the AdMat benefit will be used to reduce intangibles and the remainder will be allocated to the income tax provision on the statement of operations. During the period ended December 31, 2003, the Company's subsidiaries reversed valuation allowances of $0.8 million, which were used to reduce other intangibles. Additionally, included in the deferred tax assets at December 31, 2003 and 2002 is approximately $7.7 million of cumulative tax benefit related to equity transactions which will be credited to stockholder's equity, if and when realized, after the other tax deductions in the carryforwards have been realized.
Certain NOLs of the Company's subsidiaries are subject to the "ownership change" rules of Section 382 of the Internal Revenue Code. The use of NOLs by the Company's subsidiaries is limited in tax periods following the date of the "ownership change." Based upon the existence of significant "built-in" income items, the resulting effect of the "ownership change" rules on the ability to utilize NOLs is not anticipated to be material.
For non-U.S. entities that are not treated as branches for U.S. tax purposes, the Company's subsidiaries do not provide for income taxes or benefits on the undistributed earnings of these subsidiaries as earnings are reinvested and, in the opinion of management, will continue to be reinvested indefinitely. In consideration of the Company's structure, upon distribution of these earnings, certain of the Company's subsidiaries would be subject to both income taxes and withholding taxes in the various international jurisdictions. It is not practical to estimate the amount of taxes that might be payable upon such distributions.
The Company no longer accounts for HIH using the equity method of accounting; effective May 1, 2003 HIH's results of operations are consolidated with the Company's results of operations. For prior periods, the deferred taxes associated with the Company's investment in HIH were presented on the net basis in the investment in HIH. For periods after May 1, 2003, the deferred taxes are presented separately on the net basis differences in the assets of HIH.
F-88
16. Other Comprehensive Income (Loss)
Other comprehensive income consisted of the following (dollars in millions):
| |
December 31, 2003 |
HIH May 1, 2003 |
December 31, 2002 |
December 31, 2001 |
January 1, 2001 |
||||||||||||||||||||
|---|---|---|---|---|---|---|---|---|---|---|---|---|---|---|---|---|---|---|---|---|---|---|---|---|---|
| |
Accumulated income (loss) |
Income (loss) |
Accumulated income (loss) |
Accumulated income (loss) |
Income (loss) |
Accumulated income (loss) |
Income (loss) |
Accumulated income (loss) |
|||||||||||||||||
| Foreign currency translation adjustments (net of net investment hedges) | $ | 168.2 | $ | 193.3 | $ | (13.2 | ) | $ | (11.9 | ) | $ | (8.5 | ) | $ | (3.4 | ) | $ | (2.0 | ) | $ | (1.4 | ) | |||
| Unrealized loss on non-qualified plan investments | 0.6 | 0.6 | — | — | — | — | (2.1 | ) | 2.1 | ||||||||||||||||
| Unrealized loss on derivative instruments | (14.6 | ) | 13.9 | (13.2 | ) | (15.3 | ) | (5.9 | ) | (9.4 | ) | (9.4 | ) | — | |||||||||||
| Cumulative effect of accounting change | (1.1 | ) | — | (1.1 | ) | ||||||||||||||||||||
| Minimum pension liability | (95.5 | ) | 14.0 | (87.5 | ) | (22.0 | ) | (17.2 | ) | (4.8 | ) | (0.8 | ) | (4.0 | ) | ||||||||||
| Minimum pension liability unconsolidated affiliate | (5.6 | ) | (0.2 | ) | (5.4 | ) | |||||||||||||||||||
| Unrealized loss on securities | 0.5 | 3.3 | (2.8 | ) | |||||||||||||||||||||
| Other comprehensive income (loss) of minority interest | (0.5 | ) | (0.5 | ) | — | — | — | — | — | — | |||||||||||||||
| Other comprehensive income (loss) of unconsolidated affiliates | 9.2 | 17.2 | 73.9 | (81.9 | ) | 41.8 | (123.7 | ) | (59.2 | ) | (64.5 | ) | |||||||||||||
| Total | $ | 61.2 | $ | 241.6 | $ | (49.3 | ) | $ | (131.1 | ) | $ | 10.2 | $ | (141.3 | ) | $ | (73.5 | ) | $ | (67.8 | ) | ||||
Items of other comprehensive income have been recorded net of tax, with the exception of income permanently reinvested, based upon the jurisdiction where the income or loss was realized.
17. Preferred Interest, Common Interests, and Tracking Preferred Interests
Preferred Interest
On September 30, 2002, the Company authorized the issuance of 18% cumulative preferred member's interest. The preferred member's interest has a liquidation preference of $395.0 million and is entitled to a cumulative preferred return equal to 18% per annum, compounded annually. The Company has the right to redeem the preferred member's interest after five years, for an amount equal to the unpaid liquidation preference plus any unpaid preferred return. As of December 31, 2003 the accumulated liquidation preference was $481.7 million. The preferred member's interest does not have voting rights. After 10 years, at the option of the preferred member, the preferred member's interest is redeemable for an amount equal to the unpaid liquidation preference plus any unpaid preferred return.
Common Interests
On September 30, 2002, the Company authorized and issued 10,000,000 Class A Common Units and 10,000,000 million Class B Common Units. Both Class A Common Units and Class B Common Units have equal rights in the management of the Company and share ordinary profits and losses equally. There are, however, special provisions governing distributions of proceeds until a certain specified level of proceeds have been distributed after which proceeds are distributed equally.
F-89
On September 30, 2002, the holders of the preferred and common stock in Huntsman LLC contributed their shares for Class B Common Units of Huntsman Holdings and a membership interest in Huntsman Holdings Preferred Member LLC, ("HHPM"). Because the exchange transactions were with related entities, the exchange was recorded at historical carrying values. Concurrent with this exchange, GOP, CPH, and certain affiliated entities, completed additional cash and non-cash capital contributions in exchange for Class A Common Units of Huntsman Holdings and membership interests in HHPM. The members of HHPM then contributed their aggregate membership interests in exchange for the Preferred Member's Interest of Huntsman Holdings. See "Note 1—Description of Business."
Tracking Preferred Interests
On June 30, 2003, the Company authorized and issued four series of tracking preferred interests (Series A, B, C, and D), that track the performance of the AdMat business (collectively, "Tracking Preferred Interests"). The Series A Tracking Preferred Interests have a liquidation preference equal to $128.3 million. The Series B Tracking Preferred Interests have a liquidation preference equal to $77.0 million, reduced by the amount of certain distributions to the holders of certain Class A Common Units. The Series C Tracking Preferred Interests have a liquidation preference equal to $231.0 million. The Series D Tracking Preferred Interests have a liquidation preference equal to $77.0 million, reduced by the amount of certain distributions to the holders of certain Class A Common Units. The Tracking Preferred Interests are not entitled to any return other than their liquidation preferences. The Tracking Preferred Interests do not have voting rights, and may be redeemed by the Company in connection with certain sale transactions for an amount equal to their unpaid liquidation preferences.
18. Employee Benefit Plans
Defined Benefit and Other Postretirement Benefit Plans
The Company sponsors two noncontributory defined benefit pension plans covering substantially all of its domestic employees and a supplemental executive retirement plan, a non-contributory defined benefit plan covering certain key executives. The Company funds the actuarially computed retirement cost accrued. Contributions are intended to provide not only for benefits attributed to service to date but also for those expected to be earned in the future.
The Company also sponsors two unfunded postretirement benefit plans other than pensions, which provide medical and life insurance benefits. In 2003, the health care trend rate used to measure the expected increase in the cost of benefits was assumed to be 10% decreasing to 5% after 2007. If the health care cost trend rate assumptions were increased by 1%, the postretirement benefit obligation as of December 31, 2003 would be increased by $10.6 million. The effect of this change on the sum of the service cost and interest cost would be an increase of $1.3 million. If the health care cost trend rate assumptions were decreased by 1%, the postretirement benefit obligation as of December 31, 2003 would be decreased by $9.3 million. The effect of this change on the sum of the service cost and interest cost would be a decrease of $1.1 million.
F-90
The following table sets forth the funded status of the plans and the amounts recognized in the consolidated balance sheets at December 31, 2003 and 2002 (dollars in millions):
| |
Defined Benefit Plans |
Other Postretirement Benefit Plans |
||||||||||||||||||
|---|---|---|---|---|---|---|---|---|---|---|---|---|---|---|---|---|---|---|---|---|
| |
2003 |
2002 |
2003 |
2002 |
||||||||||||||||
| |
U.S. Plans |
Non-U.S. Plans |
U.S. Plans |
U.S. Plans |
Non-U.S. Plans |
U.S. Plans |
||||||||||||||
| Change in benefit obligation | ||||||||||||||||||||
| Benefit obligation at beginning of year | $ | 337.3 | $ | — | $ | 305.3 | $ | 111.4 | $ | — | $ | 101.6 | ||||||||
| Service cost | 14.2 | 27.2 | 10.5 | 3.3 | — | 2.6 | ||||||||||||||
| Interest cost | 26.0 | 46.6 | 21.8 | 8.2 | 0.2 | 7.2 | ||||||||||||||
| Participant contributions | — | 3.1 | — | — | — | — | ||||||||||||||
| Plan amendments | 0.1 | 0.2 | 0.2 | (16.8 | ) | — | (0.4 | ) | ||||||||||||
| Acquisition of HI | 84.3 | 1,401.1 | — | 16.2 | 3.4 | — | ||||||||||||||
| Exchange rate changes | — | 160.5 | — | — | 0.5 | — | ||||||||||||||
| Other | — | 17.9 | — | — | 0.4 | — | ||||||||||||||
| Curtailments | — | (1.3 | ) | — | — | — | — | |||||||||||||
| Special termination benefits | — | 6.6 | — | — | — | — | ||||||||||||||
| Actuarial (gain)/loss | 41.8 | 26.6 | 15.8 | 26.7 | 0.1 | 10.5 | ||||||||||||||
| Benefits paid | (20.6 | ) | (33.9 | ) | (16.3 | ) | (8.2 | ) | (0.3 | ) | (10.1 | ) | ||||||||
| Benefit obligation at end of year | $ | 483.1 | $ | 1,654.6 | $ | 337.3 | $ | 140.8 | $ | 4.3 | $ | 111.4 | ||||||||
| Change in plan assets | ||||||||||||||||||||
| Fair value of plan assets at beginning of year | $ | 159.6 | $ | — | $ | 182.6 | $ | — | $ | — | $ | — | ||||||||
| Actual return on plan assets | 49.0 | 88.5 | (15.5 | ) | — | |||||||||||||||
| Exchange rate changes | — | 134.2 | — | — | — | — | ||||||||||||||
| Acquisition of HI | — | 1,112.5 | — | — | — | — | ||||||||||||||
| Participant contributions | — | 3.1 | — | — | — | — | ||||||||||||||
| Other | — | 11.8 | — | — | — | — | ||||||||||||||
| Administrative expenses | — | (0.7 | ) | — | — | — | — | |||||||||||||
| Company contributions | 22.1 | 27.7 | 8.8 | 8.2 | 0.3 | 10.1 | ||||||||||||||
| Settlements/Transfers | 47.6 | 2.0 | — | |||||||||||||||||
| Benefits paid | (20.6 | ) | (33.9 | ) | (16.3 | ) | (8.2 | ) | (0.3 | ) | (10.1 | ) | ||||||||
| Fair value of plan assets at end of year | $ | 257.7 | $ | 1,345.2 | $ | 159.6 | $ | — | $ | — | $ | — | ||||||||
| Funded status | ||||||||||||||||||||
| Funded status | $ | (225.4 | ) | $ | (309.4 | ) | $ | (174.1 | ) | $ | (140.8 | ) | $ | (4.2 | ) | $ | (111.4 | ) | ||
| Unrecognized net actuarial (gain)/loss | 98.1 | 426.6 | 73.3 | 77.0 | 1.1 | 51.2 | ||||||||||||||
| Unrecognized prior service cost | 7.5 | 6.4 | 8.4 | (19.7 | ) | — | (2.1 | ) | ||||||||||||
| Unrecognized net transition obligation | 5.0 | 3.9 | 6.1 | — | 0.4 | 0.4 | ||||||||||||||
| Accrued benefit (liability) asset | $ | (114.8 | ) | $ | 127.5 | $ | (86.3 | ) | $ | (83.5 | ) | $ | (2.7 | ) | $ | (61.9 | ) | |||
F-91
| Amounts recognized in balance sheet: | ||||||||||||||||||||
| Accrued benefit cost recognized in accrued liabilities and other noncurrent liabilities | $ | (115.4 | ) | $ | (107.6 | ) | $ | (122.8 | ) | $ | (83.6 | ) | $ | (2.7 | ) | $ | (61.9 | ) | ||
| Prepaid pension cost | 0.6 | 235.1 | 14.5 | — | — | — | ||||||||||||||
| Additional minimum liability | (34.9 | ) | (111.0 | ) | — | — | — | — | ||||||||||||
| Other non-current assets | 12.8 | 6.0 | — | — | — | — | ||||||||||||||
| Accumulated other comprehensive income | 22.1 | 105.0 | 22.0 | — | — | — | ||||||||||||||
| Accrued benefit (liability) asset | $ | (114.8 | ) | $ | 127.5 | $ | (86.3 | ) | $ | (83.6 | ) | $ | (2.7 | ) | $ | (61.9 | ) | |||
Components of the net periodic benefit costs for the years ended December 31, 2003, 2002 and 2001 are as follows (dollars in millions):
| |
Defined Benefit Plans |
Other Postretirement Benefit Plans |
||||||||||||||||||||||
|---|---|---|---|---|---|---|---|---|---|---|---|---|---|---|---|---|---|---|---|---|---|---|---|---|
| |
U.S. plans |
Non U.S. plans |
U.S. plans |
Non U.S. plans |
||||||||||||||||||||
| |
2003 |
2002 |
2001 |
2003 |
2003 |
2002 |
2001 |
2003 |
||||||||||||||||
| Service cost | $ | 14.2 | $ | 10.5 | $ | 12.7 | $ | 27.2 | $ | 3.1 | $ | 2.6 | $ | 2.5 | $ | |||||||||
| Interest cost | 26.0 | 21.8 | 21.1 | 46.6 | 7.9 | 7.2 | 5.8 | 0.2 | ||||||||||||||||
| Expected return on assets | (18.1 | ) | (15.5 | ) | (16.9 | ) | (49.0 | ) | — | — | — | — | ||||||||||||
| Amortization of transition obligation | 1.1 | 1.1 | 1.1 | 0.6 | (0.3 | ) | 0.1 | 0.1 | 0.1 | |||||||||||||||
| Amortization of prior service cost | 0.9 | 0.9 | 1.1 | 0.4 | 2.8 | (0.2 | ) | (0.2 | ) | — | ||||||||||||||
| Amortization of actuarial (gain)/loss | 0.9 | 0.4 | 0.2 | 15.1 | — | 2.0 | 0.8 | 0.0 | ||||||||||||||||
| Net periodic benefit cost | $ | 25.0 | $ | 19.2 | $ | 19.3 | $ | 40.9 | $ | 13.5 | $ | 11.7 | $ | 9.0 | $ | 0.3 | ||||||||
The following assumptions were used in the above calculations:
| |
Defined Benefit Plans |
Other Postretirement Benefit Plans |
||||||||||||||||
|---|---|---|---|---|---|---|---|---|---|---|---|---|---|---|---|---|---|---|
| |
U.S. plans |
Non U.S. plans |
U.S. plans |
Non U.S. plans |
||||||||||||||
| |
2003 |
2002 |
2001 |
2003 |
2003 |
2002 |
2001 |
2003 |
||||||||||
| Weighted-average assumptions as of December 31: | ||||||||||||||||||
| Discount rate | 6.00 | % | 6.75 | % | 7.25 | % | 5.49 | % | 6.00 | % | 6.75 | % | 7.25 | % | 6.25 | % | ||
| Expected return on plan assets | 8.25 | % | 8.25 | % | 9.00 | % | N/A | N/A | N/A | N/A | ||||||||
| Rate of compensation increase | 4.00 | % | 4.00 | % | 4.00 | % | 3.76 | % | 4.00 | % | 4.00 | % | 4.00 | % | 3.76 | % | ||
F-92
The projected benefit obligation, accumulated benefit obligation, and fair value of plan assets for the defined benefit plans with accumulated benefit obligations in excess of plan assets were as follows (dollars in millions):
| |
U.S. plans |
Non U.S. Plans |
|||||||
|---|---|---|---|---|---|---|---|---|---|
| |
2003 |
2002 |
2003 |
||||||
| Projected benefit obligation | $ | 483.1 | $ | 337.3 | $ | 1,654.6 | |||
| Accumulated benefit obligation | 402.6 | 286.0 | 1,370.2 | ||||||
| Fair value of plan assets | 257.7 | 159.6 | 1,345.2 | ||||||
Expected future contributions and benefit payments are as follows for the U.S. plans (dollars in millions):
| |
Defined Benefit Plans |
Other Postretirement Benefit Plans |
|||||
|---|---|---|---|---|---|---|---|
| 2004 expected employer contributions: | |||||||
| To plan trusts | $ | 25.5 | $ | — | |||
| To plan participants | 3.9 | 9.6 | |||||
Expected benefit payments: |
|||||||
| 2004 | 19.3 | 9.6 | |||||
| 2005 | 19.5 | 9.7 | |||||
| 2006 | 20.0 | 9.8 | |||||
| 2007 | 21.3 | 9.7 | |||||
| 2008 | 22.2 | 9.5 | |||||
| 2009-2013 | 140.1 | 47.7 | |||||
The asset allocation for the Company's U.S. pension plans at the end of 2003 and the target allocation for 2004, by asset category, follows. The fair value of plan assets for these plans is $257.8 million at the end of 2003. The expected long term rate of return on these assets was 8.25% in 2003.
| Asset category |
Target Allocation 2004 |
Allocation at December 31, 2003 |
|||
|---|---|---|---|---|---|
| Large Cap Equities | 20%-40% | 28 | % | ||
| Small/Mid Cap Equities | 15%-25% | 21 | % | ||
| International Equities | 10%-20% | 15 | % | ||
| Fixed Income/Real Estate | 10%-30% | 24 | % | ||
| Cash | 0%-10% | 12 | % | ||
| Total | 100 | % | |||
Equity securities in the Company's U.S. pension plan did not include any equity securities of the Company or its affiliates at the end of 2003.
The Company's pension plan assets are managed by outside investment managers; assets are rebalanced based upon market opportunities and the consideration of transactions costs. The company's strategy with respect to pension assets is to pursue an investment plan that, over the long term is
F-93
expected to protect the funded status of the plan, enhance the real purchasing power of plan assets, and not threaten the plan's ability to meet currently committed obligations.
Defined Contribution Plans
The Company has a money purchase pension plan covering substantially all of its domestic employees who have completed at least two years of service. Employer contributions are made based on a percentage of employees' earnings (ranging up to 8%).
The Company also has a salary deferral plan covering substantially all domestic employees. Plan participants may elect to make voluntary contributions to this plan up to a specified amount of their compensation. The Company contributes an amount equal to one-half of the participant's contribution, not to exceed 2% of the participant's compensation.
The Company's total combined expense for the above defined contribution plans for the years ended December 31, 2003, 2002 and 2001 was approximately $12.8 million, $11.9 million and $12.5 million, respectively.
Equity Deferral Plan
Effective July 1, 1999, the Company adopted the Huntsman Equity Deferral Plan (the "Equity Plan"). Under the terms of the Equity Plan, selected officers and key employees had a portion of their compensation deferred and contributed that deferred compensation to the Equity Plan.
For each $1 which was contributed to the Equity Plan, the Company credited an additional $0.50 to the account of the contributing plan participant. Plan participants deferred up to 50% of salary and up to 100% of bonus, up to a maximum of $250,000. The amounts contributed to the Equity Plan were considered invested in phantom shares of Company stock. After participating in the Equity Plan for a period of eight years, the participant could have elected to have all or a portion of accumulated Equity Plan credits paid in cash or credited to another salary deferred plan adopted by the Company. Amounts credited by the Company to a participant's Equity Plan account under the $0.50 matching provision became vested to the participant five years from the date of each matching contribution.
During 2001, the Equity Plan was liquidated and accounts were paid out to those employees participating in the Plan.
Supplemental Salary Deferral Plan and Supplemental Executive Retirement Plan
Effective September 27, 2001, the Company terminated the Huntsman Supplemental Salary Deferral Plan ("SSDP"), a non-qualified deferred compensation plan, and paid out the amounts which participants were entitled to receive under the terms of the plan. The Company also amended the portion of the Huntsman Supplemental Executive Retirement Plan ("SERP") related to the Huntsman Money Purchase Pension Plan to provide for the payout to participants of amounts participants were entitled to receive under that portion of the SERP.
Effective January 1, 2003, the Company created the Huntsman Supplemental Savings Plan ("SSP"). This is a non-qualified plan covering key management employees of Huntsman LLC and its participating affiliates. This plan allows participants to defer amounts that would otherwise be paid as compensation. The participant can defer up to 50% of their salary and up to 82% of their bonus each year. This plan also provides benefits that would be provided under the Huntsman Salary Deferral Plan
F-94
if that plan were not subject to legal limits on the amount of contributions that can be allocated to an individual in a single year.
During the year ended December 31, 2003, the Company expensed $1.1 million for the SSP and the SERP. During the year ended December 31, 2002, the Company expensed $0.4 million for the SERP. The net amount of income recorded for the year ended December 31, 2001 for the Equity Plan, the SSDP and the SERP, which primarily related to the plan payouts, was $3.2 million.
Equity Appreciation Rights Plan
Under the terms of the Equity Appreciation Rights Plan, the Company grants equity appreciation rights ("EARs") to key management employees. The EARs vest at a rate of 25% per year, beginning with the first anniversary of the date of grant and can be exercised anytime within ten years of the date of grant. During the year ended December 31, 2001, 1,065,700 EARs were granted to employees. No awards were granted during the years ended December 31, 2002 or 2003. The EARs entitle the employees to receive an amount equal to the increase in the value of a phantom share of Company stock since the date of the grant multiplied by the number of rights granted. There is no right under the EARs to receive any form of stock or equity interest in the Company or any other entity. Compensation expense is recorded for the increase in the value of the rights. No compensation expense was recorded for the years ended December 31, 2003, 2002 or 2001.
The Company is reviewing possible alternative incentive compensation programs and may allow selected participants to exchange EARs for rights in an alternative program.
International Plans
International employees are covered by various post employment arrangements consistent with local practices and regulations. Such obligations are included in the consolidated financial statements in other long-term liabilities.
19. Related Party Transactions
The accompanying consolidated financial statements of the Company include the following balances not otherwise disclosed with affiliates of the Company (dollars in millions):
| |
December 31, 2003 |
December 31, 2002 |
|||||
|---|---|---|---|---|---|---|---|
| Trade receivables: | |||||||
| HIH | $ | — | $ | 31.7 | |||
| Other unconsolidated affiliates | 11.5 | 0.3 | |||||
| Other receivables: | |||||||
| HIH | — | 15.4 | |||||
| Other unconsolidated affiliates | — | 0.7 | |||||
| Trade accounts payable: | |||||||
| HIH | — | 12.0 | |||||
| Other accounts payable: | |||||||
| HIH | — | 4.3 | |||||
| Other unconsolidated affiliates | 25.2 | — | |||||
F-95
Huntsman LLC shares services and resources with HIH and its subsidiaries. In accordance with various agreements with HIH, Huntsman LLC provides management and operating services and supplies certain raw materials. The accompanying consolidated financial statements of the Company include the following transactions not otherwise disclosed with affiliates, officers and employees of the Company (dollars in millions):
| |
December 31, 2003 |
December 31, 2002 |
December 31, 2001 |
||||||||
|---|---|---|---|---|---|---|---|---|---|---|---|
| Sales to: | |||||||||||
| HIH | $ | 76.3 | $ | 162.1 | $ | 163.3 | |||||
| Other unconsolidated affiliates | 16.6 | 4.1 | 17.0 | ||||||||
| Other income from: | |||||||||||
| Other unconsolidated affiliates | — | — | 5.8 | ||||||||
| Inventory purchases from: | |||||||||||
| HIH | 53.0 | 57.7 | 73.8 | ||||||||
| Other unconsolidated affiliates | 261.4 | — | — | ||||||||
| Operating expenses allocated (to)/from: | |||||||||||
| HIH | (22.3 | ) | (64.5 | ) | (54.2 | ) | |||||
| Other affiliates | — | 2.4 | 0.8 | ||||||||
20. Commitments and Contingencies
The Company has various purchase commitments extending through 2023 for materials and supplies entered into in the ordinary course of business. The purchase commitments are contracts that require minimum volume purchases. Certain contracts allow for changes in minimum required purchases volumes in the event of a temporary or permanent shutdown of a facility. The contractual purchase price for substantially all of these contracts require minimum payments, even if no volume is purchased. These contracts approximate $46 million annually through 2013, decreasing to approximately $33 million through 2017. Historically, the Company has not made any minimum payments under its take or pay contracts.
The Company is involved in litigation from time to time in the ordinary course of its business. In management's opinion, after consideration of indemnifications, none of such litigation is material to the Company's financial condition or results of operations.
Huntsman LLC is a party to various lawsuits brought by persons alleging personal injuries and/or property damage based upon alleged exposure to toxic substances. For example, since June 2003, a number of lawsuits have been filed in state district court in Jefferson County, Texas against several local chemical plants and refineries, including Huntsman LLC's subsidiary, Huntsman Petrochemical Corporation. Generally, these lawsuits allege that the refineries and chemical plants located in the vicinity of the plaintiffs' homes discharged chemicals into the air that interfere with use and enjoyment of property and cause health problems and/or property damages. Because these cases are still in the initial stages, Huntsman LLC does not have sufficient information at the present time to estimate any liability to it.
In connection with the formation of a joint venture to construct and operate an MDI production facility in China (the "China JV") and the procurement of financing for the China JV, the Company has guaranteed the construction loans of the China JV during the construction period. If the China JV
F-96
were to default on its payments during the construction period, the Company would be required to make payments to the bank and ownership of the constructed assets would revert to the Company. The maximum potential amount of future payments that the Company could be required to make under this guarantee is approximately $80 million. The Company has calculated the fair value of the guarantee in accordance with FIN 45, "Guarantor's Accounting and Disclosure Requirements for Guarantees, Including Indirect Guarantees of Indebtedness of Other," and has determined the fair value to be zero. The MDI production facility is expected to be operational in 2006 and the construction period guarantee to terminate within a year thereafter.
21. Fair Value of Financial Instruments
| |
2003 |
2002 |
||||||||||
|---|---|---|---|---|---|---|---|---|---|---|---|---|
| |
Carrying Amount |
Estimated Fair Value |
Carrying Amount |
Estimated Fair Value |
||||||||
| |
(Dollars in millions) |
|||||||||||
| Non-qualified employee benefit plan investments | $ | 2.7 | $ | 2.7 | $ | 0.1 | $ | 0.1 | ||||
| Long-term debt | 5,910.1 | 6,142.7 | 1,736.1 | 1,688.6 | ||||||||
| Notes receivable from affiliates | 25.3 | 25.3 | 296.0 | 296.0 | ||||||||
Long-Term Debt and Notes Receivable from Affiliates
Interest rates that are currently available to the Company for issuance of debt with similar terms and remaining maturities are used to estimate fair value for debt issues that are not quoted on an exchange.
Other Financial Instruments
The carrying amount reported in the balance sheets for cash and cash equivalents, accounts receivable, and accounts payable approximates fair value because of the immediate or short-term maturity of these financial instruments.
The fair value estimates presented herein are based on pertinent information available to management as of December 31, 2003 and 2002. Although management is not aware of any factors that would significantly affect the estimated fair value amounts, such amounts have not been comprehensively revalued for purposes of these financial statements since that date, and current estimates of fair value may differ significantly from the amounts presented herein.
22. Environmental Matters
General
The Company is subject to extensive federal, state, local and foreign laws, regulations, rules and ordinances relating to pollution, protection of the environment and the generation, storage, handling, transportation, treatment, disposal and remediation of hazardous substances and waste materials. In the ordinary course of business, the Company is subject to frequent environmental inspections and monitoring and occasional investigations by governmental enforcement authorities. In addition, the Company's production facilities require operating permits that are subject to renewal, modification and, in certain circumstances, revocation. Actual or alleged violations of environmental laws or permit
F-97
requirements could result in restrictions or prohibitions on plant operations, substantial civil or criminal sanctions, as well as, under some environmental laws, the assessment of strict liability and/or joint and several liability. Moreover, changes in environmental regulations could inhibit or interrupt the Company's operations, or require it to change its facilities or operations. Accordingly, environmental or regulatory matters may cause the Company to incur significant unanticipated losses, costs or liabilities.
Environmental Health and Safety Systems
The Company is committed to achieving and maintaining compliance with all applicable environmental, health and safety ("EHS") legal requirements, and the Company has developed policies and management systems that are intended to identify the multitude of EHS legal requirements applicable to its operations, enhance compliance with applicable legal requirements, ensure the continuing safety of its employees, contractors, community neighbors and customers and minimize the production and emission of wastes and other pollutants. Although EHS legal requirements are constantly changing and are frequently difficult to comply with, these EHS management systems are designed to assist the Company in its compliance goals while also fostering efficiency and improvement and minimizing overall risk to the Company.
EHS Capital Expenditures
The Company may incur future costs for capital improvements and general compliance under EHS laws, including costs to acquire, maintain and repair pollution control equipment. Since capital expenditures for these matters are subject to evolving regulatory requirements and depend, in part, on the timing, promulgation and enforcement of specific requirements, the Company cannot provide assurance that its recent expenditures will be indicative of future amounts required under EHS laws.
Governmental Enforcement Proceedings
On occasion, the Company receives notices of violation, enforcement and other complaints from regulatory agencies alleging non-compliance with applicable EHS law. By way of example, the Company is aware of the individual matters set out below, which the Company believes to be the most significant presently pending matters. Although the Company may incur costs or penalties in connection with the governmental proceedings discussed below, based on currently available information and its past experience, the Company believes that the ultimate resolution of these matters will not have a material impact on its results of operations or financial position.
In May 2003, the State of Texas settled an air enforcement case with the Company relating to its Port Arthur plant. Under the settlement, the Company is required to pay a civil penalty of $7.5 million over more than four years, undertake environmental monitoring projects totaling about $1.5 million in costs, and pay $0.4 million in attorney's fees to the Texas Attorney General. As of September 2004, the Company has paid $1.8 million toward the penalty and $0.4 million for the attorney's fees. The monitoring projects are underway and on schedule. The Company does not anticipate that this settlement will have a material adverse effect on its results of operations or financial position.
In the third quarter of 2004, the Company's Jefferson County, Texas facilities received notification from the Texas Commission on Environmental Quality ("TCEQ") of potential air emission violations relating to the operation of cooling towers at two of its plants, alleged nuisance odors, and alleged upset air emissions. The Company has investigated the allegations and responded in writing to TCEQ.
F-98
TCEQ has proposed a penalty of $9,300 for the alleged nuisance odor violations, $0.2 million for the alleged upset violations and $0.1 million for the alleged cooling tower violations. Negotiations are anticipated between the Company and TCEQ with respect to the resolution of these alleged violations. The Company does not believe that the final cost to resolve these matters will be material.
The Company's subsidiary, Huntsman Advanced Materials (U.K.) Ltd, is scheduled to appear in Magistrates Court in the U.K. in November 2004 to answer five charges following an investigation by the U.K. Health and Safety Executive. The charges arise from alleged asbestos contamination caused by construction activity at the Duxford, U.K. AdMat facility between November 2002 and January 2003. The Company believes that some or all of the alleged violations arise from conduct by a third party contractor occurring before it assumed responsibility for the Duxford facility. Although the Company does not believe this matter will result in the imposition of costs material to its results of operations or financial position, it is too early to predict the outcome of the case.
Remediation Liabilities
The Company has incurred, and the Company may in the future incur, liability to investigate and clean up waste or contamination at its current or former facilities or facilities operated by third parties at which the Company may have disposed of waste or other materials. Similarly, the Company may incur costs for the cleanup of wastes that were disposed of prior to the purchase of its businesses. Under some circumstances, the scope of the Company's liability may extend to damages to natural resources. Specifically, under the U.S. Comprehensive Environmental Response, Compensation and Liability Act of 1980, as amended ("CERCLA"), and similar state laws, a current or former owner or operator of real property may be liable for remediation costs regardless of whether the release or disposal of hazardous substances was in compliance with law at the time it occurred, and a current owner or operator may be liable regardless of whether it owned or operated the facility at the time of the release. In addition, under the U.S. Resource Conservation and Recovery Act of 1976, as amended ("RCRA"), and similar state laws, the Company may be required to remediate contamination originating from its properties as a condition to its hazardous waste permit. For example, the Company's Odessa, Port Arthur, and Port Neches facilities in Texas are the subject of ongoing remediation requirements under RCRA authority. In many cases, the Company's potential liability arising from historical contamination is based on operations and other events occurring prior to its ownership of the relevant facility. In these situations, the Company frequently obtained an indemnity agreement from the prior owner addressing remediation liabilities arising from pre-closing conditions. The Company has successfully exercised its rights under these contractual covenants for a number of sites, and where applicable, mitigated its ultimate remediation liability. The Company can give no assurance, however, that such matters will be subject to indemnity or that its existing indemnities will be sufficient to cover its liabilities for such matters.
The Company has established financial reserves relating to anticipated environmental restoration and remediation programs. Liabilities are recorded when potential liabilities are either known or considered probable and can be reasonably estimated. The Company's liability estimates are based upon available facts, existing technology and past experience. On a consolidated basis, a total of approximately $34.9 million has been accrued for environmental-related liabilities as of December 31, 2003. The Company believes these reserves are sufficient for known requirements. However, no assurance can be given that all potential liabilities arising out of the Company's present or past
F-99
operations or ownership have been identified or fully assessed or that future environmental liabilities will not be material to the Company.
The Company has been notified by third parties of claims against it or its subsidiaries for cleanup liabilities at approximately 11 former facilities and other third party sites, including but not limited to sites listed under CERCLA. The North Maybe Canyon CERCLA site includes an abandoned phosphorous mining site located near Soda Springs, Idaho, in a U.S. National Forest that may have been operated by one of the Company's predecessors for approximately two years. With respect to this site, for which the Company received a notice of potential liability in February 2004, the Company is unable to determine whether the alleged liabilities may be material to it because the Company does not have information sufficient to evaluate the claim. Based on current information and past experience at other CERCLA sites, however, the Company does not expect any of these third party claims to result in material liability to it.
Regulatory Developments
Under the European Union ("EU") Integrated Pollution Prevention and Control Directive ("IPPC"), EU member governments are to adopt rules and implement a cross media (air, water and waste) environmental permitting program for individual facilities. While the EU countries are at varying stages in their respective implementation of the IPPC permit program, the Company has submitted all necessary IPPC permit applications required to date, and in some cases received completed permits from the applicable government agency. The Company expects to submit all other IPPC applications and related documents on a timely basis as the various countries implement the IPPC permit program. Although the Company does not know with certainty what each IPPC permit will require, the Company believes, based upon its experience with the permits received to date, that the costs of compliance with the IPPC permit program will not be material to its results of operations or financial position.
In October 2003, the European Commission adopted a proposal for a new EU regulatory framework for chemicals. Under this proposed new system called "REACH" (Registration, Evaluation and Authorization of Chemicals), companies that manufacture or import more than one ton of a chemical substance per year would be required to register such manufacture or import in a central database. The REACH initiative, as proposed, would require risk assessment of chemicals, preparations (e.g., soaps and paints) and articles (e.g., consumer products) before those materials could be manufactured or imported into EU countries. Where warranted by a risk assessment, hazardous substances would require authorizations for their use. This regulation could impose risk control strategies that would require capital expenditures by the Company. As proposed, REACH would take effect in three primary stages over the eleven years following the final effective date (assuming final approval). The impacts of REACH on the chemical industry and on the Company are unclear at this time because the parameters of the program are still being actively debated.
MTBE Developments
The use of MTBE is controversial in the U.S. and elsewhere and may be substantially curtailed or eliminated in the future by legislation or regulatory action. The presence of MTBE in some groundwater supplies in California and other states (primarily due to gasoline leaking from underground storage tanks) and in surface water (primarily from recreational watercraft) has led to
F-100
public concern about MTBE's potential to contaminate drinking water supplies. Heightened public awareness regarding this issue has resulted in state, federal and foreign initiatives to rescind the federal oxygenate requirements for reformulated gasoline or restrict or prohibit the use of MTBE in particular. For example, California, New York and Connecticut have adopted rules that prohibit the use of MTBE in gasoline sold in those states as of January 1, 2004. Overall, states that have taken some action to prohibit or restrict the use of MTBE in gasoline account for a substantial portion of the "pre-ban" U.S. MTBE market. Thus far, attempts by others to challenge these state bans in federal court under the reformulated gasoline provisions of the federal Clean Air Act have been unsuccessful.
The U.S. Congress has been considering legislation that would eliminate the oxygenated fuels requirements in the Clean Air Act and phase out or curtail MTBE use over a period of several years. To date, no such legislation has become law. If it were to become law it could result in a federal phase-out of the use of MTBE in gasoline in the U.S., but it would not prevent the Company from manufacturing MTBE in its plants. In addition, in March 2000, the EPA announced its intention, through an advanced notice of proposed rulemaking, to phase out the use of MTBE under authority of the federal Toxic Substances Control Act. EPA has not yet acted on this proposal, however. In Europe, the EU issued a final risk assessment report on MTBE in September 2002. No ban of MTBE was recommended, though several risk reduction measures relating to storage and handling of MTBE-containing fuel were recommended.
The Company currently markets approximately 95% of its MTBE to customers located in the U.S. for use as a gasoline additive. Any phase-out or other future regulation of MTBE in other jurisdictions, nationally or internationally, may result in a significant reduction in demand for the Company's MTBE and result in a material loss in revenues or material costs or expenditures. In the event that there should be a complete phase-out of MTBE in the U.S., the Company believes it will be able to export MTBE to Europe, Asia or South America, although this may produce a lower level of cash flow than the sale of MTBE in the U.S. The Company may also elect to use all or a portion of its precursor TBA to produce saleable products other than MTBE. If the Company opts to produce products other than MTBE, necessary modifications to its facilities may require significant capital expenditures and the sale of the other products may produce a materially lower level of cash flow than the sale of MTBE.
In addition to the use limitations described above, a number of lawsuits have been filed, primarily against gasoline manufacturers, marketers and distributors, by persons seeking to recover damages allegedly arising from the presence of MTBE in groundwater. While the Company has not been named as a defendant in any litigation concerning the environmental effects of MTBE, the Company cannot provide assurances that it will not be involved in any such litigation or that such litigation will not have a material adverse effect on its results of operations or financial position.
F-101
23. Other Income (Expense)
Other income (expense) is comprised of the following significant items (dollars in millions):
| |
December 31, 2003 |
December 31, 2002 |
December 31, 2001 |
|||||||
|---|---|---|---|---|---|---|---|---|---|---|
| Insurance settlement proceeds in excess of book value of equipment | $ | — | $ | — | $ | 6.0 | ||||
| Loss on sale of non-qualified plan securities | — | — | (4.2 | ) | ||||||
| Loss on sale of exchangeable preferred stock | — | — | (7.0 | ) | ||||||
| Loss on early extinguishment of debt | — | (6.7 | ) | (1.1 | ) | |||||
| Dividend on exchangeable preferred stock | — | — | 5.8 | |||||||
| Other | (0.9 | ) | 1.1 | |||||||
| Total | $ | — | $ | (7.6 | ) | $ | 0.6 | |||
24. Operating Segment Information
The Company derives its revenues, earnings and cash flows from the manufacture and sale of a wide variety of differentiated and commodity chemical products. The HIH Consolidation Transaction and the AdMat Transaction have caused changes in the Company's operating segments. Prior to the HIH Consolidation Transaction, the Company reported its operations through three principal operating segments. The Company reports its operations through six segments: Polyurethanes, Advanced Materials, Performance Products, Polymers, Pigments and Base Chemicals.
The major products of each reportable operating segment are as follows:
| Segment |
Products |
|
|---|---|---|
| Polyurethanes | MDI, TDI, TPU, polyols, aniline, PO and MTBE | |
Advanced Materials |
Epoxy resin compounds, cross-linkers, matting agents, curing agents, epoxy, acrylic and polyurethane-based adhesives and tooling resins and sterolithography tooling resins |
|
Performance Products |
Amines, surfactants, linear alkylbenzene, maleic anhydride, other performance chemicals, and glycols |
|
Polymers |
Ethylene (produced at the Odessa, Texas facilities primarily for internal use), polyethylene, polypropylene, expandable polystyrene, styrene and other polymers |
|
Pigments |
Titanium dioxide |
|
Base Chemicals |
Olefins (primarily ethylene and propylene), butadiene, MTBE, benzene, cyclohexane and paraxylene |
F-102
Sales between segments are generally recognized at external market prices.
| |
Year Ended December 31, 2003(3) |
Year Ended December 31, 2002 |
Year Ended December 31, 2001 |
|||||||||
|---|---|---|---|---|---|---|---|---|---|---|---|---|
| Net Sales: | ||||||||||||
| Polyurethanes | $ | 1,562.4 | $ | — | $ | — | ||||||
| Advanced Materials | 517.8 | — | — | |||||||||
| Performance Products | 1,507.7 | 1,028.2 | 1,077.6 | |||||||||
| Polymers | 1,155.5 | 840.2 | 820.6 | |||||||||
| Pigments | 678.9 | — | — | |||||||||
| Base Chemicals | 2,152.7 | 996.2 | 1,051.3 | |||||||||
| Eliminations | (494.1 | ) | (203.6 | ) | (192.1 | ) | ||||||
| Total | $ | 7,080.9 | $ | 2,661.0 | $ | 2,757.4 | ||||||
| Segment EBITDA(1): | ||||||||||||
| Polyurethanes | $ | 176.0 | $ | — | $ | — | ||||||
| Advanced Materials | 38.6 | — | — | |||||||||
| Performance Products | 125.6 | 164.4 | 127.7 | |||||||||
| Polymers | 80.8 | 74.7 | (550.6 | ) | ||||||||
| Pigments | 64.7 | — | — | |||||||||
| Base Chemicals | 40.7 | 44.7 | 63.1 | |||||||||
| Corporate and other(2) | (52.9 | ) | (132.6 | ) | (231.1 | ) | ||||||
| Total | $ | 473.5 | $ | 151.2 | $ | (590.9 | ) | |||||
| Segment EBITDA(1) | $ | 473.5 | $ | 151.2 | $ | (590.9 | ) | |||||
| Interest expense, net | (409.1 | ) | (181.9 | ) | (239.3 | ) | ||||||
| Income tax benefit (expense) | (30.8 | ) | (8.5 | ) | 184.9 | |||||||
| Cumulative effect of accounting change | — | 169.7 | 0.1 | |||||||||
| Depreciation and amortization | (353.4 | ) | (152.7 | ) | (197.5 | ) | ||||||
| Net loss | $ | (319.8 | ) | $ | (22.2 | ) | $ | (842.7 | ) | |||
| Depreciation and Amortization: | ||||||||||||
| Polyurethanes | $ | 96.0 | $ | — | $ | — | ||||||
| Advanced Materials | 27.3 | — | — | |||||||||
| Performance Products | 53.7 | 68.9 | 68.3 | |||||||||
| Polymers | 51.4 | 45.7 | 87.5 | |||||||||
| Pigments | 44.2 | — | — | |||||||||
| Base Chemicals | 60.8 | 46.7 | 48.2 | |||||||||
| Corporate and other(2) | 20.0 | (8.6 | ) | (6.5 | ) | |||||||
| Total | $ | 353.4 | $ | 152.7 | $ | 197.5 | ||||||
F-103
| Capital Expenditures: | ||||||||||||
| Polyurethanes | $ | 25.6 | $ | — | $ | — | ||||||
| Advanced Materials | 5.8 | — | — | |||||||||
| Performance Products | 40.6 | 26.5 | 34.1 | |||||||||
| Polymers | 25.9 | 18.3 | 21.0 | |||||||||
| Pigments | 42.4 | — | — | |||||||||
| Base Chemicals | 39.0 | 15.5 | 18.5 | |||||||||
| Corporate and other(2) | 11.7 | 9.9 | 2.8 | |||||||||
| Total | $ | 191.0 | $ | 70.2 | $ | 76.4 | ||||||
| Total Assets: | ||||||||||||
| Polyurethanes | $ | 3,733.9 | $ | — | $ | — | ||||||
| Advanced Materials | 900.7 | — | — | |||||||||
| Performance Products | 1,085.6 | 694.3 | 794.1 | |||||||||
| Polymers | 776.2 | 786.5 | 775.5 | |||||||||
| Pigments | 1,554.5 | — | — | |||||||||
| Base Chemicals | 1,676.0 | 453.8 | 499.4 | |||||||||
| Corporate and other(2) | 3,597.2 | 812.6 | 288.8 | |||||||||
| Eliminations | (4,586.7 | ) | — | — | ||||||||
| Total | $ | 8,737.4 | $ | 2,747.2 | $ | 2,357.8 | ||||||
F-104
Polyurethanes, Advanced Materials, Performance Products, Polymers, Pigments and Base Chemicals.
| |
December 31, |
||||||||||
|---|---|---|---|---|---|---|---|---|---|---|---|
| |
2003 |
2002 |
2001 |
||||||||
| By Geographic Area | |||||||||||
| Net sales: | |||||||||||
| United States | $ | 4,207.6 | $ | 2,491.5 | $ | 2,573.8 | |||||
| United Kingdom | 1,296.7 | 8.1 | 8.6 | ||||||||
| Netherlands | 709.7 | — | — | ||||||||
| Other nations | 866.9 | 161.4 | 175.0 | ||||||||
| Total | $ | 7,080.9 | $ | 2,661.0 | $ | 2,757.4 | |||||
Long-lived assets(1): |
|||||||||||
| United States | $ | 2,280.8 | $ | 1,197.6 | $ | 1,300.8 | |||||
| United Kingdom | 1,164.8 | 8.1 | 6.7 | ||||||||
| Netherlands | 583.8 | — | — | ||||||||
| Other nations | 1,049.9 | 81.5 | 47.3 | ||||||||
| Total | $ | 5,079.3 | $ | 1,287.2 | $ | 1,354.8 | |||||
25. Subsequent Event
Settlement of Claims
HI has settled certain claims during and prior to the second quarter of 2004 relating to discoloration of unplasticized polyvinyl chloride products allegedly caused by HI's TiO2 ("Discoloration Claims"). Substantially all of the TiO2 that was the subject of these claims was manufactured prior to HI's acquisition of its TiO2 business from ICI in 1999. Net of amounts HI has received from insurers and pursuant to contracts of indemnity, HI has paid approximately £8 million ($14.9 million) in costs and settlement amounts for Discoloration Claims.
Certain insurers have denied coverage with respect to certain Discoloration Claims. HI brought suit against these insurers to recover the amounts it believes are due to it. The court found in favor of the insurers, and HI lodged an application for leave to appeal that decision. Qualified leave to appeal was granted in November 2004. HI is considering whether to make a further application to have the qualification removed. HI does not expect the appeal to be heard before the end of the first quarter of 2005.
During the second quarter 2004, HI recorded a charge in the amount of $14.9 million with respect to Discoloration Claims. HI expects that it will incur additional costs with respect to Discoloration Claims, potentially including additional settlement amounts. However, HI does not believe that it has material ongoing exposure for additional Discoloration Claims, after giving effect to its rights under contracts of indemnity, including the rights of indemnity it has against ICI. Nevertheless, HI can
F-105
provide no assurance that its costs with respect to Discoloration Claims will not have a material adverse impact on its financial condition, results of operations or cash flows.
Restructuring and Plant Closing Costs
During the nine months ended September 30, 2004, the Company recorded additional restructuring and plant closing costs of $202.4 million, of which $93.4 million represents non-cash charges for asset impairments and write-downs.
In addition, on October 27, 2004, the Company adopted a plan to rationalize the Whitehaven, U.K., surfactants operations of our Performance Products segment. In connection with the rationalization of the Whitehaven facility, the Company expects to recognize a restructuring charge of approximately $51 million in the fourth quarter of 2004.
F-106
REPORT OF INDEPENDENT REGISTERED PUBLIC ACCOUNTING FIRM
To the Board of Directors of
Huntsman Corporation:
We have audited the accompanying consolidated balance sheet of Huntsman Corporation (the "Company") (a wholly-owned subsidiary of Huntsman Holdings, LLC) as of October 31, 2004 (date of initial capitalization). This financial statement is the responsibility of the Company's management. Our responsibility is to express an opinion on this financial statement based on our audit.
We conducted our audit in accordance with the standards of the Public Company Accounting Oversight Board (United States). Those standards require that we plan and perform the audit to obtain reasonable assurance about whether the financial statement is free of material misstatement. An audit includes examining, on a test basis, evidence supporting the amounts and disclosures in the financial statement. An audit also includes assessing the accounting principles used and significant estimates made by management, as well as evaluating the overall financial statement presentation. We believe that our audit provides a reasonable basis for our opinion.
In our opinion, such balance sheet presents fairly, in all material respects, the financial position of the Company as of October 31, 2004, in conformity with accounting principles generally accepted in the United States of America.
/s/ DELOITTE & TOUCHE LLP
Houston,
Texas
November 23, 2004
F-107
HUNTSMAN CORPORATION
(A WHOLLY OWNED SUBSIDIARY OF HUNTSMAN HOLDINGS, LLC)
BALANCE SHEET
OCTOBER 31, 2004 (DATE OF INITIAL CAPITALIZATION)
| ASSETS | ||||
| Cash | $ | 1,000 | ||
| Total assets | $ | 1,000 | ||
STOCKHOLDER'S EQUITY |
||||
| Common stock (authorized, 1,000 shares, par value $0.01) | ||||
| Issued: 1,000 shares | $ | 10 | ||
| Additional paid in capital | 990 | |||
| Total stockholder's equity | $ | 1,000 | ||
See accompanying note to balance sheet.
F-108
HUNTSMAN CORPORATION
(A WHOLLY OWNED SUBSIDIARY OF HUNTSMAN HOLDINGS, LLC)
NOTE TO BALANCE SHEET
AS OF OCTOBER 31, 2004
1. General
The accompanying balance sheet includes the accounts of Huntsman Corporation (the "Company"), a wholly-owned subsidiary of Huntsman Holdings, LLC ("Holdings"). The Company was incorporated on October 19, 2004, for the purpose of issuing shares of common stock in an initial public offering (the "IPO"). In connection with the IPO, Holdings will be merged with and into the Company. The Company was initially funded on October 31, 2004.
F-109
REPORT OF INDEPENDENT REGISTERED PUBLIC ACCOUNTING FIRM
To
the Board of Managers and Members of
Huntsman Advanced Materials LLC:
We have audited the accompanying consolidated balance sheet of Huntsman Advanced Materials LLC and subsidiaries (the "Company") as of December 31, 2003, and the related consolidated statements of operations and comprehensive loss, equity, and cash flows for the six months ended December 31, 2003. These financial statements are the responsibility of the Company's management. Our responsibility is to express an opinion on these financial statements based on our audit.
We conducted our audit in accordance with the standards of the Public Accounting Oversight Board (United States). Those standards require that we plan and perform the audit to obtain reasonable assurance about whether the financial statements are free of material misstatement. An audit includes examining, on a test basis, evidence supporting the amounts and disclosures in the financial statements. An audit also includes assessing the accounting principles used and significant estimates made by management, as well as evaluating the overall financial statement presentation. We believe that our audit provides a reasonable basis for our opinion.
In our opinion, such consolidated financial statements present fairly, in all material respects, the financial position of Huntsman Advanced Materials LLC and subsidiaries at December 31, 2003 and the results of their operations and their cash flows for the six months ended December 31, 2003 in conformity with accounting principles generally accepted in the United States of America.
As discussed in Note 25, the accompanying consolidated statements of equity and cash flows have been restated.
/s/ DELOITTE & TOUCHE LLP
Salt
Lake City, Utah
November 23, 2004
F-110
REPORT OF INDEPENDENT REGISTERED PUBLIC ACCOUNTING FIRM
To
the Board of Managers and Members of
Huntsman Advanced Materials LLC:
We have audited the accompanying consolidated balance sheet of Vantico Group S.A. and subsidiaries (the "Predecessor Company") as of December 31, 2002, and the consolidated statements of operations and comprehensive loss, equity, and cash flows for the six months ended June 30, 2003 and for the years ended December 31, 2002 and 2001. These financial statements are the responsibility of the Company's management. Our responsibility is to express an opinion on these financial statements based on our audits.
We conducted our audits in accordance with the standards of the Public Accounting Oversight Board (United States). Those standards require that we plan and perform the audit to obtain reasonable assurance about whether the financial statements are free of material misstatement. An audit includes examining, on a test basis, evidence supporting the amounts and disclosures in the financial statements. An audit also includes assessing the accounting principles used and significant estimates made by management, as well as evaluating the overall financial statement presentation. We believe that our audits provide a reasonable basis for our opinion.
In our opinion, such consolidated financial statements present fairly, in all material respects, the financial position of Vantico Group S.A. and subsidiaries at December 31, 2002 and the results of their operations and their cash flows for the six months ended June 30, 2003 and for the years ended December 31, 2002 and 2001, in conformity with accounting principles generally accepted in the United States of America.
As discussed in Note 2 to the consolidated financial statements, effective January 1, 2002, Vantico adopted Statement of Financial Accounting Standards No. 142, "Goodwill and Other Intangible Assets".
/s/ DELOITTE S.A.
Edouard Schmit, Partner
Luxembourg
April 14, 2004
F-111
HUNTSMAN ADVANCED MATERIALS LLC AND SUBSIDIARIES
CONSOLIDATED BALANCE SHEETS
(dollars in millions)
| |
|
|
|||||||
|---|---|---|---|---|---|---|---|---|---|
| |
|
Predecessor Company |
|||||||
| |
December 31, 2003 |
December 31, 2002 |
|||||||
| ASSETS | |||||||||
| Current assets: | |||||||||
| Cash and cash equivalents | $ | 73.2 | $ | 44.0 | |||||
| Accounts receivable (net of allowance for doubtful accounts of $6.8 and $7.0, respectively) | 184.5 | 187.0 | |||||||
| Inventories | 146.4 | 167.0 | |||||||
| Prepaid expenses | — | 2.0 | |||||||
| Deferred income taxes | 11.7 | 4.0 | |||||||
| Other current assets | 21.4 | 20.0 | |||||||
| Total current assets | 437.2 | 424.0 | |||||||
| Property, plant and equipment, net | 394.1 | 400.0 | |||||||
| Goodwill | — | 27.0 | |||||||
| Other intangible assets, net | 34.9 | 112.0 | |||||||
| Deferred income taxes | 16.8 | 16.0 | |||||||
| Other noncurrent assets | 17.7 | 71.0 | |||||||
| Total assets | $ | 900.7 | $ | 1,050.0 | |||||
| LIABILITIES AND EQUITY | |||||||||
| Current liabilities: | |||||||||
| Accounts payable | $ | 85.1 | $ | 96.0 | |||||
| Accrued liabilities | 116.9 | 95.0 | |||||||
| Deferred income taxes | 0.6 | — | |||||||
| Short-term debt | 3.1 | 64.0 | |||||||
| Total current liabilities | 205.7 | 255.0 | |||||||
| Long-term debt | 348.3 | 648.0 | |||||||
| Deferred income taxes | — | 16.0 | |||||||
| Other noncurrent liabilities | 128.5 | 79.0 | |||||||
| Total liabilities | 682.5 | 998.0 | |||||||
| Commitments and contingencies (Notes 19 and 20) | |||||||||
| Equity: | |||||||||
| Members' equity, 4,626,340 units authorized and outstanding, no par | 222.1 | — | |||||||
| Share capital (authorized and issued—267,741,400 ordinary shares, without nominal value) | — | 400.0 | |||||||
| Accumulated deficit | (13.3 | ) | (294.0 | ) | |||||
| Accumulated other comprehensive income (loss) | 9.4 | (54.0 | ) | ||||||
| Total equity | 218.2 | 52.0 | |||||||
| Total liabilities and equity | $ | 900.7 | $ | 1,050.0 | |||||
See accompanying notes to consolidated financial statements.
F-112
HUNTSMAN ADVANCED MATERIALS LLC AND SUBSIDIARIES
CONSOLIDATED STATEMENTS OF OPERATIONS AND
COMPREHENSIVE LOSS
(dollars in millions)
| |
|
|
|||||||||||||
|---|---|---|---|---|---|---|---|---|---|---|---|---|---|---|---|
| |
|
Predecessor Company |
|||||||||||||
| |
Six Months Ended December 31, 2003 |
Six Months Ended June 30, 2003 |
Year Ended December 31, 2002 |
Year Ended December 31, 2001 |
|||||||||||
| Revenues | $ | 517.8 | $ | 531.8 | $ | 949.0 | $ | 949.0 | |||||||
| Cost of goods sold | 410.8 | 412.7 | 707.0 | 697.0 | |||||||||||
| Gross profit | 107.0 | 119.1 | 242.0 | 252.0 | |||||||||||
Expenses: |
|||||||||||||||
| Selling, general and administrative | 94.9 | 103.1 | 219.0 | 198.0 | |||||||||||
| Research and development | 10.8 | 12.2 | 26.0 | 26.0 | |||||||||||
| Impairment of long lived assets | — | — | 56.0 | — | |||||||||||
| Reorganization costs | — | 27.5 | 22.0 | 39.0 | |||||||||||
| Restructuring costs | — | — | — | 8.0 | |||||||||||
| Litigation charges | — | — | — | 25.0 | |||||||||||
| Contract settlement credits and charges, net | — | 5.5 | (9.0 | ) | — | ||||||||||
| Other operating expense (income) | (10.0 | ) | 23.8 | 1.0 | (10.0 | ) | |||||||||
| Total expenses | 95.7 | 172.1 | 315.0 | 286.0 | |||||||||||
| Operating income (loss) | 11.3 | (53.0 | ) | (73.0 | ) | (34.0 | ) | ||||||||
| Interest expense | (21.3 | ) | (36.3 | ) | (68.0 | ) | (69.0 | ) | |||||||
| Loss before income taxes, minority interest and cumulative effect of accounting change | (10.0 | ) | (89.3 | ) | (141.0 | ) | (103.0 | ) | |||||||
| Income tax benefit (expense) | (3.3 | ) | 11.4 | (7.0 | ) | — | |||||||||
| Minority interest | — | — | — | 1.0 | |||||||||||
| Loss before cumulative effect of accounting change | (13.3 | ) | (77.9 | ) | (148.0 | ) | (102.0 | ) | |||||||
| Cumulative effect of accounting change | — | — | (3.0 | ) | — | ||||||||||
| Net loss | (13.3 | ) | (77.9 | ) | (151.0 | ) | (102.0 | ) | |||||||
| Other comprehensive income (loss) | 9.4 | 6.0 | (33.0 | ) | $ | (16.0 | ) | ||||||||
| Comprehensive loss | $ | (3.9 | ) | $ | (71.9 | ) | $ | (184.0 | ) | (118.0 | ) | ||||
See accompanying notes to consolidated financial statements.
F-113
HUNTSMAN ADVANCED MATERIALS LLC AND SUBSIDIARIES
CONSOLIDATED STATEMENTS OF EQUITY
(amounts in millions)
| |
Share Capital/ Members' Equity |
|
|
|
||||||||||||
|---|---|---|---|---|---|---|---|---|---|---|---|---|---|---|---|---|
| |
|
Accumulated Other Comprehensive Income (Loss) |
|
|||||||||||||
| |
Shares/ Units |
Amount |
Accumulated Deficit |
Total |
||||||||||||
| Predecessor Company: | ||||||||||||||||
| Balance, January 1, 2001 | 267.7 | $ | 366.0 | $ | (41.0 | ) | $ | (5.0 | ) | $ | 320.0 | |||||
| Net loss | — | (102.0 | ) | — | (102.0 | ) | ||||||||||
| Other comprehensive loss | — | — | (16.0 | ) | (16.0 | ) | ||||||||||
| Balance, December 31, 2001 | 267.7 | 366.0 | (143.0 | ) | (21.0 | ) | 202.0 | |||||||||
| Shares issued | 34.0 | — | — | 34.0 | ||||||||||||
| Net loss | — | (151.0 | ) | — | (151.0 | ) | ||||||||||
| Other comprehensive loss | — | — | (33.0 | ) | (33.0 | ) | ||||||||||
| Balance, December 31, 2002 | 267.7 | 400.0 | (294.0 | ) | (54.0 | ) | 52.0 | |||||||||
| Net loss | — | (77.9 | ) | — | (77.9 | ) | ||||||||||
| Other comprehensive income | — | — | 6.0 | 6.0 | ||||||||||||
| Balance, June 30, 2003 | 267.7 | $ | 400.0 | $ | (371.9 | ) | $ | (48.0 | ) | $ | (19.9 | ) | ||||
| Successor Company: | ||||||||||||||||
| Cash contribution from parent (as restated, see Note 25) | 3.3 | $ | 164.4 | $ | — | $ | — | $ | 164.4 | |||||||
| Capital contribution from parent related to exchange of debt for parent company equity (as restated, see Note 25) | 1.3 | 67.8 | — | — | 67.8 | |||||||||||
| Expenses associated with raising equity capital (as restated, see Note 25) | (10.1 | ) | — | — | (10.1 | ) | ||||||||||
| Net loss | — | (13.3 | ) | — | (13.3 | ) | ||||||||||
| Other comprehensive income | — | — | 9.4 | 9.4 | ||||||||||||
| Balance, December 31, 2003 | 4.6 | $ | 222.1 | $ | (13.3 | ) | $ | 9.4 | $ | 218.2 | ||||||
See accompanying notes to consolidated financial statements.
F-114
HUNTSMAN ADVANCED MATERIALS LLC AND SUBSIDIARIES
CONSOLIDATED STATEMENTS OF CASH FLOWS
(dollars in millions)
| |
|
Predecessor Company |
||||||||||||
|---|---|---|---|---|---|---|---|---|---|---|---|---|---|---|
| |
Six Months Ended December 31, 2003 |
Six Months Ended June 30, 2003 |
Year Ended December 31, 2002 |
Year Ended December 31, 2001 |
||||||||||
| |
(As restated, see Note 25) |
|
|
|
||||||||||
| Cash Flows From Operating Activities: | ||||||||||||||
| Net loss | $ | (13.3 | ) | $ | (77.9 | ) | $ | (151.0 | ) | $ | (102.0 | ) | ||
| Cumulative effect of accounting change | — | — | 3.0 | — | ||||||||||
| Adjustments to reconcile net loss to net cash from operating activities: | ||||||||||||||
| Depreciation and amortization | 27.3 | 28.8 | 59.0 | 54.0 | ||||||||||
| Noncash interest expense | 1.2 | — | 9.0 | 10.0 | ||||||||||
| Unrealized (gain) loss on foreign currency transactions | (11.6 | ) | 23.8 | 1.0 | (7.0 | ) | ||||||||
| Impairment and noncash restructuring charges | — | — | 56.0 | 8.0 | ||||||||||
| Contract settlement credits and charges, net | — | — | (9.0 | ) | — | |||||||||
| Litigation charges | — | — | — | 25.0 | ||||||||||
| Unrealized investment gains | — | — | — | (3.0 | ) | |||||||||
| Other | 0.9 | — | (5.0 | ) | 3.0 | |||||||||
| Proceeds from sale of investments | — | 2.0 | — | — | ||||||||||
| Deferred income taxes | 0.6 | (19.3 | ) | 5.0 | (15.0 | ) | ||||||||
| Minority interests | — | — | — | (1.0 | ) | |||||||||
| Changes in operating assets and liabilities, net of acquisitions: | ||||||||||||||
| Accounts receivable, net | 16.2 | 3.5 | — | 30.0 | ||||||||||
| Inventories, net | 28.0 | 9.7 | (2.0 | ) | 17.0 | |||||||||
| Accounts payable | (17.1 | ) | 1.0 | 1.0 | (16.0 | ) | ||||||||
| Other operating assets and liabilities | (20.0 | ) | 29.7 | (8.0 | ) | 21.0 | ||||||||
| Net cash provided by (used in) operating activities | 12.2 | 1.3 | (41.0 | ) | 24.0 | |||||||||
| Cash Flows From Investing Activities: | ||||||||||||||
| Capital expenditures | (5.8 | ) | (6.0 | ) | (24.0 | ) | (50.0 | ) | ||||||
| Cash portion of acquisitions of business, net of cash acquired | (397.6 | ) | — | (1.0 | ) | (3.0 | ) | |||||||
| Purchase of Vantico Senior Notes | (22.7 | ) | — | — | — | |||||||||
| Loans and other assets | 0.1 | — | (3.0 | ) | (1.0 | ) | ||||||||
| Proceeds from sale of fixed assets | — | 1.0 | 3.0 | — | ||||||||||
| Net cash used in investing activities | (426.0 | ) | (5.0 | ) | (25.0 | ) | (54.0 | ) | ||||||
| Cash Flows From Financing Activities: | ||||||||||||||
| Increase/(decrease) in short-term debt, net | (2.3 | ) | 8.0 | — | (23.0 | ) | ||||||||
| Payments on long-term debt | (1.0 | ) | (16.0 | ) | (51.0 | ) | (34.0 | ) | ||||||
| Proceeds from long-term debt | — | — | 86.0 | 35.0 | ||||||||||
| Issuance of senior secured noted | 348.0 | — | — | — | ||||||||||
| Cost of raising equity capital | (10.1 | ) | — | — | — | |||||||||
| Debt issuance costs | (14.4 | ) | — | — | (5.0 | ) | ||||||||
| Proceeds from issuance of ordinary shares | — | — | 34.0 | — | ||||||||||
| Cash contributions by parent | 164.4 | — | — | — | ||||||||||
| Net cash provided by (used in) financing activities | 484.6 | (8.0 | ) | 69.0 | (27.0 | ) | ||||||||
| Effect of exchange rate changes on cash | 2.4 | 2.4 | 3.0 | (2.0 | ) | |||||||||
| Increase (decrease) in cash and cash equivalents | 73.2 | (9.3 | ) | 6.0 | (59.0 | ) | ||||||||
| Cash and cash equivalents at beginning of period | — | 44.0 | 38.0 | 97.0 | ||||||||||
| Cash and cash equivalents at end of period | $ | 73.2 | $ | 34.7 | $ | 44.0 | $ | 38.0 | ||||||
| Supplemental cash flow information: | ||||||||||||||
| Cash paid for interest | $ | (0.2 | ) | $ | (41.2 | ) | $ | (53.0 | ) | $ | (54.0 | ) | ||
| Cash (paid) received for income taxes | $ | (1.5 | ) | $ | (2.9 | ) | $ | 3.0 | $ | (10.0 | ) | |||
Supplemental non-cash financing and investing activities:
On June 30, 2003, the Company effectively acquired the Vantico business for cash and debt for stock transaction. For further information see "Note 1—Basis of Presentation" of the accompanying notes to consolidated financial statements.
See accompanying notes to consolidated financial statements.
F-115
HUNTSMAN ADVANCED MATERIALS LLC AND SUBSIDIARIES
NOTES TO CONSOLIDATED FINANCIAL STATEMENTS
1. Basis of Presentation
Huntsman Advanced Materials LLC (including its subsidiaries, unless the context otherwise requires, the "Company") is a leading global producer and marketer of technologically advanced specialty chemicals used in a wide variety of industrial and consumer applications. The Company provides its customers with (1) formulated polymer systems based on epoxy, polyurethane, acrylic and other materials, (2) complex chemicals and additives, and (3) basic and advanced epoxy resin compounds, all of which are used to address customer-specific application needs. The Company's products are utilized in a wide variety of applications, such as surface technologies, electrical materials, structural composites, adhesives, tooling and modeling materials and electronics materials. The Company operates 15 manufacturing facilities worldwide, including facilities in North America, South America, Europe and Asia.
The Company is a Delaware limited liability company, and substantially all of its membership interests are owned by Huntsman Advanced Materials Holdings LLC, a Delaware limited liability company ("AdMat Holdings"). The membership interests of AdMat Holdings are owned 88.1% by Huntsman Advanced Materials Investment LLC, a Delaware limited liability company ("AdMat Investment"), 2.1% by HMP Equity Holdings Corporation ("HMP") and the balance of the membership interests are held by third parties, including SISU Capital Limited ("SISU"), a private investment firm based in London, U.K. All of the common membership interests in AdMat Investment are owned by HMP and all of the preferred membership interests in AdMat Investment are owned by Huntsman Group, Inc., a Delaware corporation ("HGI").
HMP is a Delaware corporation and is owned 100% by HGI, subject to warrants which, if exercised, would entitle the holders to up to 12% of the common stock of HMP. HGI is a Delaware corporation and is owned 100% by Huntsman Holdings, LLC, a Delaware limited liability company ("Huntsman Holdings"). The voting membership interests of Huntsman Holdings are owned by the Huntsman family, MatlinPatterson Global Opportunities Partners, L.P. ("MatlinPatterson"), Consolidated Press Holdings Limited ("Consolidated Press") and certain members of HMP's senior management. In addition, Huntsman Holdings has issued a non-voting preferred interest to Huntsman Holdings Preferred Member LLC, which, in turn, is owned by MatlinPatterson (indirectly), Consolidated Press, the Huntsman Cancer Foundation, certain members of HMP's senior management and certain members of the Huntsman family. Huntsman Holdings has also issued to certain of its members certain non-voting preferred units that track the financial performance of our Company. The Huntsman family has board and operational control of our Company.
In May 2000, a group led by Morgan Grenfell Private Equity Limited ("MGPE") acquired the former Performance Polymers business of Ciba Specialty Chemicals Holdings Inc. ("Ciba") in a leveraged buyout transaction (the "2000 LBO"). The 2000 LBO was effected through Vantico Group S.A. (collectively with its subsidiaries, unless the context otherwise requires, "Vantico" or the "Predecessor Company"). In 2001 and 2002, Vantico's business was adversely affected by a global downturn in the chemical industry, weakness in several of its key end-markets, including the aerospace, automotive and electronics markets, and a number of issues related to Vantico's separation from Ciba. In January 2003, Vantico reached agreement with its lenders under its senior secured credit facilities (the "Vantico Credit Facilities") to defer a payment due in December 2002 until its subsequent date of payment in January 2003. Additionally, the interest payment due on Vantico's 12% senior notes (the "Vantico Senior Notes") due in February 2003 was deferred.
F-116
On June 30, 2003, MatlinPatterson, SISU, HGI, Huntsman Holdings and MGPE completed a restructuring and business combination involving Vantico, whereby ownership of the equity of Vantico was transferred to the Company in exchange for substantially all of the issued and outstanding Vantico Senior Notes and approximately $165 million of additional equity (the "AdMat Transaction"). In connection with the AdMat Transaction, the Company issued $250 million aggregate principal amount of its 11% Senior Secured Notes due 2010 (the "fixed rate notes") and $100 million aggregate principal amount of its Senior Secured Floating Rate Notes due 2008 at a discount of 2%, or for $98 million (the "floating rate notes" and, collectively with the fixed rate notes, the "Senior Secured Notes"). Proceeds from the issuance of the Senior Secured Notes, along with a portion of the additional equity, were used to repay in full the Vantico Credit Facilities. Also in connection with the AdMat Transaction, the Company entered into a $60 million senior secured revolving credit facility (the "Revolving Credit Facility"). The AdMat Transaction was completed as follows:
In connection with the AdMat Transaction, the Company has determined the fair value of assets acquired. The allocation of the purchase price is not yet finalized. The Company expects to complete the allocation in the second quarter of 2004 after the restructuring program analysis and final tax basis
F-117
of the assets and liabilities acquired has been determined. The preliminary allocation of the purchase price is summarized as follows (dollars in millions):
| Current assets | $ | 415.8 | |||
| Curent liabilities | (239.8 | ) | |||
| Property, plant and equipment, net | 397.4 | ||||
| Intangible assets, net | 34.9 | ||||
| Deferred tax | (8.6 | ) | |||
| Other noncurrent assets | 44.2 | ||||
| Other noncurrent liabilities | (122.1 | ) | |||
| Net assets acquired | $ | 521.8 | |||
The following table reflects the Company's results of operations on a pro forma basis as if the acquisition had been completed on January 1, 2002 utilizing Vantico's historical results (dollars in millions):
| |
Year Ended December 31, |
|||||
|---|---|---|---|---|---|---|
| |
2003 |
2002 |
||||
| Revenue | $ | 1,049.6 | $ | 949.0 | ||
| Net loss | 56.9 | 142.0 | ||||
The pro forma information is not necessarily indicative of the operating results that would have occurred had the AdMat Transaction been consummated on January 1, 2002, nor are they necessarily indicative of future operating results.
The Company accounted for the AdMat Transaction as a purchase business combination; accordingly, the consolidated balance sheet as of December 31, 2002 and the operating results prior to July 1, 2003 present the assets, liabilities, results of operations and cash flows of Vantico. The assets, liabilities, results of operations and cash flows of the Company as of and for the six months ended December 31, 2003 are not comparable to the historical financial statements of the Predecessor Company.
On March 19, 2004, HMP and SISU acquired all of MGPE's equity in AdMat Holdings.
Predecessor Company
Vantico was incorporated in Luxembourg on November 29, 1999. Vantico was a holding company with no independent business operations or assets other than its holding of cash and cash equivalents and investment in and loans to group companies. On May 31, 2000, Vantico International S.A. (a company incorporated in Luxembourg and a wholly owned subsidiary of Vantico) (hereinafter, "Vantico International") acquired Ciba's Performance Polymers business as a purchase of assets and shares. Vantico and Vantico International were incorporated as special purpose holding companies for the purpose of acquiring and holding an investment in the business. Prior to the AdMat Transaction, Vantico had three reportable business segments: Polymer Specialties, Electronics and Adhesives and Tooling. Each business segment developed, manufactured and marketed different products and services,
F-118
and was managed separately as management at the time believed each required different technology and marketing strategies.
In March 2001, Vantico completed the purchase of the performance polymers business from Ciba Specialty Chemicals India Ltd ("CSCIL"). With the completion of the above transaction, Vantico acquired all assets and assumed all liabilities pertaining to the performance polymers business of CSCIL in India. At the same time, Vantico also acquired Ciba India Private Limited's ("CIPL") 76% holding in the joint venture company Petro Araldite Private Limited ("PAPL"). PAPL was a joint venture between CIPL and Tamilnadu Petroproducts Limited for the manufacture of basic liquid resins. The total consideration for this acquisition was $4 million.
In July 2001, Vantico completed the acquisition of the Agomet® and Atlas® acrylic adhesives business of Röhm Specialty Acrylics, a unit of Degussa AG. Total consideration for the acquisition was approximately $6 million, $1 million of which was deferred until 2002 and which was paid in February 2002.
The above acquisitions were accounted for as purchase business combinations whereby net assets acquired were accounted for at fair value. Results of operations of the acquired business are included in the consolidated results of the Predecessor Company as of the respective acquisition dates.
2. Summary of Significant Accounting Policies
Principles of Consolidation
The consolidated financial statements of the Company and Vantico include its majority owned subsidiaries. Intercompany transactions and balances have been eliminated.
Use of Estimates
The preparation of financial statements in conformity with accounting principles generally accepted in the United States of America ("U.S. GAAP") requires management to make estimates and assumptions that affect the reported amounts of assets and liabilities and disclosure of contingent assets and liabilities at the date of the financial statements and the reported amounts of revenues and expenses during the reporting period. Actual results could differ from those estimates.
Significant management estimates include, among others, allocation of the transaction consideration to the assets and liabilities of the Company and Vantico, allowance for doubtful receivables and obsolete and slow moving inventories, estimates of future cash flows associated with assets, asset impairments, useful lives for depreciation and amortization, loss contingencies, environmental remediation and compliance expenses, income taxes and valuation allowances for deferred tax assets, and the determination of the discount and other rate assumptions for pension obligations.
Cash and Cash Equivalents
Highly liquid investments with original maturities of three months or less are considered to be cash equivalents.
F-119
Accounts Receivable
Accounts receivable are recorded at their net realizable value after deducting an allowance for doubtful accounts. Such deductions reflect either specific cases or estimates based on historical evidence of collectibility.
Inventories
Inventories are stated at the lower of cost or market using the first-in, first-out (FIFO) method. Costs include all costs of production, including applicable portions of plant overhead. A valuation allowance is recognized for obsolete and slow moving inventories.
Property, Plant and Equipment
Property, plant and equipment is stated at cost. Depreciation is provided utilizing the straight-line method over the following estimated useful lives:
| Buildings | 20-50 years | |
| Plant and equipment | 10-20 years | |
| Office furniture and other equipment | 3-10 years |
Upon disposal of assets, the costs and related accumulated depreciation are removed from the accounts and the resulting gain or loss is included in income. Normal maintenance and repairs of all other plant and equipment are charged to expense as incurred. Renewals, betterments and major repairs that materially extend the useful life of the assets are capitalized, and the assets replaced, if any, are retired.
Interest costs are capitalized as part of major construction projects based on the Company's weighted-average cost of borrowing during the period of construction. Capitalized interest is amortized over the estimated useful lives of the related assets. Interest expense capitalized as part of plant and equipment was not material for the six months ended December 31, 2003 and June 30, 2003 and the years ended December 31, 2002 and 2001.
Goodwill
On January 1, 2002, the Predecessor Company adopted Statement of Financial Accounting Standards ("SFAS") No. 142, "Goodwill and Other Intangible Assets." SFAS No. 142 changes the accounting for goodwill and intangible assets with indefinite lives from an amortization method to an impairment-only approach. Upon adoption of SFAS No. 142, the Predecessor Company was required to reassess the useful lives of all acquired intangibles and perform an impairment test on goodwill. In the first quarter of 2002, Vantico completed the assessment of useful lives and concluded that an adjustment of $33 million, net, previously classified as the value of the workforce and amortized over 15 years, should be reclassified to goodwill.
An initial transitional impairment test of goodwill was required to be performed as of January 1, 2002. On an annual basis, SFAS No. 142 required an evaluation of the book value of goodwill at the reporting unit level for impairment using a two step impairment test. In the first step, the book value of the reporting unit's net assets is compared to the fair value of the reporting unit. If the fair value exceeds the book value of its net assets, goodwill is not considered impaired and the second step is not
F-120
required to be performed. If, however, the fair value is less than the book value of net assets, the second step of the impairment test is required to be performed to measure the amount of the impairment loss, if any. Fair value of the reporting units was determined by using a discounted cash flow approach.
In the second step, an allocation is made of the fair value of the assets and liabilities of the reporting units to all of its tangible assets, other intangible assets (including unrecognized intangible assets but excluding goodwill) and liabilities. This fair value allocation is made as if the reporting unit had been acquired in a business combination and the fair value of the reporting unit is compared to the total fair value of the reporting unit with the excess, if any, considered to be the implied goodwill value of the reporting unit. If the book value of the reporting unit's goodwill exceeds this implied goodwill value, that excess is recorded as an impairment loss as a component of operating income in the consolidated statement of operations. If the book value of the goodwill is less than the implied goodwill value, goodwill is not considered to be impaired and no impairment loss is required to be recognized.
The Predecessor Company completed step one of a transitional goodwill impairment test, as of January 1, 2002, in the third quarter which indicated that goodwill impairment losses were likely within the former Optronics reporting unit. During the fourth quarter, the Predecessor Company completed step two of the transitional goodwill impairment test which resulted in an impairment of $3 million, which is recognized as a cumulative effect of a change in accounting principle in the year ended December 31, 2002. The remaining goodwill balance associated with the former Optronics reporting unit was fully written off by this impairment charge.
During the fourth quarter of 2002, the Predecessor Company completed the annual impairment test of goodwill which resulted in an impairment loss of $32 million for the former Polymers Specialties reporting unit, which has been recorded as an impairment loss within operating loss for the year ended December 31, 2002. Fair value of reporting units was determined using a discounted cash flow approach.
In connection with the AdMat Transaction, no goodwill was allocated to the Company.
Other Intangible Assets
Intangible assets, which consist of patents, trade names and trade marks are stated at their fair market values at the time of acquisition, and are amortized using the straight-line method over their estimated useful lives, ranging from 5 to 30 years. Patents, trade names and trade marks are evaluated for impairment in connection with assessing impairment of long-lived assets, as discussed below.
Carrying Value of Long-Lived Assets
The Company evaluates the carrying value of long-lived assets based on current and anticipated undiscounted cash flows and recognizes an impairment when such estimated cash flows will be less than the carrying value of the asset. Measurement of the amount of impairment, if any, is based upon the difference between carrying value and fair value. During the fourth quarter of 2002, the Predecessor Company completed an impairment test of long-lived assets given it had been incurring and was forecasting cash flow losses which resulted in an impairment loss of $24 million for the former
F-121
Optronics asset grouping, which has been recorded as an impairment loss within operating loss for the year ended December 31, 2002.
Financial Instruments
The carrying amounts reported in the balance sheet for cash and cash equivalents, accounts receivable and accounts payable approximates their fair value because of the immediate or short-term maturity of these financial instruments. The fair value estimates presented herein are based on pertinent information available to management as of December 31, 2003 and 2002. Although management is not aware of any factors that would significantly affect the estimated fair value amounts, such amounts have not been comprehensively revalued for purposes of these financial statements since that date, and current estimates of fair value may differ significantly from the amounts presented herein.
The fair value of the Company's Senior fixed rate notes was approximately $276 million at December 31, 2003. The fair value of the Company's Senior floating rate notes was approximately $105 million at December 31, 2003. Fair market value of the Company's long-term notes has been calculated with reference to the trading price on December 31, 2003.
The carrying value of the Predecessor Company's short-term debt and credit facilities approximates fair value as it bore interest at a floating rate plus an applicable margin. The fair value of the Vantico Senior Notes was approximately $54 million at December 31, 2002. The fair market value of debt is based on the current rates at which similar loans would be made to borrowers with similar credit ratings.
Derivative Financial Instruments
The Company is exposed to market risk in the form of foreign exchange rates, in particular to movements in either the CHF, euro or GBP Sterling against the U.S. dollar. The Company is also exposed to currency fluctuations on its net investments in subsidiaries.
Following adoption of SFAS 133 "Accounting for Derivative Instruments and Hedging Activities" on January 1, 2001, all financial instruments, which included interest rate swaps and swaptions, are recorded on the balance sheet at their fair value. The Predecessor Company designated interest rate swaps and swaptions as qualifying cash flow hedges. Changes in the effective portion of the instruments' fair value are recorded in accumulated other comprehensive income until such time as the hedged item is recognized in net income. The interest rate swaps and swaptions have matched terms, therefore no ineffective element of the hedge arises. All such interest rate swaps matured on June 30, 2002 and interest rate swaptions were not taken up. Therefore, the Predecessor Company had no participation in financial instruments as of December 31, 2002. For further information, see "Note 14—Derivative Financial Instruments."
Income Taxes
The Company uses the asset and liability method of accounting for income taxes. Deferred income taxes reflect the net tax effects of temporary differences between the carrying amounts of assets and liabilities for financial and tax reporting purposes. The Company evaluates the resulting deferred tax assets to determine whether it is more likely than not that they will be realized. Valuation allowances
F-122
have been established against the entire U.S. deferred tax asset and a material portion of certain of the non-U.S. deferred tax assets due to the uncertainty of realization.
Subsequent to the AdMat Transaction, substantially all non-U.S. operations are treated as branches of the Company for U.S. income tax purposes and are, therefore, subject to both U.S. and non-U.S. income tax. Until the Company or HGI has sufficient U.S. taxable income to utilize foreign tax credits, most income will continue to be effectively taxed in both U.S. and non-U.S. jurisdictions in which it is earned.
Prior and subsequent to the AdMat Transaction, for non-U.S. entities that are not treated as branches for U.S. tax purposes, the Company does not provide for income taxes or benefits on the undistributed earnings of these subsidiaries as earnings are reinvested and, in the opinion of management, will continue to be reinvested indefinitely. Upon distribution of these earnings, certain of the Company's subsidiaries would be subject to both income taxes and withholding taxes in the various international jurisdictions. It is not practical to estimate the amount of taxes that might be payable upon such distribution.
Environmental Expenditures
Environmental-related restoration and remediation costs are recorded as liabilities and expensed when site restoration and environmental remediation and cleanup obligations are either known or considered probable and the related costs can be reasonably estimated. Other environmental expenditures, which are principally maintenance or preventative in nature, are recorded when incurred and are expensed or capitalized as appropriate.
Foreign Currency Translation
Generally, the Company's and the Predecessor Company's subsidiaries outside of the United States consider the local currency to be the functional currency. Accordingly, assets and liabilities are translated to U.S. dollars at rates prevailing at the balance sheet date. Revenues, expenses, gains and losses are translated at the weighted-average rate for the period. Translation adjustments are recorded as a component of accumulated other comprehensive income.
Subsidiaries that operate in economic environments that are highly inflationary consider the U.S. dollar to be the functional currency and include gains and losses from translation to the U.S. dollar from the local currency in the statements of operations.
Transaction gains and losses are recorded in the statement of operations and were net gains (losses) of $10.0 million, $(23.8) million, $(1.0) million, and $10.0 million for the six months ended December 31, 2003 and June 30, 2003, and the years ended December 31, 2002 and 2001, respectively.
F-123
Exchange Rates of Principal Currencies Relative to the U.S. Dollar (unaudited)
| |
|
Predecessor Company |
|
Predecessor Company |
||||||||
|---|---|---|---|---|---|---|---|---|---|---|---|---|
| |
For the Six Months Ended December 31, 2003 |
For the Six Months Ended June 30, 2003 |
For the Year Ended December 31, 2002 |
For the Year Ended December 31, 2001 |
For the Year Ended December 31, 2003 |
For the Year Ended December 31, 2002 |
||||||
| |
Statements of operations (average rates) |
Balance sheets (year-end rates) |
||||||||||
| Swiss franc | 0.7465 | 0.7386 | 0.6446 | 0.5927 | 0.8036 | 0.7229 | ||||||
| British pound | 1.6560 | 1.6090 | 1.5025 | 1.4396 | 1.7794 | 1.6095 | ||||||
| Euro | 1.1566 | 1.1019 | 0.9454 | 0.8952 | 1.2534 | 1.0485 | ||||||
| 100 Japense yen | 0.8841 | 0.8412 | 0.8001 | 0.8232 | 0.9342 | 0.8421 | ||||||
Revenue Recognition
Revenue is recognized (i) upon shipment of goods to customers, at which time legal and economic title passes, (ii) when pervasive evidence of an arrangement exists, (iii) when the sales price is fixed or determinable, and (iv) when collectability of revenue is reasonably assured. Revenue is recorded net of sales-related taxes. The Company classifies amounts billed for shipping and handling within revenues.
Cost of Goods Sold
The Company classifies the costs of manufacturing and distributing its products as cost of goods sold. Manufacturing costs include variable costs, primarily raw materials and energy, and fixed expenses directly associated with production. Fixed manufacturing costs include, among other things, plant site operating costs and overhead, production planning and logistics, repair and maintenance, plant site purchasing costs, and engineering and technical support costs. Included in cost of goods sold are also distribution, freight and warehousing costs.
Research and Development
Research and development costs are expensed as incurred.
Reorganization Costs
Reorganization costs consist of expenses associated with a number of cost reduction programs, including the cost of severance for headcount reductions and expenses in connection with operational restructuring and the financial restructuring leading up to the AdMat Transaction.
Net Loss per Share and Member Equity Unit
Net loss per share and member equity unit are not presented because it is not considered meaningful information due to the Company's ownership by a single equity holder.
F-124
Concentration of Credit Risk
Trade receivables primarily result from the core business and reflect a broad customer base. Credit limits, ongoing credit evaluation and account monitoring procedures are utilized to minimize the risk of loss.
Cash and cash equivalents are placed with high credit quality financial institutions and, by policy, the amount of credit exposure to any one financial institution is limited.
Reclassifications
Certain amounts in the consolidated financial statements for prior periods have been reclassified to conform to current period presentation.
Recently Adopted Accounting Pronouncements
As discussed above, Vantico adopted SFAS No. 142 "Goodwill and Other Intangibles" effective January 1, 2002.
In August 2001, the Financial Accounting Standards Board ("FASB") issued SFAS No. 143, "Accounting for Asset Retirement Obligations." SFAS No. 143 addresses financial accounting and reporting for obligations associated with the retirement of tangible, long-lived assets and the associated asset retirement costs. This statement requires that the fair value of a liability for an asset retirement obligation be recognized in the period in which it is incurred by capitalizing it as part of the carrying amount of the long-lived assets. As required by SFAS No. 143, the Predecessor Company adopted this new accounting standard on January 1, 2003. The adoption of this statement had no impact since the timing of any ultimate obligation is indeterminable.
On January 1, 2002, the Predecessor Company adopted SFAS No. 144, "Accounting for the Impairment or Disposal of Long-Lived Assets." This statement establishes a single accounting model for the impairment or disposal of long-lived assets. The adoption of SFAS No. 144 did not have a material effect on the Predecessor Company's consolidated financial statements.
In April 2002, the FASB issued SFAS No. 145, "Rescission of SFAS No. 4, 44, 64 and Amendment of SFAS No. 13 and Technical Corrections." In addition to amending or rescinding pronouncements to make various technical corrections, clarify meanings or describe applicability, SFAS 145 generally precludes companies from recording gains or losses from extinguishment of debt as an extraordinary item that does not meet the extraordinary criteria. The Predecessor Company was required to adopt this statement as of January 1, 2003. The adoption of SFAS No. 145 did not have a material effect on the Predecessor Company's consolidated financial statements.
In June 2002, SFAS No. 146, "Accounting for Costs Associated with Exit or Disposal Activities." SFAS No. 146 requires recording costs associated with an exit or disposal activities at their fair values when the liability has been incurred. Under previous guidance, certain exit costs were accrued upon management's commitment to an exit plan, which is generally before an actual liability has been incurred. The Predecessor Company adopted this pronouncement in the first quarter of 2003. The adoption of SFAS No. 146 did not have a material effect on the Predecessor Company's consolidated financial statements.
F-125
In January 2003, the FASB issued FASB Interpretation No. 45, "Guarantor's Accounting and Disclosure Requirements for Guarantees, Including Indirect Guarantees of Indebtedness of Others." FIN No. 45 requires recognition of a liability for the obligation undertaken upon issuing a guarantee. This liability would be recorded at the inception date of the guarantee and would be measured at fair value. The disclosure provisions of the interpretation are effective for the financial statements as of December 31, 2002. The liability recognition provision applies prospectively to any guarantees issued or modified after December 31, 2002. The adoption of FIN No. 45 did not have a material effect on the Predecessor Company's consolidated financial statements.
In May 2003, the FASB issued SFAS No. 149, "Amendment of Statement 133 on Derivative Instruments and Hedging Activities." SFAS No. 149 amends and clarifies accounting for derivative instruments and hedging activities under SFAS No. 133. This statement is effective for contracts entered into or modified after June 30, 2003 and for hedging relationships designated after June 30, 2003, with the guidance applied prospectively. The adoption of this statement did not have a material effect on the Company's consolidated financial statements.
In May 2003, the FASB issued SFAS No. 150, "Accounting for Certain Financial Instruments with Characteristics of both Liabilities and Equity." SFAS No. 150 establishes standards for classifying and measuring as liabilities certain financial instruments that embody obligations of the issuer and have characteristics of both liabilities and equity. The adoption of this statement had no effect on the Predecessor Company's consolidated financial statements.
Recently Issued Accounting Pronouncements
In January 2003, the FASB issued FASB Interpretation No. 46, "Consolidation of Variable Interest Entities." FIN No. 46 addresses the requirements for business enterprises to consolidate related entities, for which they do not have controlling interests through voting or other rights, if they are determined to be the primary beneficiary as a result of variable economic interests. Transfers to a qualifying special purpose entity are not subject to this interpretation. In December 2003, the FASB modified FIN No. 46 (FIN No. 46R), which clarified certain complexities and generally requires adoption no later than March 31, 2004 for all entities other than special purpose entities under previous guidance. The adoption of this statement will not have a material impact on the Company's consolidated financial statements.
F-126
3. Inventories
Inventories consist of the following (dollars in millions):
| |
|
Predecessor Company |
|||||
|---|---|---|---|---|---|---|---|
| |
December 31, 2003 |
December 31, 2002 |
|||||
| Raw materials and supplies | $ | 26.4 | $ | 31.0 | |||
| Work-in-process and finished goods | 129.7 | 144.0 | |||||
| Total inventory | 156.1 | 175.0 | |||||
| Allowance for obsolete and slow moving inventories | (9.7 | ) | (8.0 | ) | |||
| Net inventory | $ | 146.4 | $ | 167.0 | |||
4. Accounts Receivable
Accounts receivable consist of the following (dollars in millions):
| |
|
Predecessor Company |
|||||
|---|---|---|---|---|---|---|---|
| |
December 31, 2003 |
December 31, 2002 |
|||||
| Trade accounts receivable | $ | 191.3 | $ | 171.0 | |||
| Less allowance for doubtful accounts | (6.8 | ) | (7.0 | ) | |||
| Trade accounts receivable, net | 184.5 | 164.0 | |||||
| Receivable due from Ciba (Note 19) | — | 23.0 | |||||
| Accounts receivable, net | $ | 184.5 | $ | 187.0 | |||
F-127
5. Property, Plant and Equipment
The cost and accumulated depreciation of property, plant and equipment are as follows (dollars in millions):
| |
|
Predecessor Company |
|||||
|---|---|---|---|---|---|---|---|
| |
December 31, 2003 |
December 31, 2002 |
|||||
| Land | $ | 17.9 | $ | 17.0 | |||
| Buildings | 134.6 | 150.0 | |||||
| Plant and equipment | 262.5 | 341.0 | |||||
| Construction in progress | 4.9 | 12.0 | |||||
| Total | 419.9 | 520.0 | |||||
| Less accumulated depreciation | (25.8 | ) | (120.0 | ) | |||
| Net | $ | 394.1 | $ | 400.0 | |||
Total depreciation expense was $26.2 million, and $25.8 million for the six months ended June 30, 2003 and December 31, 2003, respectively, and $53.0 million and $44.0 million for the years ended December 31, 2002 and 2001, respectively.
6. Goodwill
The following table provides pro forma adjusted results as if the provisions of SFAS 142 regarding recognition of other intangible assets and non-amortization of goodwill had been applied in earlier periods. (dollars in millions).
| |
Predecessor Company |
||||||||||
|---|---|---|---|---|---|---|---|---|---|---|---|
| |
Six Months Ended June 30, 2003 |
Year Ended December 31 2002 |
Year Ended December 31 2001 |
||||||||
| Reported net loss | $ | 77.9 | $ | 151.0 | $ | 102.0 | |||||
| Adjustments: | |||||||||||
| Goodwill and value of workforce amortization—net of tax | — | — | (4.0 | ) | |||||||
| Adjusted net loss | $ | 77.9 | $ | 151.0 | $ | 98.0 | |||||
F-128
The following table provides information on the Predecessor Company's goodwill (dollars in millions):
| Goodwill at December 31, 2001 | $ | 20.0 | |||
| Reclassification of value of workforce(1) | 33.0 | ||||
| Goodwill at January 1, 2002 | 53.0 | ||||
| Currency translation adjustments | 9.0 | ||||
| Impairment lossses(2) | (32.0 | ) | |||
| Cumulative effect of change in accounting policy, net of tax(3) | (3.0 | ) | |||
| Goodwill at December 31, 2002 | $ | 27.0 | |||
The following table summarizes goodwill based on the business segments reported by the Predecessor Company (dollars in millions):
| |
Polymer Specialties |
Optronics |
Adhesives & Tooling |
Total |
||||||||||
|---|---|---|---|---|---|---|---|---|---|---|---|---|---|---|
| Goodwill at January 1, 2002 | $ | 29.0 | $ | 2.0 | $ | 22.0 | $ | 53.0 | ||||||
| Currency translation adjustments | 3.0 | 1.0 | 5.0 | 9.0 | ||||||||||
| Impairment losses | (32.0 | ) | (3.0 | ) | — | (35.0 | ) | |||||||
| Goodwill at December 31, 2002 | — | — | 27.0 | 27.0 | ||||||||||
| Currency translation adjustments | — | — | 0.6 | 0.6 | ||||||||||
| Goodwill at June 30, 2003 | $ | — | $ | — | $ | 27.6 | $ | 27.6 | ||||||
Accumulated amortization for goodwill upon adoption of SFAS No. 142 was $7 million, including $4 million in respect of workforce. In connection with the AdMat Transaction, no goodwill was allocated to the Company.
F-129
7. Intangible Assets
The gross carrying amount and accumulated amortization of intangible assets are as follows (dollars in millions):
| |
December 31, 2003 |
Predecessor Company December 31, 2002 |
||||||||||||||||||||||
|---|---|---|---|---|---|---|---|---|---|---|---|---|---|---|---|---|---|---|---|---|---|---|---|---|
| |
Gross carrying amount |
Accumulated amortization |
Net |
Gross carrying amount |
Impairment |
Accumulated amortization |
Currency translation adjustments |
Net |
||||||||||||||||
| Trade names and marks(1) | $ | 11.0 | $ | (0.4 | ) | $ | 10.6 | $ | 103.0 | $ | (20.0 | ) | $ | (11.0 | ) | $ | 20.0 | $ | 92.0 | |||||
| Patents(1) | 11.0 | (0.4 | ) | 10.6 | 24.0 | (4.0 | ) | (4.0 | ) | 4.0 | 20.0 | |||||||||||||
| Customer relationships | 14.4 | (0.7 | ) | 13.7 | — | — | — | — | — | |||||||||||||||
| Total | $ | 36.4 | $ | (1.5 | ) | $ | 34.9 | $ | 127.0 | $ | (24.0 | ) | $ | (15.0 | ) | $ | 24.0 | $ | 112.0 | |||||
Amortization expense for intangible assets was $2.6 million and $1.5 million for the six months ended June 30, 2003 and December 31, 2003, respectively, and $6.0 million and $10.0 million for the years ended December 31, 2002 and 2001, respectively. The estimated amortization expense is estimated to be $3.0 million for each of the five succeeding fiscal years.
8. Other Current Assets
Other currents assets consist of the following (dollars in millions):
| |
|
Predecessor Company |
||||
|---|---|---|---|---|---|---|
| |
December 31, 2003 |
December 31, 2002 |
||||
| Sales tax and miscellaneous taxes | $ | — | $ | 9.0 | ||
| Maintenance and supply inventories | — | 3.0 | ||||
| Other current assets | 21.4 | 8.0 | ||||
| Total | $ | 21.4 | $ | 20.0 | ||
F-130
9. Other Noncurrent Assets
Other noncurrent assets consist of the following (dollars in millions):
| |
|
Predecessor Company |
||||
|---|---|---|---|---|---|---|
| |
December 31, 2003 |
December 31, 2002 |
||||
| Prepaid pension assets | $ | — | $ | 23.0 | ||
| Debt issuance costs | 13.3 | 44.0 | ||||
| Other noncurrent assets | 4.4 | 4.0 | ||||
| Total | $ | 17.7 | $ | 71.0 | ||
In connection with the issuance of certain long-term debt and other obligations, certain direct fees and expenses were incurred. These financing costs have been capitalized and are amortized as interest expense through the consolidated statements of operations over the term of the associated debt. The amortization expense related to capitalized financing costs amortization included in interest expense was $1 million, $1 million, $9 million, and $10 million for the six months ended December 31, 2003 and June 30, 2003 and the years ended December 31, 2002 and 2001, respectively. Unamortized financing costs of the Predecessor Company were eliminated in connection with the AdMat Transaction.
10. Accrued Liabilities
Accrued liabilities consist of the following (dollars in millions):
| |
|
Predecessor Company |
||||
|---|---|---|---|---|---|---|
| |
December 31, 2003 |
December 31, 2002 |
||||
| Payroll, severance and related costs | $ | 26.0 | $ | 17.0 | ||
| Interest | 17.5 | 16.0 | ||||
| Income taxes payable | 1.3 | 15.0 | ||||
| Taxes (property and VAT) | 1.5 | — | ||||
| Restructuring and plant closing costs | 51.5 | — | ||||
| Other miscellaneous accruals | 19.1 | 47.0 | ||||
| Total | $ | 116.9 | $ | 95.0 | ||
11. Other Noncurrent Liabilities
Other noncurrent liabilities consist of the following (dollars in millions):
| |
|
Predecessor Company |
||||
|---|---|---|---|---|---|---|
| |
December 31, 2003 |
December 31, 2002 |
||||
| Pension liabilities | $ | 102.2 | $ | 56.0 | ||
| Other noncurrent liabilities | 26.3 | 23.0 | ||||
| Total | $ | 128.5 | $ | 79.0 | ||
F-131
12. Restructuring Charges
In connection with the AdMat Transaction, the Company is implementing a substantial cost reduction program. The program will include reductions in costs of the Company's global supply chain, reductions in general and administrative costs across the business and the centralization of operations where efficiencies may be achieved. The cost reduction program is expected to be implemented from June 2003 to June 2005 and is estimated to involve $60.8 million in total restructuring costs. As part of the program, the Company expects to incur approximately $53.2 million to reduce headcount and to incur approximately $7.6 million to close plants and discontinue certain service contracts worldwide. The Company reduced 188 staff in the six months ended December 31, 2003. Payments of restructuring and plant closing costs were recorded against reserves established in connection with recording the AdMat Transaction as a purchase business combination. At December 31, 2003, $51.5 million remains in the reserve for restructuring and plant closing costs related to the cost reduction program. As of December 31, 2003, accrued restructuring and plant closing costs consist of the following (dollars in millions):
| |
Balance as of June 30, 2003 |
Non-cash Charge |
Cash Payments(1) |
Balance as of December 31, 2003 |
||||||||
|---|---|---|---|---|---|---|---|---|---|---|---|---|
| Property, plant and equipment | $ | 1.5 | $ | — | $ | — | $ | 1.5 | ||||
| Workforce reductions | 53.2 | — | (9.3 | ) | 43.9 | |||||||
| Other | 6.1 | — | — | 6.1 | ||||||||
| Total | $ | 60.8 | $ | — | $ | (9.3 | ) | $ | 51.5 | |||
Predecessor Company
During 2001, Vantico implemented an involuntary headcount reduction program primarily relating to Swiss operating locations. Provisions for restructuring during the year ended December 31, 2001 amounted to $8 million, $2 million of which was paid during 2001. The remaining $6 million was paid during 2002. These provisions represented a reduction of 85 full-time equivalent staff, 65 of which left the Company during 2001, 19 left the Company during 2002 and the one remaining employee left the Company during 2003.
The costs associated with the Predecessor Company restructuring are as follows (dollars in millions):
| |
For the Year Ended December 31, 2002 |
For the Year Ended December 31, 2001 |
|||||
|---|---|---|---|---|---|---|---|
| At beginning of period | $ | 6.0 | $ | — | |||
| Charge for the period | — | 8.0 | |||||
| Amounts utilized | (6.0 | ) | (2.0 | ) | |||
| At end of period | $ | — | $ | 6.0 | |||
F-132
13. Long-Term Debt
Debt outstanding as of December 31, 2003 and December 31, 2002 is as follows (dollars in millions):
| |
|
Predecessor Company |
|||||
|---|---|---|---|---|---|---|---|
| |
December 31, 2003 |
December 31, 2002 |
|||||
| Long-term debt: | |||||||
| AdMat Senior Secured Notes (denominated in USD) | $ | 348.2 | $ | — | |||
| Vantico Credit Facilities (denominated in EUR and USD) | — | 422.0 | |||||
| Vantico Senior Notes (denominated in EUR) | 0.1 | 261.0 | |||||
| Vantico Bridge Facility (denominated in EUR) | — | 18.0 | |||||
| Total | 348.3 | 701.0 | |||||
| Less current portion of long-term debt | — | (53.0 | ) | ||||
| Total | 348.3 | 648.0 | |||||
Short-term debt: |
|||||||
| Bank overdrafts | — | 1.0 | |||||
| Current portion of long-term debt | — | 53.0 | |||||
| Other debt | 3.1 | 10.0 | |||||
| Total | 3.1 | 64.0 | |||||
| Total | $ | 351.4 | $ | 712.0 | |||
Revolving Credit Facility
On June 30, 2003, the Company entered into a senior secured revolving credit facility (the "Revolving Credit Facility") that provides up to $60 million of borrowings and is secured by a first lien on substantially all of the Company's assets and those of certain of its subsidiaries. The collateral includes substantially all real property and equipment relating to the Company's manufacturing plants located at Bergkamen, Germany; Monthey, Switzerland; McIntosh, Alabama; and Duxford, U.K. The collateral also includes certain capital stock and intercompany notes of certain subsidiaries of the Company, and certain other assets, principally including inventory and accounts receivable. The Company's obligations under the Revolving Credit Facility have been initially guaranteed by all of the Company's U.S. subsidiaries and certain of its non-U.S. subsidiaries (the "Guarantors"). The Revolving Credit Facility lenders are parties to an intercreditor agreement (the "Intercreditor Agreement") with the holders of the Senior Secured Notes.
The Revolving Credit Facility matures on June 30, 2007. Interest rates, at the Company's option, are based upon either a eurocurrency rate (LIBOR) or a base rate (prime), plus an applicable spread. The applicable spreads vary based on the pricing grid. In the case of the eurocurrency based loans, spreads range from 3.0% to 4.5% per annum depending on whether specified conditions have been satisfied, and, in the case of base rate loans, from 2.0% to 3.5% per annum. As of December 31, 2003, the Company had nothing drawn on the Revolving Credit Facility, and had approximately $16 million of letters of credit issued and outstanding thereunder.
F-133
The Revolving Credit Facility contains covenants relating to incurrence of additional debt, purchase and sale of assets, limitations on investments, affiliate transactions, change in control and maintenance of certain financial ratios. The financial covenants include a leverage ratio, fixed charge coverage ratio and a limit on capital expenditures. The Revolving Credit Facility also limits the payment of dividends and distributions generally to the amount required by the Company's members to pay income taxes. Management believes that the Company is in compliance with the covenants of the Revolving Credit Facility as of December 31, 2003.
Senior Secured Notes
In connection with the AdMat Transaction, on June 30, 2003, the Company issued $250 million of its 11% Senior Secured Notes due 2010 (the "fixed rate notes") and $100 million of its Senior Secured Floating Rate Notes due 2008 (the "floating rate notes" and, collectively with the fixed rate notes, the "Senior Secured Notes"). The $250 million fixed rate notes bear a fixed rate of interest of 11%, and the floating rate notes bear interest at a rate per annum equal to LIBOR plus 8.0%, subject to a floor with respect to LIBOR of 2.0%. As of December 31, 2003, the interest rate on the floating rate notes was 10%. Interest on the floating rate notes resets semi-annually. The $100 million of floating rate notes were issued with an original issue discount of 2.0%, or for $98 million. The $2 million discount will be amortized to interest expense over the term of the floating rate notes. Interest is payable on the Senior Secured Notes semiannually on January 15 and July 15. The obligations under the Senior Secured Notes are supported by guarantees of the Company's domestic and certain foreign subsidiaries as well as pledges of substantially all their assets.
The Senior Secured Notes are secured by a second lien, subject to the Intercreditor Agreement, on substantially all of the assets that secure the Revolving Credit Facility. The Senior Secured Notes effectively rank senior in right of payment to all existing and future obligations of the Company that are unsecured or secured by liens on the collateral junior to the liens securing the Senior Secured Notes. The Senior Secured Notes are initially guaranteed on a senior basis by the Guarantors.
The fixed rate notes are redeemable on or after July 15, 2007 at the option of the Company at a price declining from 105.5% to 100.0% of par value by the year 2009. The floating rate notes are redeemable on or after July 15, 2005 at the option of the Company at a price declining from 105.0% to 100.0% of par value by the year 2007. At any time prior to July 15, 2007 for the fixed rate notes and July 15, 2005 for the floating rate notes, the Company may redeem all or part of such notes at 100% of their principal amount, plus a "make whole" premium, as defined in the indenture. In addition, the Company may redeem up to 35% of the aggregate principal amount of the Senior Secured Notes at a redemption price of 111% of the principal thereof with the net cash proceeds of one or more equity offerings, subject to certain conditions and limitations.
The Senior Secured Notes contain covenants relating to the incurrence of debt, limitations on distributions, asset sales and affiliate transactions, among other things. The Senior Secured Notes also contain a change of control provision requiring the Company to offer to repurchase the Senior Secured Notes upon a change of control. Management believes that the Company was in compliance with the covenants of the Senior Secured Notes as of December 31, 2003.
Proceeds from the issuance of Senior Secured Notes, along with a portion of the additional equity, were used to repay in full the Vantico Credit Facilities.
F-134
Other Debt
As of December 31, 2003, the Company also had $3.1 million of other debt outstanding under credit facilities in Brazil and Turkey. These facilities are primarily revolving credit lines that primarily support the working capital needs of the business and the issuance of certain letters of credit and guarantees. A portion of the $3.1 million is backed by letters of credit issued and outstanding under the Revolving Credit Facility.
Maturities
The scheduled maturities of debt are as follows (dollars in millions):
| |
Amount |
|||
|---|---|---|---|---|
| Year ending December 31: | ||||
| 2004 | $ | 3.1 | ||
| 2005 | — | |||
| 2006 | — | |||
| 2007 | — | |||
| 2008 | 98.2 | |||
| Thereafter | 250.1 | |||
| Total | $ | 351.4 | ||
Predecessor Debt
Predecessor Company Long-Term Debt Currency Profile (dollars in millions):
| |
Predecessor Company |
||||||||
|---|---|---|---|---|---|---|---|---|---|
| |
December 31, 2002 |
||||||||
| Debt instrument |
Currency |
Currency Value |
Interest Rate |
U.S. |
|||||
| Vantico Senior Debt—Term A | EUR | 119.0 | 5.11 | % | $ | 124.0 | |||
| Vantico Senior Debt—Term B | EUR | 53.0 | 5.61 | 55.0 | |||||
| Vantico Senior Notes | EUR | 250.0 | 12.00 | 261.0 | |||||
| Vantico Bridge Facility | EUR | 17.0 | 20.00 | 18.0 | |||||
| Vantico Senior Debt—Term A | USD | 124.0 | 3.54 | 124.0 | |||||
| Vantico Senior Debt—Term B | USD | 6.0 | 4.04 | 6.0 | |||||
| Vantico Senior Debt—Term C | USD | 47.0 | 4.54 | 47.0 | |||||
| Vantico Restructuring Facility | CHF | 45.0 | 3.27 | 32.0 | |||||
| Vantico Revolving Credit Facility | CHF | 46.0 | 2.77 | 34.0 | |||||
| Total | $ | 701.0 | |||||||
F-135
Vantico Credit Facilities
Vantico International and certain of its subsidiaries entered into a bank credit agreement dated December 14, 1999, as amended and restated as of May 26, 2000, August 9, 2000, February 27, 2001 and February 22, 2002. The Vantico Credit Facilities consisted of:
The Vantico Senior Credit Facilities bore interest at a rate equal to LIBOR for the relevant interest period plus the Additional Cost Rate and a margin of:
In addition to paying interest on outstanding principal under the Vantico Senior Credit Facilities, subject to certain variations with respect to fees payable in respect of the period, the Predecessor Company was also required to pay a commitment fee at a rate of 0.75% per annum on the amount available under each of the Vantico Revolving Credit Facility and the Restructuring Facility, as well as an annual agency fee. As of December 31, 2002, $422 million was drawn down under the Vantico Senior Credit Facilities denominated in €172 million, $177 million, and CHF 91 million, of which $248 million was drawn under the Term A Loan Facility, $61 million under the Term B Loan Facility, $47 million under the Term C Loan Facility and $32 million under the Restructuring Facility. As of December 31, 2002, $34 million was drawn down under the Vantico Revolving Credit Facility. The remaining $39 million of the $72 million Vantico Revolving Credit Facility was utilized in the form of guarantees, including guarantees for short-term borrowing facilities of subsidiary companies, of which $9 million had been drawn down and included in short-term debt.
F-136
The Vantico Credit Facilities required Vantico International and its subsidiary companies to comply with certain financial and non-financial covenants which were subject to review on a quarterly basis. The financial covenants included limitations on capital expenditure and required maintenance of certain agreed ratios of EBITDA to total debt cost, operating cash flows to total funding costs, and total net debt to EBITDA. All amounts owing under the Vantico Credit Facilities were collateralized by certain assets of Vantico International and its subsidiary companies.
Vantico secured a waiver for the requirement to deliver covenant certificates to its senior lenders in respect of third and fourth quarter 2002 covenants and first quarter 2003 covenants, subject to the satisfaction of further conditions. The waiver was extended to June 30, 2003, while Vantico continued restructuring discussions with its stakeholders.
In connection with the AdMat Transaction, all debt outstanding under the Vantico Credit Facilities was paid in full and the facilities were cancelled.
Vantico Senior Notes
On August 1, 2000, €250 million 12% Senior Notes due 2010 were issued by Vantico. The Vantico Senior Notes were non-collateralized and subordinated debt obligations and interest was payable on the notes semi-annually on February 1 and August 1, commencing February 2001.
The Vantico Senior Notes required Vantico to comply with certain financial and non-financial covenants. The covenants included, among others, limitations on the payment of dividends, incurring additional indebtedness and expanding into unrelated businesses.
In connection with the AdMat Transaction, approximately 99.6% of the Vantico Senior Notes were converted to equity. Subsequent to June 30, 2003, the remaining approximately 0.4% of the Vantico Senior Notes were reinstated, and, on September 10, 2003, pursuant to a change of control provision in the indenture, substantially all of the outstanding Vantico Senior Notes were purchased at 101% plus accrued interest and cancelled. Less than $0.1 million of the Vantico Senior Notes remain outstanding as of December 31, 2003. In connection with the AdMat Transaction, Vantico entered into a supplemental indenture, pursuant to which most of the covenants contained in the indenture were eliminated.
Vantico Bridge Facility
On February 1, 2002, Vantico entered into a bridge facility with Morgan Grenfell Development Capital Syndications Limited ("MGDCS"), an affiliate of MGPE, the former principal shareholder of Vantico Holding S.A. (the "Bridge Facility"). On February 5, 2002, Vantico drew down €17 million ($18 million) under the Bridge Facility and initially on-loaned such amount to its principal subsidiary, Vantico International. This intercompany loan was subsequently converted into equity in Vantico International on September 16, 2002. On March 13, 2002, the Predecessor Company's parent, Vantico Holding S.A. drew down an additional €17 million ($18 million) under the Bridge Facility and on July 31, 2002, Vantico Holding S.A. drew down the remaining €17 million ($18 million) available under the Bridge Facility. The total proceeds borrowed by Vantico Holding S.A. were contributed to its principal subsidiary, Vantico International initially as intercompany loans. These intercompany loans were subsequently converted to equity in Vantico on August 14, 2002, representing a consideration of CHF 51 million ($34 million). The Bridge Facility was an unsecured loan which carried an interest rate of 20% non-cash payment for the amount loaned to Vantico, while Vantico Holding S.A. incurred
F-137
interest at 12% non-cash payment. The Bridge Facility had a maturity linked to the receipt of proceeds from a proposed refinancing. MGDCS subsequently transferred the Bridge Facility to Deutsche European Partners IV, an affiliate.
Other Long-Term Debt
As of December 31, 2002, the Predecessor Company also had $10 million of other debt outstanding.
14. Derivative Financial Instruments
On July 6, 2000, Vantico International entered into two interest rate swap agreements, one each in euro and U.S. dollars and three swaption agreements, in order to comply with the terms of the Vantico Credit Facilities which required at least 70% of the loan principal to be hedged for a minimum period of three years. The swaps were for a period of two years (with initial notional principal of €145 million and $125 million) supplemented by swaptions for year three (two with notional principal of €65 million and another of $114 million). The swaps carried fixed interest rates payable of 5.16% and 7.00% for the euro and U.S. dollar contracts, respectively, while receiving three month Euribor and U.S. dollar LIBOR. The swaptions carried fixed interest rates payable of 5.35% and 7.25% for the euro and U.S. dollar contracts, respectively, and also received three month Euribor and U.S. dollar LIBOR.
The interest rate swaps matured on June 30, 2002 and the swaptions were terminated on June 30, 2003.
The interest rate swaps and swaptions were designated as cash flow hedges and in accordance with the requirements of SFAS 133, the changes in the effective portion of the fair value of such instruments from January 1, 2001 to December 31, 2002 has been recorded through other comprehensive income. Gains and losses related to these contracts are reclassified from other comprehensive income (loss) into earnings in the periods in which the related hedged payments are made. Gains and losses on these agreements are reflected as interest expense in the statement of operations, the amounts of which are immaterial.
Subsequent to June 30, 2003, the Company has not entered into any interest rate or commodity risk hedging instruments.
F-138
15. Income Taxes
The following is a summary of U.S. and non-U.S. provisions for current and deferred income taxes (dollars in millions):
| |
|
Predecessor Company |
||||||||||||
|---|---|---|---|---|---|---|---|---|---|---|---|---|---|---|
| |
For the Six Months Ended December 31, 2003 |
For the Six Months Ended June 30, 2003 |
For the Year Ended December 31, 2002 |
For the Year Ended December 31, 2001 |
||||||||||
| Income tax expense (benefit): | ||||||||||||||
| U.S.: | ||||||||||||||
| Current | $ | — | $ | — | $ | — | $ | — | ||||||
| Deferred | (5.5 | ) | — | — | — | |||||||||
| Non-U.S.: | ||||||||||||||
| Current | 2.4 | (1.0 | ) | 2.0 | 9.0 | |||||||||
| Deferred | 6.4 | (10.4 | ) | 5.0 | (9.0 | ) | ||||||||
| Total | $ | 3.3 | $ | (11.4 | ) | $ | 7.0 | $ | — | |||||
The following schedule reconciles the differences between income taxes at the statutory rate to the Company's provision (benefit) for income taxes (dollars in millions):
| |
|
Predecessor Company |
||||||||||||
|---|---|---|---|---|---|---|---|---|---|---|---|---|---|---|
| |
For the Six Months Ended December 31, 2003 |
For the Six Months Ended June 30, 2003 |
For the Year Ended December 31, 2002 |
For the Year Ended December 31, 2001 |
||||||||||
| Statutory rate | 35.0 | % | 30.4 | % | 30.4 | % | 37.5 | % | ||||||
| (Luxembourg rate through June 30, 2003; U.S. rate thereafter) | ||||||||||||||
| Loss before income taxes, minority interest and cumulative effect of accounting change | $ | (10.0 | ) | $ | (89.3 | ) | $ | (141.0 | ) | $ | (103.0 | ) | ||
| Expected benefit at statutory rate | $ | (3.5 | ) | $ | (27.0 | ) | $ | (44.0 | ) | $ | (39.0 | ) | ||
| Change resulting from: | ||||||||||||||
| U.S. state taxes, net of federal benefit | (0.3 | ) | — | — | — | |||||||||
| Write-down of investment | — | (40.9 | ) | 11.0 | — | |||||||||
| Exchange differences not impacting income statement | — | (5.0 | ) | (11.0 | ) | — | ||||||||
| Non-taxable income | — | — | (1.0 | ) | (8.0 | ) | ||||||||
| Non-deductible costs | (0.3 | ) | — | 8.0 | 15.0 | |||||||||
| Non-deductible impairment | — | — | 16.0 | — | ||||||||||
| Other | (10.1 | ) | (6.0 | ) | 3.0 | |||||||||
| Acquisition related foregone foreign tax credits | 0.8 | |||||||||||||
| Income tax rate differential | (0.5 | ) | 1.4 | 7.0 | 4.0 | |||||||||
| Increase in valuation adjustments | 7.1 | 70.2 | 27.0 | 25.0 | ||||||||||
| Total income tax expense (benefit) | $ | 3.3 | $ | (11.4 | ) | $ | 7.0 | $ | — | |||||
| Effective tax rate | (33.0 | )% | 12.8 | % | (5.0 | )% | 0.0 | % | ||||||
F-139
The components of domestic and non-U.S. losses from continuing operations before income taxes, minority interest and cumulative effect of accounting change were as follows (dollars in millions):
| |
|
Predecessor Company |
||||||||||||
|---|---|---|---|---|---|---|---|---|---|---|---|---|---|---|
| |
For the Six Months Ended December 31, 2003 |
For the Six Months Ended June 30, 2003 |
For the Year Ended December 31, 2002 |
For the Year Ended December 31, 2001 |
||||||||||
| Loss before income taxes, minority interest and cumulative effect of accounting change: | ||||||||||||||
| U.S. | $ | (9.7 | ) | $ | (7.2 | ) | $ | (10.1 | ) | $ | (26.1 | ) | ||
| Non-U.S. | (0.3 | ) | (82.1 | ) | (130.9 | ) | (76.9 | ) | ||||||
| Total | $ | (10.0 | ) | $ | (89.3 | ) | $ | (141.0 | ) | $ | (103.0 | ) | ||
Subsequent to the AdMat Transaction, substantially all non-U.S. operations are treated as branches of the Company for U.S. income tax purposes and are, therefore, subject to both U.S. and non-U.S. income tax. The U.S. and non-U.S. pre-tax income and the corresponding analysis of the income tax provision by taxing jurisdiction may, therefore, not be directly related.
F-140
Components of deferred income tax assets and liabilities are as follows (dollars in millions):
| |
|
Predecessor Company |
||||||
|---|---|---|---|---|---|---|---|---|
| |
December 31, 2003 |
December 31, 2002 |
||||||
| Deferred income tax assets: | ||||||||
| Net operating loss carryforwards | $ | 435.3 | $ | 92.0 | ||||
| Pensions and other employee compensation | 32.3 | 6.0 | ||||||
| Property, plant and equipment | 43.4 | 6.0 | ||||||
| Intangible Assets | 45.8 | — | ||||||
| Goodwill | — | 12.0 | ||||||
| Bond discount | — | 5.0 | ||||||
| Foreign Tax Credits | 1.8 | — | ||||||
| Accrued liabilities | 11.7 | 1.0 | ||||||
| Other | — | 6.0 | ||||||
| Total | 570.3 | 128.0 | ||||||
| Deferred income tax liabilities: | ||||||||
| Property, plant and equipment | (40.3 | ) | (22.0 | ) | ||||
| Goodwill | — | (6.0 | ) | |||||
| Other | (1.7 | ) | (10.0 | ) | ||||
| Total | (42.0 | ) | (38.0 | ) | ||||
| Net deferred tax asset before valuation allowance | 528.3 | 90.0 | ||||||
| Valuation allowance | (500.4 | ) | (86.0 | ) | ||||
| Net deferred tax asset | $ | 27.9 | $ | 4.0 | ||||
| Current tax asset | $ | 11.7 | $ | 4.0 | ||||
| Current tax liability | (0.6 | ) | — | |||||
| Noncurrent tax asset | 16.8 | 16.0 | ||||||
| Noncurrent tax liability | — | (16.0 | ) | |||||
| Total | $ | 27.9 | $ | 4.0 | ||||
As of December 31, 2003, the Company has U.S. federal net operating loss carryforwards ("NOLs") of approximately $84 million. The NOLs begin to expire in 2020 and fully expire in 2023. The Company also has NOLs of approximately $1,404 million in various non-U.S. jurisdictions. While the majority of the non-U.S. NOLs have no expiration date, $235 million have a limited life and begin to expire in 2004. Because substantially all of the non-U.S. operations are treated as branches of the Company for U.S. income tax purposes, approximately $10 million of NOLs are reflected in both the U.S. and non-U.S. NOLs.
The Company's Luxembourg entities have combined tax net operating loss carryforwards of $1,071 million. As of December 31, 2003, there is a valuation allowance of $301 million against the tax-effected NOLs of $321 million. The Company is currently exploring initiatives that may result in the dissolution of these entities. The net operating loss carryforwards of these entities would be lost on dissolution.
F-141
The Company has a valuation allowance against its entire domestic and most of its non-U.S. net deferred tax assets. If the valuation allowance is reversed, approximately the first $34.9 million of the benefit will be used to reduce intangible assets and the remainder will be allocated to income tax expense on the statement of operations. During the period ended December 31, 2003, the Company reversed valuation allowances of $0.8 million, which were used to reduce intangible assets.
Following work on the tax returns of earlier periods, coupled with the approach taken in periods prior to the June 30, 2003 AdMat Transaction, extra NOLs have been recorded in respect of these prior periods, which have not impacted the income tax expense to the extent of $258 million due to the recording of a valuation allowance.
The Company believes that, as of June 30, 2003, its U.S. operating subsidiaries have undergone an "ownership change" (for purposes of Section 382 of the Internal Revenue Code). The use of the acquired U.S. federal NOLs is limited in tax periods following the date of the "ownership change." Based upon the existence of significant "built-in" income items, the resulting effect of this "ownership change" on the Company's ability to utilize its NOLs is not anticipated to be material.
Prior and subsequent to the AdMat Transaction, for non-U.S. entities that are not treated as branches for U.S. tax purposes, the Company does not provide for income taxes or benefits on the undistributed earnings of these subsidiaries as earnings are reinvested and, in the opinion of management, will continue to be reinvested indefinitely. Upon distribution of these earnings, certain of the Company's subsidiaries would be subject to both income taxes and withholding taxes in the various international jurisdictions. It is not practical to estimate the amount of taxes that might be payable upon such distributions.
Subsequent to the AdMat Transaction, substantially all non-U.S. operations are treated as branches of the Company for U.S. income tax purposes and are, therefore, subject to both U.S. and non-U.S. income tax. Until the Company or HGI has sufficient U.S. taxable income to utilize foreign tax credits, most income will continue to be effectively taxed in both U.S. and non-U.S. jurisdictions in which it is earned.
The Company files a U.S. federal consolidated tax return with HGI. HGI and all of its U.S. subsidiaries (including the Company) are parties to various tax sharing agreements which generally provide that entities will pay their own tax (as computed on a separate-company basis) and be compensated for the use of tax attributes, including NOLs.
F-142
16. Other Comprehensive Income (Loss)
The components of other comprehensive income (loss) are as follows (dollars in millions):
| |
|
|
Predecessor Company |
||||||||||||||||||||||
|---|---|---|---|---|---|---|---|---|---|---|---|---|---|---|---|---|---|---|---|---|---|---|---|---|---|
| |
|
|
|
|
Year ended |
||||||||||||||||||||
| |
Six months ended December 31, 2003 |
Six months ended June 30, 2003 |
|||||||||||||||||||||||
| |
December 31, 2002 |
December 31, 2001 |
|||||||||||||||||||||||
| |
Accumulated income (loss) |
Income (loss) |
Accumulated income (loss) |
Income (loss) |
Accumulated income (loss) |
Income (loss) |
Accumulated income (loss) |
Income (loss) |
|||||||||||||||||
| Foreign currency translation adjustments | $ | 9.7 | $ | 9.7 | $ | (7.0 | ) | $ | 6.0 | $ | (13.0 | ) | $ | (2.0 | ) | $ | (11.0 | ) | $ | (9.0 | ) | ||||
| Additional minimum pension liability | (0.3 | ) | (0.3 | ) | (38.0 | ) | — | (38.0 | ) | (35.0 | ) | (3.0 | ) | (3.0 | ) | ||||||||||
| Unrealized loss on derivative instruments | — | — | — | — | — | 4.0 | (4.0 | ) | (1.0 | ) | |||||||||||||||
| Cumulative effect of accounting change | — | — | (3.0 | ) | — | (3.0 | ) | — | (3.0 | ) | (3.0 | ) | |||||||||||||
| Total | $ | 9.4 | $ | 9.4 | $ | (48.0 | ) | $ | 6.0 | $ | (54.0 | ) | $ | (33.0 | ) | $ | (21.0 | ) | $ | (16.0 | ) | ||||
Items of other comprehensive income have been recorded net of tax, with the exception of income permanently reinvested, based upon the jurisdiction where the income or losses were realized.
17. Marketable Investments
Marketable investments as of December 31, 2001 comprised a 14% interest in 3D Systems Corporation ("3D Systems"), a U.S. listed company, accounted for by Vantico as a trading security and recorded at its fair market value, based on quoted market prices. The net unrealized holding gain included in the consolidated statement of operations was $3.0 million for the year ended December 31, 2001. As discussed in "Note 19—Commitments and Contingencies," Vantico reduced its investment in 3D Systems in connection with the March 19, 2002 settlement of the research and development contract termination litigation by delivering to 3D Systems 1.55 million shares ($22 million). Vantico sold its remaining interest in 3D Systems in two separate transactions on May 7, 2002 and May 16, 2002 for total proceeds of $2 million which represented fair value, thus no gain on sale was recognized.
The Company held no marketable investments during 2003.
18. Retirement Benefits
Defined Benefit Plans
The Company sponsors a number of defined benefit pension plans for its employees in many countries worldwide. The assets for some of these plans are kept externally, however in certain territories no independent assets exist for the pension benefit obligations. In these cases the related liability has been included in the consolidated balance sheets.
F-143
The following table sets forth the funded status of the plan and the amounts recognized in the consolidated balance sheets at December 31, 2003 and December 31, 2002 (dollars in millions):
| |
|
|
Predecessor Company |
||||||||||||||||||||||||
|---|---|---|---|---|---|---|---|---|---|---|---|---|---|---|---|---|---|---|---|---|---|---|---|---|---|---|---|
| |
Six months ended December 31, 2003 |
Six months ended June 30, 2003 |
December 31, 2002 |
December 31, 2001 |
|||||||||||||||||||||||
| |
U.S. plans |
Non U.S. plans |
U.S. plans |
Non U.S. plans |
U.S. plans |
Non U.S. plans |
U.S. plans |
Non U.S. plans |
|||||||||||||||||||
| Change in benefit obligation | |||||||||||||||||||||||||||
| Benefit obligation at beginning of period | $ | 38.7 | $ | 246.7 | $ | 38.0 | $ | 221.0 | $ | 32.0 | $ | 179.0 | $ | 27.0 | $ | 170.0 | |||||||||||
| Service cost | 1.1 | 3.2 | 1.1 | 3.4 | 2.0 | 7.0 | 2.0 | 6.0 | |||||||||||||||||||
| Interest cost | 1.3 | 5.1 | 1.3 | 5.0 | 2.0 | 10.0 | 2.0 | 8.0 | |||||||||||||||||||
| Participant contributions | — | 1.4 | — | 1.4 | — | 1.0 | — | 2.0 | |||||||||||||||||||
| Plan amendments | — | — | 0.1 | — | — | — | — | — | |||||||||||||||||||
| Exchange rate changes | — | 17.7 | (0.4 | ) | 12.3 | — | 34.0 | — | (3.0 | ) | |||||||||||||||||
| Settlements/transfers | — | — | — | (1.4 | ) | — | — | — | — | ||||||||||||||||||
| Actuarial (gain)/loss | 5.2 | (1.6 | ) | (0.7 | ) | 7.1 | 2.0 | (6.0 | ) | 1.0 | 2.0 | ||||||||||||||||
| Benefits paid | — | (7.4 | ) | (0.7 | ) | (2.1 | ) | — | (4.0 | ) | — | (6.0 | ) | ||||||||||||||
| Benefit obligation at end of period | $ | 46.3 | $ | 265.1 | $ | 38.7 | $ | 246.7 | $ | 38.0 | $ | 221.0 | $ | 32.0 | $ | 179.0 | |||||||||||
| Change in plan assets | |||||||||||||||||||||||||||
| Fair value of plan assets at beginning of period | $ | 23.3 | $ | 168.2 | $ | 21.0 | $ | 148.0 | $ | 24.0 | $ | 154.0 | $ | 22.0 | $ | 151.0 | |||||||||||
| Actual return on plan assets | 3.1 | 4.5 | 2.5 | 9.9 | (3.0 | ) | (39.0 | ) | (1.0 | ) | 1.0 | ||||||||||||||||
| Exchange rate changes | — | 11.7 | (0.3 | ) | 6.6 | — | 24.0 | — | (3.0 | ) | |||||||||||||||||
| Participant contributions | — | 1.4 | — | 1.4 | — | 1.0 | — | 2.0 | |||||||||||||||||||
| Company contributions | 0.9 | 3.4 | 0.8 | 3.7 | 1.0 | 9.0 | 3.0 | 4.0 | |||||||||||||||||||
| Other | — | — | — | 0.7 | — | — | — | — | |||||||||||||||||||
| Benefits paid | (0.6 | ) | (6.7 | ) | (0.7 | ) | (2.1 | ) | (1.0 | ) | (1.0 | ) | — | (1.0 | ) | ||||||||||||
| Fair value of plan assets at end of period | $ | 26.7 | $ | 182.5 | $ | 23.3 | $ | 168.2 | $ | 21.0 | $ | 148.0 | $ | 24.0 | $ | 154.0 | |||||||||||
| Funded status | |||||||||||||||||||||||||||
| Funded status | $ | (19.6 | ) | $ | (82.6 | ) | $ | (15.4 | ) | $ | (78.5 | ) | $ | (17.0 | ) | $ | (73.0 | ) | $ | (8.0 | ) | $ | (25.0 | ) | |||
| Unrecognized net actuarial (gain)/loss | 3.1 | 0.2 | 12.6 | 83.2 | 15.0 | 80.0 | 7.0 | 33.0 | |||||||||||||||||||
| Unrecognized prior service cost | — | — | 0.4 | — | — | — | — | — | |||||||||||||||||||
| Accrued benefit (liability) asset | $ | (16.5 | ) | $ | (82.4 | ) | $ | (2.4 | ) | $ | 4.7 | $ | (2.0 | ) | $ | 7.0 | $ | (1.0 | ) | $ | 8.0 | ||||||
| Amounts recognized in balance sheet: | |||||||||||||||||||||||||||
| Accrued benefit cost recognized in accrued liabilities and other noncurrent liabilities | $ | (16.5 | ) | $ | (82.4 | ) | $ | (2.4 | ) | $ | 4.7 | $ | (2.0 | ) | $ | (54.0 | ) | $ | (1.0 | ) | $ | (28.0 | ) | ||||
| Prepaid pension cost | — | — | — | — | — | 23.0 | — | 34.0 | |||||||||||||||||||
| Additional minimum liability | (0.3 | ) | — | 6.1 | 52.7 | — | — | — | — | ||||||||||||||||||
| Accumulated other comprehensive income (loss) | 0.3 | — | (6.1 | ) | (52.7 | ) | — | 38.0 | — | 2.0 | |||||||||||||||||
| Accrued benefit (liability) asset | $ | (16.5 | ) | $ | (82.4 | ) | $ | (2.4 | ) | $ | 4.7 | $ | (2.0 | ) | $ | 7.0 | $ | (1.0 | ) | $ | 8.0 | ||||||
F-144
The fair value of plan assets as of December 31, 2001 included a calculation using estimated closing asset values for a Swiss pension plan. Adjustments of $23 million and $12 million were recognized in 2002 as a reduction of the actual return on plan assets and benefit obligations, respectively, to reflect the actual December 31, 2001 closing values. The effect on net loss was not significant.
Components of the Company's pension cost for the six months ended December 31, 2003 and June 30, 2003 and for the year ended December 31, 2002 and 2001 (dollars in millions):
| |
|
|
Predecessor Company |
||||||||||||||||||||||
|---|---|---|---|---|---|---|---|---|---|---|---|---|---|---|---|---|---|---|---|---|---|---|---|---|---|
| |
Six months ended December 31, 2003 |
Six months ended June 30, 2003 |
December 31, 2002 |
December 31, 2001 |
|||||||||||||||||||||
| |
U.S. plans |
Non U.S. plans |
U.S. plans |
Non U.S. plans |
U.S. plans |
Non U.S. plans |
U.S. plans |
Non U.S. plans |
|||||||||||||||||
| Service cost | $ | 1.1 | $ | 3.1 | $ | 1.1 | $ | 3.3 | $ | 2.0 | $ | 7.0 | $ | 2.0 | $ | 6.0 | |||||||||
| Interest cost | 1.3 | 5.1 | 1.3 | 5.0 | 2.0 | 10.0 | 2.0 | 8.0 | |||||||||||||||||
| Expected return on assets | (0.9 | ) | (5.2 | ) | (1.2 | ) | (4.8 | ) | (2.0 | ) | (10.0 | ) | (2.0 | ) | (11.0 | ) | |||||||||
| Settlement (gain) loss | — | — | — | 0.2 | — | — | — | — | |||||||||||||||||
| Amortization of actuarial (gain)/loss | — | — | 0.2 | 2.5 | — | 5.0 | — | 1.0 | |||||||||||||||||
| Net periodic benefit cost | $ | 1.5 | $ | 3.0 | $ | 1.4 | $ | 6.2 | $ | 2.0 | $ | 12.0 | $ | 2.0 | $ | 4.0 | |||||||||
The weighted average key assumptions used to determine the projected benefit obligations and pension cost for the principal defined benefit plans were as follows:
| |
|
|
Predecessor Company |
||||||||||||||
|---|---|---|---|---|---|---|---|---|---|---|---|---|---|---|---|---|---|
| |
Six months ended December 31, 2003 |
Six months ended June 30, 2003 |
December 31, 2002 |
December 31, 2001 |
|||||||||||||
| |
U.S. plans |
Non U.S. plans |
U.S. plans |
Non U.S. plans |
U.S. plans |
Non U.S. plans |
U.S. plans |
Non U.S. plans |
|||||||||
| Weighted-average assumptions as of December 31: | |||||||||||||||||
| Discount rate | 6.00 | % | 4.27 | % | 6.75 | % | 4.20 | % | 6.75 | % | 4.44 | % | 7.50 | % | 4.98 | % | |
| Expected return on plan assets | 8.25 | % | 2.10 | % | 4.00 | % | 2.10 | % | 4.00 | % | 2.35 | % | 10.00 | % | 5.97 | % | |
| Rate of compensation increase | 4.00 | % | 2.17 | % | 8.75 | % | 5.13 | % | 9.75 | % | 5.47 | % | 3.50 | % | 2.46 | % | |
The projected benefit obligation, accumulated benefit obligation, and fair value of plan assets for the defined benefit plans with accumulated benefit obligations in excess of plan assets were as follows (dollars in millions):
| |
|
|
Predecessor Company |
|||||||||
|---|---|---|---|---|---|---|---|---|---|---|---|---|
| |
June 30, 2003 |
December 31, 2002 |
||||||||||
| |
U.S. plans |
Non U.S. plans |
U.S. plans |
Non U.S. plans |
||||||||
| Projected benefit obligation | $ | 46.3 | $ | 265.1 | $ | 38.0 | $ | 221.0 | ||||
| Accumulated benefit obligation | 38.6 | 225.5 | 30.6 | 129.4 | ||||||||
| Fair value of plan assets | 26.7 | 182.5 | 21.0 | 148.0 | ||||||||
F-145
Expected future contributions and benefit payments are as follows for the U.S. plans (dollars in millions):
| 2004 expected employer contributions: | ||||
| To plan trusts | $ | 3.0 | ||
| To plan participants | 0.1 | |||
Expected benefit payments: |
||||
| 2004 | 0.7 | |||
| 2005 | 0.5 | |||
| 2006 | 0.6 | |||
| 2007 | 0.6 | |||
| 2008 | 7.0 | |||
| 2009-2013 | 3.7 | |||
The asset allocation for the Company's U.S. pension plans at the end of 2003 and the target allocation for 2004, by asset category, follows. The fair value of plan assets for these plans is $207.0 million at the end of 2003. The expected long-term rate of return on these assets was 8.25% in 2003.
| Asset category |
Target Allocation 2004 |
Allocation at December 31, 2003 |
|||
|---|---|---|---|---|---|
| Large Cap Equities | 20 - 40 | % | 28 | % | |
| Small/Mid Cap Equities | 15 - 25 | % | 21 | % | |
| International Equities | 10 - 20 | % | 15 | % | |
| Fixed Income/Real Estate | 10 - 30 | % | 24 | % | |
| Cash | 0 - 10 | % | 12 | % | |
| Total | 100 | % | |||
The Company has recognized a minimum pension liability in respect of plans that have an accrued pension cost less than the unfunded accumulated benefit obligation. This amounted to $0.3 million and $35.0 million for the six months ended December 31, 2003 and the year ended December 31, 2002, which was recorded as a charge to other comprehensive loss. In 2004, the Company expects to contribute approximately $3.0 million to the U.S. pension plans and approximately $5.0 million to the non-U.S. plans.
F-146
Other Postretirement Benefits
Changes in the projected benefit obligation and plan assets for the year ended December 31, 2003 and 2002 were as follows (dollars in millions):
| |
|
Predecessor Company |
||||||||
|---|---|---|---|---|---|---|---|---|---|---|
| |
December 31, 2003 |
June 30, 2003 |
December 31, 2002 |
|||||||
| Benefit obligations, beginning of period | $ | 6.6 | $ | 7.0 | $ | 7.0 | ||||
| Acquisitions | — | — | — | |||||||
| Service cost | 0.2 | 0.2 | — | |||||||
| Interest cost | 0.2 | 0.2 | — | |||||||
| Actuarial loss | 2.6 | (0.8 | ) | — | ||||||
| Benefits paid | — | — | — | |||||||
| Benefit obligations, end of period | $ | 9.6 | $ | 6.6 | $ | 7.0 | ||||
| Funded status | $ | (9.6 | ) | $ | (6.6 | ) | $ | (7.0 | ) | |
| Unrecognized (gain) / loss | 2.1 | (0.1 | ) | 1.0 | ||||||
| Prepaid / (accrued) pension cost | $ | (7.5 | ) | $ | (6.7 | ) | $ | (6.0 | ) | |
The weighted-average key assumptions used to determine the projected benefit obligations and expense for the principal post retirement medical plans were as follows:
| |
|
Predecessor Company |
|||||
|---|---|---|---|---|---|---|---|
| |
December 31 2003 |
June 30 2003 |
December 31 2002 |
||||
| Discount rate | 6.0 | % | 6.8 | % | 6.7 | % | |
| Expected capitation increase | 10.0 | % | 10.0 | % | 9.0 | % | |
Assumed health care cost trends have an effect on the amounts reported for the health care plan. A one percentage-point increase/ (decrease) in assumed health care cost trend rates would have a $0.2 million / ($0.2 million) impact on total service and interest cost components for both 2003 and 2002. For the postretirement benefit obligation, a one percentage-point increase/ (decrease) in assumed health care cost trend rates would have a $1.2 million / ($0.9 million) impact for 2003 and a $1.3 million / ($1.0 million) impact for 2002.
F-147
Expected future contributions and benefit payments are as follows (dollars in millions):
| 2004 expected employer contributions: | ||||
| To plan trusts | $ | 0.2 | ||
Expected benefit payments: |
||||
| 2004 | 0.2 | |||
| 2005 | 0.3 | |||
| 2006 | 0.3 | |||
| 2007 | 0.3 | |||
| 2008 | 0.4 | |||
| 2009-2013 | 3.3 | |||
Defined Contribution Plans
The Company also operates a number of defined contribution pension plans for its employees. Contributions made by the Company to these plans were immaterial in the six months ended December 31, 2003 and the year ended December 31, 2002.
19. Commitments and Contingencies
Purchase Commitments
The Company has various purchase commitments extending through 2012 for materials, supplies and services entered into in the ordinary course of business. The purchase commitments are contracts that require minimum volume purchases. Certain contracts allow for changes in minimum required purchase volumes in the event of a temporary or permanent shut down of a facility. The contractual purchase price for substantially all of these contracts is variable based upon market prices, subject to annual negotiations.
The Company is indemnified by Ciba against certain liabilities arising on supply contracts. The indemnification covers the first CHF 50 million, and 50% of an additional CHF 50 million (thereby providing CHF 75 million of coverage against the first CHF 100 million), of costs arising from onerous supply contracts. Further information in respect of these contracts is set out below.
Legal Proceedings
Ciba
On December 17, 2002, a settlement agreement in respect of all onerous purchase contracts acquired in connection with the 2000 LBO was signed by Ciba and Vantico. The settlement agreement required Ciba to pay Vantico CHF 32 million ($23 million), representing the maximum liability under the terms of the transaction agreement of CHF 75 million ($44 million) less payments already made by Ciba to Tamilnadu Petroproducts Limited, Jana Nama, legal and arbitration fees incurred by Ciba and previous payments made to the Company. Accordingly, Vantico reduced the existing receivable as at December 31, 2002 of $32 million due from Ciba for onerous contract indemnifications to $23 million for the settlement and wrote-off the remaining $9 million. Vantico received the net settlement of CHF 32 million ($23 million) on January 7, 2003.
F-148
In connection with the December 17, 2002 settlement with Ciba, Vantico and Jana Nama signed a purchase contract amendment. Vantico adjusted its onerous contract liability to reflect the terms of the contract amendment and such adjustment resulted in a reduction of operating loss of $18 million. This amount is disclosed as contract settlement credits and charges, net of the $9 million write-off of receivables due from Ciba. The purchase contract amendment extends through 2012 and requires minimum volume purchases of raw materials. The contractual purchase price is variable based on the sales price of the end product and is determined quarterly.
On July 21, 2004, the Company and Ciba entered into another settlement agreement. In general, the settlement agreement provides that Ciba pay the Company $11 million in 2004 and will provide the Company with approximately $11 million of credits over the next five years against payments for certain services provided by Ciba at one of the Company's facilities. The Company also received additional consideration in the form of modifications to certain agreements between the Company and Ciba. In August 2004, the Company received payment of the $11 million settlement. Through September 30, 2004, the Company has incurred approximately $2.2 million in legal costs in connection with the arbitration proceedings against Ciba.
3D Systems Corporation
The Predecessor Company owned a 14% interest in 3D Systems. In September 2001, the Predecessor Company terminated a research and development agreement with 3D Systems for the development of photopolymer resins suitable for 3D Systems' SLA machines. As a result of the termination, 3D Systems initiated legal proceedings to recover costs incurred in connection with the research and development agreement. At December 31, 2001, Vantico accrued $25 million for this loss contingency representing estimated settlement costs and related legal costs.
Following commencement of arbitral proceedings before The International Court of Arbitration of the International Chamber of Commerce, the parties reached a settlement on March 19, 2002. The settlement agreement required Vantico to pay 3D Systems $22 million, which could be satisfied at the election of the Company in cash or the delivery of 1.55 million shares of 3D Systems common stock, or a combination thereof. On April 22, 2002, Vantico settled with 3D Systems under the terms of the settlement agreement by electing to deliver 1.55 million shares of 3D Systems common stock. Under the terms of the settlement agreement, Vantico additionally purchased approximately $1 million of saleable inventory from 3D Systems. The total costs of the settlement and related legal costs were $25 million.
Vantico sold its remaining interest in 3D Systems in two separate transactions on May 7, 2002 and May 16, 2002 for total proceeds of $2 million, which represented fair value, thus no gain on sale was recognized.
Taiyo
After determining that certain products of Vantico's Electronics division may have infringed patents owned by Taiyo, Vantico concluded a license agreement with Taiyo whereby it obtained the right to use the Taiyo patents. Back royalties and periodic royalty payments for future use are provided for by the license agreement. The Company believes that Ciba is liable under the indemnity provisions of the agreements entered into in connection with the 2000 LBO for certain payments made under the
F-149
license agreement and related costs and expenses. The Company has initiated an arbitration demand against Ciba.
General
In the ordinary course of business, the Company is involved in various other lawsuits, claims, investigations and proceedings, including product liability, commercial, environmental, and health and safety matters. The Company does not believe that the outcome of any of these lawsuits will have a material adverse effect on the Company's financial position, results of operations or cash flows.
Contingencies
The Company operates in countries where political, economic, social, and legal developments could have had, or could have, an impact on the operational activities. The effects of such risks on the Company's results, which arise during the normal course of business, are not foreseeable and are therefore not included in the financial statements.
In the ordinary course of business, the Company is involved in lawsuits, claims, investigations and proceedings, including product liability, commercial, environmental, and health and safety matters. A supplier to the Predecessor under the supply contracts considered onerous by Vantico and disclosed more fully in the previous section "Purchase Commitments", has initiated arbitration proceedings against Ciba under the terms of the original contract between the two parties, subsequently novated to Vantico. The outcome of the arbitration proceedings cannot be predicted but any settlement arising would be classified under the Company's indemnification with Ciba and potentially give rise to increased charges in future reportable periods.
The Company is contesting a decision by Ciba, to allocate a settlement made by them, prior to Vantico's acquisition of the performance polymers subsidiary in India, solely to the indemnification available in respect to onerous supply contracts. In Vantico's opinion, only part of the settlement should be allocated against available indemnification. Allocation of the total settlement against available indemnification would give rise to increased charges in future reportable periods.
20. Environmental Matters
General
The Company is subject to extensive federal, state, local and foreign laws, regulations, rules and ordinances relating to pollution, protection of the environment and the generation, storage, handling, transportation, treatment, disposal and remediation of hazardous substances and waste materials. In the ordinary course of business, the Company is subject to frequent environmental inspections and monitoring by governmental enforcement authorities. In addition, the Company's production facilities require operating permits that are subject to renewal, modification and, in certain circumstances, revocation. Actual or alleged violations of environmental laws or permit requirements could result in restrictions or prohibitions on plant operations, substantial fines and civil or criminal sanctions. Moreover, changes in environmental regulations could inhibit or interrupt our operations, or require us to change our equipment or operations, and any such changes could have a material adverse effect on our businesses. Accordingly, environmental or regulatory matters may cause the Company to incur significant unanticipated losses, costs or liabilities.
F-150
Environmental Capital Expenditures and Accruals
Certain agreements executed in connection with the 2000 LBO generally provide for indemnification for environmental pollution existing on the date of acquisition. Liabilities are recorded when site restoration and environmental remediation and clean-up obligations are either known or considered probable and can be reasonably estimated. Liabilities are based upon all available facts, existing technology, past experience and cost-sharing and indemnification arrangements (as to which, the Company considers the viability of other parties).
Estimates of ultimate future environmental restoration and remediation costs are inherently imprecise due to currently unknown factors such as the magnitude of possible contamination, the timing and extent of such restoration and remediation, the determination of our liability in proportion to other parties, the extent to which such costs are recoverable from insurance, and the extent to which environmental laws and regulations may change in the future. However, it is not anticipated that any future costs will be material to its results of operations or financial position as a result of compliance with current environmental laws and regulations.
Potential Liabilities
Given the nature of the Company's business, violations of environmental laws may result in restrictions imposed on its operating activities, substantial fines, penalties, damages or other costs, any of which could have a material adverse effect on the Company's business, financial condition, results of operations or cash flows. The Company is aware of the following matters and believes the ultimate resolution of these matters will not have a material impact on its results of operations or financial position:
Some of the Company's manufacturing sites have an extended history of industrial chemical manufacturing and use, including on-site waste disposal. The Company is aware of soil, groundwater and surface water contamination from past operations at some of its sites, and it may find contamination at other sites in the future. For example, the Company is aware that there is significant contamination, largely related to a landfill and lagoons, at its McIntosh, Alabama plant site. Further, soil and groundwater contamination have been identified at its plants in Duxford, U.K. and Monthey, Switzerland. The contamination at Duxford affects groundwater which is part of a major aquifer used as a source of process and drinking water on-site. Pursuant to certain agreements executed in connection with the 2000 LBO, the Company expects that Ciba will have primary financial responsibility for such matters, although it may be required to contribute to the costs of remediation in certain instances. Based on available information and the indemnification rights the Company believes are likely to be available, the Company believes that the costs to investigate and remediate known contamination will not have a material adverse effect on its business, financial condition, results of operations or cash flows; however, if such indemnities are unavailable or do not fully cover the costs of investigation and remediation or the Company is required to contribute to such costs, and if such costs are material, then such expenditures may have a material adverse effect on the Company's business, financial condition, results of operations or cash flows.
Under the European Union ("EU") Integrated Pollution Prevention and Control Directive ("IPPC"), EU member governments are to adopt rules and implement a cross-media (air, water, waste) environmental permitting program for individual facilities. The U.K. was the first EU member government to request IPPC permit applications from the Company's affiliates. In the U.K., affiliates
F-151
have submitted several applications and, very recently, negotiated and received their first IPPC permits. The Company's affiliates also have other IPPC permits under review by the U.K. Environment Agency. The Company is not yet in a position to know with certainty what the U.K. IPPC permits applicable to us will require, and it is possible that the costs of compliance could be material; however, management believes, based upon its experience to date, that the costs of compliance with IPPC permitting in the U.K. will not be material to the Company's financial condition, results of operations or cash flows. Additionally, the IPPC directive has recently been implemented in France, and like the operations in the U.K., the Company does not anticipate having to make material capital expenditures to comply.
With respect to the Company's facilities in other EU jurisdictions, IPPC implementing legislation is not yet in effect, or the Company has not yet been required to seek IPPC permits. Accordingly, while the Company expects to incur additional future costs for capital improvements and general compliance under IPPC requirements in these jurisdictions, at the present time it is unable to determine whether or not these costs will be material. Accordingly, the Company cannot provide assurance that material capital expenditures and compliance costs will not be required in connection with IPPC requirements.
21. Related Party Transactions
The Company shares numerous services and resources with Huntsman LLC. The Company also relies on Huntsman LLC to supply some of its raw materials. During the six months ended December 31, 2003, the Company purchased $3.0 million of raw materials from Huntsman LLC and was allocated operating expenses of $3.2 million from Huntsman LLC. At December 31, 2003, the Company had a current payable to Huntsman LLC of $1.9 million. In 2004, the Company expects to pay approximately $10 million to Huntsman LLC for management services.
Predecessor Company
On February 7, 2003, Vantico received $250,000 in the form of a loan for the purpose of paying legal fees related to refinancing. The loan was due to be repaid by July 31, 2003 and bore interest at 20% per annum. The loan was received from MatlinPatterson, majority owners of the Vantico Senior Notes and was exchanged for equity in the Company's parent on June 30, 2003.
Vantico received three additional loans from MatlinPatterson of $150,000, $100,000 and $164,354 on February 26, 2003, March 21, 2003, and April 15, 2003, respectively, all of which were exchanged for equity in AdMat Holdings.
On April 22, 2003 and April 23, 2003, Vantico received bridge loans of CHF 720,000 ($525,164) and CHF 7,280,000 ($5,296,086), respectively. The loans were received from various funds managed by SISU and MatlinPatterson, respectively. These bridge loans bore interest at a rate equal to the "Term C Loan Facility" under the Vantico Senior Credit Facilities and were exchanged for equity in AdMat Holdings.
On May 20, 2003 and May 23, 2003, Vantico received additional bridge loans of CHF 6,370,000 ($4,935,689) and CHF 630,000 ($488,979), respectively. These bridge loans were received from MatlinPatterson and SISU, respectively, and bore interest at a rate equal to the "Term C Loan Facility" under the Vantico Senior Credit Facilities. These loans were exchanged for equity in AdMat Holdings.
In 2002 and 2001 Vantico had accrued expenses due to MGPE of approximately $3 million and $3 million, respectively, in respect of professional charges incurred on behalf of the Company.
F-152
On February 1, 2002, Vantico and its parent, Vantico Holding S.A., reached agreement with MGPE on additional equity funding from a rights offering. In advance of any such offering, Vantico secured a bridge facility of CHF 75 million, of which CHF 50 million had been drawn down. The indebtedness under the Bridge Facility was exchanged for equity in AdMat Holdings.
Transactions with Equity Affiliates
The Company and Vantico purchased approximately $4 million, $5 million, $5 million and $5 million of inventory from Tamilnadu Petroproducts Limited (the 24% owner of the Company's 76% owned Indian subsidiary) during the six months ended December 31, 2003 and June 30, 2003, and the year ended December 31, 2002 and 2001, respectively.
As of December 31, 2003 and 2002, the Company had payables to Tamilnadu Petroproducts Limited of approximately $1 million and $1 million, respectively.
22. Lease Commitments
The Company leases certain facilities and equipment under operating leases. Rental expense of the Company amounted to $3.7 million and $3.7 million for the six months ended June 30, 2003 and December 31, 2003, and $10 million and $12 million for the years ended December 31, 2002 and 2001, respectively. Future minimum lease payments under operating leases as of December 31, 2003 are as follows (dollars in millions):
| Year ending December 31: | ||||
| 2004 | $ | 3.4 | ||
| 2005 | 2.5 | |||
| 2006 | 1.9 | |||
| 2007 | 1.8 | |||
| 2008 | 1.7 | |||
| Thereafter | 1.0 | |||
| Total | $ | 12.3 | ||
23. Predecessor Company Share Capital
Vantico Group S.A. was incorporated with an issued share capital of €31,000 divided into 310 ordinary shares of €100 each, fully subscribed. On May 23, 2000, the share capital was redenominated in CHF and the subscribed and issued share capital was increased to CHF 2.50 each. On May 30, 2000, the subscribed and issued share capital was further increased to CHF 618.0 million ($366 million) divided into 247,200,000 ordinary shares of CHF 2.50 each.
On August 14, 2002, the existing shares were converted into shares without nominal value, the subscribed and issued share capital was further increased to CHF 669.2 million ($400 million) by the creation and issuance of 20,541,400 new ordinary shares without nominal value. These shares were fully paid by a contribution in-kind consisting of 2,000 shares of Vantico Ltd., a company incorporated in Gibraltar.
F-153
On December 31, 2002, the subscribed and issued share capital amounts to $400 million divided into 267,741,400 ordinary shares without nominal value.
On June 30, 2003, in connection with the AdMat Transaction, the equity of Vantico was transferred to the Company in exchange for substantially all of the issued and outstanding Vantico Senior Notes and approximately $165 million of additional equity.
24. Business Segment and Geographic Data
Vantico had three reportable business segments: Polymer Specialties, Optronics, and Adhesives and Tooling. Each business segment developed, manufactured and marketed different products and services, and was managed separately as each required different technology and marketing strategies.
The Polymer Specialties business segment produced epoxy resins and selected hardeners. The resins are supplied primarily to the paint and construction chemicals industries, the marine and maintenance industries, and the composites business serves the aerospace, automotive and sports equipment markets. The Optronics business segment produced epoxy insulation systems used for low and high voltage components and in the manufacture of electronic components. The products are used by the electrical industry, electrical and electronic component manufacturers and printed circuit board manufacturers. The Adhesives and Tooling business segment produced adhesives and tooling products for the automotive and aerospace industries, as well as other industries. Vantico evaluated the performance of its reportable business segments based on operating income before all corporate related items, fair value adjustments arising from the application of the May 31, 2000 purchase price allocation, contract settlement credits and charges, litigation charges and certain other net expenses not allocated to reportable business segments.
In connection with the AdMat Transaction, the Company reorganized its operations and has one reportable business segment.
Business Segment Data (dollars in millions):
| |
Predecessor Company |
||||||||
|---|---|---|---|---|---|---|---|---|---|
| |
For the Six Months Ended June 30, 2003 |
For the Year Ended December 31, 2002 |
For the Year Ended December 31, 2001 |
||||||
| Net sales | |||||||||
| Polymer Specialties | $ | 397.8 | $ | 709.0 | $ | 722.0 | |||
| Optronics | 24.2 | 51.0 | 53.0 | ||||||
| Adhesives and Tooling | 109.8 | 189.0 | 174.0 | ||||||
| Total | $ | 531.8 | $ | 949.0 | $ | 949.0 | |||
F-154
| |
Predecessor Company |
|||||||||
|---|---|---|---|---|---|---|---|---|---|---|
For the Six Months Ended June 30, 2003 |
For the Year Ended December 31, 2002 |
For the Year Ended December 31, 2001 |
||||||||
| Operating loss | ||||||||||
| Polymer Specialties | $ | 31.5 | $ | 44.0 | $ | 80.0 | ||||
| Optronics | (1.0 | ) | (28.0 | ) | (4.0 | ) | ||||
| Adhesives and Tooling | 13.0 | 26.0 | 32.0 | |||||||
| Unallocated charges and fair value adjustments(1) | (91.0 | ) | (124.0 | ) | (109.0 | ) | ||||
| Restructuring charges(1) | — | — | (8.0 | ) | ||||||
| Contract settlement credits and charges, net(1) | (5.5 | ) | 9.0 | — | ||||||
| Litigation charges(1) | — | — | (25.0 | ) | ||||||
| Total | $ | (53.0 | ) | $ | (73.0 | ) | $ | (34.0 | ) | |
| Depreciation and amortization | ||||||||||
| Polymer Specialties | $ | 16.8 | $ | 33.0 | $ | 26.0 | ||||
| Optronics | 0.3 | 1.0 | 1.0 | |||||||
| Adhesives and Tooling | 2.8 | 5.0 | 5.0 | |||||||
| Unallocated charges and fair value adjustments(1) | 8.9 | 20.0 | 22.0 | |||||||
| Total | $ | 28.8 | $ | 59.0 | $ | 54.0 | ||||
| Capital expenditures | ||||||||||
| Polymer Specialties | $ | 5.1 | $ | 19.0 | $ | 44.0 | ||||
| Optronics | 0.1 | 1.0 | 3.0 | |||||||
| Adhesives and Tooling | 0.8 | 4.0 | 3.0 | |||||||
| Total(2) | $ | 6.0 | $ | 24.0 | $ | 50.0 | ||||
| |
Predecessor Company |
||||||||
|---|---|---|---|---|---|---|---|---|---|
| |
June 30, 2003 |
December 31, 2002 |
December 31, 2001 |
||||||
| Total assets | |||||||||
| Operating assets of business segments: | |||||||||
| Polymer Specialities | $ | 665.6 | $ | 677.0 | $ | 713.0 | |||
| Optronics | 24.9 | 40.0 | 47.0 | ||||||
| Adhesives and Tooling | 238.9 | 184.0 | 167.0 | ||||||
| Shared assets not allocated to business segments | 104.7 | 149.0 | 181.0 | ||||||
| Total | $ | 1,034.1 | $ | 1,050.0 | $ | 1,108.0 | |||
F-155
Polymer Specialties business in Switzerland and maintenance of production sites to implement our business strategy regarding operations and health and safety.
| |
Predecessor Company |
||||||||
|---|---|---|---|---|---|---|---|---|---|
For the Six Months Ended June 30, 2003 |
For the Year Ended December 31, 2002 |
For the Year Ended December 31, 2001 |
|||||||
| Corporate and other related items | $ | 63.5 | $ | 82.0 | $ | 48.0 | |||
| Corporate reorganization costs | 27.5 | 22.0 | 39.0 | ||||||
| Depreciation of fair value adjustment to property, plant and equipment | — | 14.0 | 12.0 | ||||||
| Amortization of goodwill and other intangible assets | — | 6.0 | 10.0 | ||||||
| Unallocated charges and fair value adjustments | 91.0 | 124.0 | 109.0 | ||||||
| Restructuring charges | — | — | 8.0 | ||||||
| Lititgation charges | — | — | 25.0 | ||||||
| Contract settlement credits and charges, net | 5.5 | (9.0 | ) | — | |||||
| Total charges not allocated to business segments | $ | 96.5 | $ | 115.0 | $ | 142.0 | |||
F-156
Geographic Data
| |
|
Predecessor Company |
||||||||||
|---|---|---|---|---|---|---|---|---|---|---|---|---|
| |
For the Six Months Ended December 31, 2003 |
For the Six Months Ended June 30, 2003 |
For the Year Ended December 31, 2002 |
For the Year Ended December 31, 2001 |
||||||||
| Net sales to customers | ||||||||||||
| Europe | ||||||||||||
| Germany | $ | 68.7 | $ | 68.7 | $ | 115.0 | $ | 140.0 | ||||
| United Kingdom | 32.7 | 32.7 | 57.0 | 64.0 | ||||||||
| France | 26.7 | 30.0 | 51.0 | 45.0 | ||||||||
| Italy | 22.9 | 25.4 | 39.0 | 32.0 | ||||||||
| Rest of European Union | 81.8 | 88.9 | 147.0 | 117.0 | ||||||||
| Switzerland | 19.3 | 22.5 | 37.0 | 31.0 | ||||||||
| Rest of Europe | 12.1 | 16.6 | 27.0 | 26.0 | ||||||||
| Total | 264.2 | 284.8 | 473.0 | 455.0 | ||||||||
| Western Hemisphere | ||||||||||||
| North America | 99.6 | 104.7 | 211.0 | 247.0 | ||||||||
| South America | 18.1 | 17.1 | 38.0 | 44.0 | ||||||||
| Central America | 3.1 | 2.5 | 5.0 | 8.0 | ||||||||
| Total | 120.8 | 124.3 | 254.0 | 299.0 | ||||||||
| Eastern Hemisphere | ||||||||||||
| Japan | 16.2 | 16.3 | 32.0 | 31.0 | ||||||||
| China | 41.4 | 49.7 | 94.0 | 78.0 | ||||||||
| Rest of Asia | 47.8 | 40.8 | 66.0 | 59.0 | ||||||||
| Australia and New Zealand | 7.7 | 6.2 | 11.0 | 10.0 | ||||||||
| Africa and Middle East | 19.7 | 9.7 | 19.0 | 17.0 | ||||||||
| Total | 132.8 | 122.7 | 222.0 | 195.0 | ||||||||
| Total net sales to customers | $ | 517.8 | $ | 531.8 | $ | 949.0 | $ | 949.0 | ||||
F-157
Revenues from customers are based on the final destination of the sale.
| |
|
Predecessor Company |
|||||
|---|---|---|---|---|---|---|---|
| |
December 31, 2003 |
December 31, 2002 |
|||||
| Long-lived assets | |||||||
| Europe | |||||||
| Germany | $ | 23.9 | $ | 16.0 | |||
| United Kingdom | 25.0 | 42.0 | |||||
| France | 2.3 | 2.0 | |||||
| Rest of European Union | 15.5 | 19.0 | |||||
| Switzerland | 173.2 | 174.0 | |||||
| Total | 239.9 | 253.0 | |||||
| Western Hemisphere | |||||||
| North America | 108.6 | 111.0 | |||||
| South America | 7.7 | 6.0 | |||||
| Total | 116.3 | 117.0 | |||||
| Eastern Hemisphere | |||||||
| Japan | 1.9 | 2.0 | |||||
| China | 17.5 | 21.0 | |||||
| Rest of Asia | 3.2 | 5.0 | |||||
| Australia and New Zealand | 1.6 | 1.0 | |||||
| Africa and Middle East | 13.7 | 1.0 | |||||
| Total | 37.9 | 30.0 | |||||
| Total long-lived assets | $ | 394.1 | $ | 400.0 | |||
Long-lived assets represent property, plant and equipment, net, and are shown by the location of the assets. Goodwill, other intangible assets and corporate assets are not fully allocated to operating subsidiaries, and therefore, such assets are not represented in the above table of long-lived assets by geographical location.
25. Restatements
In the course of preparing a registration statement in October 2004 for the proposed initial public offering of the common stock of the Company's ultimate parent, the Company determined to reclassify certain amounts in its consolidated statements of equity and cash flows for the six months ended December 31, 2003, to accurately reflect (i) the effects of foreign currency exchange gains and losses and (ii) the initial restructuring of Vantico. Conforming changes were also made in Note 1 to the consolidated financial statements. As a result, the Company restated its consolidated statements of equity and cash flows for the six months ended December 31, 2003. There was no change in the line
F-158
"Cash or Cash Equivalents" due to this restatement. A summary of the significant effects of this restatement on our consolidated fianncial statements is provided below (dollars in millions):
Consolidated Statements of Equity
| Affected Item |
As previously reported |
As restated |
|||||
|---|---|---|---|---|---|---|---|
| Cash contribution from parent | $ | 138.1 | $ | 164.4 | |||
| Capital contribution from parent related to exchange of debt for parent company equity (renamed "Contribution of Vantico debt, at fair value") | 94.9 | 67.8 | |||||
| Expense associated with raising equity capital | (10.9 | ) | (10.1 | ) | |||
Consolidated Statements of Cash Flow
| |
Six months ended December 31, 2003 |
||||||
|---|---|---|---|---|---|---|---|
| Affected Item |
As previously reported |
As restated |
|||||
| Net cash provided by operating activities | $ | 13.0 | $ | 12.2 | |||
| Net cash used in investing activities | (396.4 | ) | (426.0 | ) | |||
| Net cash provided by financing activities | 468.4 | 484.6 | |||||
| Effect of exchange rate changes in cash | (11.8 | ) | 2.4 | ||||
26. Selected Quarterly Financial Data (Unaudited) (Dollars in millions)
| |
Predecessor Company |
AdMat |
|||||||||||||||||
|---|---|---|---|---|---|---|---|---|---|---|---|---|---|---|---|---|---|---|---|
| |
First Quarter |
Second Quarter |
Total |
Third Quarter |
Fourth Quarter |
Total |
|||||||||||||
| 2003 | |||||||||||||||||||
| Revenues | $ | 268.0 | $ | 263.8 | $ | 531.8 | $ | 258.7 | $ | 259.1 | $ | 517.8 | |||||||
| Gross Profit | 66.0 | 53.1 | 119.1 | 56.7 | 50.3 | 107.0 | |||||||||||||
| Operating income (loss) | (11.0 | ) | (42.0 | ) | (53.0 | ) | 5.9 | 5.4 | 11.3 | ||||||||||
| Net loss | (30.0 | ) | (47.9 | ) | (77.9 | ) | (4.2 | ) | (9.1 | ) | (13.3 | ) | |||||||
| |
Predecessor Company |
|||||||||||||||
|---|---|---|---|---|---|---|---|---|---|---|---|---|---|---|---|---|
First Quarter |
Second Quarter |
Third Quarter |
Fourth Quarter |
Total |
||||||||||||
| 2002 | ||||||||||||||||
| Revenues | $ | 229.0 | $ | 245.0 | $ | 241.0 | $ | 234.0 | $ | 949.0 | ||||||
| Gross Profit | 59.0 | 67.0 | 65.0 | 51.0 | 242.0 | |||||||||||
| Operating income (loss) | 4.0 | 2.0 | (5.0 | ) | (74.0 | ) | (73.0 | ) | ||||||||
| Net loss | (16.0 | ) | (21.0 | ) | (22.0 | ) | (92.0 | ) | (151.0 | ) | ||||||
F-159
HUNTSMAN INTERNATIONAL HOLDINGS, LLC AND SUBSIDIARIES
CONSOLIDATED CONDENSED BALANCE SHEETS (UNAUDITED) (Dollars in Millions)
| |
March 31, 2003 |
December 31, 2002 |
|||||||
|---|---|---|---|---|---|---|---|---|---|
| ASSETS | |||||||||
Current assets: |
|||||||||
| Cash and cash equivalents | $ | 49.3 | $ | 75.4 | |||||
| Accounts and notes receivables (net of allowance for doubtful accounts of $16.3 and $14.5, respectively) | 548.9 | 467.9 | |||||||
| Inventories | 600.2 | 561.3 | |||||||
| Prepaid expenses | 16.7 | 22.0 | |||||||
| Deferred income taxes | 31.2 | 31.2 | |||||||
| Other current assets | 71.5 | 75.4 | |||||||
| Total current assets | 1,317.8 | 1,233.2 | |||||||
Property, plant and equipment, net |
3,049.8 |
3,071.1 |
|||||||
| Investment in unconsolidated affiliates | 135.3 | 133.9 | |||||||
| Intangible assets, net | 259.3 | 266.4 | |||||||
| Other noncurrent assets | 338.9 | 339.5 | |||||||
| Total assets | $ | 5,101.1 | $ | 5,044.1 | |||||
LIABILITIES AND EQUITY |
|||||||||
Current liabilities: |
|||||||||
| Accounts payable | $ | 324.5 | $ | 314.8 | |||||
| Accrued liabilities | 482.2 | 523.8 | |||||||
| Current portion of long-term debt | 1.3 | 43.9 | |||||||
| Other current liabilities | 29.4 | 29.6 | |||||||
| Total current liabilities | 837.4 | 912.1 | |||||||
| Long-term debt | 3,639.6 | 3,420.6 | |||||||
| Deferred income taxes | 207.9 | 215.1 | |||||||
| Other noncurrent liabilities | 148.8 | 158.4 | |||||||
| Total liabilities | 4,833.7 | 4,706.2 | |||||||
Commitments and contingencies (Notes 15 and 16) |
|||||||||
Equity: |
|||||||||
| Members' equity, 1,000 units | 565.5 | 565.5 | |||||||
| Retained earnings | (155.8 | ) | (80.2 | ) | |||||
| Accumulated other comprehensive loss | (142.3 | ) | (147.4 | ) | |||||
| Total equity | 267.4 | 337.9 | |||||||
| Total liabilities and equity | $ | 5,101.1 | $ | 5,044.1 | |||||
See accompanying notes to consolidated financial statements.
F-160
HUNTSMAN INTERNATIONAL HOLDINGS LLC AND SUBSIDIARIES
CONSOLIDATED CONDENSED STATEMENTS OF OPERATIONS AND
COMPREHENSIVE LOSS (UNAUDITED) (Dollars in Millions)
| |
Three Months Ended March 31, 2003 |
Three Months Ended March 31, 2002 |
|||||||
|---|---|---|---|---|---|---|---|---|---|
| Revenues: | |||||||||
| Trade sales and services | $ | 1,188.8 | $ | 921.1 | |||||
| Related party sales | 100.5 | 76.3 | |||||||
| Tolling fees | 8.4 | 0.5 | |||||||
| Total revenues | 1,297.7 | 997.9 | |||||||
| Cost of goods sold | 1,162.3 | 872.4 | |||||||
| Gross profit | 135.4 | 125.5 | |||||||
Expenses: |
|||||||||
| Selling, general and administrative | 88.6 | 85.3 | |||||||
| Research and development | 12.2 | 12.3 | |||||||
| Restructuring and plant closing costs | 17.1 | — | |||||||
| Total expenses | 117.9 | 97.6 | |||||||
| Operating income | 17.5 | 27.9 | |||||||
Interest expense |
(90.0 |
) |
(75.7 |
) |
|||||
| Interest income | 0.8 | — | |||||||
| Loss on sale of accounts receivable | (9.6 | ) | (3.6 | ) | |||||
| Other income (expense) | (2.2 | ) | 0.4 | ||||||
| Loss before income taxes | (83.5 | ) | (51.0 | ) | |||||
| Income tax benefit | 7.9 | 20.4 | |||||||
| Minority interests in subsidiaries' loss | — | (0.8 | ) | ||||||
| Net income (loss) | (75.6 | ) | (31.4 | ) | |||||
Other comprehensive income (loss) |
5.1 |
(20.9 |
) |
||||||
Comprehensive loss |
$ |
(70.5 |
) |
$ |
(52.3 |
) |
|||
See accompanying notes to consolidated financial statements.
F-161
HUNTSMAN INTERNATIONAL HOLDINGS LLC AND SUBSIDIARIES
CONSOLIDATED STATEMENT OF CHANGES IN MEMBERS' EQUITY (UNAUDITED)
(Dollars in Millions)
| |
Members' Equity |
|
|
|
|||||||||||
|---|---|---|---|---|---|---|---|---|---|---|---|---|---|---|---|
| |
|
Accumulated Other Comprehensive Loss |
|
||||||||||||
| |
Shares/ Units |
Amount |
Retained Earnings |
Total |
|||||||||||
| Balance, January 1, 2003 | 1,000 | $ | 565.5 | $ | (80.2 | ) | $ | (147.4 | ) | $ | 337.9 | ||||
Net loss |
— |
(75.6 |
) |
— |
(75.6 |
) |
|||||||||
| Other comprehensive income | — | — | 5.1 | 5.1 | |||||||||||
Balance, March 31, 2003 |
1,000 |
$ |
565.5 |
$ |
(155.8 |
) |
$ |
(142.3 |
) |
$ |
267.4 |
||||
See accompany notes to consolidated financial statements.
F-162
HUNTSMAN INTERNATIONAL HOLDINGS LLC AND SUBSIDIARIES
CONSOLIDATED CONDENSED STATEMENTS OF CASH FLOWS (UNAUDITED)
(Dollars in Millions)
| |
Three Months Ended March 31, 2003 |
Three Months Ended March 31, 2002 |
||||||
|---|---|---|---|---|---|---|---|---|
| Net cash used in operating activities | (133.2 | ) | (26.0 | ) | ||||
Investing Activities: |
||||||||
| Capital expenditures | (21.8 | ) | (47.2 | ) | ||||
| Net cash received from unconsolidated affiliates | — | 0.9 | ||||||
| Advances to unconsolidated affiliates | (2.0 | ) | (0.7 | ) | ||||
| Proceds from sale of fixed assets | 1.2 | — | ||||||
| Net cash used in investing activities | (22.6 | ) | (47.0 | ) | ||||
| Financing Activities: | ||||||||
| Net borrowings under revolving loan facilities | $ | 134.2 | $ | 95.0 | ||||
| Issuance of senior notes | — | 300.0 | ||||||
| Repayment of long-term debt | (1.4 | ) | (343.5 | ) | ||||
| Debt issuance costs | — | (9.6 | ) | |||||
| Net cash provided by financing activities | 132.8 | 41.9 | ||||||
Effect of exchange rate changes on cash |
(3.1 |
) |
3.1 |
|||||
Decrease in cash and cash equivalents |
(26.1 |
) |
(28.0 |
) |
||||
| Cash and cash equivalents at beginning of period | 75.4 | 83.9 | ||||||
| Cash and cash equivalents at end of period | $ | 49.3 | $ | 55.9 | ||||
Supplemental cash flow information: |
||||||||
| Cash paid for interest | 83.5 | 76.7 | ||||||
| Cash paid for income taxes | 3.4 | 1.0 | ||||||
See accompanying notes to consolidated financial statements.
F-163
HUNTSMAN INTERNATIONAL HOLDINGS LLC AND SUBSIDIARIES
NOTES TO CONSOLIDATED FINANCIAL STATEMENTS (UNAUDITED)
1. General
Description of Business
Huntsman International Holdings LLC and its subsidiaries (collectively, the "Company") are global manufacturers and marketers of differentiated and commodity chemicals. The Company is a Delaware limited liability company and its membership interests are owned 60% by Huntsman Specialty Chemicals Corporation ("Huntsman Specialty") and 40% by HMP Equity Holdings Corporation ("HMP"). The Company's direct wholly-owned operating subsidiary is Huntsman International LLC, a Delaware limited liability company ("HI").
Huntsman Specialty, a Delaware corporation, is owned 100% by Huntsman Specialty Chemicals Holdings Corporation, a Utah corporation ("HSCHC"), and HSCHC is owned 100% by Huntsman LLC. Huntsman LLC, a Utah limited liability company, is owned 100% by HMP. HMP is a Delaware corporation and is owned 100% by Huntsman Group Inc., a Delaware corporation. Huntsman Group Inc. is owned 100% by Huntsman Holdings, LLC ("Huntsman Holdings"), a Delaware limited liability company. The voting membership interests of Huntsman Holdings are owned by the Huntsman family, MatlinPatterson Global Opportunities Partners, L.P. ("GOP"), Consolidated Press (Finance) Limited ("CPH") and certain members of the Company's senior management. In addition, Huntsman Holdings has issued certain non-voting preferred units to Huntsman Holdings Preferred Member LLC, which, in turn, is owned by GOP (indirectly), CPH, the Huntsman Cancer Foundation, certain members of the Company's senior management and certain members of the Huntsman family. The Huntsman family has board and operational control of the Company.
The Company operates through four principal operating segments: Polyurethanes, Performance Products, Pigments and Base Chemicals.
Interim Financial Statements
The accompanying consolidated financial statements of the Company are unaudited. However, in management's opinion, all adjustments, consisting only of normal recurring adjustments necessary for a fair presentation of results of operations, financial position and cash flows for the periods shown, have been made. Results for interim periods are not necessarily indicative of those to be expected for the full year. These consolidated financial statements should be read in conjunction with the audited consolidated financial statements and notes to consolidated financial statements for the year ended December 31, 2002 included elsewhere herein.
2. Summary of Significant Accounting Policies
Principles of Consolidation
The consolidated financial statements of the Company include its majority-owned subsidiaries. Intercompany transactions and balances are eliminated.
Use of Estimates
The preparation of financial statements in conformity with accounting principles generally accepted in the United States of America requires management to make estimates and assumptions that affect the reported amounts of assets and liabilities and disclosure of contingent assets and liabilities at the date of the financial statements and the reported amounts of revenues and expenses during the reporting period. Actual results could differ from those estimates.
F-164
Cash Flow Information
Highly liquid investments with an original maturity of three months or less when purchased are considered to be cash equivalents.
Securitization of Accounts Receivable
The Company securitizes certain trade receivables in connection with a revolving securitization program. The Company retains the servicing rights which are a retained interest in the securitized receivables. Losses are recorded on the sale and are based on the carrying value of the receivables as allocated between the receivables sold and the retained interests and their relative fair value at the date of the transfer. In accordance with the agreements governing the securitization program, an unconsolidated special purpose entity enters into certain foreign exchange forward contracts for periods aligned with the average maturity of receivables sold into the program. The periodic gains and losses associated with such contracts are recorded by the Company as part of the loss on sale of receivables. Retained interests are carried at fair value which is estimated based on the present value of expected cash flows, calculated using management's best estimates of key assumptions, including credit losses and discount rates commensurate with the risks involved. For more information, see "Note 13—Securitization of Accounts Receivable."
Inventories
Inventories are stated at the lower of cost or market value using the weighted average method.
Property, Plant and Equipment
Property, plant and equipment is stated at cost. Depreciation is provided utilizing the straight line method over the estimated useful lives of the assets ranging from 3 to 20 years. Upon disposal of assets, the cost and related accumulated depreciation are removed from the accounts and the resulting gain or loss is included in income.
Periodic maintenance and repairs applicable to major units of manufacturing facilities are accounted for on the prepaid basis by capitalizing the costs of the turnaround and amortizing the costs over the estimated period until the next turnaround. Normal maintenance and repairs of all other plant and equipment are charged to expense as incurred. Renewals, betterments and major repairs that materially extend the useful life of the assets are capitalized, and the assets replaced, if any, are retired.
Interest costs are capitalized as part of major construction projects. Interest expense capitalized as part of plant and equipment was $1.2 million and $2.9 million for the three months ended March 31, 2003 and 2002, respectively.
Investment in Unconsolidated Affiliates
Investments in companies in which the Company exercises significant influence, generally ownership interests from 20% to 50%, are accounted for using the equity method.
Intangible Assets
Intangible assets, which consist of patents, trademarks, technology and certain other agreements, are stated at their fair market values at the time of acquisition, and are amortized using the straight line method over their estimated useful lives of five to fifteen years or over the life of the related agreement.
F-165
Carrying Value of Long-term Assets
The Company evaluates the carrying value of long-term assets based upon current and anticipated undiscounted cash flows and recognizes an impairment when such estimated cash flows will be less than the carrying value of the asset. Measurement of the amount of impairment, if any, is based upon the difference between carrying value and fair value.
Derivatives and Hedging Activities
The Company enters into derivative contracts, from time to time, such as (1) interest rate swaps, collars and options, (2) short-term foreign currency derivative instruments, and (3) commodity futures and swaps in an attempt to manage downside risks of interest rates, foreign currency rates, and commodity prices. Interest rate contracts that are designated as cash flow hedges for future interest payments and commodity price contracts that are designated as cash flow hedges for future inventory purchases are recorded at fair value in the balance sheet, and accumulated other comprehensive income (loss) to the extent of the effective portions of the hedging instruments. Gains and losses related to interest rate and commodity contracts will be reclassified from other comprehensive income (loss) into earnings in the periods in which the related hedged instrument payments are made, and are reflected as interest expense and cost of goods sold, respectively, in the statement of operations. Commodity price contracts that are designated as fair value hedges for future inventory sales are recorded at fair value in the balance sheet. Changes in the fair value of these hedges are matched against the changes in the fair value of the underlying hedged inventory and reflected in cost of goods sold in the statement of operations. Interest rate, commodity, and foreign currency contracts that have not been designated as a hedge are recorded at fair value in the balance sheet with changes in fair value and realized gains (losses) recognized in interest expense, cost of goods sold, and selling, general and administrative expenses, respectively, in the statement of operations.
The Company is exposed to credit losses in the event of nonperformance by a counterparty to the derivative instrument. The Company anticipates, however, that the counterparties will be able to fully satisfy their obligations under the contracts.
The Company hedges its net investment position in euro functional currency entities. To accomplish this, a portion of the Company's debt is euro denominated and designated as a hedge of net investments. Currency effects of these hedges produce net gains (losses) in other comprehensive income loss (foreign currency translation adjustments).
Income Taxes
The Company and its U.S. subsidiaries are organized as limited liability companies. These entities are treated similar to a partnership for U.S. income tax purposes, and therefore are not subject to U.S. federal tax on their income. Subsidiaries outside the U.S. are generally taxed on the income generated in the local country.
Deferred income taxes are provided for temporary differences between financial statement income and taxable income using the asset and liability method in accordance with SFAS No. 109, "Accounting for Income Taxes." The Company does not provide for income taxes or benefits on the undistributed earnings of its international subsidiaries as earnings are reinvested and, in the opinion of management, will continue to be reinvested indefinitely.
Environmental Expenditures
Environmental related restoration and remediation costs are recorded as liabilities and expensed when site restoration and environmental remediation and cleanup obligations are either known or considered probable and the related costs can be reasonably estimated. Other environmental
F-166
expenditures, which are principally maintenance or preventative in nature, are recorded when incurred and are expensed or capitalized as appropriate.
Foreign Currency Translation
Generally, the accounts of the Company's subsidiaries outside of the United States consider local currency to be functional currency. Accordingly, assets and liabilities are translated at rates prevailing at the balance sheet date. Revenues, expenses, gains and losses are translated at a weighted average rate for the period. Cumulative translation adjustments are recorded to equity as a component of accumulated other comprehensive income. Transaction gains and losses are recorded in the statement of operations and were net gains of $0.7 million and net losses of $2.1 million for the three months ended March 31, 2003 and 2002, respectively.
Revenue Recognition
The Company generates revenues through sales in the open market, raw material conversion agreements and long-term supply contracts. The Company recognizes revenue when it is realized or realizable and earned, which is generally when the product is shipped to the customer.
Research and Development
Research and development costs are expensed as incurred.
Earnings per Member Equity Unit
Earnings per member equity unit is not presented because it is not considered meaningful information due to the Company's ownership by affiliates.
Reclassifications
Certain amounts in the consolidated financial statements for prior periods have been reclassified to conform with the current presentation.
Recently Adopted Financial Accounting Standards
On January 1, 2002, the Company adopted SFAS No. 142, "Goodwill and Other Intangible Assets." SFAS No. 142 changes the accounting for goodwill and intangible assets with indefinite lives from an amortization method to an impairment-only approach. Upon adoption of SFAS No. 142, the Company was required to reassess the useful lives of all acquired intangibles and perform an impairment test on goodwill. In the first quarter of 2002, the Company completed the assessment of useful lives and concluded that no adjustment to the amortization period of intangible assets was necessary.
The Company has completed its initial assessment of goodwill impairment as of January 1, 2002 and has concluded that there is no indication of impairment. The Company has elected to test goodwill for impairment annually as of April 1 as required by SFAS No. 142. The annual assessment has been completed as of April 1, 2002 and the Company has concluded that there is no indication of impairment. As of December 31, 2002, the Company had no goodwill on its balance sheet.
On January 1, 2002, the Company adopted SFAS No. 144, "Accounting for the Impairment or Disposal of Long-Lived Assets." This statement establishes a single accounting model for the impairment or disposal of long-lived assets. The impact of adopting this pronouncement was not material.
In August 2001, the Financial Accounting Standards Board ("FASB") issued SFAS No. 143, "Accounting for Asset Retirement Obligations." SFAS No. 143 addresses financial accounting and reporting for obligations associated with the retirement of tangible, long-lived assets and the associated
F-167
asset retirement costs. This statement requires that the fair value of a liability for an asset retirement obligation be recognized in the period in which it is incurred by capitalizing it as part of the carrying amount of the long-lived assets. As required by SFAS No. 143, the Company adopted this new accounting standard on January 1, 2003. The Company believes this statement's impact will not be significant; however, standard-setters continue to debate the statement's applicability to assets where the timing of any ultimate obligation is indefinite.
In April 2002, the FASB issued SFAS No. 145, "Rescission of FASB Statements No. 4, 44 and 64, Amendment of FASB Statement No. 13, and Other Technical Corrections." In addition to amending or rescinding pronouncements to make various technical corrections, clarify meanings or describe applicability, SFAS No. 145 precludes companies from recording gains or losses from extinguishment of debt as an extraordinary item. The Company was required to adopt this statement as of January 1, 2003. The adoption of SFAS No. 145 did not have a material effect on the Company's consolidated financial statements.
In June 2002, the FASB issued SFAS No. 146, "Accounting for Costs Associated With Exit or Disposal Activities." SFAS No. 146 requires recording costs associated with exit or disposal activities at their fair values when a liability has been incurred. Under previous guidance, certain exit costs were accrued upon management's commitment to an exit plan, which is generally before an actual liability has been incurred. We adopted this pronouncement in the first quarter of 2003. The adoption of SFAS No. 146 did not have a material effect on the Company's consolidated financial statements.
In January 2003, the FASB issued Financial Interpretation ("FIN") No. 45, "Guarantor's Accounting and Disclosure Requirements for Guarantees, Including Guarantees of Indebtedness of Others." FIN No. 45 requires recognition of a liability for the obligation undertaken upon issuing a guarantee. This liability would be recorded at the inception date of the guarantee and would be measured at fair value. The disclosure provisions of the interpretation are effective for the financial statements as of December 31, 2002. The liability recognition provisions apply prospectively to any guarantees issued or modified after December 31, 2002. The adoption of FIN No. 45 did not have a material effect on the Company's consolidated financial statements.
3. Inventories
Inventories as of March 31, 2003 and December 31, 2002 consisted of the following (dollars in millions):
| |
March 31, 2003 |
December 31, 2002 |
||||
|---|---|---|---|---|---|---|
| Raw materials | $ | 128.4 | $ | 130.2 | ||
| Work in progress | 22.5 | 25.9 | ||||
| Finished goods | 429.6 | 385.8 | ||||
| Total | 580.5 | 541.9 | ||||
| Materials and supplies | 19.7 | 19.4 | ||||
| Net | $ | 600.2 | $ | 561.3 | ||
F-168
4. Property, Plant and Equipment
The cost and accumulated depreciation of property, plant and equipment are as follows (dollars in millions):
| |
March 31, 2003 |
December 31, 2002 |
|||||
|---|---|---|---|---|---|---|---|
| Land | $ | 43.2 | $ | 42.9 | |||
| Buildings | 177.0 | 157.7 | |||||
| Plant and equipment | 3,459.7 | 3,446.3 | |||||
| Construction in progress | 181.5 | 172.7 | |||||
| Total | 3,861.4 | 3,819.6 | |||||
| Less accumulated depreciation | (811.6 | ) | (748.5 | ) | |||
| Net | $ | 3,049.8 | $ | 3,071.1 | |||
5. Investments in Unconsolidated Affiliates
The Company's ownership percentage and investments in unconsolidated affiliates, primarily manufacturing joint ventures, are as follows (in millions):
| |
March 31, 2003 |
December 31, 2002 |
||||
|---|---|---|---|---|---|---|
| Louisiana Pigment Company, L.P. (50%) | $ | 132.7 | $ | 131.4 | ||
| Rubicon, Inc. (50%) | 1.3 | 1.3 | ||||
| Others | 1.3 | 1.2 | ||||
| Total | $ | 135.3 | $ | 133.9 | ||
6. Intangible Assets
The gross carrying amount and accumulated amortization of intangible assets as of March 31, 2003 were as follows (dollars in millions):
| |
March 31, 2003 |
December 31, 2002 |
|
|||||||||||||||
|---|---|---|---|---|---|---|---|---|---|---|---|---|---|---|---|---|---|---|
| |
Carrying Amount |
Accumulated Amortization |
Net |
Carrying Amount |
Accumulated Amortization |
Net |
||||||||||||
| Patents, trademarks, and technology | $ | 313.1 | $ | 95.8 | $ | 217.3 | $ | 312.3 | $ | 89.9 | $ | 222.4 | ||||||
| Non-compete agreements | 49.1 | 32.9 | 16.2 | 49.1 | 30.9 | 18.2 | ||||||||||||
| Other intangibles | 29.4 | 3.6 | 25.8 | 28.9 | 3.1 | 25.8 | ||||||||||||
| Total | $ | 391.6 | $ | 132.3 | $ | 259.3 | $ | 390.3 | $ | 123.9 | $ | 266.4 | ||||||
F-169
7. Other Noncurrent Assets
Other noncurrent assets consist of the following (in millions):
| |
March 31, 2003 |
December 31, 2002 |
||||
|---|---|---|---|---|---|---|
| Prepaid pension assets | $ | 148.9 | $ | 146.2 | ||
| Debt issuance costs | 66.0 | 60.7 | ||||
| Capitalized turnaround expense | 46.9 | 48.3 | ||||
| Receivables from affiliates | 16.3 | 18.6 | ||||
| Spare parts inventory | 48.6 | 46.2 | ||||
| Other noncurrent assets | 12.2 | 19.5 | ||||
| Total | $ | 338.9 | $ | 339.5 | ||
8. Accrued Liabilities
Accrued liabilities consist of the following (in millions):
| |
March 31, 2003 |
December 31, 2002 |
||||
|---|---|---|---|---|---|---|
| Raw materials and services | $ | 209.0 | $ | 217.7 | ||
| Interest | 39.6 | 61.3 | ||||
| Taxes (income, property and VAT) | 40.0 | 41.4 | ||||
| Payroll, severance and related costs | 75.7 | 67.4 | ||||
| Volume and rebates accruals | 42.9 | 52.5 | ||||
| Restructuring and plant closing costs | 20.0 | 7.1 | ||||
| Other miscellaneous accruals | 55.0 | 76.4 | ||||
| Total | $ | 482.2 | $ | 523.8 | ||
9. Other Noncurrent Liabilities
Other noncurrent liabilities consist of the following (in millions):
| |
March 31, 2003 |
December 31, 2002 |
||||
|---|---|---|---|---|---|---|
| Pension liabilities | $ | 82.1 | $ | 82.3 | ||
| Other postretirement benefits | 11.8 | 10.8 | ||||
| Environmental accruals | 9.2 | 19.3 | ||||
| Payable to affiliate | 38.1 | 37.9 | ||||
| Other noncurrent liabilities | 7.6 | 8.1 | ||||
| Total | $ | 148.8 | $ | 158.4 | ||
10. Restructuring and Plant Closing Costs
As of December 31, 2002, the Company had a reserve for restructuring costs and plant closing costs of $7.1 million recorded in accrued liabilities. The entire amount was related to workforce reductions.
On March 11, 2003, the Company announced that, in its Polyurethanes segment, it is integrating its global flexible products division into its global derivatives division, and it recorded a charge of $17.1 million in the first quarter 2003. This charge relates to a portion of an overall corporate cost
F-170
reduction program that is expected to be implemented and recorded throughout 2003. This $17.1 million charge represents severance and is included in accrued liabilities.
During the three months ended March 31, 2003, the Company made cash payments of approximately $4.2 million. At March 31, 2003 there was $20.0 million remaining in accrued liabilities.
11. Long-term Debt
Long-term debt outstanding as of March 31, 2003 and December 31, 2002 is as follows (dollars in millions):
| |
March 31, 2003 |
December 31, 2002 |
||||||
|---|---|---|---|---|---|---|---|---|
| Senior Secured Credit Facilities: | ||||||||
| Revolving loan facility | $ | 201.2 | $ | 67.0 | ||||
| Term A dollar loan | 109.7 | 109.7 | ||||||
| Term A euro loan (in U.S. dollar equivalent) | 142.6 | 138.5 | ||||||
| Term B loan | 526.3 | 526.3 | ||||||
| Term C loan | 526.3 | 526.3 | ||||||
| Senior Notes | 300.0 | 300.0 | ||||||
| Senior Subordinated Notes | 1,090.9 | 1,076.8 | ||||||
| Senior Discount Notes | 394.6 | 381.8 | ||||||
| Senior Subordinated Discount Notes | 320.8 | 308.9 | ||||||
| Other long-term debt | 28.5 | 29.2 | ||||||
| Subtotal | 3,640.9 | 3,464.5 | ||||||
| Less current portion | (1.3 | ) | (43.9 | ) | ||||
| Total | $ | 3,639.6 | $ | 3,420.6 | ||||
HI Credit Facilities
The revolving loan facility of up to $400 million matures on June 30, 2005 with no scheduled commitment reductions. Both the term A dollar loan and the term A euro loan facilities mature on June 30, 2005, with the next semi-annual payment due in the fourth quarter 2004. The term B loan facility matures on June 30, 2007 and the term C loan facility matures on June 30, 2008. The term B and term C loan facilities require payments in annual installments of $5.48 million each, with the next payments occurring in the second quarter 2005 and the remaining unpaid balances due on final maturity. See "—Senior Notes and Senior Subordinated Notes" below for discussion of the HI Senior Note offering of $150 million, the proceeds of which were primarily used to prepay the next 16 months of scheduled amortization due under the HI Credit Facilities.
Interest rates for the HI Credit Facilities are based upon, at HI's option, either a eurocurrency rate (LIBOR) or a base rate (prime) plus the applicable spread. The applicable spreads vary based on a pricing grid, in the case of eurocurrency based loans, from 1.50% to 4.50% per annum depending on the loan facility and whether specified conditions have been satisfied, and, in the case of base rate loans, from 0.25% to 3.25% per annum. As of March 31, 2003 and December 31, 2002, the average interest rates on the HI Credit Facilities were 6.0% and 5.8%, respectively.
The obligations under the HI Credit Facilities are supported by guarantees of HI's domestic and certain foreign subsidiaries (collectively the "Guarantors") and the Company, as well as pledges of substantially all their assets, including 65% of the voting stock of certain non-U.S. subsidiaries.
The HI Credit Facilities contain covenants relating to incurrence of debt, purchase and sale of assets, limitations on investments, affiliate transactions, change in control provisions and maintenance
F-171
of certain financial ratios. The financial covenants include a leverage ratio, interest coverage ratio, minimum consolidated net worth level and a limit on capital expenditures. The HI Credit Facilities also limit the payment of dividends generally to the amount required by the members to pay income taxes. On February 7, 2003, HI amended the HI Credit Facilities. The amendments resulted in, among other things, changes to certain financial covenants, including the interest coverage ratio and leverage ratio covenants, through the second quarter of 2004. Management believes that HI is in compliance with the covenants of the HI Credit Facilities as of March 31, 2003.
On April 9, 2003, HI amended the HI Credit Facilities to allow prepayment of the next 16 months of amortization with proceeds raised in its $150 million note offering.
Senior Notes and Senior Subordinated Notes
In March 2002, HI issued $300 million 9.875% Senior Notes (collectively with the 2003 Senior Notes, the "Senior Notes"). Interest on the Senior Notes is payable semi-annually and the Senior Notes mature on March 1, 2009. The Senior Notes are fully and unconditionally guaranteed on a joint and several basis by the Guarantors. The Senior Notes may be redeemed, in whole or in part, at any time by HI prior to March 1, 2006 at 100% of the face value plus a "make whole" premium, as defined in the applicable indenture. After March 1, 2006, the Senior Notes may be redeemed, in whole or in part, at a redemption price that declines from 104.937% to 100% after March 1, 2008.
On April 11, 2003, HI sold an additional $150 million in aggregate principal amount of 9.875% Senior Notes due 2009 (the "2003 Senior Notes") in a transaction exempt from the registration requirements of the Securities Act of 1933. The offering was priced at 105.25% plus accrued interest from March 1, 2003. HI used approximately $26 million of the net proceeds to repay part of the revolving portion of the HI Credit Facilities. The balance of the net proceeds was used primarily to prepay the next 16 months of scheduled amortization due under the term portion of the HI Credit Facilities.
HI also has outstanding $600 million and €450 million 10.125% Senior Subordinated Notes (the "Subordinated Notes"). Interest on the Subordinated Notes is payable semi-annually and the Subordinated Notes mature on July 1, 2009. The Subordinated Notes are fully and unconditionally guaranteed on a joint and several basis by the Guarantors. The Subordinated Notes are redeemable (1) on or after July 1, 2004 at 105.063% of the principal amount thereof, declining ratably to par on and after July 1, 2007, and (2) prior to July 1, 2004 at 105.063% of the principal amount thereof, discounted to the redemption date using the treasury rate (for the dollar denominated notes) or the bond rate (for the euro denominated notes) plus 0.50%, plus, in each case, accrued and unpaid interest to the date of redemption.
The Senior Notes and the Subordinated Notes contain covenants relating to the incurrence of debt, limitations on distributions, asset sales and affiliate transactions, among other things. They also contain a change of control provision requiring HI to offer to repurchase the Senior Notes and the Subordinated Notes upon a change of control. Management believes that HI is in compliance with the covenants of the Senior Notes and the Subordinated Notes as of March 31, 2002.
Senior Discount Notes and Senior Subordinated Discount Notes
On June 30, 1999, the Company issued Senior Discount Notes and Senior Subordinated Discount Notes (collectively, the "Discount Notes") to ICI with initial stated values of $242.7 million and $265.3 million, respectively. The Discount Notes are due December 31, 2009. Interest on the Senior Discount Notes will accrue at 13.375% per annum. The Senior Discount Notes are redeemable prior to July 2004 for an amount equal to the net present value of 106.688% of the projected July 1, 2004 accreted value and thereafter at stipulated redemption prices declining to 100% of accreted value in 2007. The Senior Subordinated Discount Notes had a stated rate of 8% that originally was to reset to a
F-172
market rate in June 2002 and can be redeemed at 100% of accreted value at any time until June 30, 2004. On December 21, 2001, the Company and ICI agreed to modify the terms of the Senior Subordinated Discount Notes, including deferring the reset date until September 2004. For financial reporting purposes, the Senior Subordinated Discount Notes were initially recorded at their estimated fair value of $224 million based upon prevailing market rates at June 30, 1999. Interest on the Discount Notes is paid in kind. The Senior Discount Notes contain limits on the incurrence of debt, restricted payments, liens, transactions with affiliates, and merger and sales of assets.
On December 21, 2001, the Company and ICI agreed to modify the terms of the Senior Subordinated Discount Notes. The interest rate reset date was deferred until September 2004. The modification of the terms resulted in a significant decrease in the present value of the future cash flow of the debt and, as a result, the debt was treated effectively as an extinguishment and reissuance of the debt. The debt was recorded using a 16% interest rate, the estimated market rate for the debt as of December 20, 2001. On May 9, 2003, HMP completed the purchase of the Senior Subordinated Discount Notes from ICI. For more information, see "Note 18—Recent Events—Membership Interest Transactions."
12. Derivatives and Hedging Activities
Interest Rate Hedging
Interest rate contracts with a fair value of $20.8 million and $23.4 million were recorded as a component of other noncurrent liabilities as of March 31, 2003 and December 31, 2002, respectively. The fair value of the cash flow hedges and the interest rate contracts not designated as a hedge are $14.0 million and $6.8 million as of March 31, 2003 and $15.6 million and $7.8 million as of December 31, 2002. The changes in fair value of the cash flow hedges resulted in a $0.1 million and a $2.8 million decrease in interest expense and a $1.5 million and a $0.3 million decrease in other comprehensive income (loss) for the three months ended March 31, 2003 and 2002, respectively. The changes in fair value of the interest rate contracts not designated as a hedge resulted in a $1.0 million and a $2.1 million decrease in interest expense for the three months ended March 31, 2003 and 2002, respectively.
Commodity Price Hedging
As of March 31, 2003 the fair value of cash flow commodity price hedging contracts recorded in other current liabilities and other comprehensive income (loss) is $1.9 million. As of December 31, 2002, the fair value of cash flow commodity price hedging contracts was not material.
As of March 31, 2003 commodity price hedging contracts designated as fair value hedges are included in the balance sheet as an increase of $2.2 million to other current assets and a decrease to inventory of $3.1 million. As of December 31, 2002 commodity price hedging contracts designated as fair value hedges are included in the balance sheet as an increase of $0.8 to other current liabilities and an increase to inventory of $0.8 million.
Commodity price contracts not designated as hedges as defined by SFAS No. 133 are reflected in the balance sheet as $2.2 million and $0.5 million in other current assets and liabilities, respectively, as of March 31, 2003 and, $0.8 million and $0.2 million other current assets and liabilities, respectively, as of December 31, 2002.
During the three months ended March 31, 2003 and 2002, the Company recorded a decrease of $0.9 million and an increase of $0.8 million in cost of goods sold related to net gains and losses from settled contracts, net gains and losses in fair value price hedges, and the change in fair value on commodity price hedging contracts not designated as hedges as defined in SFAS No. 133.
F-173
Foreign Currency Rate Hedging
As of March 31, 2003 and December 31, 2002 and for the three months ended March 31, 2003 and 2002, the fair value, change in fair value, and realized gains (losses) of outstanding foreign currency rate hedging contracts is not material.
Net Investment Hedging
Currency effects of net investment hedges produced net losses of approximately $18.4 million and $9.4 million in other comprehensive loss (foreign currency translation adjustments) for the three months ended March 31, 2003 and 2002, respectively. As of March 31, 2003 and December 31, 2002, there was a cumulative net loss of approximately $51.1 million and $32.7 million, respectively.
13. Securitization of Accounts Receivable
On December 21, 2000, the Company initiated a five-year revolving securitization program under which certain trade receivables were and will be transferred to an off balance sheet special purpose entity at a discount. Under the terms of the agreements, the Company and its subsidiaries continue to service the receivables in exchange for a 1% fee of the outstanding receivables, and the Company is subject to recourse provisions. At March 31, 2003, the special purpose entity had outstanding $183 million in medium-term notes ("MTNs") and $100 million in commercial paper.
For the three months ended March 31, 2003 and 2002, new sales totaled approximately $1,002 million and $606 million, respectively, and cash collections reinvested totaled approximately $892 million and $571 million, respectively. Servicing fees received during the first three months of 2003 and 2002 were approximately $1.2 million and $0.7 million, respectively, and are recorded as a reduction in the loss on sale of accounts receivable in the statements of operations. The retained interest in the receivables was approximately $108 million and $112 million, and as of March 31, 2003 and December 31, 2002, respectively. The value of the retained interest is subject to credit and interest rate risk.
The key economic assumptions used in valuing the residual interest at March 31, 2003 are presented below:
| Weighted average life (in months) | 2 | |
| Credit losses (annual rate) | Less than 1% | |
| Discount rate (annual rate) | 5% |
A 10% and 20% adverse change in any of the key economic assumptions would not have a material impact on the fair value of the retained interest. Total receivables over 60 days past due as of March 31, 2003 and December 31, 2002 were $8.8 million and $11.2 million, respectively.
F-174
14. Other Comprehensive Income (loss)
The components of other comprehensive income (loss) are as follows (in millions):
| |
March 31, 2003 |
December 31, 2002 |
|||||||||||
|---|---|---|---|---|---|---|---|---|---|---|---|---|---|
| |
Accumulated income (loss) |
Income (loss) |
Accumulated income (loss) |
Income (loss) |
|||||||||
| Foreign currency translation adjustments | $ | (37.3 | ) | $ | 1.2 | $ | (38.5 | ) | $ | 147.2 | |||
| Additional minimum pension liability | (86.6 | ) | 1.5 | (88.1 | ) | (88.1 | ) | ||||||
| Additional minimum pension liability — unconsolidated affiliate | (5.4 | ) | — | (5.4 | ) | (5.4 | ) | ||||||
| Unrealized loss on securities | (0.9 | ) | 1.8 | (2.7 | ) | (2.7 | ) | ||||||
| Net unrealized loss on derivative instruments | (11.0 | ) | 0.6 | (11.6 | ) | 2.4 | |||||||
| Cumulative effect of accounting change | (1.1 | ) | — | (1.1 | ) | — | |||||||
| Total | $ | (142.3 | ) | $ | 5.1 | $ | (147.4 | ) | $ | 53.4 | |||
15. Commitments and Contingencies
The Company has various purchase commitments for materials and supplies entered into in the ordinary course of business. These agreements extend up to ten years and the purchase price is generally based on market prices subject to certain minimum price provisions.
The Company is involved in litigation from time to time in the ordinary course of its business. In management's opinion, after consideration of indemnification arrangements, none of such litigation is material to the Company's financial condition or results of operations.
16. Environmental Matters
General
The operation of chemical manufacturing plants, the distribution of chemical products and the related production of by-products and wastes entails risk of adverse environmental effects. As a result, the Company is subject to extensive federal, state, local and foreign laws, regulations, rules and ordinances relating to pollution, protection of the environment and the generation, storage, handling, transportation, treatment, disposal and remediation of hazardous substances and waste materials. In the ordinary course of business, the Company is subject to frequent environmental inspections and monitoring by governmental enforcement authorities. In addition, the Company's production facilities require operating permits that are subject to renewal, modification and, in certain circumstances, revocation. Actual or alleged violations of environmental laws or permit requirements could result in restrictions or prohibitions on plant operations, substantial fines and civil or criminal sanctions. Moreover, changes in environmental regulations could inhibit or interrupt the Company's operations, or require it to change its equipment or operations, and any such changes could have a material adverse effect on its businesses. Accordingly, given the Company's businesses, environmental or regulatory matters may cause significant unanticipated losses, costs or liabilities.
Under some environmental laws, the Company may be jointly and severally liable for the costs of environmental contamination on or from its properties and at off-site locations where it disposed of or arranged for the disposal or treatment of hazardous wastes. For example, in the United States under the Comprehensive Environmental Response, Compensation and Liability Act of 1980, as amended, and similar state laws, a current owner or operator of real property may be liable for such costs regardless of whether the owner or operator owned or operated the real property at the time of the release of the hazardous substances and regardless of whether the release or disposal was in compliance with law at the time it occurred. In addition, under the United States Resource
F-175
Conservation and Recovery Act of 1976, as amended, and similar state laws, as the holder of permits to treat or store hazardous wastes, the Company may, under some circumstances, be required to remediate contamination at its properties regardless of when the contamination occurred. Similar laws are being developed or are in effect to varying degrees in other parts of the world, most notably in the European Union ("EU"). For example, in the U.K., the contaminated land regime now provides a detailed framework for the identification, management and remediation of contaminated sites. This law will likely increase governmental scrutiny of the Company's U.K. facilities.
The Company may also incur future costs for capital improvements and general compliance under environmental laws, including costs to acquire, maintain and repair pollution control equipment. Capital expenditures are planned, for example, under national legislation implementing the EU Directive on Integrated Pollution Prevention and Control. Under this directive, the majority of the Company's European plants will, over the next few years, be required to obtain governmental authorizations which will regulate air and water discharges, waste management and other matters relating to the impact of operations on the environment, and to conduct site assessments to evaluate environmental conditions. Although the implementing legislation in most Member States is not yet in effect, it is likely that additional expenditures may be necessary in some cases to meet the requirements of authorizations under this directive. In particular, the Company believes that related expenditures to upgrade its wastewater treatment facilities at several sites may be necessary and associated costs may be material. Wastewater treatment upgrades unrelated to this initiative also are planned at certain facilities. In addition, the Company may also incur material expenditures, beyond currently anticipated expenditures, in complying with EU Directives, including the Directive on Hazardous Waste Incineration, the Seveso II Directive, which governs major accident hazards, as well as the Water Framework Directive. It is also possible that additional expenditures to reduce air emissions at two of the Company's U.K. facilities may be material. Capital expenditures and, to a lesser extent, costs and operating expenses relating to environmental matters will be subject to evolving regulatory requirements and will depend on the timing of the promulgation and enforcement of specific standards which impose requirements on the Company's operations. Therefore, the Company cannot assure you that material capital expenditures beyond those currently anticipated will not be required under environmental laws.
Potential Liabilities
The Company's operations involve the handling, transportation and use of numerous hazardous substances. From time to time, these operations may result in violations under environmental laws including spills or other releases of hazardous substances into the environment. In the event of a catastrophic incident, the Company could incur material costs or experience interruption in its operations as a result of addressing the incident and implementing measures to prevent such incidents in the future. Currently, the Company is aware of the following matters:
The Texas Commission on Environmental Quality (the "TCEQ," formerly the Texas Natural Resource Conservation Commission or TNRCC) has issued certain notices of violation relating to air emissions and wastewater issues at the Company's Port Neches, Texas facility. The Company and the TCEQ have reached a tentative settlement on penalties totaling $352,250, less than $100,000 of which is allocable to the Company's PO/MTBE facility at Port Neches. The settlement will be reviewed by the TCEQ on May 29, 2003, and it is anticipated that it will be approved. Although management does not anticipate it, it is possible that the terms of an air permit, which the Company applied for as a result of the settlement, may cause it to incur costs related to equipment serving this plant and others in the vicinity that could be material.
On October 6, 2002, a leak of sulphuric acid from two tanks located near the Company's Whitehaven, U.K. plant was discovered. About 342 to 347 tonnes of acid were released onto the ground and into the soil near the tanks. Although the Company took immediate steps to contain the
F-176
spillage and recover acid, a quantity of acid reached a nearby beach via a geological fault. The Company believes the tanks were not owned by the Company; however, it did own the acid in the tanks. The EA and the Health and Safety Executive (the "HSE") are investigating the incident, and the HSE has issued three Improvement Notices requiring corrective action. Although the Company can give no assurances, based on currently available information and its understanding of similar investigations and penalties in the past, the Company believes that, if any charges are brought or additional corrective action orders issued and the Company is ultimately found to be legally responsible, the probable penalties would not be material to its financial position or results of operations.
The Company is aware that there is or may be soil or groundwater contamination at some of its facilities resulting from past operations. Based on available information and the indemnification rights (including indemnities provided by Huntsman Specialty, ICI, Rhodia S.A. and The Dow Chemical Company, for the facilities that each of them transferred to the Company), the Company believes that the costs to investigate and remediate known contamination will not have a material adverse effect on its financial condition, results of operations or cash flows; however, it cannot give any assurance that such indemnities will fully cover the costs of investigation and remediation, that it will not be required to contribute to such costs or that such costs will not be material.
By letter dated March 6, 2003, the Company's subsidiary, Huntsman Ethyleneamines Ltd., was notified by the TCEQ of a probable enforcement action arising out of the inspection of the Freeport, Texas facility on December 16-19, 2002. Seven types of violations relating to Texas Clean Air Act requirements were cited. No penalty demand has yet been made by the TCEQ, although penalties are expected.
The Company has established financial reserves relating to environmental restoration and remediation programs, which the Company believes are sufficient for known requirements. Liabilities are recorded when site restoration and environmental remediation and clean-up obligations are either known or considered probable and can be reasonably estimated. These liabilities are based upon all available facts, existing technology, past experience and cost-sharing arrangements (as to which, the Company considers the viability of other parties). A total of approximately $24 million has been accrued related to environmental matters as of March 31, 2003. The Company does not anticipate that, as a result of compliance with current environmental laws and regulations, any future costs in excess of those that have been accrued by the Company will be material to its results of operations or financial position. However, given the nature of the Company's business, violations of environmental laws may result in restrictions imposed on its operating activities, substantial fines, penalties, damages or other costs, any of which could have a material adverse effect on its business, financial condition, results of operations or cash flows.
MTBE Developments
The presence of MTBE in some groundwater supplies in California and other states (primarily due to gasoline leaking from underground storage tanks) and in surface water (primarily from recreational watercraft) has led to public concern about MTBE's potential to contaminate drinking water supplies. Heightened public awareness regarding this issue has resulted in state, federal and foreign initiatives to rescind the federal oxygenate requirements for reformulated gasoline or restrict or prohibit the use of MTBE in particular. For example, the California Air Resources Board adopted regulations that would prohibit the addition of MTBE to gasoline as of January 1, 2004. Certain other states have also taken actions to restrict or eliminate the future use of MTBE. In connection with the proposed ban, the State of California requested that the U.S. Environmental Protection Agency (the "EPA") waive the federal oxygenated fuels requirements of the federal Clean Air Act for gasoline sold in California. The EPA denied the State's request on June 12, 2001. Certain of the state bans have been challenged in court as
F-177
unconstitutional (in light of the Clean Air Act). The Company is unable to predict what the short- and long-term effects of these matters will be.
Bills have been introduced in the U.S. Congress to accomplish similar goals of curtailing or eliminating the oxygenated fuels requirements in the Clean Air Act, or of curtailing MTBE use. To date, no such legislation has become law. Whether a ban or substantial restrictions on MTBE use will become law in the future is unknown at this time.
In addition, on March 20, 2000, the EPA announced its intention, through an advanced notice of proposed rulemaking, to phase out the use of MTBE under authority of the federal Toxic Substances Control Act. In its notice, the EPA also called on the U.S. Congress to restrict the use of MTBE under the Clean Air Act. Any phase-out of or future regulation of MTBE in California (in which a significant amount of MTBE is consumed), in other states, or nationally may result in a significant reduction in demand for MTBE and may result in a material loss in revenues or material costs or expenditures.
In Europe, the European Union (the "EU") issued a final risk assessment report on MTBE on September 20, 2002. While no ban of MTBE was recommended, several risk reduction measures relating to storage and handling of MTBE-containing fuel were recommended. Separate from EU action, Denmark entered into a voluntary agreement with refiners to reduce the sale of MTBE in Denmark. Under the agreement, use of MTBE in 92- and 95-octane gasoline in Denmark ceased by May 1, 2002; however, MTBE will still be an additive in a limited amount of 98-octane gasoline sold in about 100 selected service stations in Denmark.
In the event that there should be a phase-out of MTBE in the United States, the Company believes it will be able to export MTBE to Europe or elsewhere or use its co-product tertiary butyl alcohol ("TBA") to produce saleable products other than MTBE. The Company believes that its low production costs at its PO/MTBE facility will put it in a favorable position relative to other higher cost sources (primarily, on-purpose manufacturing). If the Company opts to produce products other than MTBE, necessary modifications to its facilities may require significant capital expenditures and the sale of the other products may produce a materially lower level of cash flow than the sale of MTBE.
Furthermore, the Company cannot give any assurance that it will not be named in litigation relating to the environmental effects of MTBE or that such litigation will not have a material adverse effect on the Company's business, financial condition, results of operations or cash flows.
17. Operating Segment Information
The Company derives its revenues, earnings and cash flows from the manufacture and sale of a wide variety of differentiated and commodity chemical products. The Company has four reportable operating segments: Polyurethanes, Performance Products, Pigments and Base Chemicals.
The major products of each reportable operating segment are as follows:
| Segment |
Products |
|
|---|---|---|
| Polyurethanes | MDI, TDI, TPU, polyols, aniline, PO, TBA and MTBE | |
| Performance Products | Surfactants, ethyleneamines and other performance chemicals | |
| Pigments | Titanium dioxide | |
| Base Chemicals | Ethylene, propylene, benzene, cyclohexane and paraxylene |
Sales between segments are generally recognized at external market prices. For the three months ended March 31, 2003 and 2002, sales to Imperial Chemical Industries PLC ("ICI") and its affiliates accounted for approximately 6% and 6%, respectively, of consolidated revenues.
F-178
The net sales, operating income and EBITDA for each of the Company's reportable operating segments are as follows (dollars in millions):
| |
Three Months Ended March 31, 2003 |
Three Months Ended March 31, 2002 |
|||||||
|---|---|---|---|---|---|---|---|---|---|
| Net Sales | |||||||||
| Polyurethanes | $ | 554.9 | $ | 463.7 | |||||
| Performance Products | 161.1 | 136.4 | |||||||
| Pigments | 246.1 | 202.2 | |||||||
| Base Chemicals | 372.2 | 213.6 | |||||||
| Eliminations | (36.6 | ) | (18.0 | ) | |||||
| Total | $ | 1,297.7 | $ | 997.9 | |||||
Operating Income (Loss) |
|||||||||
| Polyurethanes | $ | 4.3 | $ | 54.5 | |||||
| Performance Products | (0.6 | ) | 4.7 | ||||||
| Pigments | 13.1 | (0.1 | ) | ||||||
| Base Chemicals | 14.5 | (16.2 | ) | ||||||
| Unallocated and other | (13.8 | ) | (15.0 | ) | |||||
| Total | 17.5 | 27.9 | |||||||
| Non-operating expense | (11.8 | ) | (3.2 | ) | |||||
| Depreciation and amortization | 69.0 | 59.2 | |||||||
| EBITDA(1) | $ | 74.7 | $ | 83.9 | |||||
Segment EBITDA |
|||||||||
| Polyurethanes | $ | 40.2 | $ | 87.2 | |||||
| Performance Products | 2.3 | 6.9 | |||||||
| Pigments | 28.9 | 10.9 | |||||||
| Base Chemicals | 26.5 | (7.5 | ) | ||||||
| Unallocated and other(2) | (23.2 | ) | (13.6 | ) | |||||
| Total | $ | 74.7 | $ | 83.9 | |||||
18. Recent Events
Purchase of Membership Interests
On May 9, 2003, HMP issued senior discount notes (the "HMP Senior Discount Notes"), with warrants to purchase 12% of HMP's fully diluted common stock as of such date. HMP used the proceeds to exercise an option that it held and purchased the 30% membership interest in the Company held indirectly by ICI. HMP also used the proceeds to complete the purchase of the senior subordinated reset discount notes due 2009 of the Company that were originally issued to ICI (the "B Notes"). The B Notes held by HMP will remain outstanding. In addition, HMP used such proceeds to acquire the approximately 9% of the membership interests in the Company from institutional investors. Accordingly, HMP directly owns 40% of the membership interests of the Company and the B Notes.
F-179
HMP indirectly owns the remaining 60% of the Company through its ownership of all of the equity of Huntsman LLC.
As a result of HMP's purchase of the Company's membership interests from ICI, the put option arrangements between Huntsman Specialty and ICI have been effectively terminated.
Huntsman Specialty has pledged a total of 60% of the memberships interests in the Company as collateral under the Huntsman LLC senior secured credit facilities. HMP has separately pledged all of its assets, including the remaining 40% membership interests in the Company, the B Notes and the 100% interest in Huntsman LLC, as collateral under the HMP Senior Discount Notes.
Amendment of HI Credit Facilities
On February 7, 2003, HI amended the HI Credit Facilities. The amendments resulted in, among other things, changes to certain financial covenants, including the "Interest Coverage Ratio" and "Leverage Ratio" covenants, through the second quarter of 2004.
On April 9, 2003, HI amended the HI Credit Facilities to allow prepayment of the next 16 months of amortization with proceeds raised in its $150 million note offering.
2003 Senior Notes Offering
On April 11, 2003, HI sold $150 million in aggregate principal amount of 9.875% Senior Notes due 2009 in a transaction exempt from the registration requirements of the Securities Act of 1933. The offering was priced at 105.25% plus accrued interest from March 1, 2003. HI used approximately $26 million of the net proceeds to repay part of the revolving portion of the HI Credit Facilities. The balance of the net proceeds was used primarily to prepay the next 16 months of scheduled amortization due under the term portion of the HI Credit Facilities.
Continued Cost Reduction Initiatives
On March 11, 2003, the Company announced that, in its Polyurethanes segment, it is integrating its global flexible products division into its global derivatives division and recorded a charge of $17.1 million in the first quarter 2003. This charge relates to a portion of an overall corporate cost reduction program that is expected to be implemented and recorded throughout 2003. This $17.1 million charge represents severance and is included in accrued liabilities.
Possible Transaction Involving Vantico
The Company's parent companies, HMP and Huntsman Holdings, and GOP are involved in a proposed restructuring of Vantico Group S.A. and its subsidiaries (collectively, "Vantico"), a leading European based global epoxy resin producer providing solutions in the fields of innovative coatings, structural composites, adhesives, tooling materials, and electric and electronic insulation. If the proposed restructuring occurs, Vantico would become an affiliate of the Company, but the Company will not own any securities of Vantico and will not be required to make any cash contributions to Vantico. The Company and its affiliates (including HI) may enter into arms-length contractual arrangements with Vantico regarding management, technology and commercial matters, and certain of the current employees of the Company and its affiliates may assume senior positions at Vantico.
Chinese MDI Joint Venture
In January 2003, the Company entered into a joint venture agreement to build an MDI manufacturing plant near Shanghai, China with BASF and three Chinese chemical companies. A feasibility study for the project has been approved by the appropriate Chinese authorities, preliminary engineering work has commenced and a business license was issued on March 7, 2003.
F-180
REPORT OF INDEPENDENT REGISTERED PUBLIC ACCOUNTING FIRM
To the Board of Managers and Members of
Huntsman International Holdings LLC
We have audited the accompanying consolidated balance sheets of Huntsman International Holdings LLC and subsidiaries (the "Company") as of December 31, 2002 and 2001, and the related consolidated statements of operations and comprehensive loss, members' equity, and cash flows for each of the three years in the period ended December 31, 2002. These financial statements and financial statement schedule are the responsibility of the Company's management. Our responsibility is to express an opinion on these financial statements and financial statement schedule based on our audits.
We conducted our audits in accordance with the standards of the Public Company Accounting Oversight Board (United States). Those standards require that we plan and perform the audit to obtain reasonable assurance about whether the financial statements are free of material misstatement. An audit includes examining, on a test basis, evidence supporting the amounts and disclosures in the financial statements. An audit also includes assessing the accounting principles used and significant estimates made by management as well as evaluating the overall financial statement presentation. We believe that our audits provide a reasonable basis for our opinion.
In our opinion, such consolidated financial statements present fairly, in all material respects, the financial position of Huntsman International Holdings LLC and subsidiaries at December 31, 2002 and 2001 and the results of their operations and their cash flows for each of the three years in the period ended December 31, 2002 in conformity with accounting principles generally accepted in the United States of America.
As discussed in Note 2 to the consolidated financial statements, the Company adopted Statement of Financial Accounting Standards, No. 142 effective January 1, 2002 and changed its method of accounting for derivative financial instruments effective January 1, 2001, to conform to Statement of Financial Accounting Standards No. 133, as amended.
As discussed in Note 23, the accompanying consolidated statements of cash flows have been restated.
/s/ DELOITTE & TOUCHE LLP
Salt
Lake City, Utah
February 28, 2003,
November 23, 2004 as to Note 23
F-181
HUNTSMAN INTERNATIONAL HOLDINGS LLC AND SUBSIDIARIES
Consolidated Balance Sheets
(Millions of Dollars)
| |
December 31, 2002 |
December 31, 2001 |
|||||||
|---|---|---|---|---|---|---|---|---|---|
| ASSETS | |||||||||
| Current assets: | |||||||||
| Cash and cash equivalents | $ | 75.4 | $ | 83.9 | |||||
| Accounts and notes receivables (net of allowance for doubtful accounts of $14.5 and $15.2, respectively) | 467.9 | 501.6 | |||||||
| Inventories | 561.3 | 501.4 | |||||||
| Prepaid expenses | 22.0 | 10.7 | |||||||
| Deferred income taxes | 31.2 | — | |||||||
| Other current assets | 75.4 | 47.4 | |||||||
| Total current assets | 1,233.2 | 1,145.0 | |||||||
| Property, plant and equipment, net | 3,071.1 | 2,839.5 | |||||||
| Investment in unconsolidated affiliates | 133.9 | 147.0 | |||||||
| Intangible assets, net | 273.3 | 332.1 | |||||||
| Other noncurrent assets | 332.6 | 362.9 | |||||||
| Total assets | $ | 5,044.1 | $ | 4,826.5 | |||||
| LIABILITIES AND EQUITY | |||||||||
| Current liabilities: | |||||||||
| Accounts payable | $ | 314.8 | $ | 266.7 | |||||
| Accrued liabilities | 523.8 | 496.7 | |||||||
| Current portion of long-term debt | 43.9 | 5.3 | |||||||
| Deferred income taxes | — | 5.7 | |||||||
| Other current liabilities | 29.6 | 62.4 | |||||||
| Total current liabilities | 912.1 | 836.8 | |||||||
| Long-term debt | 3,420.6 | 3,234.4 | |||||||
| Deferred income taxes | 215.1 | 262.6 | |||||||
| Other noncurrent liabilities | 158.3 | 131.9 | |||||||
| Total liabilities | 4,706.1 | 4,465.7 | |||||||
| Minority interests | 0.1 | 7.8 | |||||||
| Commitments and contingencies (Notes 17 and 18) | |||||||||
| Equity: | |||||||||
| Members' equity, 1,000 units | 565.5 | 565.5 | |||||||
| Retained earnings | (80.2 | ) | (11.7 | ) | |||||
| Accumulated other comprehensive loss | (147.4 | ) | (200.8 | ) | |||||
| Total equity | 337.9 | 353.0 | |||||||
| Total liabilities and equity | $ | 5,044.1 | $ | 4,826.5 | |||||
See accompanying notes to consolidated financial statements.
F-182
HUNTSMAN INTERNATIONAL HOLDINGS LLC AND SUBSIDIARIES
Consolidated Statements of Operations and Comprehensive Income (Loss)
(Millions of Dollars)
| |
Year Ended December 31, 2002 |
Year Ended December 31, 2001 |
Year Ended December 31, 2000 |
|||||||||
|---|---|---|---|---|---|---|---|---|---|---|---|---|
| Revenues: | ||||||||||||
| Trade sales | $ | 4,159.9 | $ | 4,178.2 | $ | 3,940.8 | ||||||
| Related party sales | 333.7 | 376.0 | 464.5 | |||||||||
| Tolling fees | 24.5 | 21.0 | 42.6 | |||||||||
| Total revenues | 4,518.1 | 4,575.2 | 4,447.9 | |||||||||
| Cost of goods sold | 3,902.7 | 3,990.1 | 3,705.4 | |||||||||
| Gross profit | 615.4 | 585.1 | 742.5 | |||||||||
| Expenses: | ||||||||||||
| Selling, general and administrative | 325.0 | 302.9 | 259.5 | |||||||||
| Research and development | 54.6 | 62.5 | 59.3 | |||||||||
| Restructuring and plant closing costs | 7.7 | 46.6 | — | |||||||||
| Total expenses | 387.3 | 412.0 | 318.8 | |||||||||
| Operating income | 228.1 | 173.1 | 423.7 | |||||||||
| Interest expense | (335.6 | ) | (323.4 | ) | (308.5 | ) | ||||||
| Interest income | 1.6 | 3.4 | 4.9 | |||||||||
| Loss on sale of accounts receivable | (5.5 | ) | (12.8 | ) | (1.9 | ) | ||||||
| Other income (expense) | 1.3 | (2.0 | ) | (3.2 | ) | |||||||
| Income (loss) before income taxes | (110.1 | ) | (161.7 | ) | 115.0 | |||||||
| Income tax benefit (expense) | 41.5 | 26.0 | (30.2 | ) | ||||||||
| Minority interests in subsidiaries' income (loss) | 0.1 | (2.2 | ) | (2.8 | ) | |||||||
| Income (loss) before accounting change | (68.5 | ) | (137.9 | ) | 82.0 | |||||||
| Cumulative effect of accounting change | — | (1.5 | ) | — | ||||||||
| Net income (loss) | (68.5 | ) | (139.4 | ) | 82.0 | |||||||
| Other comprehensive income (loss) | 53.4 | (80.1 | ) | (118.0 | ) | |||||||
| Comprehensive income (loss) | $ | (15.1 | ) | $ | (219.5 | ) | $ | (36.0 | ) | |||
See accompanying notes to consolidated financial statements.
F-183
HUNTSMAN INTERNATIONAL HOLDINGS LLC AND SUBSIDIARIES
Consolidated Statements of Equity
(Millions of Dollars)
| |
Members' Equity |
|
|
|
|||||||||||
|---|---|---|---|---|---|---|---|---|---|---|---|---|---|---|---|
| |
|
Accumulated Other Comprehensive Loss |
|
||||||||||||
| |
Shares/ Units |
Amount |
Retained Earnings |
Total |
|||||||||||
| Balance, January 1, 2000 | 1,000 | $ | 518.1 | $ | 49.7 | $ | (2.7 | ) | $ | 565.1 | |||||
Distribution to Holdings |
— |
(8.0 |
) |
— |
(8.0 |
) |
|||||||||
| Net income | — | 82.0 | — | 82.0 | |||||||||||
Other comprehensive loss |
— |
— |
(118.0 |
) |
(118.0 |
) |
|||||||||
| Balance, December 31, 2000 | 1,000 | 518.1 | 123.7 | (120.7 | ) | 521.1 | |||||||||
Refund of distribution |
— |
4.0 |
— |
4.0 |
|||||||||||
| Capital contribution due to modification of senior subordinated discount notes (Note 12) | 47.4 | — | — | 47.4 | |||||||||||
| Net loss | — | (139.4 | ) | — | (139.4 | ) | |||||||||
| Other comprehensive loss | — | — | (80.1 | ) | (80.1 | ) | |||||||||
| Balance, December 31, 2001 | 1,000 | 565.5 | (11.7 | ) | (200.8 | ) | 353.0 | ||||||||
Net loss |
— |
(68.5 |
) |
— |
(68.5 |
) |
|||||||||
| Other comprehensive income | — | — | 53.4 | 53.4 | |||||||||||
| Balance, December 31, 2002 | 1,000 | $ | 565.5 | $ | (80.2 | ) | $ | (147.4 | ) | $ | 337.9 | ||||
F-184
HUNTSMAN INTERNATIONAL HOLDINGS LLC AND SUBSIDIARIES
Consolidated Statements of Cash Flows
(Millions of Dollars)
| |
Year Ended December 31, 2002 |
Year Ended December 31, 2001 |
Year Ended December 31, 2000 |
||||||||
|---|---|---|---|---|---|---|---|---|---|---|---|
| |
(As restated see Note 23) |
(As restated see Note 23) |
|
||||||||
| Cash Flows From Operating Activities: | |||||||||||
| Net income (loss) | $ | (68.5 | ) | $ | (139.4 | ) | $ | 82.0 | |||
| Adjustments to reconcile net income (loss) to net cash provided by operating activities: | |||||||||||
| Depreciation and amortization | 256.2 | 227.1 | 203.6 | ||||||||
| Provision for losses on accounts receivable | 4.1 | 2.8 | 2.2 | ||||||||
| Noncash restructuring and plant closing charges | 6.1 | 7.8 | — | ||||||||
| Noncash interest expense | 101.5 | 91.7 | 81.3 | ||||||||
| Deferred income taxes | (59.8 | ) | (43.1 | ) | 6.3 | ||||||
| Gain on foreign currency transactions | (29.5 | ) | 7.6 | (8.2 | ) | ||||||
| Loss on disposals of fixed assets | — | 6.6 | 2.9 | ||||||||
| Minority interests in subsidiaries | (0.1 | ) | 2.2 | 2.8 | |||||||
| Equity in earnings of investment in unconsolidated affiliates | (0.2 | ) | (0.1 | ) | (0.1 | ) | |||||
| Changes in operating assets and liabilities—net of effects of acquisitions: | |||||||||||
| Accounts receivables | 1.6 | 84.9 | (106.7 | ) | |||||||
| Change in receivables sold, net | 99.7 | 5.1 | 175.0 | ||||||||
| Inventories | (12.6 | ) | 17.3 | (118.9 | ) | ||||||
| Prepaid expenses | (9.1 | ) | 4.5 | 0.3 | |||||||
| Other current assets | (15.0 | ) | 1.7 | (13.8 | ) | ||||||
| Other noncurrent assets | (9.4 | ) | 10.3 | (52.0 | ) | ||||||
| Accounts payable | (0.5 | ) | (106.7 | ) | (27.1 | ) | |||||
| Accrued and other current liabilities | (70.2 | ) | 21.3 | 151.0 | |||||||
| Other noncurrent liabilities | (16.2 | ) | (10.5 | ) | 30.9 | ||||||
| Net cash provided by operating activities | 178.1 | 191.1 | 411.5 | ||||||||
Investing Activities: |
|||||||||||
| Capital expenditures | (190.5 | ) | (291.0 | ) | (204.5 | ) | |||||
| Acquisition of businesses and minority interest | (9.0 | ) | (209.5 | ) | (149.6 | ) | |||||
| Net cash received from unconsolidated affiliates | 8.0 | 11.3 | 7.5 | ||||||||
| Advances to unconsolidated affiliates | (3.3 | ) | (2.5 | ) | (9.0 | ) | |||||
| Proceds from sale of fixed assets | 5.9 | — | — | ||||||||
| Net cash used in investing activities | (188.9 | ) | (491.7 | ) | (355.6 | ) | |||||
| (continued) | |||||||||||
F-185
| Financing Activities: | |||||||||||
| Net borrowings under revolving loan facilities | $ | (43.6 | ) | $ | 79.5 | $ | 8.0 | ||||
| Issuance of senior and senior subordinated notes | 300.0 | 233.2 | — | ||||||||
| Proceeds from other long-term debt | — | 4.4 | — | ||||||||
| Repayment of long-term debt | (245.0 | ) | (2.4 | ) | (131.0 | ) | |||||
| Debt issuance costs | (10.3 | ) | (6.5 | ) | — | ||||||
| Refund of distribution from Holdings | — | 4.0 | — | ||||||||
| Cash distribution to Holdings | — | — | (8.0 | ) | |||||||
| Net cash provided by (used in) financing activities | 1.1 | 312.2 | (131.0 | ) | |||||||
Effect of exchange rate changes on cash |
1.2 |
6.2 |
2.3 |
||||||||
| Increase (decrease) in cash and cash equivalents | (8.5 | ) | 17.8 | (72.8 | ) | ||||||
| Cash and cash equivalents at beginning of year | 83.9 | 66.1 | 138.9 | ||||||||
| Cash and cash equivalents at end of year | $ | 75.4 | $ | 83.9 | $ | 66.1 | |||||
Supplemental cash flow information: |
|||||||||||
| Cash paid for interest | 235.0 | 222.2 | 234.6 | ||||||||
| Cash paid for income taxes | 12.3 | 15.0 | 22.0 | ||||||||
Supplemental non-cash financing activities:
The Company partially finances its property and liability insurance premiums. During the year ended December 31, 2002, the Company issued notes payable for approximately $2.6 million and recorded prepaid insurance for the same amount, which will be amortized over the period covered.
See accompanying notes to consolidated financial statements.
F-186
HUNTSMAN INTERNATIONAL HOLDINGS LLC AND SUBSIDIARIES
NOTES TO CONSOLIDATED FINANCIAL STATEMENTS
1. Basis of Presentation
Huntsman International Holdings LLC ("Holdings" or the "Company"), through its wholly owned subsidiary Huntsman International LLC ("Huntsman International"), is a global manufacturer and marketer of differentiated and commodity chemicals through its four principal businesses: Polyurethanes, Performance Products, Pigments and Base Chemicals.
Effective June 30, 1999, pursuant to a contribution agreement and ancillary agreements between Holdings, Huntsman Specialty Chemicals Corporation ("Huntsman Specialty"), Imperial Chemicals Industries PLC ("ICI") and Huntsman International, the Company acquired assets and stock representing ICI's polyurethane chemicals, selected petrochemicals (including ICI's 80% interest in the Wilton olefins facility) and titanium dioxide businesses and Huntsman Specialty's propylene oxide business. In addition, the Company also acquired the remaining 20% ownership interest in the Wilton olefins facility from BP Chemicals, Limited ("BP Chemicals").
Holdings is owned 60% by Huntsman Specialty, 30% by ICI and its affiliates, approximately 9% by institutional investors and approximately 1% by HMP Equity Holdings Corporation ("HMP").
2001 Acquisition
On March 31, 2001, the Company closed a definitive purchase agreement with an affiliate of Rhodia S.A. for the acquisition of the European surfactants business of Albright & Wilson, a subsidiary of Rhodia S.A., for approximately $180 million.
2000 Acquisition
On August 31, 2000, the Company acquired the Morton global thermoplastic polyurethanes business from Rohm and Haas Company for an aggregate purchase price of $120 million.
2. Summary of Significant Accounting Policies
Principles of Consolidation
The consolidated financial statements of the Company include its majority owned subsidiaries. Intercompany transactions and balances are eliminated.
Use of Estimates
The preparation of financial statements in conformity with accounting principles generally accepted in the United States of America requires management to make estimates and assumptions that affect the reported amounts of assets and liabilities and disclosure of contingent assets and liabilities at the date of the financial statements and the reported amounts of revenues and expenses during the reporting period. Actual results could differ from those estimates.
Cash Flow Information
Highly liquid investments with an original maturity of three months or less when purchased are considered to be cash equivalents.
F-187
Securitization of Accounts Receivable
In September 2000, Statement of Financial Accounting Standards ("SFAS") No. 140, "Accounting for Transfers and Servicing of Financial Assets and Extinguishments of Liabilities," was issued. SFAS No. 140 provides consistent standards for distinguishing transfers of financial assets that are sales from those that are secured borrowings. The Company adopted SFAS No. 140 during the year ended December 31, 2001 as required. Adoption of the accounting requirements of this standard did not have a material impact on the statement of operations or financial position.
The Company securitizes certain trade receivables in connection with a revolving securitization program. The Company retains the servicing rights which are a retained interest in the securitized receivables. Losses are recorded on the sale and are based on the carrying value of the receivables as allocated between the receivables sold and the retained interests and their relative fair value at the date of the transfer. Retained interests are subsequently carried at fair value which is estimated based on the present value of expected cash flows, calculated using management's best estimates of key assumptions including credit losses and discount rates commensurate with the risks involved. For more information, see "Note 11—Securitization of Accounts Receivable" below.
Inventories
Inventories are stated at the lower of cost or market using the weighted average method.
Property, Plant and Equipment
Property, plant and equipment is stated at cost. Depreciation is provided utilizing the straight line method over the estimated useful lives of the assets ranging from 3 to 20 years. Upon disposal of assets, the cost and related accumulated depreciation are removed from the accounts and the resulting gain or loss is included in income. Of the total plant and equipment, approximately $458 million is depreciated using the straight-line method on a group basis at a 5% composite rate. When capital assets representing complete groups of property are disposed of, the difference between the disposal proceeds and net book value is credited or charged to income. When miscellaneous assets are disposed of, the difference between asset costs and salvage value is charged or credited to accumulated depreciation.
Periodic maintenance and repairs applicable to major units of manufacturing facilities are accounted for on the prepaid basis by capitalizing the costs of the turnaround and amortizing the costs over the estimated period until the next turnaround. Normal maintenance and repairs of all other plant and equipment are charged to expense as incurred. Renewals, betterments and major repairs that materially extend the useful life of the assets are capitalized, and the assets replaced, if any, are retired.
Interest costs are capitalized as part of major construction projects. Interest expense capitalized as part of plant and equipment was $10.5 million, $9.3 million, and $10.3 million for the years ended December 31, 2002, 2001 and 2000, respectively.
Investment in Unconsolidated Affiliates
Investments in companies in which the Company exercises significant influence, generally ownership interests from 20% to 50%, are accounted for using the equity method.
F-188
Intangible Assets
Intangible assets, which consist of patents, trademarks, technology and certain other agreements, are stated at their fair market values at the time of acquisition, and are amortized using the straight line method over their estimated useful lives of five to fifteen years or over the life of the related agreement.
Carrying Value of Long-term Assets
The Company evaluates the carrying value of long-term assets based upon current and anticipated undiscounted cash flows and recognizes an impairment when such estimated cash flows will be less than the carrying value of the asset. Measurement of the amount of impairment, if any, is based upon the difference between carrying value and fair value.
Financial Instruments
The carrying amount reported in the balance sheet for cash and cash equivalents, accounts receivable and accounts payable approximates fair value because of the immediate or short-term maturity of these financial instruments. The carrying value of the Company's senior credit facilities approximates fair value since they bear interest at a floating rate plus an applicable margin. The fair value of the Company's senior notes and senior subordinated discount notes approximate book value. The fair value of the Company's senior subordinated notes and senior discount notes was approximately $893.7 million and $212.6 million, respectively, at December 31, 2002. The fair value of the Company's senior subordinated and senior discount notes was approximately $963.0 million and $236.3 million, respectively, at December 31, 2001. The Company's senior discount notes are thinly traded.
Derivatives and Hedging Activities
Effective January 1, 2001, the Company adopted SFAS No. 133, "Accounting for Derivative Instruments and Hedging Activities." SFAS No. 133 requires that an entity recognize all derivative instruments as assets or liabilities in the balance sheet and measure those instruments at fair value. The accounting for the change in the fair value depends on the use of the instrument. The adoption of SFAS No. 133 resulted in a cumulative increase in net loss of $1.5 million and a cumulative increase to accumulated other comprehensive loss of $1.1 million. For more information, see "Note 13—Derivative Instruments and Hedging Activities."
Income Taxes
The Company and its U.S. subsidiaries are organized as limited liability companies. These entities are treated similar to a partnership for U.S. income tax purposes, and therefore are not subject to U.S. federal tax on their income. Subsidiaries outside the U.S. are generally taxed on the income generated in the local country.
Deferred income taxes are provided for temporary differences between financial statement income and taxable income using the asset and liability method in accordance with SFAS No. 109, "Accounting for Income Taxes." The Company does not provide for income taxes or benefits on the undistributed earnings of its international subsidiaries as earnings are reinvested and, in the opinion of management, will continue to be reinvested indefinitely.
F-189
Environmental Expenditures
Environmental related restoration and remediation costs are recorded as liabilities and expensed when site restoration and environmental remediation and cleanup obligations are either known or considered probable and the related costs can be reasonably estimated. Other environmental expenditures, which are principally maintenance or preventative in nature, are recorded when incurred and are expensed or capitalized as appropriate.
Foreign Currency Translation
Generally, the accounts of the Company's subsidiaries outside of the United States consider local currency to be functional currency. Accordingly, assets and liabilities are translated at rates prevailing at the balance sheet date. Revenues, expenses, gains and losses are translated at a weighted average rate for the period. Cumulative translation adjustments are recorded to equity as a component of accumulated other comprehensive income. Transaction gains and losses are recorded in the statement of operations and were net gains of $48.3 million, $4.8 million and $8.2 million for the years ended December 31, 2002, 2001 and 2000, respectively.
Revenue Recognition
The Company generates revenues through sales in the open market, raw material conversion agreements and long-term supply contracts. The Company recognizes revenue when it is realized or realizable and earned, which is generally when the product is shipped to the customer.
Research and Development
Research and development costs are expensed as incurred.
Earnings per Member Equity Unit
Earnings per member equity unit is not presented because it is not considered meaningful information due to the Company's ownership by a single equity holder.
Reclassifications
Certain amounts in the consolidated financial statements for prior periods have been reclassified to conform with the current presentation.
Recently Adopted Financial Accounting Standards
On January 1, 2002, the Company adopted SFAS No. 142, "Goodwill and Other Intangible Assets." SFAS No. 142 changes the accounting for goodwill and intangible assets with indefinite lives from an amortization method to an impairment-only approach. Upon adoption of SFAS No. 142, the Company was required to reassess the useful lives of all acquired intangibles and perform an impairment test on goodwill. In the first quarter of 2002, the Company completed the assessment of useful lives and concluded that no adjustment to the amortization period of intangible assets was necessary.
The initial adoption of SFAS No. 142 had no impact on the Company's financial statements for the year ended December 31, 2002, as the Company has no goodwill.
On January 1, 2002, the Company adopted SFAS No. 144, "Accounting for the Impairment or Disposal of Long-Lived Assets." This statement establishes a single accounting model for the impairment or disposal of long-lived assets. The impact of adopting this pronouncement was not material.
F-190
Recently Issued Financial Accounting Standards
In August 2001, the Financial Accounting Standards Board ("FASB") issued SFAS No. 143, "Accounting for Asset Retirement Obligations." SFAS No. 143 addresses financial accounting and reporting for obligations associated with the retirement of tangible, long-lived assets and the associated asset retirement costs. This statement requires that the fair value of a liability for an asset retirement obligation be recognized in the period in which it is incurred by capitalizing it as part of the carrying amount of the long-lived assets. As required by SFAS No. 143, the Company will adopt this new accounting standard on January 1, 2003. The Company is currently evaluating the effects of adopting this pronouncement.
In April 2002, the FASB issued SFAS No. 145, "Rescission of FASB Statements No. 4, 44 and 64, Amendment of FASB Statement No. 13, and Other Technical Corrections." In addition to amending or rescinding pronouncements to make various technical corrections, clarify meanings or describe applicability, SFAS No. 145 precludes companies from recording gains or losses from extinguishment of debt as an extraordinary item. The Company was required to adopt this statement as of January 1, 2003. The adoption of SFAS No. 145 is not expected to have a material effect on our consolidated financial statements.
In June 2002, the FASB issued SFAS No. 146, "Accounting for Costs Associated With Exit or Disposal Activities." SFAS No. 146 requires recording costs associated with exit or disposal activities at their fair values when a liability has been incurred. Under previous guidance, certain exit costs were accrued upon management's commitment to an exit plan, which is generally before an actual liability has been incurred. We will adopt this pronouncement in the first quarter of 2003. The adoption of SFAS No. 146 is not expected to have a material effect on the consolidated financial statements.
In January 2003, the FASB issued Financial Interpretation No. ("FIN") 45, "Guarantor's Accounting and Disclosure Requirements for Guarantees, Including Guarantees of Indebtedness of Others." FIN No. 45 requires recognition of a liability for the obligation undertaken upon issuing a guarantee. This liability would be recorded at the inception date of the guarantee and would be measured at fair value. The disclosure provisions of the interpretation are effective for the financial statements as of December 31, 2002. The liability recognition provisions apply prospectively to any guarantees issued or modified after December 31, 2002. The Company is currently evaluating the effects of adopting this statement.
3. Inventories
Inventories consist of the following (in millions):
| |
December 31, 2002 |
December 31, 2001 |
||||
|---|---|---|---|---|---|---|
| Raw materials | $ | 130.2 | $ | 132.5 | ||
| Work in progress | 25.9 | 20.4 | ||||
| Finished goods | 385.8 | 328.7 | ||||
| Total | 541.9 | 481.6 | ||||
| Materials and supplies | 19.4 | 19.8 | ||||
Net |
$ |
561.3 |
$ |
501.4 |
||
In the normal course of operations, the Company exchanges raw materials with other companies. No gains or losses are recognized on these exchanges, and the net open exchange positions are valued
F-191
at the Company's cost. The Company did not owe any inventory under open exchange agreements at December 31, 2002. The amount deducted from inventory under open exchange agreements owed by the Company at December 31, 2001 was $4.4 million (16.7 million pounds of feedstock and products), which represented the amount payable by the Company under open exchange agreements.
4. Property, Plant and Equipment
The cost and accumulated depreciation of property, plant and equipment are as follows (in millions):
| |
December 31, 2002 |
December 31, 2001 |
|||||
|---|---|---|---|---|---|---|---|
| Land | $ | 42.9 | $ | 36.3 | |||
| Buildings | 157.7 | 129.9 | |||||
| Plant and equipment | 3,446.3 | 2,919.0 | |||||
| Construction in progress | 172.7 | 231.4 | |||||
| Total | 3,819.6 | 3,316.6 | |||||
| Less accumulated depreciation | (748.5 | ) | (477.1 | ) | |||
Net |
$ |
3,071.1 |
$ |
2,839.5 |
|||
5. Investments in Unconsolidated Affiliates
The Company's ownership percentage and investments in unconsolidated affiliates, primarily manufacturing joint ventures, are as follows (in millions):
| |
December 31, 2002 |
December 31, 2001 |
||||
|---|---|---|---|---|---|---|
| Louisiana Pigment Company, L.P. (50%) | $ | 131.4 | $ | 139.8 | ||
| Rubicon, Inc. (50%) | 1.3 | 5.7 | ||||
| Others | 1.2 | 1.5 | ||||
Total |
$ |
133.9 |
$ |
147.0 |
||
Summarized approximate financial information of such affiliated companies as a group as of December 31, 2002 and 2001 and for the years then ended is presented below (in millions):
| |
December 31, 2002 |
December 31, 2001 |
|||||
|---|---|---|---|---|---|---|---|
| Assets | $ | 488.3 | $ | 533.1 | |||
| Liabilities | 222.5 | 229.3 | |||||
| Revenues | 651.3 | 681.4 | |||||
| Net income | 0.4 | 0.5 | |||||
| The Company's equity in: | |||||||
| Net assets | 133.9 | 147.0 | |||||
| Net income | 0.2 | 0.1 | |||||
F-192
6. Intangible Assets
The gross carrying amount and accumulated amortization of intangible assets as of December 31, 2002 and 2001 were as follows (dollars in millions):
| |
December 31, 2002 |
December 31, 2001 |
||||||||||||||||
|---|---|---|---|---|---|---|---|---|---|---|---|---|---|---|---|---|---|---|
| |
Carrying Amount |
Accumulated Amortization |
Net |
Carrying Amount |
Accumulated Amortization |
Net |
||||||||||||
| Patents, trademarks, and technology | $ | 312.3 | $ | 89.9 | $ | 222.4 | $ | 343.4 | $ | 66.0 | $ | 277.4 | ||||||
| Non-compete agreements | 49.1 | 30.9 | 18.2 | 50.1 | 24.3 | 25.8 | ||||||||||||
| Other intangibles | 38.0 | 5.3 | 32.7 | 30.8 | 1.9 | 28.9 | ||||||||||||
Total |
$ |
399.4 |
$ |
126.1 |
$ |
273.3 |
$ |
424.3 |
$ |
92.2 |
$ |
332.1 |
||||||
Amortization expense for intangibles for the years ended December 31, 2002, 2001 and 2000 was $33.9 million, $33.0 million and $26.3 million, respectively. Estimated future amortization expense for intangible assets through December 31, 2007 is as follows (dollars in millions):
| |
Annual Expense |
||
|---|---|---|---|
| 2003 through 2004 | $ | 46.7 | |
| 2005 through 2007 | $ | 38.1 | |
7. Other Noncurrent Assets
Other noncurrent assets consist of the following (in millions):
| |
December 31, 2002 |
December 31, 2001 |
||||
|---|---|---|---|---|---|---|
| Prepaid pension assets | $ | 146.2 | $ | 198.4 | ||
| Debt issuance costs | 54.5 | 57.2 | ||||
| Capitalized turnaround expense | 47.6 | 33.0 | ||||
| Receivables from affiliates | 18.6 | 16.7 | ||||
| Spare parts inventory | 46.2 | 36.2 | ||||
| Other noncurrent assets | 19.5 | 21.4 | ||||
Total |
$ |
332.6 |
$ |
362.9 |
||
8. Accrued Liabilities
Accrued liabilities consist of the following (in millions):
| |
December 31, 2002 |
December 31, 2001 |
||||
|---|---|---|---|---|---|---|
| Raw materials and services | $ | 217.7 | $ | 212.7 | ||
| Interest | 61.3 | 59.1 | ||||
| Taxes (income, property and VAT) | 41.4 | 18.4 | ||||
| Payroll, severance and related costs | 67.4 | 49.7 | ||||
| Volume and rebates accruals | 52.5 | 50.1 | ||||
| Restructuring and plant closing costs | 7.1 | 31.3 | ||||
| Other miscellaneous accruals | 76.4 | 75.4 | ||||
| Total | $ | 523.8 | $ | 496.7 | ||
F-193
9. Other Noncurrent Liabilities
Other noncurrent liabilities consist of the following (in millions):
| |
December 31, 2002 |
December 31, 2001 |
||||
|---|---|---|---|---|---|---|
| Pension liabilities | $ | 82.3 | $ | 54.6 | ||
| Other postretirement benefits | 10.8 | 10.4 | ||||
| Environmental accruals | 19.3 | 22.9 | ||||
| Payable to affiliate | 37.9 | 37.5 | ||||
| Other noncurrent liabilities | 8.0 | 6.5 | ||||
| Total | $ | 158.3 | $ | 131.9 | ||
10. Restructuring and Plant Closing Costs
The Company has incurred restructuring and plant closing costs totaling $7.7 million and $46.6 million for the years ended December 31, 2002 and 2001, respectively.
2002 Restructuring
During 2002, the Performance Products segment recorded $4.6 million in charges which relate to restructuring and the write-down of fixed assets. Property, plant and equipment was reduced by $3.0 million as a charge of $1.4 million was recorded to write-down the assets at the surfactants plant in Alcover, Spain which was closed during 2002, and an additional $1.6 million was recorded to write-down the assets of the Italy ETO plant and various closed sales offices. The remaining $1.6 million are for other costs related to the restructuring.
In 2002, the Pigments segment recorded $3.1 million in asset write-downs related to the closure of the Company's titanium dioxide manufacturing facility in Greatham, UK.
2001 Restructuring
During 2001, the Polyurethanes segment announced a cost reduction program which included closure of the Shepton Mallet, U.K. polyols manufacturing facility by the end of 2002 resulting in a charge of $44.7 million. The program included reduction in workforce of approximately 270 employees at the Shepton Mallet facility and other locations. Approximately $7.8 was recorded to write-down the fixed assets, $36.1 for employee termination benefits and $0.8 for other exit costs.
The Pigments segment recorded $1.9 million in restructuring charges which related to a workforce reduction of approximately 50 employees.
The restructuring and plant closing costs were recorded in the following accounts: $7.8 million in property, plant, and equipment, and $38.8 million in accrued liabilities. At December 31, 2002 there remained $7.1 million of these costs in accrued liabilities for workforce reductions and other exit costs.
11. Securitization of Accounts Receivable
On December 21, 2000, the Company initiated a five-year revolving securitization program under which certain trade receivables were and will be transferred to an off balance sheet special purpose entity at a discount. Under the terms of the agreements, the Company and its subsidiaries continue to service the receivables in exchange for a 1% fee of the outstanding receivables and is subject to recourse provisions. In 2000, proceeds from initial sales totaled approximately $175 million. In October 2002, the Company expanded its accounts receivable securitization program by $25 million. At
F-194
December 31, 2002, the special purpose entity had outstanding $180 million in mid-term notes and $100 million in commercial paper.
For the years ended December 31, 2002 and 2001, new sales totaled approximately $3,220 million and $3,132 million, respectively, and cash collections reinvested totaled approximately $3,160 million and $3,180 million, respectively. Servicing fees received were approximately $3 million each year for the years 2002 and 2001, and are recorded as a reduction in the loss on sale of accounts receivable in the statements of operations. The retained interest in the receivables was approximately $112 million and $60 million, and as of December 31, 2002 and 2001, respectively. The value of the retained interest is subject to credit and interest rate risk.
The key economic assumptions used in valuing the residual interest at December 31, 2002 are presented below:
| Weighted average life (in months) | 2 | |
| Credit losses (annual rate) | Less than 1% | |
| Discount rate (annual rate) | 5% |
A 10% and 20% adverse change in any of the key economic assumptions would not have a material impact on the fair value of the retained interest. Total receivables over 60 days past due as of December 31, 2002 and 2001 were $11.2 million and $15.6 million, respectively.
12. Long-term Debt
Long-term debt outstanding as of December 31, 2002 and 2001 is as follows (in millions):
| |
December 31, 2002 |
December 31, 2001 |
||||||
|---|---|---|---|---|---|---|---|---|
| Senior Secured Credit Facilities: | ||||||||
| Revolving loan facility | $ | 67.0 | $ | 110.6 | ||||
| Term A dollar loan | 109.7 | 195.6 | ||||||
| Term A euro loan (in U.S. dollar equivalent) | 138.5 | 208.6 | ||||||
| Term B loan | 526.3 | 553.7 | ||||||
| Term C loan | 526.3 | 553.7 | ||||||
| Senior Notes | 300.0 | — | ||||||
| Senior Subordinated Notes | 1,076.8 | 1,003.1 | ||||||
| Senior Discount Notes | 381.8 | 335.5 | ||||||
| Senior Subordinated Discount Notes | 308.9 | 266.3 | ||||||
| Other long-term debt | 29.2 | 12.6 | ||||||
| Subtotal | 3,464.5 | 3,239.7 | ||||||
| Less current portion | (43.9 | ) | (5.3 | ) | ||||
| Total | $ | 3,420.6 | $ | 3,234.4 | ||||
Senior Secured Credit Facilities
The revolving loan facility of up to $400 million matures on June 30, 2005 with no scheduled commitment reductions. Both the term A dollar loan and the term A euro loan facilities mature on June 30, 2005 and are payable in semi-annual installments commencing December 31, 2003 with the amortization increasing over time. The term B loan facility matures on June 30, 2007 and the term C loan facility matures on June 30, 2008. The term B and term C loan facilities require payments in annual installments of $5.48 million each, commencing June 30, 2004, with the remaining unpaid balances due on final maturity.
F-195
Interest rates for the Company's senior secured credit facilities (the "Senior Secured Credit Facilities") are based upon, at the Company's option, either a eurocurrency rate (libor) or a base rate (prime) plus the applicable spread. The applicable spreads vary based on a pricing grid, in the case of eurocurrency based loans, from 1.25% to 4.25% per annum depending on the loan facility and whether specified conditions have been satisfied and, in the case of base rate loans, from zero to 3.00% per annum. As of December 31, 2002, 2001 and 2000 the average interest rates on the Senior Secured Credit Facilities were 5.8%, 7.6% and 9.2%, respectively.
The obligations of Huntsman International under the Senior Secured Credit Facilities are supported by guarantees of the Company and Huntsman International's domestic and certain foreign subsidiaries (collectively the "Guarantors") as well as pledges of 65% of the voting stock of certain non-U.S. subsidiaries.
The Senior Secured Credit Facilities contain covenants relating to incurrence of debt, purchase and sale of assets, limitations on investments, affiliate transactions, change in control provisions and maintenance of certain financial ratios. The financial covenants include a leverage ratio, interest coverage ratio, minimum consolidated net worth level and a limit on capital expenditures. The Senior Secured Credit Facilities also limit the payment of dividends generally to the amount required by the members to pay income taxes. Management believes that the Company and Huntsman International are in compliance with the covenants of the Senior Secured Credit Facilities as of December 31, 2002.
Huntsman Specialty has an obligation to purchase ICI's 30% interest in Holdings (the "ICI 30% Interest") on or before July 1, 2003. In addition, HMP has an option to acquire the ICI 30% Interest on or before May 15, 2003, which was originally granted pursuant to an agreement with ICI (the "Option Agreement"). Concurrently, $160 million was paid to ICI for the Company's senior subordinated discount notes due 2009 that were originally issued to ICI (the "B Notes"), subject to certain conditions including the obligation to make an additional payment of $100 million plus accrued interest to ICI. The B Notes have been pledged to ICI as collateral security for such additional payment. The Huntsman Specialty obligation is secured by a lien on 30% of the outstanding membership interests in Holdings held by Huntsman Specialty (the "HIH Pledged Interest"). The Option Agreement does not terminate Huntsman Specialty's obligations to ICI. However, if HMP exercises the option, Huntsman Specialty's obligation would be effectively terminated. If HMP does not exercise the option, Huntsman Specialty would continue to be obligated to ICI. Accordingly, if neither HMP exercises its option nor Huntsman Specialty otherwise satisfies its obligation to ICI with respect to ICI's put right, ICI could foreclose on the Holdings Pledged Interest. Such a foreclosure would constitute a "change of control" and an event of default under the HI Credit Facilities and would give certain put rights to the holders of the HI Notes and the holders of the HIH Notes.
Senior Notes and Senior Subordinated Notes
In March 2002, Huntsman International issued $300 million 9.875% Senior Notes (the "Senior Notes"). Interest on the notes is payable semi-annually and the Senior Notes mature on March 1, 2009. The Senior Notes are fully and unconditionally guaranteed on a joint and several basis by the Guarantors. The Senior Notes may be redeemed, in whole or in part, at any time by Huntsman International prior to March 1, 2006 at 100% of the face value plus a "make whole" premium, as defined in the applicable indenture. After March 1, 2006, the Senior Notes may be redeemed, in whole or in part, at a redemption price decline from 104.937% to 100% after March 1, 2008.
The Company also has outstanding $600 million and €450 million 10.125% Senior Subordinated Notes (the "Notes"). Interest on the Notes is payable semi-annually and the Notes mature on July 1, 2009. The Notes are fully and unconditionally guaranteed on a joint and several basis by the Guarantors. The Notes may be redeemed, in whole or in part, at any time by the Company on or after
F-196
July 1, 2004, at percentages ranging from 105% to 100% at July 1, 2007 of their face amount, plus accrued and unpaid interest.
The Senior Notes and the Notes contain covenants relating to the incurrence of debt, limitations on distributions, asset sales and affiliate transactions, among other things. They also contain a change of control provision requiring Huntsman International to offer to repurchase the Senior Notes and the Notes upon a change of control. Management believes that Huntsman International is in compliance with the covenants of the Senior Notes and the Notes as of December 31, 2002.
Senior Discount Notes and Senior Subordinated Discount Notes
On June 30, 1999, the Company issued Senior Discount Notes and Senior Subordinated Discount Notes (collectively, the "Discount Notes") to ICI with initial stated values of $242.7 million and $265.3 million, respectively. The Discount Notes are due December 31, 2009. Interest on the Senior Discount Notes will accrue at 13.375% per annum. The Senior Discount Notes are redeemable prior to July 2004 for an amount equal to the net present value of 106.688% of the projected July 1, 2004 accreted value and thereafter at stipulated redemption prices declining to 100% of accreted value in 2007. The Senior Subordinated Discount Notes had a stated rate of 8% that originally was to reset to a market rate in June 2002 and can be redeemed at 100% of accreted value at any time until June 30, 2004. On December 21, 2001, the Company and ICI agreed to modify the terms of the Senior Subordinated Discount Notes, including deferring the reset date until September 2004. For financial reporting purposes, the Senior Subordinated Discount Notes were initially recorded at their estimated fair value of $224 million based upon prevailing market rates at June 30, 1999. Interest on the Discount Notes is paid in kind. The Senior Discount Notes contain limits on the incurrence of debt, restricted payments, liens, transactions with affiliates, and merger and sales of assets. As of December 31, 2002 and 2001, the Senior Discount Notes include $139.1 million and $92.8 million of accrued interest, respectively. As of December 31, 2002 and 2001, the Senior Subordinated Discount Notes include $83.8 million and $57.4 million of accrued interest, respectively, and $40.2 million and $56.4 million of discount, respectively.
On December 21, 2001 the Company and ICI agreed to modify the terms of the Senior Subordinated Discount Notes. The interest rate reset date was deferred until September 2004. The modification of the terms resulted in a significant decrease in the present value of the future cash flow of the debt and, as a result, the debt was treated effectively as an extinguishment and reissuance of the debt. The debt was recorded using a 16% interest rate, the estimated market rate for the debt as of December 20, 2001. The reduction in the debt of $47.4 million has been reflected as a capital contribution as the debt was held by a related party.
The scheduled maturities of long-term debt are as follows (in millions):
| |
December 31, 2002 |
||
|---|---|---|---|
| 2003 | 43.9 | ||
| 2004 | 148.6 | ||
| 2005 | 156.2 | ||
| 2006 | 12.9 | ||
| 2007 | 517.1 | ||
| Later Years | 2,585.8 | ||
| $ | 3,464.5 | ||
F-197
13. Derivative Instruments and Hedging Activities
The Company is exposed to market risks, such as changes in interest rates, currency exchange rates and commodity pricing. As a result, the Company enters into transactions including derivative instruments to manage these risks. The overall risk management philosophy of the Company is to manage the downside risks of these activities. Primary goals of the Company's risk management activities include: (1) reducing the impact of fluctuations in variable interest rates and meeting the requirements of certain credit agreements; (2) reducing the short-term impact from certain movements in foreign exchange rates on earnings; (3) reducing the variability in the purchase price of certain feedstocks; and (4) hedging the net investment position in euro functional currency entities.
Interest Rate Hedging
Through the Company's borrowing activities, it is exposed to interest rate risk. Such risk arises due to the structure of the Company's debt portfolio, including the duration of the portfolio and the mix of fixed and floating interest rates. The Company's senior credit facilities require that a certain portion of debt be at fixed rates through either interest rate hedges or through other means that provide a similar effect. Actions taken to reduce interest rate risk include managing the mix and rate characteristics of various interest bearing liabilities as well as entering into interest rate swaps, collars and options.
As of December 31, 2002 and 2001, the Company had entered into various types of interest rate contracts to manage its interest rate risk on its long-term debt as indicated below (in millions):
| |
December 31, 2002 |
December 31, 2001 |
||||||
|---|---|---|---|---|---|---|---|---|
| Pay fixed swaps | ||||||||
| Notional amount | $ | 202.4 | $ | 319.2 | ||||
| Fair value | $ | (11.8 | ) | $ | (12.7 | ) | ||
| Weighted average pay rate | 5.72 | % | 5.84 | % | ||||
| Maximum weighted average pay rate | 6.62 | % | 6.55 | % | ||||
| Maturing | 2004 | 2002-2004 | ||||||
Interest rate collars |
||||||||
| Notional amount | $ | 150.0 | $ | 275.0 | ||||
| Fair value | $ | (11.6 | ) | $ | (8.3 | ) | ||
| Weighted average cap rate | 7.00 | % | 7.00 | % | ||||
| Weighted average floor rate | 5.08 | % | 5.35 | % | ||||
| Maximum weighted average floor rate | 6.25 | % | 6.12 | % | ||||
| Maturing | 2004 | 2002-2004 | ||||||
The Company purchases both interest rate swaps and interest rate collars to reduce the impact of changes in interest rates on its floating-rate long-term debt. Under interest rate swaps, the Company agrees with other parties to exchange, at specified intervals, the difference between fixed-rate and floating-rate interest amounts calculated by reference to an agreed notional principal amount. The collars entitle the Company to receive from the counterparties (major banks) the amounts, if any, by which the Company's interest payments on certain of its floating-rate borrowings exceed a certain rate, and require the Company to pay to the counterparties (major banks) the amount, if any, by which the Company's interest payments on certain of its floating-rate borrowings are less than a certain rate.
The majority of the interest rate contracts have been designated as cash flow hedges of future interest payments on its variable rate debt. The fair value of these interest rate contracts designated as hedges as of December 31, 2002 and 2001 was a loss of approximately $15.6 million and $13.4 million, respectively, which is recorded in other noncurrent liabilities and in accumulated other comprehensive income (loss) to the extent of the effective portions of the hedging instruments. Gains and losses related to these contracts will be reclassified from other comprehensive income (loss) into earnings in
F-198
the periods in which the related hedged interest payments are made. As of December 31, 2002, losses of approximately $9.8 million are expected to be reclassified into earnings over the next twelve months. Gains and losses on these agreements, including amounts recorded related to hedge ineffectiveness, are reflected as interest expense in the statement of operations. A net loss of $4.2 million was recorded in interest expense in the year ended December 31, 2002. A net gain of $2.9 million was recorded in interest expense in the year ended December 31, 2001.
As of December 31, 2002 and 2001 swap agreements with a fair value liability of $7.8 million and $7.6 million, respectively have not been designated as a hedge for financial reporting purposes. Accordingly, $0.2 million and $7.6 million for the years ended December 31, 2002 and 2001 is recognized in interest expense.
The Company is exposed to credit losses in the event of nonperformance by a counterparty to the derivative financial instruments. The Company anticipates, however, that the counterparties will be able to fully satisfy their obligations under the contracts. Market risk arises from changes in interest rates.
Foreign Currency Rate Hedging
The Company may enter into foreign currency derivative instruments to minimize the short-term impact of movements in foreign currency rates. These contracts are not designated as hedges for financial reporting purposes and are recorded at fair value. As of December 31, 2002, there was a notional amount of $1.8 million outstanding for such contracts. At December 31, 2001, there were no outstanding contracts. During the years ended December 31, 2002 and 2001, the Company recognized losses of $0.1 million and $3.0 million, respectively, from these activities.
Commodity Price Hedging
Because feedstocks used by the Company are subject to price volatility, the Company uses commodity futures and swaps to reduce the risk associated with certain of these feedstocks. These instruments are designated as cash flow hedges of future inventory purchases and fair value hedges of inventory currently held and trading activities. The mark-to-market gains and losses of qualifying cash flow hedges are recorded as a component of other comprehensive income until the underlying transactions are recognized in earnings. The mark-to-market gains and losses of non-qualifying, excluded and ineffective portions of hedges are recorded in cost of goods sold in the accompanying statement of operations. For the year ended December 31, 2002, there were no gains or losses on derivatives qualifying as cash flow hedges. As of December 31, 2002, the fair value of all commodity derivatives included in other current liabilities was $0.8 million. For the year ended December 31, 2001, the net losses on derivatives qualifying as cash flow hedges were $0.9 million and were recorded in other comprehensive income. As of December 31, 2001 the fair value of all commodity derivatives included as other current assets and current liabilities was $1.0 million and $1.1 million, respectively.
During the year ended December 31, 2002 and 2001, the Company recorded $3.5 million and $11.1 million, respectively, as an increase in cost of goods sold related to net losses from settled contracts and the change in fair value (unrealized gains and losses) on the contracts that are effective economic hedges of commodity price exposures, but do not meet the SFAS No. 133 definition of hedging instruments. As of December 31, 2002, $0.8 million and $0.2 million, were included in other current assets and liabilities, respectively. As of December 31, 2001, $2.0 million and $1.0 million were included in other current assets and liabilities, respectively.
F-199
Net Investment Hedging
The Company hedges its net investment position in euro functional currency entities. To accomplish this, a portion of the Company's debt is euro denominated and designated as a hedge of net investments. Currency effects of these hedges produced net losses of approximately $95.9 million and net gains of approximately $19.5 million, in other comprehensive income (foreign currency translation adjustments) for the years ended December 31, 2002 and 2001, respectively. As of December 31, 2002 and 2001, there was a cumulative net loss of approximately $32.7 million and a cumulative net gain of approximately $63.2 million, respectively.
14. Income Taxes
The income (loss) before income tax consists of the following (in millions):
| |
Year Ended December 31, 2002 |
Year Ended December 31, 2001 |
Year Ended December 31, 2000 |
|||||||
|---|---|---|---|---|---|---|---|---|---|---|
| U.S. income (loss) | $ | 12.2 | $ | (116.0 | ) | $ | (15.2 | ) | ||
| Foreign income (loss) | (122.3 | ) | (45.7 | ) | 130.2 | |||||
| Total | $ | (110.1 | ) | $ | (161.7 | ) | $ | 115.0 | ||
The provision (benefit) for income taxes consists of the following (in millions):
| |
Year Ended December 31, 2002 |
Year Ended December 31, 2001 |
Year Ended December 31, 2000 |
|||||||
|---|---|---|---|---|---|---|---|---|---|---|
| U.S.: | ||||||||||
| Current | $ | 1.4 | $ | 0.4 | $ | 0.4 | ||||
| Deferred | — | — | — | |||||||
| Foreign: | ||||||||||
| Current | 16.9 | 16.7 | 23.5 | |||||||
| Deferred | (59.8 | ) | (43.1 | ) | 6.3 | |||||
| Total | $ | (41.5 | ) | $ | (26.0 | ) | $ | 30.2 | ||
The following schedule reconciles the differences between the United States federal income taxes at the United States statutory rate to the Company's provision (benefit) for income taxes (in millions):
| |
Year Ended December 31, 2002 |
Year Ended December 31, 2001 |
Year Ended December 31, 2000 |
|||||||
|---|---|---|---|---|---|---|---|---|---|---|
| Income taxes at U.S. federal statutory rate | $ | (38.6 | ) | $ | (56.6 | ) | $ | 40.3 | ||
| Income not subject to U.S. federal income tax | 8.0 | 40.5 | 9.4 | |||||||
| State income taxes | 0.4 | 0.4 | 0.3 | |||||||
| Foreign country incentive tax benefits | (17.0 | ) | (14.5 | ) | (13.3 | ) | ||||
| Foreign country currency exchange gain (loss) | 0.8 | 0.3 | (4.4 | ) | ||||||
| Foreign income tax rate in excess of federal statutory rate | 8.8 | 4.4 | 0.4 | |||||||
| Other | (3.9 | ) | (0.5 | ) | (2.5 | ) | ||||
| Total | $ | (41.5 | ) | $ | (26.0 | ) | $ | 30.2 | ||
| Effective income tax rate | 38 | % | 16 | % | 26 | % | ||||
F-200
The components of deferred tax assets and liabilities are as follows (in millions):
| |
December 31, 2002 |
December 31, 2001 |
|||||||||||
|---|---|---|---|---|---|---|---|---|---|---|---|---|---|
| |
Current |
Long-term |
Current |
Long-term |
|||||||||
| Deferred income tax assets: | |||||||||||||
| Net operating loss carryforwards | $ | — | $ | 200.9 | $ | — | $ | 122.5 | |||||
| Tax basis of plant and equipment in excess of book basis | — | 38.9 | — | 38.7 | |||||||||
| Employee benefits | — | 6.1 | — | 3.6 | |||||||||
| Other accruals and reserves | 45.2 | — | 10.8 | — | |||||||||
| Valuation allowance | — | (10.1 | ) | (6.5 | ) | (22.7 | ) | ||||||
| Total | 45.2 | 235.8 | 4.3 | 142.1 | |||||||||
Deferred income tax liabilities: |
|||||||||||||
| Book basis of plant and equipment in excess of tax basis | — | (381.4 | ) | — | (346.7 | ) | |||||||
| Employee benefits | — | (69.5 | ) | — | (58.0 | ) | |||||||
| Other accruals and reserves | (14.0 | ) | — | (10.0 | ) | — | |||||||
| Total | (14.0 | ) | (450.9 | ) | (10.0 | ) | (404.7 | ) | |||||
| Net deferred tax asset (liability) | $ | 31.2 | $ | (215.1 | ) | $ | (5.7 | ) | $ | (262.6 | ) | ||
The Company has net operating loss carryforwards ("NOLs") of approximately $622 million in various foreign jurisdictions. Most of the NOLs have no expiration date. The remaining NOLs begin to expire in 2006. If the valuation allowance is reversed, substantially all of the benefit will be allocated to reduce other noncurrent intangible assets. During 2002 and 2001, respectively, the Company reversed $19.1 million and $18.2 million of the valuation allowance and reduced goodwill by $17.5 million and $18.2 million, respectively.
The Company does not provide for income taxes or benefits on the undistributed earnings of its international subsidiaries as earnings are reinvested and, in the opinion of management, will continue to be reinvested indefinitely. In consideration of the Company's corporate structure, upon distribution of these earnings, certain of the Company's subsidiaries would be subject to both income taxes and withholding taxes in the various international jurisdictions. It is not practicable to estimate the amount of taxes that might be payable upon distribution.
The Company is treated as a partnership for U.S. federal income tax purposes and as such is generally not subject to U.S. income tax, but rather such income is taxed directly to the Company's owners. The net difference of the book basis of the U.S. assets and liabilities over the tax basis of those assets and liabilities is approximately $377 million.
F-201
15. Other Comprehensive Income (loss)
The components of other comprehensive income (loss) are as follows (in millions):
| |
December 31, 2002 |
December 31, 2001 |
December 31, 2000 |
January 1, 2000 |
||||||||||||||||||
|---|---|---|---|---|---|---|---|---|---|---|---|---|---|---|---|---|---|---|---|---|---|---|
| |
Accumulated income (loss) |
Income (loss) |
Accumulated income (loss) |
Income (loss) |
Accumulated income (loss) |
Income (loss) |
Accumulated income (loss) |
|||||||||||||||
| Foreign currency translation adjustments | $ | (38.5 | ) | $ | 147.2 | $ | (185.7 | ) | $ | (65.0 | ) | $ | (120.7 | ) | $ | (118.0 | ) | $ | (2.7 | ) | ||
| Additional minimum pension liability, net of tax of $37.7 million | (88.1 | ) | (88.1 | ) | — | — | — | — | — | |||||||||||||
| Additional minimum pension liability—unconsolidated affiliate | (5.4 | ) | (5.4 | ) | — | — | — | — | — | |||||||||||||
| Unrealized loss on securities | (2.7 | ) | (2.7 | ) | — | — | — | — | — | |||||||||||||
| Net unrealized loss on derivative instruments | (11.6 | ) | 2.4 | (14.0 | ) | (14.0 | ) | — | — | — | ||||||||||||
| Cumulative effect of accounting change | (1.1 | ) | 0.0 | (1.1 | ) | (1.1 | ) | 0.0 | 0.0 | 0.0 | ||||||||||||
| Total | $ | (147.4 | ) | $ | 53.4 | $ | (200.8 | ) | $ | (80.1 | ) | $ | (120.7 | ) | $ | (118.0 | ) | $ | (2.7 | ) | ||
16. Employee Benefit Plans
Defined Benefit and Other Postretirement Benefit Plans
The Company sponsors various contributory and non-contributory defined benefit pension plans covering employees in the U.S., the U.K., Netherlands, Belgium, Canada and a number of other countries. The Company funds the material plans through trust arrangements (or local equivalents) where the assets of the fund are held separately from the employer. The level of funding is in line with local practice and in accordance with the local tax and supervisory requirements. The plan assets consist primarily of equity and fixed income securities.
The Company also sponsors unfunded post-retirement benefit plans other than pensions which provide medical and life insurance benefits covering certain employees in the U.S. and Canada. In 2002, the healthcare trend rate used to measure the expected increase in the cost of benefits was assumed to be 11% per annum decreasing to 5.0% per annum after five years. In 2001, the healthcare trend rate used to measure the expected increase in the cost of benefits was assumed to be 8% per annum decreasing to 5% per annum after seven years.
F-202
The following table sets forth the funded status of the plans and the amounts recognized in the consolidated balance sheet at December 31, 2002 and 2001 (in millions):
| |
Year Ended December 31, 2002 |
Year Ended December 31, 2001 |
|||||||||||||
|---|---|---|---|---|---|---|---|---|---|---|---|---|---|---|---|
| |
Defined Benefit Plans |
Other Postretirement Benefit Plans |
Defined Benefit Plans |
Other Postretirement Benefit Plans |
|||||||||||
| Change in benefit obligation | |||||||||||||||
| Benefit obligation as of beginning of year | $ | 959.0 | $ | 10.3 | $ | 857.3 | $ | 10.0 | |||||||
| Service cost | 34.1 | 0.4 | 28.9 | 0.3 | |||||||||||
| Interest cost | 56.4 | 0.7 | 52.4 | 0.6 | |||||||||||
| Plan losses | 1.8 | 0.8 | 20.4 | 1.4 | |||||||||||
| Foreign exchange impact | 124.3 | — | (26.0 | ) | (0.1 | ) | |||||||||
| Benefits paid | (42.1 | ) | (0.6 | ) | (27.3 | ) | (0.6 | ) | |||||||
| Employee contributions | 2.4 | — | 2.0 | — | |||||||||||
| Plan amendments | 4.3 | — | 0.7 | — | |||||||||||
| Acquisitions | — | — | 50.3 | — | |||||||||||
| Other | 4.2 | — | 0.3 | (1.3 | ) | ||||||||||
| Benefit obligation as of end of year | $ | 1,144.4 | $ | 11.6 | $ | 959.0 | $ | 10.3 | |||||||
| Change in plan assets | |||||||||||||||
| Market value of plan assets as of beginning of year | $ | 930.8 | $ | — | $ | 1,001.4 | $ | — | |||||||
| Actual return on plan assets | (129.3 | ) | — | (80.4 | ) | — | |||||||||
| Company contributions | 34.4 | — | 20.9 | — | |||||||||||
| Foreign exchange impact | 110.3 | — | (31.9 | ) | — | ||||||||||
| Benefits paid | (41.8 | ) | — | (26.7 | ) | — | |||||||||
| Employee contributions | 2.4 | — | 2.0 | — | |||||||||||
| Acquisitions | 0.5 | — | 44.4 | — | |||||||||||
| Other | 0.6 | — | 1.1 | — | |||||||||||
| Market value of plan assets as of end of year | $ | 907.9 | $ | — | $ | 930.8 | $ | — | |||||||
| Funded status | |||||||||||||||
| Funded status | $ | (236.5 | ) | $ | (11.6 | ) | $ | (28.2 | ) | $ | (10.3 | ) | |||
| Unrecognized net actuarial loss | 427.1 | 2.4 | 194.8 | 1.6 | |||||||||||
| Unrecognized prior service cost | 5.8 | (1.6 | ) | 5.1 | (1.7 | ) | |||||||||
| Adjustment to recoginize minimum pension liability in other comprehensive income | (131.5 | ) | — | — | — | ||||||||||
| Accrued benefit cost | $ | 64.9 | $ | (10.8 | ) | $ | 171.7 | $ | (10.4 | ) | |||||
| Change in funded status | |||||||||||||||
| Prepaid (accrued) expense as of beginning of year | $ | 171.7 | $ | (10.4 | ) | $ | 172.2 | $ | (10.1 | ) | |||||
| Net periodic pension cost | (34.8 | ) | (1.0 | ) | (8.0 | ) | (1.0 | ) | |||||||
| Employer contributions | 34.4 | — | 20.9 | — | |||||||||||
| Foreign exchange impact | 27.9 | — | (6.9 | ) | 0.1 | ||||||||||
| Benefits paid | 0.6 | 0.6 | 0.5 | 0.6 | |||||||||||
| Other items | (3.4 | ) | — | (7.0 | ) | — | |||||||||
| Adjustment to recognize minimum pension liability in other comprehensive income | (131.5 | ) | — | — | — | ||||||||||
| Prepaid (accrued) expense as of end of year | $ | 64.9 | $ | (10.8 | ) | $ | 171.7 | $ | (10.4 | ) | |||||
| Components of net periodic benefit cost | |||||||||||||||
| Service cost | $ | 36.4 | $ | 0.5 | $ | 31.0 | $ | 0.3 | |||||||
| Employee contributions | (2.4 | ) | — | (2.1 | ) | — | |||||||||
| Interest cost | 56.4 | 0.8 | 52.4 | 0.6 | |||||||||||
| Return on plan assets | (67.5 | ) | — | (73.4 | ) | — | |||||||||
| Unrecognized gains | 11.9 | (0.1 | ) | 0.1 | 0.1 | ||||||||||
| Net periodic cost | $ | 34.8 | $ | 1.2 | $ | 8.0 | $ | 1.0 | |||||||
F-203
The following assumptions were used in the above calculations:
| |
Year Ended December 31, 2002 |
Year Ended December 31, 2001 |
||||||||
|---|---|---|---|---|---|---|---|---|---|---|
| |
Defined Benefit Plans |
Other Postretirement Benefit Plans |
Defined Benefit Plans |
Other Postretirement Benefit Plans |
||||||
| Weighted-average assumptions as of December 31, 2002 | ||||||||||
| Discount rate | 5.51 | % | 6.62 | % | 5.74 | % | 7.03 | % | ||
| Expected return on plan assets | 7.00 | % | N/A | 7.05 | % | N/A | ||||
| Rate of compensation increase | 3.39 | % | 4.00 | % | 3.46 | % | 4.00 | % | ||
The following table sets forth the projected benefit obligation, accumulated benefit obligation and fair value of plan assets for the defined benefit plans as of December 31, 2002 and 2001:
| |
December 31, 2002 |
December 31, 2001 |
|||||
|---|---|---|---|---|---|---|---|
| Defined benefit plans with accumulated benefit obligations in excess of plan assets: | |||||||
| Projected benefit obligation | $ | 765.4 | $ | 65.2 | |||
| Accumulated benefit obligation | 616.3 | 48.6 | |||||
| Fair value of plan assets | 544.8 | 25.1 | |||||
Defined benefit plans with plan assets in excess of accumulated benefit obligations: |
|||||||
| Projected benefit obligation | $ | 379.0 | $ | 893.9 | |||
| Accumulated benefit obligation | 341.7 | 781.3 | |||||
| Fair value of plan assets | 363.1 | 904.7 | |||||
In addition to the benefit plans described above, certain employees of Huntsman International participate in pension plans of Huntsman LLC. As of December 31, 2002 and 2001, an allocation of the pension liability of $3.1 million and $2.8 million, respectively, was recorded as other noncurrent liabilities.
Defined Contribution Plans
The Company has defined contribution plans covering its domestic employees and employees in some foreign subsidiaries who have completed at least two years of service.
The Company's total combined expense for the above defined contribution plans for the years ended December 31, 2002, 2001 and 2000 were approximately $6.1 million, $6.3 million, and $2.9 million, respectively.
17. Commitments and Contingencies
The Company has various purchase commitments for materials and supplies entered into in the ordinary course of business. These agreements extend from three to ten years and the purchase price is generally based on market prices subject to certain minimum price provisions.
The Company is a party to various proceedings instituted by private plaintiffs, governmental authorities and others arising under provisions of applicable laws, including various environmental, products liability and other laws. Based in part on the indemnities provided to the Company by ICI and Huntsman Specialty in connection with the transfer of businesses to the Company and insurance
F-204
coverage, management does not believe that the outcome of any of these matters will have a material adverse effect on financial condition or results of operations.
18. Environmental Matters
The operation of any chemical manufacturing plant and the distribution of chemical products and their related production of by-products and wastes, entails risk of adverse environmental effects. As a result, the Company is subject to extensive federal, state, local and foreign laws, regulations, rules and ordinances relating to pollution, protection of the environment and the generation, storage, handling, transportation, treatment, disposal and remediation of hazardous substances and waste materials. In the ordinary course of business, the Company is subject to frequent environmental inspections and monitoring by governmental enforcement authorities. In addition, the Company's production facilities require operating permits that are subject to renewal, modification and, in certain circumstances, revocation. Actual or alleged violations of environmental laws or permit requirements could result in restrictions or prohibitions on plant operations, substantial fines and civil or criminal sanctions. Moreover, changes in environmental regulations could inhibit or interrupt the Company's operations, or require it to change its equipment or operations, and any such changes could have a material adverse effect on its businesses. Accordingly, given the Company's businesses, environmental or regulatory matters may cause us significant unanticipated losses, costs or liabilities.
Under some environmental laws, the Company may be jointly and severally liable for the costs of environmental contamination on or from its properties and at off-site locations where it disposed of or arranged for the disposal or treatment of hazardous wastes. For example, in the United States under the Comprehensive Environmental Response, Compensation and Liability Act of 1980, as amended, and similar state laws, a current owner or operator of real property may be liable for such costs regardless of whether the owner or operator owned or operated the real property at the time of the release of the hazardous substances and regardless of whether the release or disposal was in compliance with law at the time it occurred. In addition, under the United States Resource Conservation and Recovery Act of 1976, as amended, and similar state laws, as the holder of permits to treat or store hazardous wastes, the Company may, under some circumstances, be required to remediate contamination at its properties regardless of when the contamination occurred. Similar laws are being developed or are in effect to varying degrees in other parts of the world, most notably in the EU. For example, in the U.K., the contaminated land regime now provides a detailed framework for the identification, management and remediation of contaminated sites. This law will likely increase governmental scrutiny of the Company's U.K. facilities.
The Company may also incur future costs for capital improvements and general compliance under environmental laws, including costs to acquire, maintain and repair pollution control equipment. Capital expenditures are planned, for example, under national legislation implementing the EU Directive on Integrated Pollution Prevention and Control. Under this directive the majority of the Company's European plants will, over the next few years, be required to obtain governmental authorizations which will regulate air and water discharges, waste management and other matters relating to the impact of operations on the environment, and to conduct site assessments to evaluate environmental conditions. Although the implementing legislation in most Member States is not yet in effect, it is likely that additional expenditures may be necessary in some cases to meet the requirements of authorizations under this directive. In particular, the Company believes that related expenditures to upgrade its wastewater treatment facilities at several sites may be necessary and associated costs may be material. Wastewater treatment upgrades unrelated to this initiative also are planned at certain facilities. In addition, the Company may also incur material expenditures, beyond currently anticipated expenditures, in complying with EU Directives, including the Directive on Hazardous Waste Incineration, the Seveso II Directive, which governs major accident hazards, as well as the Water Framework Directive. It is also possible that additional expenditures to reduce air emissions at two of
F-205
the Company's U.K. facilities may be material. Capital expenditures and, to a lesser extent, costs and operating expenses relating to environmental matters will be subject to evolving regulatory requirements and will depend on the timing of the promulgation and enforcement of specific standards which impose requirements on the Company's operations. Therefore, the Company cannot assure you that material capital expenditures beyond those currently anticipated will not be required under environmental laws.
The Company's operations involve the handling, transportation and use of numerous hazardous substances. From time to time, these operations may result in violations under environmental laws including spills or other releases of hazardous substances into the environment. In the event of a catastrophic incident, the Company could incur material costs or experience interruption in its operations as a result of addressing the incident and implementing measures to prevent such incidents in the future. Currently, the Company is aware of the following matters:
The Texas Commission on Environmental Quality (the "TCEQ," formerly the Texas Natural Resource Conservation Commission or TNRCC) has issued certain notices of violation relating to air emissions and wastewater issues at the Company's Port Neches, Texas facility and filed an amended administrative petition with respect to certain of these violations on January 12, 2001. The Company met with the TCEQ on several occasions in 2001 and early 2002 and reached a tentative settlement with the agency on penalties totaling $100,000. Although management does not anticipate it, it is possible that the terms of an air permit, which the Company applied for as a result of the settlement, may cause it to incur costs related to equipment serving this plant and others in the vicinity that could be material.
On October 6, 2002, a leak of sulphuric acid from two tanks located near the Company's Whitehaven, U.K. plant was discovered. About 342 to 347 tonnes of acid were released onto the ground and into the soil near the tanks. Although the Company took immediate steps to contain the spillage and recover acid, a quantity of acid reached a nearby beach via a geological fault. The Company believes the tanks were not owned by the Company; however, it did own the acid in the tanks. The EA and the Health and Safety Executive are investigating the incident. Whether charges will be brought or other actions taken by the regulatory authorities is unknown at this time. Although the Company can give no assurances, based on currently available information and its understanding of similar investigations and penalties in the past, the Company believes that, if any charges are brought or actions taken and the Company is ultimately found to be legally responsible, the probable penalties would not be material to its financial position or results of operations.
The Company is aware that there is or may be soil or groundwater contamination at some of its facilities resulting from past operations. Based on available information and the indemnification rights (including indemnities provided by Huntsman Specialty, ICI, Rhodia S.A. and The Dow Chemical Company, for the facilities that each of them transferred to the Company), the Company believes that the costs to investigate and remediate known contamination will not have a material adverse effect on its financial condition, results of operations or cash flows; however, it cannot give any assurance that such indemnities will fully cover the costs of investigation and remediation, that it will not be required to contribute to such costs or that such costs will not be material.
By letter dated March 6, 2003, the Company's subsidiary, Huntsman Ethyleneamines Ltd., was notified by the TCEQ of a probable enforcement action arising out of the inspection of the Freeport, Texas facility on December 16-19, 2002. Seven types of violations relating to Texas Clean Air Act requirements were cited. No penalty demand was made, although penalties are expected.
Given the nature of the Company's business, violations of environmental laws may result in restrictions imposed on its operating activities, substantial fines, penalties, damages or other costs, any of which could have a material adverse effect on its business, financial condition, results of operations or cash flows.
F-206
19. Related-party Transactions
The Company shares numerous services and resources with Huntsman LLC (the 60% owner of Holdings), ICI, and subsidiaries of both companies. In accordance with various agreements Huntsman LLC and ICI provide management, operating, maintenance, steam, electricity, water and other services to the Company. The Company also relies on Huntsman LLC, ICI and their subsidiaries to supply certain raw materials and to purchase products. Rubicon, Inc., and Louisiana Pigment Company are unconsolidated 50 percent owned affiliates of the Company. The amounts which the Company purchased from or sold to related parties are as follows (in millions):
| |
Year Ended December 31, 2002 |
Year Ended December 31, 2001 |
Year Ended December 31, 2000 |
|||||||||||||||
|---|---|---|---|---|---|---|---|---|---|---|---|---|---|---|---|---|---|---|
| |
Purchases From |
Sales To |
Purchases From |
Sales To |
Purchases From |
Sales To |
||||||||||||
| Huntsman LLC and subsidiaries | $ | 226.6 | $ | 57.7 | $ | 217.5 | $ | 73.8 | $ | 194.9 | $ | 80.3 | ||||||
| ICI and subsidiaries | 188.6 | 252.6 | 235.5 | 286.2 | 393.6 | 370.2 | ||||||||||||
| Unconsolidated affiliates | 392.7 | 23.4 | 537.5 | 16.0 | 580.7 | 14.0 | ||||||||||||
Included in purchases from Huntsman LLC and its subsidiaries for the years ended December 31, 2002, 2001 and 2000 is $65 million, $54 million, and $64 million, respectively, of allocated management costs which are reported in selling, general and administrative expenses. The amounts which the Company is owed or owes to related parties are as follows (in millions):
| |
December 31, 2002 |
December 31, 2001 |
||||||||||
|---|---|---|---|---|---|---|---|---|---|---|---|---|
| |
Receivables From |
Payables To |
Receivables From |
Payables To |
||||||||
| Huntsman LLC and subsidiaries | $ | 16.3 | $ | 47.1 | $ | 14.7 | $ | 44.0 | ||||
| ICI and subsidiaries | 39.9 | 6.3 | 34.5 | 2.5 | ||||||||
| Unconsolidated affiliates | 9.0 | 29.5 | 16.1 | 70.2 | ||||||||
20. Lease Commitments
The Company leases a number of assets which are accounted for as operating leases. The lease obligation reflected in the Company's statement of operations as rental expense, totaled $15.8 million, $18.5 million and $23.7 million for the three years ended December 31, 2002, 2001and 2000, respectively. The minimum future rental payments due under existing agreements are by year (in millions):
| Year |
Amount |
||
|---|---|---|---|
| 2003 | $ | 16.8 | |
| 2004 | 12.5 | ||
| 2005 | 8.7 | ||
| 2006 | 6.1 | ||
| 2007 | 5.3 | ||
| Later years | 51.0 | ||
The Company also has lease obligations accounted for as capital leases which are included in other long term debt. The present value of the future net minimum lease payments is $13.7 million at December 31, 2002.
F-207
21. Industry Segment and Geographic Area Information
The Company derives its revenues, earnings and cash flows from the manufacture and sale of a wide variety of specialty and commodity chemical products. The Company has four reportable operating segments: Polyurethanes, Performance Products, Pigments and Base Chemicals. During 2002 the Company realigned its principal operating segments. The most significant change was the split of the former Specialty Chemicals segment into two segments: Polyurethanes and Performance Products. The former Tioxide segment was renamed Pigments and the former Petrochemicals segment was renamed Base Chemicals.
The major products of each reportable operating segment are as follows:
| Segment |
Products |
|
|---|---|---|
| Polyurethanes | MDI, TDI, TPU, polyols, aniline, PO, TBA and MTBE | |
| Performance Products | Surfactants, ethyleneamines and other performance chemicals | |
| Pigments | Titanium dioxide | |
| Base Chemicals | Ethylene, propylene, benzene, cyclohexane and paraxylene |
Sales between segments are generally recognized at external market prices. For the years ended December 31, 2002, 2001 and 2000, sales to ICI and its affiliates accounted for approximately 6%, 6%, and 8% of consolidated revenues, respectively.
F-208
Financial information for each of the Company's reportable operating segments is as follows (dollars in millions):
| |
Year Ended December 31, 2002 |
Year Ended December 31, 2001 |
Year Ended December 31, 2000 |
|||||||||
|---|---|---|---|---|---|---|---|---|---|---|---|---|
| Net Sales: | ||||||||||||
| Polyurethanes | $ | 2,066.0 | $ | 2,073.7 | $ | 2,065.3 | ||||||
| Performance Products | 574.3 | 455.3 | 43.2 | |||||||||
| Pigments | 880.3 | 872.1 | 955.8 | |||||||||
| Base Chemicals | 1,097.5 | 1,268.6 | 1,485.5 | |||||||||
| Eliminations | (100.0 | ) | (94.5 | ) | (101.9 | ) | ||||||
| Total | $ | 4,518.1 | $ | 4,575.2 | $ | 4,447.9 | ||||||
| Segment Income (Loss)(1): | ||||||||||||
| Polyurethanes | $ | 230.4 | $ | 132.7 | $ | 218.3 | ||||||
| Performance Products | 16.6 | 16.4 | — | |||||||||
| Pigments | 14.0 | 95.6 | 172.8 | |||||||||
| Base Chemicals | (33.4 | ) | (23.0 | ) | 39.8 | |||||||
| Total | 227.6 | 221.7 | 430.9 | |||||||||
| Unallocated administrative and other items(3) | 0.5 | (48.6 | ) | (7.2 | ) | |||||||
| Operating income | $ | 228.1 | $ | 173.1 | $ | 423.7 | ||||||
| EBITDA(2): | ||||||||||||
| Polyurethanes | $ | 365.1 | $ | 262.7 | $ | 350.2 | ||||||
| Performance Products | 27.2 | 21.1 | — | |||||||||
| Pigments | 68.3 | 139.4 | 214.4 | |||||||||
| Base Chemicals | 13.8 | 20.4 | 86.6 | |||||||||
| Unallocated administrative and other items(3) | 5.7 | (58.2 | ) | (29.0 | ) | |||||||
| Total | $ | 480.1 | $ | 385.4 | $ | 622.2 | ||||||
| Depreciation and Amortization: | ||||||||||||
| Polyurethanes | $ | 134.7 | $ | 130.1 | $ | 115.7 | ||||||
| Performance Products | 10.6 | 4.6 | — | |||||||||
| Pigments | 54.2 | 43.8 | 41.8 | |||||||||
| Base Chemicals | 47.3 | 43.4 | 42.9 | |||||||||
| Unallocated administrative and other items(3) | 9.4 | 5.2 | 3.2 | |||||||||
| Total | $ | 256.2 | $ | 227.1 | $ | 203.6 | ||||||
| Capital Expenditures: | ||||||||||||
| Polyurethanes | $ | 58.3 | $ | 77.6 | $ | 81.5 | ||||||
| Performance Products | 11.5 | 5.9 | — | |||||||||
| Pigments | 97.4 | 161.4 | 86.3 | |||||||||
| Base Chemicals | 23.3 | 29.3 | 32.5 | |||||||||
| Unallocated administrative and other items(3) | — | 16.8 | 4.2 | |||||||||
| Total | $ | 190.5 | $ | 291.0 | $ | 204.5 | ||||||
| Total Assets: | ||||||||||||
| Polyurethanes | $ | 3,489.4 | $ | 3,217.4 | $ | 3,236.8 | ||||||
| Performance Products | 307.7 | 316.2 | — | |||||||||
| Pigments | 1,415.3 | 1,386.6 | 1,308.4 | |||||||||
| Base Chemicals | 1,052.6 | 939.3 | 1,046.6 | |||||||||
| Unallocated administrative and other items(3) | 3,337.0 | 3,246.1 | 3,144.7 | |||||||||
| Eliminations | (4,557.9 | ) | (4,279.1 | ) | (3,958.6 | ) | ||||||
| Total | $ | 5,044.1 | $ | 4,826.5 | $ | 4,777.9 | ||||||
F-209
| |
Year Ended December 31, 2002 |
Year Ended December 31, 2001 |
Year Ended December 31, 2000 |
|||||||||
|---|---|---|---|---|---|---|---|---|---|---|---|---|
| |
(In millions) |
|||||||||||
| By Geographic Area | ||||||||||||
Net Sales: |
||||||||||||
| United States | $ | 1,742.4 | $ | 1,573.1 | $ | 1,537.7 | ||||||
| United Kingdom | 1,537.9 | 1,628.5 | 1,809.7 | |||||||||
| Netherlands | 894.6 | 929.8 | 802.4 | |||||||||
| Other nations | 1,457.6 | 1,344.5 | 1,116.4 | |||||||||
| Adjustments and eliminations | (1,114.4 | ) | (900.7 | ) | (818.3 | ) | ||||||
| Total | $ | 4,518.1 | $ | 4,575.2 | $ | 4,447.9 | ||||||
| Long-lived Assets: | ||||||||||||
| United States | $ | 1,172.0 | $ | 1,251.4 | $ | 1,278.1 | ||||||
| United Kingdom | 1,153.2 | 1,022.2 | 946.0 | |||||||||
| Netherlands | 396.3 | 338.3 | 345.4 | |||||||||
| Other nations | 714.3 | 611.7 | 534.6 | |||||||||
| Corporate | 3.1 | 18.6 | (18.1 | ) | ||||||||
| Total | $ | 3,438.9 | $ | 3,242.2 | $ | 3,086.0 | ||||||
22. Selected Quarterly Financial Data (Unaudited—in millions)
| |
Three Months Ended March 31, 2002 |
Three Months Ended June 30, 2002 |
Three Months Ended September 30, 2002 |
Three Months Ended December 31, 2002 |
Year Ended December 31, 2002 |
|||||||||||
|---|---|---|---|---|---|---|---|---|---|---|---|---|---|---|---|---|
| Revenues | $ | 997.9 | $ | 1,175.0 | $ | 1,195.2 | $ | 1,150.0 | $ | 4,518.1 | ||||||
| Gross profit | 125.5 | 157.6 | 174.9 | 157.4 | 615.4 | |||||||||||
| Operating income | 24.5 | 81.8 | 67.9 | 53.9 | 228.1 | |||||||||||
| Net income (loss) | (31.4 | ) | 7.3 | (13.3 | ) | (31.1 | ) | (68.5 | ) | |||||||
Three Months Ended March 31, 2001 |
Three Months Ended June 30, 2001 |
Three Months Ended September 30, 2001 |
Three Months Ended December 31, 2001 |
Year Ended December 31, 2001 |
||||||||||||
|---|---|---|---|---|---|---|---|---|---|---|---|---|---|---|---|---|
| Revenues | $ | 1,151.6 | $ | 1,284.1 | $ | 1,133.4 | $ | 1,006.1 | $ | 4,575.2 | ||||||
| Gross profit | 166.0 | 170.6 | 139.6 | 108.9 | 585.1 | |||||||||||
| Operating income (loss) | 71.6 | 84.7 | 49.5 | (32.7 | ) | 173.1 | ||||||||||
| Net income (loss) | (4.4 | ) | 0.5 | (28.0 | ) | (107.5 | ) | (139.4 | ) | |||||||
Three Months Ended March 31, 2000 |
Three Months Ended June 30, 2000 |
Three Months Ended September 30, 2000 |
Three Months Ended December 31, 2000 |
Year Ended December 31, 2000 |
|||||||||||
|---|---|---|---|---|---|---|---|---|---|---|---|---|---|---|---|
| Revenues | $ | 1,054.9 | $ | 1,154.7 | $ | 1,136.9 | $ | 1,101.4 | $ | 4,447.9 | |||||
| Gross profit | 181.3 | 205.8 | 195.4 | 160.0 | 742.5 | ||||||||||
| Operating income | 98.5 | 132.9 | 110.4 | 81.9 | 423.7 | ||||||||||
| Net income (loss) | 19.7 | 47.3 | 23.3 | (8.3 | ) | 82.0 | |||||||||
During the three months ended December 31, 2002 and 2001, the Company incurred $7.7 million and $44.7 million of restructuring and plant closing costs, respectively (see Note 10).
During the quarter ended March 31, 2001, the Company adopted SFAS No. 133 and recorded a $1.5 million loss.
F-210
23. Restatements
In the course of preparing a registration statement in October 2004 for the proposed initial public offering of the common stock of the company's ultimate parent, the company determined to reclassify certain amounts in its consolidated statements of cash flows for the year ended December 31, 2002 and 2001, to accurately reflect the effects of foreign currency exchange gains and losses and investments in unconsolidated affiliates. As a result, the company restated the accompanying consolidated statements of cash flows for the years ended December 31, 2002 and 2001. There was no change to the line "Cash or Cash Equivalents" due to this restatement. A summary of the significant effects of this restatement is provided below (dollars in millions):
| |
Year Ended December 31, 2002 |
Year Ended December 31, 2001 |
||||||||||
|---|---|---|---|---|---|---|---|---|---|---|---|---|
| |
As previously reported |
As restated |
As previously reported |
As restated |
||||||||
| Net cash provided by operating activities | $ | 157.5 | $ | 178.1 | $ | 202.4 | $ | 191.1 | ||||
| Effect of exchange rate changes on cash | 21.8 | 1.2 | (5.1 | ) | 6.2 | |||||||
F-211
Until , 2005 (25 days after the date of this prospectus), all dealers that buy, sell or trade our common stock, whether or not participating in this offering, may be required to deliver a prospectus. This is in addition to the dealers' obligation to deliver a prospectus when acting as underwriters and with respect to unsold allotments or subscriptions.
Huntsman Corporation
Shares
Common Stock
| Citigroup |
Credit Suisse First Boston |
Merrill Lynch & Co. |
Deutsche Bank Securities |
PROSPECTUS
, 2004
PART II
INFORMATION NOT REQUIRED IN PROSPECTUS
Item 13. Other Expenses of Issuance and Distribution.
The following table sets forth the costs and expenses, other than the underwriting discounts and commissions, payable by the registrant in connection with the sale of the securities being registered. All amounts are estimates except the Securities and Exchange Commission registration fee, the NASD filing fee and the New York Stock Exchange listing fee.
| Securities and Exchange Commission Registration Fee | $ | 203,987 | |
| NASD Filing Fee | 30,500 | ||
| New York Stock Exchange Filing Fee | * | ||
| Printing Costs | * | ||
| Legal Fees and Expenses | * | ||
| Accounting Fees and Expenses | * | ||
| Directors' and Officers' Insurance Policy Premium | * | ||
| Blue Sky Fees and Expenses | * | ||
| Transfer Agent and Registrar Fees | * | ||
| Miscellaneous | * | ||
| Total | $ | * | |
Item 14. Indemnification of Directors and Officers.
Section 145 of the General Corporation Law of the State of Delaware (the "DGCL") authorizes a corporation, under certain circumstances, to indemnify any person who was or is a party or is threatened to be made a party to any threatened, pending or completed action, suit or proceeding, whether civil, criminal, administrative or investigative (other than an action by or in the right of the corporation), by reason of the fact that the person is or was an officer or director of such corporation, or is or was serving at the request of that corporation as a director, officer, employee or agent of another corporation, partnership, joint venture, trust or other enterprise, against expenses (including attorneys' fees), judgments, fines and amounts paid in settlement actually and reasonably incurred by such person in connection with such action, suit or proceeding, if he acted in good faith and in a manner he reasonably believed to be in or not opposed to the best interests of the corporation. With respect to any criminal action or proceeding, such indemnification is available if he had no reasonable cause to believe his conduct was unlawful.
The registrant's Amended and Restated Certificate of Incorporation (the "Certificate of Incorporation"), together with the registrant's Amended and Restated Bylaws (the "Bylaws"), provide for indemnification of each person who was or is made a party or is threatened to be made a party to or is involved in any action, suit or proceeding, whether civil, criminal, administrative or investigative (hereinafter a "proceeding"), by reason of the fact that he or she is or was a director or officer of the registrant, or serves at the request of the registrant, in any capacity, any corporation, partnership or other entity in which the registrant has a partnership or other interest, including service with respect to employee benefit plans, whether the basis of such proceeding is alleged action in an official capacity as a director, officer, employee or agent or in any other capacity while serving as a director, officer, employee or agent, and shall be indemnified and held harmless by the registrant to the fullest extent authorized by the DGCL, against all expense, liability and loss reasonably incurred or suffered by such person in connection therewith and such indemnification shall continue as to a person who has ceased
II-1
to be a director, officer, employee or agent and shall inure to the benefit of his or her heirs, executors and administrators.
Section 145 of the DGCL also empowers a corporation to purchase and maintain insurance on behalf of any person who is or was an officer or director of such corporation against liability asserted against or incurred by him in any such capacity, whether or not such corporation would have the power to indemnify such officer or director against such liability under the provisions of Section 145.
The Certificate of Incorporation and the Bylaws also provide that the registrant may maintain insurance, at the registrant's expense, to protect itself and any person who is or was serving as a director, officer, employee or agent of the registrant or is or was serving at the request of the registrant as a director, officer, employee or agent of another corporation, partnership, joint venture, trust or other enterprise against any expense, liability or loss, whether or not the registrant would have the power to indemnify such person against such expense, liability or loss under the DGCL.
Section 102(b)(7) of the DGCL provides that a certificate of incorporation may contain a provision eliminating or limiting the personal liability of a director to the corporation or its stockholders for monetary damages for breach of fiduciary duty as a director, provided that such provision shall not eliminate or limit the liability of a director (a) for any breach of the director's duty of loyalty to the corporation or its stockholders, (b) for acts or omissions not in good faith or which involve intentional misconduct or a knowing violation of law, (c) under Section 174 of the DGCL (relating to liability for unauthorized acquisitions or redemptions of, or dividends on, capital stock) or (d) for any transaction from which the director derived improper personal benefit. The Certificate of Incorporation contains such a provision.
The registrant intends to enter into customary indemnification agreements with its officers and directors.
Item 15. Recent Sales of Unregistered Securities.
The following is a description of all securities that the registrant has sold within the past three years without registering the securities under the Securities Act:
On October 19, 2004, the registrant issued 1,000 shares of its common stock to Huntsman Holdings, LLC in consideration for $1,000. In so doing, the registrant relied on the provisions of Section 4(2) of the Securities Act in claiming exemption for the offering, sale and delivery of such securities from registration under the Securities Act.
The Reorganization Transaction will be completed immediately prior to the completion of the offering contemplated by this registration statement. In the Reorganization Transaction, Huntsman Holdings, LLC will merge into the registrant, and the existing holders of the membership interests in Huntsman Holdings, LLC will receive an aggregate of shares of our common stock in exchange for such interests. In addition, the holders of the HMP Warrants will exchange all of their warrants for an aggregate of shares of our common stock. In so doing, the registrant will rely on the provisions of Section 4(2) of the Securities Act in claiming exemption for the offering, sale and delivery of such securities from registration under the Securities Act.
Item 16. Exhibits and Financial Statement Schedules.
(a) Exhibits.
| Number |
Description |
|
|---|---|---|
| 1.1** | Form of Underwriting Agreement | |
II-2
2.1** |
Form of Reorganization Agreement |
|
3.1** |
Form of Amended and Restated Certificate of Incorporation of Huntsman Corporation |
|
3.2** |
Form of Amended and Restated By-laws of Huntsman Corporation |
|
4.1 |
Amended and Restated Indenture, dated as of August 2, 1999, between Huntsman International Holdings LLC (f/k/a Huntsman ICI Holdings LLC) and Bank One, N.A., as Trustee, relating to the 13.375% Senior Discount Notes due 2009 (incorporated by reference to Exhibit 4.1 to the registration statement on Form S-4 of Huntsman International Holdings LLC (File No. 333-88057)) |
|
4.2 |
Form of certificate of 13.375% Senior Discount Note due 2009 (included as Exhibit A-3 to Exhibit 4.1) |
|
4.3 |
Exchange and Registration Rights Agreement, dated as of August 2, 1999, among Huntsman International Holdings LLC (f/k/a Huntsman ICI Holdings LLC) and the Purchasers named therein, relating to the 13.375% Senior Discount Notes due 2009 (incorporated by reference to Exhibit 4.3 to the registration statement on Form S-4 of Huntsman International Holdings LLC (File No. 333-88057)) |
|
4.4 |
Amended and Restated Indenture, dated as of December 20, 2001, between Huntsman International Holdings LLC and Bank One, N.A., as Trustee, relating to the 8% Senior Subordinated Reset Discount Notes due 2009 (incorporated by reference to Exhibit 4.9 to amendment no. 1 to the annual report on Form 10-K/A of Huntsman International Holdings LLC for the year ended December 31, 2001) |
|
4.5 |
Form of certificate of 8% Senior Subordinated Reset Discount Note due 2009 (incorporated by reference to Exhibit 10.11 to the registration statement on Form S-4 of Huntsman International Holdings LLC (File No. 333-88057)) |
|
4.6 |
Registration Rights Agreement dated as of June 30, 1999, by and among Huntsman ICI Holdings LLC and the holders of the 8% Senior Subordinated Reset Discount Notes due 2009 specified therein (incorporated by reference to Exhibit 4.11 to amendment no. 1 to the annual report on Form 10-K/A of Huntsman International Holdings LLC for the year ended December 31, 2001) |
|
4.7 |
Private Sale Letter Agreement, dated December 20, 2001, between Huntsman International Holdings LLC and ICI Finance plc (incorporated by reference to Exhibit 4.12 to amendment no. 1 to the annual report on Form 10-K/A of Huntsman International Holdings LLC for the year ended December 31, 2001) |
|
4.8 |
Form of Registration Rights Agreement among Huntsman International Holdings LLC and the Holders as defined therein (incorporated by reference to Exhibit 4.13 to amendment no. 1 to the annual report on Form 10-K/A of Huntsman International Holdings LLC for the year ended December 31, 2001) |
|
II-3
4.9 |
Form of Registration Rights Agreement among Huntsman International Holdings LLC and the Initial Purchasers as defined therein (incorporated by reference to Exhibit 4.14 to amendment no. 1 to the annual report on Form 10-K/A of Huntsman International Holdings LLC for the year ended December 31, 2001) |
|
4.10 |
Indenture, dated as of June 30, 1999, among Huntsman International LLC (f/k/a Huntsman ICI Chemicals LLC), the Guarantors party thereto and Bank One, N.A., as Trustee, relating to the 101/2% Senior Subordinated Notes due 2009 (incorporated by reference to Exhibit 4.1 to the registration statement on Form S-4 of Huntsman International LLC (File No. 333-85141)) |
|
4.11 |
Form of 101/8% Senior Subordinated Note due 2009 denominated in dollars (included as Exhibit A-3 to Exhibit 4.10) |
|
4.12 |
Form of 101/8% Senior Subordinated Note due 2009 denominated in euros (included as Exhibit A-4 to Exhibit 4.10) |
|
4.13 |
Form of Guarantee relating to the 101/8% Senior Subordinated Notes due 2009 (included as Exhibit E of Exhibit 4.10) |
|
4.14 |
First Amendment, dated January 5, 2000, to Indenture, dated as of June 30, 1999, among Huntsman International LLC (f/k/a Huntsman ICI Chemicals LLC), as Issuer, each of the Guarantors named therein and Bank One, N.A., as Trustee (incorporated by reference to Exhibit 4.6 to the registration statement on Form S-4 of Huntsman International LLC (File No. 333-85141)) |
|
4.15 |
Indenture, dated as of March 13, 2001, among Huntsman International LLC, as Issuer, the Guarantors named therein and The Bank of New York, as Trustee, relating to 101/8% Senior Subordinated Notes due 2009 (incorporated by reference to Exhibit 4.6 to amendment no. 1 to the annual report on Form 10-K/A of Huntsman International LLC for the year ended December 31, 2001) |
|
4.16 |
Form of 101/8% Senior Subordinated Note due 2009 denominated in dollars (included as Exhibit A-3 to Exhibit 4.15) |
|
4.17 |
Form of 101/8% Senior Subordinated Note due 2009 denominated in euros (included as Exhibit A-4 to Exhibit 4.15) |
|
4.18 |
Form of Guarantee relating to the 101/8% Senior Subordinated Notes due 2009 (included as Exhibit E of Exhibit 4.15) |
|
4.19 |
First Supplemental Indenture, dated as of January 11, 2002, among Huntsman International LLC, as Issuer, the Guarantors named therein and The Bank of New York, as Trustee, relating to 101/8% Senior Subordinated Notes due 2009 (incorporated by reference to Exhibit 4.7 to amendment no. 1 to the annual report on Form 10-K/A of Huntsman International LLC for the year ended December 31, 2001) |
|
II-4
4.20 |
Indenture, dated as of March 21, 2002, among Huntsman International LLC, as Issuer, the Guarantors named therein and Wells Fargo Bank Minnesota, National Association, as Trustee, relating to the 97/8% Senior Notes due 2009 (incorporated by reference to Exhibit 4.8 to amendment no. 1 to the annual report on Form 10-K/A of Huntsman International LLC for the year ended December 31, 2001) |
|
4.21 |
Form of 97/8% Senior Note due 2009 denominated in dollars (included as Exhibit A-3 to Exhibit 4.20) |
|
4.22 |
Form of 97/8% Senior Note due 2009 denominated in euros (included as Exhibit A-4 to Exhibit 4.20) |
|
4.23 |
Form of Guarantee relating to the 97/8% Senior Notes due 2009 (included as Exhibit E of Exhibit 4.20) |
|
4.24 |
Amended and Restated Guarantee, dated as of April 11, 2003, among the Guarantors named therein and Wells Fargo Bank Minnesota, National Association, as Trustee, relating to the 97/8% Senior Notes due 2009 (incorporated by reference to Exhibit 4.15 to the registration statement on Form S-4 of Huntsman International LLC (File No. 333-106482)) |
|
4.25 |
Exchange and Registration Rights Agreement, dated as of March 21, 2002, among Huntsman International LLC, the Guarantors as defined therein, and the Purchasers as defined therein, relating to the 97/8% Senior Notes due 2009 (incorporated by reference to Exhibit 4.9 to amendment no. 1 to the annual report on Form 10-K/A of Huntsman International LLC for the year ended December 31, 2001) |
|
4.26 |
Exchange and Registration Rights Agreement, dated as of April 11, 2003, among Huntsman International LLC, the Guarantors, as defined therein, and the Purchasers as defined therein, relating to the 97/8 %Senior Notes due 2009 (incorporated by reference to Exhibit 4.17 to the registration statement on Form S-4 of Huntsman International LLC (File No. 333-106482)) |
|
4.27 |
Amended and Restated Indenture, dated as of June 14, 2002, among Huntsman Corporation (now known as Huntsman LLC), as Issuer, each of the Guarantors party thereto and Wilmington Trust Company, as Trustee, relating to the $200,000,000 91/2% Senior Subordinated Notes due 2007 (incorporated by reference to Exhibit 4.27 to the registration statement on Form S-4 of Huntsman LLC (File No. 333-112279)) |
|
4.28 |
Form of Amended and Restated $200,000,000 91/2% Senior Subordinated Note due 2007 (included as Exhibit A to Exhibit 4.27) |
|
4.29 |
First Supplemental Indenture, dated as of July 11, 2002, among Huntsman Corporation (now known as Huntsman LLC), as Issuer, each of the Guarantors party thereto and Wilmington Trust Company, as Trustee, relating to the $200,000,000 91/2% Senior Subordinated Notes due 2007 (incorporated by reference to Exhibit 4.29 to the registration statement on Form S-4 of Huntsman LLC (File No. 333-112279)) |
|
II-5
4.30 |
Second Supplemental Indenture, dated as of August 15, 2002, among Huntsman Corporation (now known as Huntsman LLC), as Issuer, each of the Guarantors party thereto and Wilmington Trust Company, as Trustee, relating to the $200,000,000 91/2% Senior Subordinated Notes due 2007 (incorporated by reference to Exhibit 4.30 to the registration statement on Form S-4 of Huntsman LLC (File No. 333-112279)) |
|
4.31 |
Amended and Restated Indenture, dated as of June 14, 2002, among Huntsman Corporation (now known as Huntsman LLC), as Issuer, each of the Guarantors party thereto and Wilmington Trust Company, as Trustee, relating to the $275,000,000 91/2% Senior Subordinated Notes due 2007 and the $125,000,000 Senior Subordinated Floating Rate Notes due 2007 (incorporated by reference to Exhibit 4.31 to the registration statement on Form S-4 of Huntsman LLC (File No. 333-112279)) |
|
4.32 |
Form of Amended and Restated Fixed Rate Note due 2007 (included as Exhibit A to Exhibit 4.31) |
|
4.33 |
Form of Amended and Restated Floating Rate Note due 2007 (included as Exhibit B to Exhibit 4.31) |
|
4.34 |
First Supplemental Indenture, dated as of July 11, 2002, among Huntsman Corporation (now known as Huntsman LLC), as Issuer, each of the Guarantors party thereto and Wilmington Trust Company, as Trustee, relating to the $275,000,000 91/2% Senior Subordinated Notes due 2007 and the $125,000,000 Senior Subordinated Floating Rate Notes due 2007 (incorporated by reference to Exhibit 4.34 to the registration statement on Form S-4 of Huntsman LLC (File No. 333-112279)) |
|
4.35 |
Second Supplemental Indenture, dated as of August 15, 2002, among Huntsman Corporation (now known as Huntsman LLC), as Issuer, each of the Guarantors party thereto and Wilmington Trust Company, as Trustee, relating to the $275,000,000 91/2% Senior Subordinated Notes due 2007 and the $125,000,000 Senior Subordinated Floating Rate Notes due 2007 (incorporated by reference to Exhibit 4.35 to the registration statement on Form S-4 of Huntsman LLC (File No. 333-112279)) |
|
4.36 |
Indenture, dated as of September 30, 2003, among Huntsman LLC, the Guarantors party thereto and HSBC Bank USA, as Trustee, relating to the 115/8% Senior Secured Notes due 2010 (incorporated by reference to Exhibit 4.36 to the registration statement on Form S-4 of Huntsman LLC (File No. 333-112279)) |
|
4.37 |
Form of unrestricted 115/8% Senior Secured Note due 2010 (included as Exhibit A-2 to Exhibit 4.36) |
|
4.38 |
Form of guarantee relating to the 115/8% Senior Secured Notes due 2010 (included as Exhibit E to Exhibit 4.36) |
|
4.39 |
Exchange and Registration Rights Agreement, dated as of September 30, 2003, among Huntsman LLC, the Guarantors as defined therein, and the Purchasers as defined therein, relating to $380,000,000 aggregate principal amount of the 115/8% Senior Secured Notes due 2010 (incorporated by reference to Exhibit 4.39 to the registration statement on Form S-4 of Huntsman LLC (File No. 333-112279)) |
|
II-6
4.40 |
Exchange and Registration Rights Agreement, dated as of December 12, 2003, among Huntsman LLC, the Guarantors as defined therein, and the Purchasers as defined therein, relating to $75,400,000 aggregate principal amount of the 115/8% Senior Secured Notes due 2010 (incorporated by reference to Exhibit 4.40 to the registration statement on Form S-4 of Huntsman LLC (File No. 333-112279)) |
|
4.41 |
Indenture, dated as of June 30, 2003, among Huntsman Advanced Materials LLC, as Issuer, each of the Guarantors named therein and Wells Fargo Bank Minnesota, National Association, as Trustee (incorporated by reference to Exhibit 4.1 to the registration statement on Form S-4 of Huntsman Advanced Materials LLC (File No. 333-115344)) |
|
4.42 |
Form of Unrestricted Fixed Rate Note (included as Exhibit A-3 to Exhibit 4.41) |
|
4.43 |
Form of Unrestricted Floating Rate Note (included as Exhibit A-4 to Exhibit 4.41) |
|
4.44 |
Form of Guarantee (included as Exhibit E to Exhibit 4.41) |
|
4.45 |
Registration Rights Agreement, dated as of June 30, 2003, among Huntsman Advanced Materials LLC and the Guarantors named therein, as Issuers, and Deutsche Bank Securities Inc. and UBS Securities LLC, as Initial Purchasers (incorporated by reference to Exhibit 4.5 to the registration statement on Form S-4 of Huntsman Advanced Materials LLC (File No. 333-115344)) |
|
4.46 |
Indenture, dated as of May 9, 2003, among HMP Equity Holdings Corporation, as Issuer, ICI Alta Inc. (now known as Alta One Inc.), as Guarantor, and Wells Fargo Bank Minnesota, National Association, as Trustee, relating to the 15% Senior Secured Discount Notes due 2008 (incorporated by reference to Exhibit 4.46 to the registration statement on Form S-4 of HMP Equity Holdings Corporation (File No. 333-116100)) |
|
4.47 |
Form of 15% Senior Secured Discount Note due 2008 (included as Exhibit A-2 to Exhibit 4.46) |
|
4.48 |
Form of Guarantee (included as Exhibit E to Exhibit 4.46) |
|
4.49 |
Exchange and Registration Rights Agreement, dated as of May 9, 2003, among HMP Equity Holdings Corporation, ICI Alta Inc. (now known as Alta One Inc.), Credit Suisse First Boston LLC, and CIBC World Markets Corp (incorporated by reference to Exhibit 4.49 to the registration statement on Form S-4 of HMP Equity Holdings Corporation (File No. 333-116100)) |
|
4.50 |
Indenture, dated August 1, 2000, between Vantico Group S.A., as issuer, and The Bank of New York, as trustee (incorporated by reference to Exhibit 4.1 to the registration statement on Form F-4 of Vantico Group S.A. (File No. 333-13156)) |
|
4.51 |
First Supplemental Indenture, dated as of April 10, 2003, between Vantico Group S.A., as issuer, and The Bank of New York, as trustee (incorporated by reference to Exhibit 4.7 to the registration statement of Form S-4 of Huntsman Advanced Materials LLC (File No. 333-115344)) |
|
II-7
4.52 |
Second Supplemental Indenture, dated as of June 17, 2003, between Vantico Group S.A., as issuer, and The Bank of New York, as trustee (incorporated by reference to Exhibit 4.8 to the registration statement of Form S-4 of Huntsman Advanced Materials LLC (File No. 333-115344)) |
|
4.53 |
Third Supplemental Indenture, dated as of June 30, 2003, between Vantico Group S.A., as issuer, and The Bank of New York, as trustee (incorporated by reference to Exhibit 4.51 to the registration statement on Form S-4 of HMP Equity Holdings Corporation (File No. 333-116100)) |
|
4.54 |
Indenture, dated as of June 22, 2004, among Huntsman LLC, the Guarantors party thereto and HSBC Bank USA, as Trustee, relating to the 111/2% Senior Notes due 2012 and Senior Floating Rate Notes due 2011 (incorporated by reference to Exhibit 4.1 to the quarterly report on Form 10-Q of Huntsman LLC for the three months ended June 30, 2004) |
|
4.55 |
Form of restricted Fixed Rate Note due 2012 (included as Exhibit A-1 to Exhibit 4.54) |
|
4.56 |
Form of Restricted Floating Rate Note due 2011 (included as Exhibit A-2 to Exhibit 4.54) |
|
4.57 |
Form of Guarantee relating to the 111/2% Senior Notes due 2012 and Senior Floating Rate Notes due 2011 (included as Exhibit E to Exhibit 4.54) |
|
4.58 |
Exchange and Registration Rights Agreement, dated of June 22, 2004, among Huntsman LLC, the Guarantors as defined therein, and the Purchasers as defined therein, relating to $300,000,000 111/2% Senior Notes due 2012 and $100,000,000 Senior Floating Rate Notes due 2011 (incorporated by reference to Exhibit 4.5 to the quarterly report on Form 10-Q of Huntsman LLC for the three months ended June 30, 2004) |
|
4.59** |
Registration Rights Agreement, dated as of May 9, 2003, by and among HMP Equity Holdings Corporation, Huntsman Holdings, LLC, Huntsman Group Inc., Huntsman Family Holdings II Company LLC (now known as Huntsman Family Holdings Company LLC), MatlinPatterson Global Opportunities, L.P., Credit Suisse First Boston LLC and CIBC World Markets Corp. |
|
4.60** |
Warrant Agreement among HMP Equity Holdings Corporation, Huntsman Holdings, LLC, Huntsman Group Inc. and Wells Fargo Bank Minnesota, National Association dated as of May 9, 2003 |
|
4.61** |
Form of Registration Rights Agreement by and among Huntsman Corporation, HMP Investments LLC, Huntsman Family Holdings Company LLC and MatlinPatterson Global Opportunities Partners, L.P. |
|
4.62** |
Form of stock certificate of Huntsman Corporation |
|
5.1** |
Opinion of Vinson & Elkins L.L.P. as to the validity of the shares being registered |
|
10.1 |
Business Consulting Agreement, dated as of June 3, 2003, between Huntsman International LLC and Jon M. Huntsman (incorporated by reference to Exhibit 10.41 to the registration statement on Form S-4 of Huntsman International LLC (File No. 333-106482)) |
|
II-8
10.2 |
Aircraft Dry Lease, dated as of September 14, 2001, between Jstar Corporation and Airstar Corporation (incorporated by reference to Exhibit 10.10 to the registration statement on Form S-4 of Huntsman LLC (File No. 333-112279)) |
|
10.3 |
Amended and Restated Subordinated Promissory Note, dated as of July 2, 2001, by Huntsman Corporation (now known as Huntsman LLC) in favor of Horizon Ventures, L.C. (incorporated by reference to Exhibit 10.11 to the registration statement on Form S-4 of Huntsman LLC (File No. 333-112279)) |
|
10.4 |
Interest Holders Agreement, dated as of September 30, 2002, among Huntsman Holdings, LLC, HMP Equity Holdings Corporation, Huntsman Company LLC (now known as Huntsman LLC), Huntsman Family Holdings II Company LLC (now known as Huntsman Family Holdings Company LLC) and MatlinPatterson Global Opportunities Partners L.P. (incorporated by reference to Exhibit 10.12 to the registration statement on Form S-4 of Huntsman LLC (File No. 333-112279)) |
|
10.5 |
First Amendment to the Interest Holders Agreement, dated as of May 9, 2003, among Huntsman LLC, HMP Equity Holdings Corporation, Huntsman Family Holdings II Company LLC (now known as Huntsman Family Holdings Company LLC) MatlinPatterson Global Opportunities Partners L.P., Huntsman Group Inc. and Huntsman Holdings, LLC (incorporated by reference to Exhibit 10.13 to the registration statement on Form S-4 of Huntsman LLC (File No. 333-112279)) |
|
10.6 |
Credit Agreement, dated as of June 30, 2003, among Huntsman Advanced Materials LLC, certain subsidiaries from time to time party thereto and various lending institutions with Deutsche Bank AG, New York Branch, as Administrative Agent (incorporated by reference to Exhibit 10.1 to the registration statement on Form S-4 of Huntsman Advanced Materials LLC (File No. 333-115344)) |
|
10.7 |
Intercreditor and Collateral Agency Agreement, dated as of June 30, 2003, among Deutsche Bank AG, New York Branch, as administrative agent, Wells Fargo Bank Minnesota, National Association, as trustee, Huntsman Advanced Materials LLC and the subsidiaries listed therein (incorporated by reference to Exhibit 10.2 to the registration statement on Form S-4 of Huntsman Advanced Materials LLC (File No. 333-115344)) |
|
10.8 |
Pledge Agreement, dated as of May 9, 2003, by HMP Equity Holdings Corporation, as Issuer and Pledgor, and Huntsman Holdings, LLC, Huntsman Group Inc. and ICI Alta Inc. (now known as Alta One Inc.), as Pledgors, and Wells Fargo Bank Minnesota, National Association, as Trustee (incorporated by reference to Exhibit 10.28 to the registration statement on Form S-4 of HMP Equity Holdings Corporation (File No. 333-116100)) |
|
10.9 |
Amended and Restated Credit Agreement, dated as of July 13, 2004, among Huntsman International LLC, as the borrower, Huntsman International Holdings LLC, as the guarantor, Deutsche Bank Trust Company Americas, as administrative agent, Deutsche Bank Securities Inc., as co-lead arranger and joint book runner, JP Morgan Securities Inc., as co-documentation agent and joint book runner, UBS Securities LLC, as co-syndication agent, Credit Suisee First Boston, as co-documentation agent, Merrill Lynch, Pierce Fenner & Smith Inc., as co-documentation agent, and various lending institutions party thereto (incorporated by reference to Exhibit 10.1 to the quarterly report on Form 10-Q of Huntsman International LLC for the three months ended June 30, 2004) |
|
II-9
10.10 |
Revolving Credit Agreement dated as of October 14, 2004, among Huntsman LLC, Huntsman Petrochemical Corporation, Huntsman Expandable Polymers Company, LC, Huntsman Polymers Corporation, Huntsman Fuels, L.P., and Huntsman International Trading Corporation, as borrowers, the financial institutions party thereto, including Deutsche Bank Trust Company Americas, in their capacities as lenders thereunder, and Deutsche Bank Trust Company Americas, as administrative agent and as collateral agent (incorporated by reference to Exhibit 10.1 to the quarterly report on Form 10-Q of Huntsman LLC for the three months ended September 30, 2004) |
|
10.11 |
Term Credit Agreement dated as of October 14, 2004, among Huntsman LLC, the financial institutions party thereto, including Deutsche Bank Trust Company Americas, in their capacities as lenders thereunder, and Deutsche Bank Trust Company Americas, as agent for the lenders (incorporated by reference to Exhibit 10.2 to the quarterly report on Form 10-Q of Huntsman LLC for the three months ended September 30, 2004) |
|
10.12 |
Security Agreement (Revolving) dated as of October 14, 2004, among Huntsman LLC, certain subsidiaries of Huntsman LLC, and Deutsche Bank Trust Company Americas, as collateral agent (incorporated by reference to Exhibit 10.3 to the quarterly report on Form 10-Q of Huntsman LLC for the three months ended September 30, 2004) |
|
10.13 |
Security Agreement (Term) dated as of October 14, 2004, among Huntsman LLC, certain subsidiaries of Huntsman LLC, and Deutsche Bank Trust Company Americas, as collateral agent (incorporated by reference to Exhibit 10.4 to the quarterly report on Form 10-Q of Huntsman LLC for the three months ended September 30, 2004) |
|
10.14 |
Second Amended and Restated Intercreditor Agreement dated as of October 14, 2004, among Deutsche Bank Trust Company Americas, as administrative agent, collateral agent, and mortgagee, and HSBC Bank USA, National Association, as trustee, and consented to by Huntsman LLC (incorporated by reference to Exhibit 10.5 to the quarterly report on Form 10-Q of Huntsman LLC for the three months ended September 30, 2004) |
|
10.15 |
Huntsman Cost Reduction Incentive Plan and Form of Participation Agreement (incorporated by reference to Exhibit 10.1 to the current report on Form 8-K of HMP Equity Holdings Corporation filed on November 23, 2004) |
|
10.16** |
Employment Agreement with Paul Hulme |
|
10.17** |
Form of Indemnification Agreement |
|
21.1** |
Subsidiaries of the Registrant |
|
23.1* |
Consent of Deloitte & Touche LLP (Houston, Texas) |
|
23.2* |
Consent of Deloitte & Touche LLP (Salt Lake City, Utah) |
|
23.3* |
Consent of Deloitte S.A. |
|
23.4** |
Consent of Vinson & Elkins L.L.P. (contained in the opinion filed as Exhibit 5.1 hereto) |
|
II-10
24.1* |
Power of Attorney (included in the signature page) |
(b) Financial Statement Schedules.
HUNTSMAN HOLDINGS, LLC AND SUBSIDIARIES
Schedule II—Valuation and Qualifying Accounts
| |
|
Column C |
|
|
||||||||||||
|---|---|---|---|---|---|---|---|---|---|---|---|---|---|---|---|---|
| |
Column B |
Additions |
Column D |
Column E |
||||||||||||
| Column A |
||||||||||||||||
| Balance at Beginning of Period |
Charged to cost and expenses |
Charged to other accounts |
|
Balance at End of Period |
||||||||||||
| Description |
Deductions |
|||||||||||||||
| Allowance for Doubtful Accounts | ||||||||||||||||
| Year Ended December 31, 2003 | $ | 7.5 | $ | 11.3 | $ | 20.2 | (1) | $ | (12.5 | ) | $ | 26.5 | ||||
| Year Ended December 31, 2002 | $ | 5.8 | $ | 5.5 | $ | 2.0 | (2) | $ | (5.8 | ) | $ | 7.5 | ||||
| Year Ended December 31, 2001 | $ | 5.1 | $ | 10.3 | $ | — | $ | (9.6 | ) | $ | 5.8 | |||||
Item 17. Undertakings.
Insofar as indemnification for liabilities arising under the Securities Act may be permitted to directors, officers and controlling persons of the registrant pursuant to the foregoing provisions, or otherwise, the registrant has been advised that, in the opinion of the Securities and Exchange Commission, such indemnification is against public policy as expressed in the Securities Act and is, therefore, unenforceable. In the event that a claim for indemnification against such liabilities (other than the payment by the Registrant of expenses incurred or paid by a director, officer or controlling person of the registrant in the successful defense of any action, suit or proceeding) is asserted by such director, officer or controlling person in connection with the securities being registered, the registrant will, unless in the opinion of its counsel the matter has been settled by controlling precedent, submit to a court of appropriate jurisdiction the question whether such indemnification by it is against public policy as expressed in the Securities Act and will be governed by the final adjudication of such issue.
The undersigned registrant hereby undertakes that:
(1) For the purposes of determining any liability under the Securities Act, the information omitted from the form of prospectus filed as part of this registration statement in reliance upon Rule 430A and contained in a form of prospectus filed by the registrant pursuant to Rule 424(b)(1) or (4) or 497(h) under the Securities Act shall be deemed to be part of this registration statement as of the time it was declared effective.
(2) For the purposes of determining any liability under the Securities Act, each post-effective amendment that contains a form of prospectus shall be deemed to be a new registration statement relating to the securities offered therein, and the offering of such securities at that time shall be deemed to be the initial bona fide offering thereof.
The undersigned registrant hereby undertakes to provide to the underwriter at the closing specified in the underwriting agreements, certificates in such denominations and registered in such names and required by the underwriter to permit prompt delivery to each purchaser.
II-11
Pursuant to the requirements of the Securities Act of 1933, the registrant has duly caused this registration statement to be signed on its behalf by the undersigned, thereunto duly authorized, in the City of Salt Lake City, State of Utah, on the 24th day of November 2004.
| HUNTSMAN CORPORATION | ||||
By |
/s/ PETER R. HUNTSMAN |
|||
| Peter R. Huntsman President and Chief Executive Officer |
||||
Each person whose individual signature appears below hereby authorizes and appoints Jon M. Huntsman, Peter R. Huntsman, J. Kimo Esplin and Samuel D. Scruggs, and each of them, with full power of substitution and resubstitution and full power to act without the other, as his true and lawful attorney-in-fact and agent to act in his name, place and stead and to execute in the name and on behalf of each person, individually and in each capacity stated below, and to file, any and all amendments to this registration statement, including any and all post-effective amendments thereto and any registration statement relating to the same offering as this registration statement that is to be effective upon filing pursuant to Rule 462(b) under the Securities Act of 1933, as amended, and to file the same, with all exhibits thereto, and other documents in connection therewith, with the Securities and Exchange Commission, granting unto said attorneys-in fact and agents, and each of them, full power and authority to do and perform each and every act and thing, ratifying and confirming all that said attorneys-in-fact and agents or any of them or their or his substitute or substitutes may lawfully do or cause to be done by virtue thereof.
Pursuant to the requirements of the Securities Act of 1933, this registration statement has been signed by the following persons in the capacities indicated below on the 24th day of November 2004.
| Signature |
Title |
|
|---|---|---|
| /s/ JON M. HUNTSMAN Jon M. Huntsman |
Chairman of the Board of Directors and Director | |
/s/ PETER R. HUNTSMAN Peter R. Huntsman |
President, Chief Executive Officer and Director (Principal Executive Officer) |
|
/s/ J. KIMO ESPLIN J. Kimo Esplin |
Executive Vice President and Chief Financial Officer (Principal Financial Officer) |
|
/s/ L. RUSSELL HEALY L. Russell Healy |
Vice President and Controller (Principal Accounting Officer) |
|
II-12
/s/ DAVID J. MATLIN David J. Matlin |
Director |
|
/s/ RICHARD MICHAELSON Richard Michaelson |
Director |
|
/s/ CHRISTOPHER R. PECHOCK Christopher R. Pechock |
Director |
II-13
| Number |
Description |
|
|---|---|---|
| 1.1** | Form of Underwriting Agreement | |
2.1** |
Form of Reorganization Agreement |
|
3.1** |
Form of Amended and Restated Certificate of Incorporation of Huntsman Corporation |
|
3.2** |
Form of Amended and Restated By-laws of Huntsman Corporation |
|
4.1 |
Amended and Restated Indenture, dated as of August 2, 1999, between Huntsman International Holdings LLC (f/k/a Huntsman ICI Holdings LLC) and Bank One, N.A., as Trustee, relating to the 13.375% Senior Discount Notes due 2009 (incorporated by reference to Exhibit 4.1 to the registration statement on Form S-4 of Huntsman International Holdings LLC (File No. 333-88057)) |
|
4.2 |
Form of certificate of 13.375% Senior Discount Note due 2009 (included as Exhibit A-3 to Exhibit 4.1) |
|
4.3 |
Exchange and Registration Rights Agreement, dated as of August 2, 1999, among Huntsman International Holdings LLC (f/k/a Huntsman ICI Holdings LLC) and the Purchasers named therein, relating to the 13.375% Senior Discount Notes due 2009 (incorporated by reference to Exhibit 4.3 to the registration statement on Form S-4 of Huntsman International Holdings LLC (File No. 333-88057)) |
|
4.4 |
Amended and Restated Indenture, dated as of December 20, 2001, between Huntsman International Holdings LLC and Bank One, N.A., as Trustee, relating to the 8% Senior Subordinated Reset Discount Notes due 2009 (incorporated by reference to Exhibit 4.9 to amendment no. 1 to the annual report on Form 10-K/A of Huntsman International Holdings LLC for the year ended December 31, 2001) |
|
4.5 |
Form of certificate of 8% Senior Subordinated Reset Discount Note due 2009 (incorporated by reference to Exhibit 10.11 to the registration statement on Form S-4 of Huntsman International Holdings LLC (File No. 333-88057)) |
|
4.6 |
Registration Rights Agreement dated as of June 30, 1999, by and among Huntsman ICI Holdings LLC and the holders of the 8% Senior Subordinated Reset Discount Notes due 2009 specified therein (incorporated by reference to Exhibit 4.11 to amendment no. 1 to the annual report on Form 10-K/A of Huntsman International Holdings LLC for the year ended December 31, 2001) |
|
4.7 |
Private Sale Letter Agreement, dated December 20, 2001, between Huntsman International Holdings LLC and ICI Finance plc (incorporated by reference to Exhibit 4.12 to amendment no. 1 to the annual report on Form 10-K/A of Huntsman International Holdings LLC for the year ended December 31, 2001) |
|
4.8 |
Form of Registration Rights Agreement among Huntsman International Holdings LLC and the Holders as defined therein (incorporated by reference to Exhibit 4.13 to amendment no. 1 to the annual report on Form 10-K/A of Huntsman International Holdings LLC for the year ended December 31, 2001) |
|
4.9 |
Form of Registration Rights Agreement among Huntsman International Holdings LLC and the Initial Purchasers as defined therein (incorporated by reference to Exhibit 4.14 to amendment no. 1 to the annual report on Form 10-K/A of Huntsman International Holdings LLC for the year ended December 31, 2001) |
|
4.10 |
Indenture, dated as of June 30, 1999, among Huntsman International LLC (f/k/a Huntsman ICI Chemicals LLC), the Guarantors party thereto and Bank One, N.A., as Trustee, relating to the 101/2% Senior Subordinated Notes due 2009 (incorporated by reference to Exhibit 4.1 to the registration statement on Form S-4 of Huntsman International LLC (File No. 333-85141)) |
|
4.11 |
Form of 101/8% Senior Subordinated Note due 2009 denominated in dollars (included as Exhibit A-3 to Exhibit 4.10) |
|
4.12 |
Form of 101/8% Senior Subordinated Note due 2009 denominated in euros (included as Exhibit A-4 to Exhibit 4.10) |
|
4.13 |
Form of Guarantee relating to the 101/8% Senior Subordinated Notes due 2009 (included as Exhibit E of Exhibit 4.10) |
|
4.14 |
First Amendment, dated January 5, 2000, to Indenture, dated as of June 30, 1999, among Huntsman International LLC (f/k/a Huntsman ICI Chemicals LLC), as Issuer, each of the Guarantors named therein and Bank One, N.A., as Trustee (incorporated by reference to Exhibit 4.6 to the registration statement on Form S-4 of Huntsman International LLC (File No. 333-85141)) |
|
4.15 |
Indenture, dated as of March 13, 2001, among Huntsman International LLC, as Issuer, the Guarantors named therein and The Bank of New York, as Trustee, relating to 101/8% Senior Subordinated Notes due 2009 (incorporated by reference to Exhibit 4.6 to amendment no. 1 to the annual report on Form 10-K/A of Huntsman International LLC for the year ended December 31, 2001) |
|
4.16 |
Form of 101/8% Senior Subordinated Note due 2009 denominated in dollars (included as Exhibit A-3 to Exhibit 4.15) |
|
4.17 |
Form of 101/8% Senior Subordinated Note due 2009 denominated in euros (included as Exhibit A-4 to Exhibit 4.15) |
|
4.18 |
Form of Guarantee relating to the 101/8% Senior Subordinated Notes due 2009 (included as Exhibit E of Exhibit 4.15) |
|
4.19 |
First Supplemental Indenture, dated as of January 11, 2002, among Huntsman International LLC, as Issuer, the Guarantors named therein and The Bank of New York, as Trustee, relating to 101/8% Senior Subordinated Notes due 2009 (incorporated by reference to Exhibit 4.7 to amendment no. 1 to the annual report on Form 10-K/A of Huntsman International LLC for the year ended December 31, 2001) |
|
4.20 |
Indenture, dated as of March 21, 2002, among Huntsman International LLC, as Issuer, the Guarantors named therein and Wells Fargo Bank Minnesota, National Association, as Trustee, relating to the 97/8% Senior Notes due 2009 (incorporated by reference to Exhibit 4.8 to amendment no. 1 to the annual report on Form 10-K/A of Huntsman International LLC for the year ended December 31, 2001) |
|
4.21 |
Form of 97/8% Senior Note due 2009 denominated in dollars (included as Exhibit A-3 to Exhibit 4.20) |
|
4.22 |
Form of 97/8% Senior Note due 2009 denominated in euros (included as Exhibit A-4 to Exhibit 4.20) |
|
4.23 |
Form of Guarantee relating to the 97/8% Senior Notes due 2009 (included as Exhibit E of Exhibit 4.20) |
|
4.24 |
Amended and Restated Guarantee, dated as of April 11, 2003, among the Guarantors named therein and Wells Fargo Bank Minnesota, National Association, as Trustee, relating to the 97/8% Senior Notes due 2009 (incorporated by reference to Exhibit 4.15 to the registration statement on Form S-4 of Huntsman International LLC (File No. 333-106482)) |
|
4.25 |
Exchange and Registration Rights Agreement, dated as of March 21, 2002, among Huntsman International LLC, the Guarantors as defined therein, and the Purchasers as defined therein, relating to the 97/8% Senior Notes due 2009 (incorporated by reference to Exhibit 4.9 to amendment no. 1 to the annual report on Form 10-K/A of Huntsman International LLC for the year ended December 31, 2001) |
|
4.26 |
Exchange and Registration Rights Agreement, dated as of April 11, 2003, among Huntsman International LLC, the Guarantors, as defined therein, and the Purchasers as defined therein, relating to the 97/8 %Senior Notes due 2009 (incorporated by reference to Exhibit 4.17 to the registration statement on Form S-4 of Huntsman International LLC (File No. 333-106482)) |
|
4.27 |
Amended and Restated Indenture, dated as of June 14, 2002, among Huntsman Corporation (now known as Huntsman LLC), as Issuer, each of the Guarantors party thereto and Wilmington Trust Company, as Trustee, relating to the $200,000,000 91/2% Senior Subordinated Notes due 2007 (incorporated by reference to Exhibit 4.27 to the registration statement on Form S-4 of Huntsman LLC (File No. 333-112279)) |
|
4.28 |
Form of Amended and Restated $200,000,000 91/2% Senior Subordinated Note due 2007 (included as Exhibit A to Exhibit 4.27) |
|
4.29 |
First Supplemental Indenture, dated as of July 11, 2002, among Huntsman Corporation (now known as Huntsman LLC), as Issuer, each of the Guarantors party thereto and Wilmington Trust Company, as Trustee, relating to the $200,000,000 91/2% Senior Subordinated Notes due 2007 (incorporated by reference to Exhibit 4.29 to the registration statement on Form S-4 of Huntsman LLC (File No. 333-112279)) |
|
4.30 |
Second Supplemental Indenture, dated as of August 15, 2002, among Huntsman Corporation (now known as Huntsman LLC), as Issuer, each of the Guarantors party thereto and Wilmington Trust Company, as Trustee, relating to the $200,000,000 91/2% Senior Subordinated Notes due 2007 (incorporated by reference to Exhibit 4.30 to the registration statement on Form S-4 of Huntsman LLC (File No. 333-112279)) |
|
4.31 |
Amended and Restated Indenture, dated as of June 14, 2002, among Huntsman Corporation (now known as Huntsman LLC), as Issuer, each of the Guarantors party thereto and Wilmington Trust Company, as Trustee, relating to the $275,000,000 91/2% Senior Subordinated Notes due 2007 and the $125,000,000 Senior Subordinated Floating Rate Notes due 2007 (incorporated by reference to Exhibit 4.31 to the registration statement on Form S-4 of Huntsman LLC (File No. 333-112279)) |
|
4.32 |
Form of Amended and Restated Fixed Rate Note due 2007 (included as Exhibit A to Exhibit 4.31) |
|
4.33 |
Form of Amended and Restated Floating Rate Note due 2007 (included as Exhibit B to Exhibit 4.31) |
|
4.34 |
First Supplemental Indenture, dated as of July 11, 2002, among Huntsman Corporation (now known as Huntsman LLC), as Issuer, each of the Guarantors party thereto and Wilmington Trust Company, as Trustee, relating to the $275,000,000 91/2% Senior Subordinated Notes due 2007 and the $125,000,000 Senior Subordinated Floating Rate Notes due 2007 (incorporated by reference to Exhibit 4.34 to the registration statement on Form S-4 of Huntsman LLC (File No. 333-112279)) |
|
4.35 |
Second Supplemental Indenture, dated as of August 15, 2002, among Huntsman Corporation (now known as Huntsman LLC), as Issuer, each of the Guarantors party thereto and Wilmington Trust Company, as Trustee, relating to the $275,000,000 91/2% Senior Subordinated Notes due 2007 and the $125,000,000 Senior Subordinated Floating Rate Notes due 2007 (incorporated by reference to Exhibit 4.35 to the registration statement on Form S-4 of Huntsman LLC (File No. 333-112279)) |
|
4.36 |
Indenture, dated as of September 30, 2003, among Huntsman LLC, the Guarantors party thereto and HSBC Bank USA, as Trustee, relating to the 115/8% Senior Secured Notes due 2010 (incorporated by reference to Exhibit 4.36 to the registration statement on Form S-4 of Huntsman LLC (File No. 333-112279)) |
|
4.37 |
Form of unrestricted 115/8% Senior Secured Note due 2010 (included as Exhibit A-2 to Exhibit 4.36) |
|
4.38 |
Form of guarantee relating to the 115/8% Senior Secured Notes due 2010 (included as Exhibit E to Exhibit 4.36) |
|
4.39 |
Exchange and Registration Rights Agreement, dated as of September 30, 2003, among Huntsman LLC, the Guarantors as defined therein, and the Purchasers as defined therein, relating to $380,000,000 aggregate principal amount of the 115/8% Senior Secured Notes due 2010 (incorporated by reference to Exhibit 4.39 to the registration statement on Form S-4 of Huntsman LLC (File No. 333-112279)) |
|
4.40 |
Exchange and Registration Rights Agreement, dated as of December 12, 2003, among Huntsman LLC, the Guarantors as defined therein, and the Purchasers as defined therein, relating to $75,400,000 aggregate principal amount of the 115/8% Senior Secured Notes due 2010 (incorporated by reference to Exhibit 4.40 to the registration statement on Form S-4 of Huntsman LLC (File No. 333-112279)) |
|
4.41 |
Indenture, dated as of June 30, 2003, among Huntsman Advanced Materials LLC, as Issuer, each of the Guarantors named therein and Wells Fargo Bank Minnesota, National Association, as Trustee (incorporated by reference to Exhibit 4.1 to the registration statement on Form S-4 of Huntsman Advanced Materials LLC (File No. 333-115344)) |
|
4.42 |
Form of Unrestricted Fixed Rate Note (included as Exhibit A-3 to Exhibit 4.41) |
|
4.43 |
Form of Unrestricted Floating Rate Note (included as Exhibit A-4 to Exhibit 4.41) |
|
4.44 |
Form of Guarantee (included as Exhibit E to Exhibit 4.41) |
|
4.45 |
Registration Rights Agreement, dated as of June 30, 2003, among Huntsman Advanced Materials LLC and the Guarantors named therein, as Issuers, and Deutsche Bank Securities Inc. and UBS Securities LLC, as Initial Purchasers (incorporated by reference to Exhibit 4.5 to the registration statement on Form S-4 of Huntsman Advanced Materials LLC (File No. 333-115344)) |
|
4.46 |
Indenture, dated as of May 9, 2003, among HMP Equity Holdings Corporation, as Issuer, ICI Alta Inc. (now known as Alta One Inc.), as Guarantor, and Wells Fargo Bank Minnesota, National Association, as Trustee, relating to the 15% Senior Secured Discount Notes due 2008 (incorporated by reference to Exhibit 4.46 to the registration statement on Form S-4 of HMP Equity Holdings Corporation (File No. 333-116100)) |
|
4.47 |
Form of 15% Senior Secured Discount Note due 2008 (included as Exhibit A-2 to Exhibit 4.46) |
|
4.48 |
Form of Guarantee (included as Exhibit E to Exhibit 4.46) |
|
4.49 |
Exchange and Registration Rights Agreement, dated as of May 9, 2003, among HMP Equity Holdings Corporation, ICI Alta Inc. (now known as Alta One Inc.), Credit Suisse First Boston LLC, and CIBC World Markets Corp (incorporated by reference to Exhibit 4.49 to the registration statement on Form S-4 of HMP Equity Holdings Corporation (File No. 333-116100)) |
|
4.50 |
Indenture, dated August 1, 2000, between Vantico Group S.A., as issuer, and The Bank of New York, as trustee (incorporated by reference to Exhibit 4.1 to the registration statement on Form F-4 of Vantico Group S.A. (File No. 333-13156)) |
|
4.51 |
First Supplemental Indenture, dated as of April 10, 2003, between Vantico Group S.A., as issuer, and The Bank of New York, as trustee (incorporated by reference to Exhibit 4.7 to the registration statement of Form S-4 of Huntsman Advanced Materials LLC (File No. 333-115344)) |
|
4.52 |
Second Supplemental Indenture, dated as of June 17, 2003, between Vantico Group S.A., as issuer, and The Bank of New York, as trustee (incorporated by reference to Exhibit 4.8 to the registration statement of Form S-4 of Huntsman Advanced Materials LLC (File No. 333-115344)) |
|
4.53 |
Third Supplemental Indenture, dated as of June 30, 2003, between Vantico Group S.A., as issuer, and The Bank of New York, as trustee (incorporated by reference to Exhibit 4.51 to the registration statement on Form S-4 of HMP Equity Holdings Corporation (File No. 333-116100)) |
|
4.54 |
Indenture, dated as of June 22, 2004, among Huntsman LLC, the Guarantors party thereto and HSBC Bank USA, as Trustee, relating to the 111/2% Senior Notes due 2012 and Senior Floating Rate Notes due 2011 (incorporated by reference to Exhibit 4.1 to the quarterly report on Form 10-Q of Huntsman LLC for the three months ended June 30, 2004) |
|
4.55 |
Form of restricted Fixed Rate Note due 2012 (included as Exhibit A-1 to Exhibit 4.54) |
|
4.56 |
Form of Restricted Floating Rate Note due 2011 (included as Exhibit A-2 to Exhibit 4.54) |
|
4.57 |
Form of Guarantee relating to the 111/2% Senior Notes due 2012 and Senior Floating Rate Notes due 2011 (included as Exhibit E to Exhibit 4.54) |
|
4.58 |
Exchange and Registration Rights Agreement, dated of June 22, 2004, among Huntsman LLC, the Guarantors as defined therein, and the Purchasers as defined therein, relating to $300,000,000 111/2% Senior Notes due 2012 and $100,000,000 Senior Floating Rate Notes due 2011 (incorporated by reference to Exhibit 4.5 to the quarterly report on Form 10-Q of Huntsman LLC for the three months ended June 30, 2004) |
|
4.59** |
Registration Rights Agreement, dated as of May 9, 2003, by and among HMP Equity Holdings Corporation, Huntsman Holdings, LLC, Huntsman Group Inc., Huntsman Family Holdings II Company LLC (now known as Huntsman Family Holdings Company LLC), MatlinPatterson Global Opportunities, L.P., Credit Suisse First Boston LLC and CIBC World Markets Corp. |
|
4.60** |
Warrant Agreement among HMP Equity Holdings Corporation, Huntsman Holdings, LLC, Huntsman Group Inc. and Wells Fargo Bank Minnesota, National Association dated as of May 9, 2003 |
|
4.61** |
Form of Registration Rights Agreement by and among Huntsman Corporation, HMP Investments LLC, Huntsman Family Holdings Company LLC and MatlinPatterson Global Opportunities Partners, L.P. |
|
4.62** |
Form of stock certificate of Huntsman Corporation |
|
5.1** |
Opinion of Vinson & Elkins L.L.P. as to the validity of the shares being registered |
|
10.1 |
Business Consulting Agreement, dated as of June 3, 2003, between Huntsman International LLC and Jon M. Huntsman (incorporated by reference to Exhibit 10.41 to the registration statement on Form S-4 of Huntsman International LLC (File No. 333-106482)) |
|
10.2 |
Aircraft Dry Lease, dated as of September 14, 2001, between Jstar Corporation and Airstar Corporation (incorporated by reference to Exhibit 10.10 to the registration statement on Form S-4 of Huntsman LLC (File No. 333-112279)) |
|
10.3 |
Amended and Restated Subordinated Promissory Note, dated as of July 2, 2001, by Huntsman Corporation (now known as Huntsman LLC) in favor of Horizon Ventures, L.C. (incorporated by reference to Exhibit 10.11 to the registration statement on Form S-4 of Huntsman LLC (File No. 333-112279)) |
|
10.4 |
Interest Holders Agreement, dated as of September 30, 2002, among Huntsman Holdings, LLC, HMP Equity Holdings Corporation, Huntsman Company LLC (now known as Huntsman LLC), Huntsman Family Holdings II Company LLC (now known as Huntsman Family Holdings Company LLC) and MatlinPatterson Global Opportunities Partners L.P. (incorporated by reference to Exhibit 10.12 to the registration statement on Form S-4 of Huntsman LLC (File No. 333-112279)) |
|
10.5 |
First Amendment to the Interest Holders Agreement, dated as of May 9, 2003, among Huntsman LLC, HMP Equity Holdings Corporation, Huntsman Family Holdings II Company LLC (now known as Huntsman Family Holdings Company LLC) MatlinPatterson Global Opportunities Partners L.P., Huntsman Group Inc. and Huntsman Holdings, LLC (incorporated by reference to Exhibit 10.13 to the registration statement on Form S-4 of Huntsman LLC (File No. 333-112279)) |
|
10.6 |
Credit Agreement, dated as of June 30, 2003, among Huntsman Advanced Materials LLC, certain subsidiaries from time to time party thereto and various lending institutions with Deutsche Bank AG, New York Branch, as Administrative Agent (incorporated by reference to Exhibit 10.1 to the registration statement on Form S-4 of Huntsman Advanced Materials LLC (File No. 333-115344)) |
|
10.7 |
Intercreditor and Collateral Agency Agreement, dated as of June 30, 2003, among Deutsche Bank AG, New York Branch, as administrative agent, Wells Fargo Bank Minnesota, National Association, as trustee, Huntsman Advanced Materials LLC and the subsidiaries listed therein (incorporated by reference to Exhibit 10.2 to the registration statement on Form S-4 of Huntsman Advanced Materials LLC (File No. 333-115344)) |
|
10.8 |
Pledge Agreement, dated as of May 9, 2003, by HMP Equity Holdings Corporation, as Issuer and Pledgor, and Huntsman Holdings, LLC, Huntsman Group Inc. and ICI Alta Inc. (now known as Alta One Inc.), as Pledgors, and Wells Fargo Bank Minnesota, National Association, as Trustee (incorporated by reference to Exhibit 10.28 to the registration statement on Form S-4 of HMP Equity Holdings Corporation (File No. 333-116100)) |
|
10.9 |
Amended and Restated Credit Agreement, dated as of July 13, 2004, among Huntsman International LLC, as the borrower, Huntsman International Holdings LLC, as the guarantor, Deutsche Bank Trust Company Americas, as administrative agent, Deutsche Bank Securities Inc., as co-lead arranger and joint book runner, JP Morgan Securities Inc., as co-documentation agent and joint book runner, UBS Securities LLC, as co-syndication agent, Credit Suisee First Boston, as co-documentation agent, Merrill Lynch, Pierce Fenner & Smith Inc., as co-documentation agent, and various lending institutions party thereto (incorporated by reference to Exhibit 10.1 to the quarterly report on Form 10-Q of Huntsman International LLC for the three months ended June 30, 2004) |
|
10.10 |
Revolving Credit Agreement dated as of October 14, 2004, among Huntsman LLC, Huntsman Petrochemical Corporation, Huntsman Expandable Polymers Company, LC, Huntsman Polymers Corporation, Huntsman Fuels, L.P., and Huntsman International Trading Corporation, as borrowers, the financial institutions party thereto, including Deutsche Bank Trust Company Americas, in their capacities as lenders thereunder, and Deutsche Bank Trust Company Americas, as administrative agent and as collateral agent (incorporated by reference to Exhibit 10.1 to the quarterly report on Form 10-Q of Huntsman LLC for the three months ended September 30, 2004) |
|
10.11 |
Term Credit Agreement dated as of October 14, 2004, among Huntsman LLC, the financial institutions party thereto, including Deutsche Bank Trust Company Americas, in their capacities as lenders thereunder, and Deutsche Bank Trust Company Americas, as agent for the lenders (incorporated by reference to Exhibit 10.2 to the quarterly report on Form 10-Q of Huntsman LLC for the three months ended September 30, 2004) |
|
10.12 |
Security Agreement (Revolving) dated as of October 14, 2004, among Huntsman LLC, certain subsidiaries of Huntsman LLC, and Deutsche Bank Trust Company Americas, as collateral agent (incorporated by reference to Exhibit 10.3 to the quarterly report on Form 10-Q of Huntsman LLC for the three months ended September 30, 2004) |
|
10.13 |
Security Agreement (Term) dated as of October 14, 2004, among Huntsman LLC, certain subsidiaries of Huntsman LLC, and Deutsche Bank Trust Company Americas, as collateral agent (incorporated by reference to Exhibit 10.4 to the quarterly report on Form 10-Q of Huntsman LLC for the three months ended September 30, 2004) |
|
10.14 |
Second Amended and Restated Intercreditor Agreement dated as of October 14, 2004, among Deutsche Bank Trust Company Americas, as administrative agent, collateral agent, and mortgagee, and HSBC Bank USA, National Association, as trustee, and consented to by Huntsman LLC (incorporated by reference to Exhibit 10.5 to the quarterly report on Form 10-Q of Huntsman LLC for the three months ended September 30, 2004) |
|
10.15 |
Huntsman Cost Reduction Incentive Plan and Form of Participation Agreement (incorporated by reference to Exhibit 10.1 to the current report on Form 8-K of HMP Equity Holdings Corporation filed on November 23, 2004) |
|
10.16** |
Employment Agreement with Paul Hulme |
|
10.17** |
Form of Indemnification Agreement |
|
21.1** |
Subsidiaries of the Registrant |
|
23.1* |
Consent of Deloitte & Touche LLP (Houston, Texas) |
|
23.2* |
Consent of Deloitte & Touche LLP (Salt Lake City, Utah) |
|
23.3* |
Consent of Deloitte S.A. |
|
23.4** |
Consent of Vinson & Elkins L.L.P. (contained in the opinion filed as Exhibit 5.1 hereto) |
|
24.1* |
Power of Attorney (included in the signature page) |