Use these links to rapidly review the document
HUNTSMAN INTERNATIONAL LLC AND SUBSIDIARIES 2004 ANNUAL REPORT ON FORM 10-K TABLE OF CONTENTS
HUNTSMAN INTERNATIONAL LLC AND SUBSIDIARIES INDEX TO CONSOLIDATED FINANCIAL STATEMENTS
SECURITIES AND EXCHANGE COMMISSION
WASHINGTON, D.C. 20549
Form 10-K
(Mark One)
| ý | ANNUAL REPORT PURSUANT TO SECTION 13 OR 15(d) OF THE SECURITIES EXCHANGE ACT OF 1934 | |
For the fiscal year ended December 31, 2004 |
||
OR |
||
o |
TRANSITION REPORT PURSUANT TO SECTION 13 OR 15(d) OF THE SECURITIES EXCHANGE ACT OF 1934 |
|
For the transition period from to
Commission file number 333-85141
HUNTSMAN INTERNATIONAL LLC
(Exact name of registrant as specified in its charter)
Delaware (State or other jurisdiction of incorporation or organization) |
87-0630358 (I.R.S. Employer Identification No.) |
500 Huntsman Way
Salt Lake City, Utah 84108
(801) 584-5700
(Address of principal executive offices and telephone number)
Securities registered pursuant to Section 12(b) of the Act: None
Securities registered pursuant to Section 12(g) of the Act: None
Indicate by check mark whether the Registrant: (1) has filed all reports required to be filed by Section 13 or 15(d) of the Securities Exchange Act of 1934 during the preceding 12 months (or for such shorter period that the Registrant was required to file such reports), and (2) has been subject to such filing requirements for the past 90 days. YES ý NO o
Indicate by check mark if disclosure of delinquent filers pursuant to Item 405 of Regulation S-K is not contained herein, and will not be contained, to the best of the Registrant's knowledge, in definitive proxy or information statements incorporated by reference in Part III of this Form 10-K or any amendment to this Form 10-K. ý
Indicate by check mark whether the Registrant is an accelerated filer (as defined in Exchange Act Rule 12b-2). YES o NO ý
On June 30, 2004, the last business day of the Registrant's second fiscal quarter, 1,000 units of membership interest of the Registrant were outstanding. There is no established trading market for the Registrant's units of membership interest. All of the Registrant's units of membership interest are held by an affiliate. Accordingly, the market value of units of membership interest held by non-affiliates is zero. On March 4, 2005, 1,000 units of membership interest of the Registrant were outstanding.
The Registrant meets the conditions set forth in General Instruction I(1)(a) and (b) for Form 10-K and is therefore filing this Form with a reduced disclosure format.
Documents Incorporated by Reference
None.
HUNTSMAN INTERNATIONAL LLC AND SUBSIDIARIES
2004 ANNUAL REPORT ON FORM 10-K
TABLE OF CONTENTS
ii
HUNTSMAN INTERNATIONAL LLC AND SUBSIDIARIES
2004 ANNUAL REPORT ON FORM 10-K
Some of the statements contained in this report are forward-looking in nature. In some cases, you can identify forward-looking statements by terminology such as "believes," "expects," "may," "will," "should," "anticipates" or "intends" or the negative of such terms or other comparable terminology, or by discussions of strategy. You are cautioned that our business and operations are subject to a variety of risks and uncertainties, and, consequently, our actual results may materially differ from those projected by any forward-looking statements. Some of those risks and uncertainties are discussed below in "Item 7—Management's Discussion and Analysis of Financial Condition and Results of Operations—Cautionary Statement for Forward-Looking Information" and elsewhere in this report.
This report includes information with respect to market share, industry conditions and forecasts that we obtained from internal industry research, publicly available information (including industry publications and surveys), and surveys and market research provided by consultants. The publicly available information and the reports, forecasts and other research provided by consultants generally state that the information contained therein has been obtained from sources believed to be reliable, but there can be no assurance as to the accuracy and completeness of such information. We have not independently verified any of the data from third-party sources, nor have we ascertained the underlying economic assumptions relied upon therein. Similarly, our internal research and forecasts are based upon our management's understanding of industry conditions, and such information has not been verified by any independent sources.
For convenience in this report, the terms "Company," "our," "us" or "we" may be used to refer to Huntsman International LLC and, unless the context otherwise requires, its subsidiaries. In this report, "HIH" refers to Huntsman International Holdings LLC, "Huntsman Specialty" refers to Huntsman Specialty Chemicals Corporation, "Huntsman LLC" refers to Huntsman LLC and, unless the context otherwise requires, its subsidiaries, "HMP" refers to HMP Equity Holdings Corporation, "Huntsman Holdings" refers to Huntsman Holdings, LLC, "Huntsman Corporation" refers to Huntsman Corporation, and, unless the context otherwise requires, its subsidiaries, "AdMat" refers to Huntsman Advanced Materials LLC and, unless the context otherwise requires, its subsidiaries, and "MatlinPatterson" refers to MatlinPatterson Global Opportunities Partners, L.P. and its affiliates.
History
Our Company, Huntsman International LLC, is a Delaware limited liability company. It was formed in 1999 in connection with a transaction between HIH, Huntsman Specialty and Imperial Chemical Industries PLC ("ICI"). In that transaction, on June 30, 1999, HIH acquired ICI's polyurethane chemicals, selected petrochemicals and titanium dioxide ("TiO2" or "Tioxide") businesses and Huntsman Specialty's propylene oxide ("PO") business. HIH also acquired the 20% ownership interest of BP Chemicals Limited in an olefins facility located at Wilton, U.K. and certain related assets. HIH then transferred the acquired businesses to us and to our subsidiaries. In August 2000, we completed our acquisition of the Morton global TPU business from The Rohm and Haas Company; in February 2001, we completed our acquisition of the global ethyleneamines business of Dow Chemical Company; and, in April 2001, we completed our acquisition of the Albright & Wilson European surfactants business from Rhodia S.A.
1
Recent Developments
Huntsman Corporation Initial Public Offering
On February 16, 2005, Huntsman Corporation, our ultimate parent corporation, completed an initial public offering of 55,681,819 shares of its common stock sold by Huntsman Corporation and 13,579,546 shares of its common stock sold by a selling stockholder, in each case at a price to the public of $23 per share, and 5,750,000 shares of its 5% mandatory convertible preferred stock sold by Huntsman Corporation at a price to the public of $50 per share. Net proceeds to Huntsman Corporation from the offering were approximately $1,500 million, substantially all of which is being used to repay outstanding indebtedness of certain of Huntsman Corporation's subsidiaries, including HMP, Huntsman LLC and HIH.
Huntsman International LLC Dividend
On February 28, 2005, we paid a dividend in the amount of $35 million to HIH. The dividend was used together with proceeds from the Huntsman Corporation initial public offering to redeem the HIH senior discount notes due 2009.
Ownership
All of our membership interests are owned by HIH. Initially in 1999, HIH was owned 60% by Huntsman Specialty, 30% by ICI and 10% by institutional investors. In 2002, HMP purchased approximately 1% of the HIH membership interests held by an institutional investor. On May 9, 2003, HMP exercised an option and purchased the ICI subsidiary ("Alta One") that held ICI's 30% membership interest in HIH. At that time, HMP also purchased the remaining approximately 9% of the HIH membership interests held by institutional investors. As a result, HMP owned directly, and indirectly through its ownership of Huntsman Specialty and Alta One, 100% of the HIH membership interests.
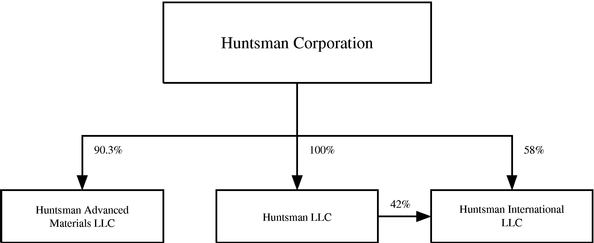
In connection with Huntsman Corporation's initial public offering, Huntsman Corporation and certain affiliates completed a series of reorganization transactions. As a result of these reorganization transactions, our Company now is owned 58% by Huntsman Corporation and 42% by Huntsman LLC. The chart below shows our current organizational structure:
Overview
We are a global manufacturer of differentiated and commodity chemical products. We manufacture a broad range of chemical products, which are marketed globally to a diversified group of consumer and industrial customers. Our products are used in a wide range of applications. We are a leading
2
global producer in many of our key product lines, including MDI and titanium dioxide. We operate 35 manufacturing facilities located around the world and employ over 5,700 associates. Our businesses benefit from significant integration, large production scale and proprietary manufacturing technologies, which allow us to maintain a low-cost position.
Our Products and Segments
Our business is organized around our four segments: Polyurethanes, Performance Products, Pigments and Base Chemicals. These segments can be divided into two broad categories: differentiated and commodity. We produce differentiated products primarily in our Polyurethanes and Performance Products segments. These products serve diverse end markets and are generally characterized by historical growth in excess of GDP growth resulting from product substitution and new product development, proprietary manufacturing processes and product formulations and a high degree of customer loyalty. Demand for these products tends to be driven by the value-added attributes that they create in our customers' end-use applications. While the demand for these differentiated products is also influenced by worldwide economic conditions and GDP growth, our differentiated products have tended to produce more stable profit margins and higher demand growth rates than our commodity products.
In our commodity chemical businesses, we produce titanium dioxide derived from titanium-bearing ores in our Pigments segment and petrochemical-based olefins, aromatics and polyolefins products in our Polymers and Base Chemicals segments. Since the coatings industry consumes a substantial portion of titanium dioxide production, seasonal demand patterns in the coatings industry drive the profitability of our Pigments segment; profitability is also driven by industry-wide operating rates, with a lag of up to twelve months due to the effects of stocking and destocking by customers and suppliers. The profitability of our Base Chemicals products is cyclical and has been experiencing a down cycle for the last several years, resulting primarily from significant new capacity additions, a decrease in demand reflecting weak global economic conditions and high raw material costs. Certain industry fundamentals have recently improved and, we believe, point to increased profitability in the markets for the major commodity products that we manufacture.
Polyurethanes
General
We are a leading global manufacturer and marketer of a broad range of polyurethane chemicals, including MDI, PO, polyols, PG, TDI and TPU. Polyurethane chemicals are used to produce rigid and flexible foams, as well as coatings, adhesives, sealants and elastomers. We focus on the higher-margin, higher-growth markets for MDI and MDI-based polyurethane systems. Growth in our Polyurethanes segment has been driven primarily by the continued substitution of MDI-based products for other materials across a broad range of applications. We operate four primary Polyurethanes manufacturing facilities in the U.S. and Europe. We also operate 14 Polyurethanes formulation facilities, which are located in close proximity to our customers worldwide. We have a significant interest in a manufacturing joint venture that has recently begun construction of a low-cost, world-scale, integrated MDI production facility near Shanghai, China. We expect production at this facility to commence in 2006.
Our customers produce polyurethane products through the combination of an isocyanate, such as MDI or TDI, with polyols, which are derived largely from PO and EO. While the range of TDI-based products is relatively limited, we are able to produce over 2,000 distinct MDI-based polyurethane products by varying the proportion and type of polyol used and by introducing other chemical additives to our MDI formulations. As a result, polyurethane products, especially those derived from MDI, are continuing to replace traditional products in a wide range of end-use markets, including insulation in
3
construction and appliances, cushioning for automotive and furniture, adhesives, wood binders, footwear and other specialized engineering applications.
We are a leading North American producer of PO. We and some of our customers process PO into derivative products such as polyols for polyurethane products, PG and various other chemical products. End uses for these derivative products include applications in the home furnishings, construction, appliance, packaging, automotive and transportation, food, paints and coatings and cleaning products industries We also produce MTBE as a co-product of our PO manufacturing process. MTBE is an oxygenate that is blended with gasoline to reduce harmful vehicle emissions and to enhance the octane rating of gasoline. See "—Environmental, Health and Safety Matters—MTBE Developments" for a further discussion of legal and regulatory developments that may curtail or eliminate the use of MTBE in gasoline in the U.S. and elsewhere in the future.
In 1992, we were the first global supplier of polyurethane chemicals to open a technical service center in China. We have since expanded this facility to include an integrated polyurethanes formulation facility. In January 2003, we entered into two related joint ventures to build MDI production facilities near Shanghai, China. Our MDI joint ventures will enable us to strengthen our long-standing presence in China and to further capitalize on the growth in demand for MDI in Asia.
Our Polyurethanes business accounted for 42%, 43% and 45% of net sales in 2004, 2003 and 2002, respectively
Industry Overview
MDI is used primarily in rigid foam applications and in a wide variety of customized higher-value flexible foam and coatings, adhesives, sealants and elastomers; conversely, TDI is used primarily in commodity flexible foam applications. Polyols, including polyether and polyester polyols, are used in conjunction with MDI and TDI in rigid foam, flexible foam and other non-foam applications. PO is one of the principal raw materials for producing polyether polyols. The following chart illustrates the range of product types and end uses for polyurethane chemicals:
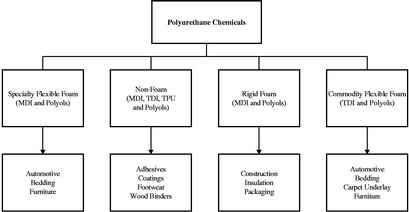
Polyurethane chemicals are sold to customers who combine the chemicals to produce polyurethane products. Depending on their needs, customers will use either commodity polyurethane chemicals produced for mass sales or polyurethane systems tailored for their specific requirements. By varying the blend, additives and specifications of the polyurethane chemicals, manufacturers are able to produce and develop a breadth and variety of polyurethane products
MDI. MDI has a substantially larger market size and a higher growth rate than TDI. This is primarily because MDI can be used to make polyurethanes with a broader range of properties and can therefore be used in a wider range of applications than TDI. We believe that future growth of MDI is expected to be driven by the continued substitution of MDI-based polyurethane for fiberglass and other
4
materials currently used in rigid insulation foam for construction. We expect that other markets, such as binders for reconstituted wood board products, specialty cushioning applications and coatings will further contribute to the continued growth of MDI.
The U.S. and European markets currently consume the largest quantities of MDI. With the recent rapid growth of the developing Asian economies, the Asian markets are becoming an increasingly important market for MDI, and we currently believe that per-capita demand for MDI in Asia will continue to increase as its less-developed economies continue to grow.
There are four major global producers of MDI: Bayer, our Company, BASF and Dow. We believe it is unlikely that any new global producers of MDI will emerge in the foreseeable future due to the substantial requirements for entry such as the limited availability of licenses for MDI technology and the substantial capital commitment and integration that is required to develop both the necessary technology and the infrastructure to manufacture and market MDI.
TDI. The consumers of TDI consist primarily of numerous manufacturers of flexible foam blocks sold for use as furniture cushions and mattresses. Flexible foam is typically the first polyurethane market to become established in developing countries because smaller local plants can be constructed using technology and intermediate chemicals that are easier to obtain than those required for MDI production. As a result, TDI production typically precedes MDI production in developing markets.
TPU. TPU is a high-quality fully formulated thermal plastic derived from the reaction of MDI or an aliphatic isocyanate with polyols to produce unique qualities such as durability, flexibility, strength, abrasion-resistance, shock absorbency and chemical resistance. We can tailor the performance characteristics of TPU to meet the specific requirements of our customers. TPU is used in injection molding and small components for the automotive and footwear industries. It is also extruded into films, wires and cables for use in a wide variety of applications in the coatings, adhesives, sealants and elastomers markets.
Polyols. Polyols are combined with MDI, TDI and other isocyanates to create a broad spectrum of polyurethane products. Demand for specialty polyols has been growing at approximately the same rate at which MDI consumption has grown.
Aniline. Aniline is an intermediate chemical used primarily to manufacture MDI. Generally, most aniline is either consumed internally by the producers of the aniline or is sold to third parties under long-term supply contracts. We believe that the lack of a significant spot market for aniline means that in order to remain competitive, MDI manufacturers must either be integrated with an aniline manufacturing facility or have a long-term cost-competitive aniline supply contract.
5
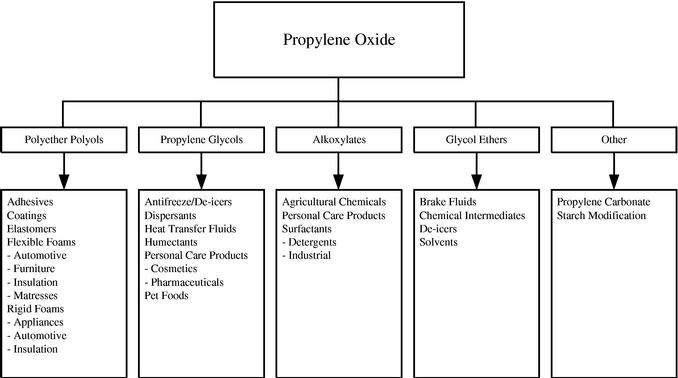
PO. PO is an intermediate chemical used mainly to produce a wide range of polyols and PG. Demand for PO depends largely on overall economic demand, especially that of consumer durables. The following chart illustrates the primary end markets and applications for PO.
MTBE. We currently use our entire production of TBA, a co-product of our PO production process, to produce MTBE. MTBE is an oxygenate that is blended with gasoline to reduce harmful vehicle emissions and to enhance the octane rating of gasoline. Historically, the refining industry utilized tetra ethyl lead as the primary additive to increase the octane rating of gasoline until health concerns resulted in the removal of tetra ethyl lead from gasoline. This led to the increasing use of MTBE as a component in gasoline during the 1980s. MTBE has experienced historical growth due to its ability to satisfy the oxygenation requirement of amendments to the Clean Air Act of 1990 (the "Clean Air Act") with respect to exhaust emissions of carbon monoxide and hydrocarbon emissions from automobile engines. Some regions of the U.S. adopted this oxygenate requirement to improve air quality even though they were not mandated to do so by the Clean Air Act. The use of MTBE is controversial in the U.S. and elsewhere and may be substantially curtailed or eliminated in the future by legislation or regulatory action. See "—Environmental, Health and Safety Matters—MTBE Developments."
Sales and Marketing
We manage a global sales force, with 40 locations in 35 countries, which sells our polyurethane chemicals to over 2,000 customers in more than 90 countries. Our sales and technical resources are organized to support major regional markets, as well as key end-use markets which require a more global approach. These key end-use markets include the appliance, automotive, footwear, furniture and coatings, construction products, adhesives, sealants and elastomers industries.
We provide a wide variety of polyurethane solutions as components (i.e., the isocyanate or the polyol) or in the form of "systems" in which we provide the total isocyanate and polyol formulation to our customers in ready-to-use form. Our ability to deliver a range of polyurethane solutions and technical support tailored to meet our customers needs is critical to our long term success. We have strategically located our polyurethane formulation facilities, commonly referred to in the chemicals
6
industry as "systems houses," close to our customers, enabling us to focus on customer support and technical service. We believe this customer support and technical service system contributes to customer retention and also provides opportunities for identifying further product and service needs of customers. We manufacture TDI and polyols primarily to support our MDI customers' requirements.
We believe that the extensive market knowledge and industry experience of our sales teams and technical experts, in combination with our strong emphasis on customer relationships, have facilitated our ability to establish and maintain long-term customer supply positions. Due to the specialized nature of our markets, our sales force must possess technical knowledge of our products and their applications. Our strategy is to continue to increase sales to existing customers and to attract new customers by providing innovative solutions, quality products, reliable supply, competitive prices and superior customer service.
Manufacturing and Operations
Our MDI production facilities are located in Geismar, Louisiana and Rozenburg, Netherlands. These facilities receive aniline, which is a primary material used in the production of MDI, from our facilities located in Geismar, Louisiana and Wilton, U.K. We believe that this relative scale and product integration of our large facilities provide a significant competitive advantage over other producers. In addition to reducing transportation costs for our raw materials, integration helps reduce our exposure to cyclical prices. Since 1996, we have invested over $600 million to significantly enhance our production capabilities through the rationalization of our older, less efficient facilities and the modernization of our newer facilities at Rozenburg and Geismar.
The following table sets forth the annual production capacity of polyurethane chemicals at each of our polyurethanes facilities:
| |
MDI |
TDI |
Polyols |
TPU |
Aniline |
Nitrobenzene |
PO |
PG |
MTBE(1) |
|||||||||
|---|---|---|---|---|---|---|---|---|---|---|---|---|---|---|---|---|---|---|
| |
(millions of pounds) |
|||||||||||||||||
| Geismar, Louisiana | 860 | 90 | 160 | 715 | (2) | 935 | (2) | |||||||||||
| Port Neches, Texas | 525 | 145 | 260 | |||||||||||||||
| Ringwood, Illinois | 20 | |||||||||||||||||
| Rozenburg, Netherlands | 660 | 120 | ||||||||||||||||
| Wilton, U.K. | 670 | 880 | ||||||||||||||||
| Osnabrück, Germany | 20 | 30 | ||||||||||||||||
| Total | 1,520 | 90 | 300 | 50 | 1,385 | 1,815 | 525 | 145 | 260 | |||||||||
At both our Geismar and Rozenburg facilities we utilize sophisticated proprietary technology to produce our MDI. This technology, which will be used in our world scale joint venture in Shanghai, China, contributes to our position as a low cost MDI producer. In addition to MDI, we use a proprietary manufacturing process to manufacture PO. We own or license all technology, know-how and patents developed and utilized at our PO facility. Our process combines isobutane and oxygen in proprietary oxidation (peroxidation) reactors, thereby forming TBHP and TBA, which are further processed into PO and MTBE, respectively. Because our PO production process is less expensive relative to other technologies and allows all of our PO co-products to be processed into saleable or useable materials, we believe that our PO production technology possesses several distinct advantages over its alternatives.
7
We also operate polyurethane systems houses in Deerpark, Australia; Shanghai, China; Cartagena, Colombia; Deggendorf, Germany; Thane (Maharashtra), India; Ternate, Italy; Tlalnepantla, Mexico; Mississauga, Ontario; Kuan Yin, Taiwan; and Samuprakam, Thailand.
We currently market approximately 95% of our MTBE to customers located in the U.S. for use as a gasoline additive. If the use of MTBE in gasoline in the U.S. is further curtailed or eliminated in the future, we believe that we will be able to export MTBE to Europe, Asia or South America, although this may produce a lower level of cash flow than the sale of MTBE in the U.S. We may also elect to use all or a portion of our precursor TBA to produce saleable products other than MTBE. If we opt to produce products other than MTBE, necessary modifications to our facilities will require us to make significant capital expenditures and the sale of such other products may produce a lower level of cash flow than the sale of MTBE.
Joint Ventures
Rubicon Joint Venture. We and Crompton Corporation own Rubicon LLC, which owns aniline, nitrobenzene and DPA manufacturing facilities in Geismar, Louisiana. We are entitled to approximately 78% of the nitrobenzene and aniline production capacity of Rubicon LLC, and Crompton Corporation is entitled to 100% of the DPA production. In addition to operating the joint venture's owned aniline, nitrobenzene and DPA facilities, Rubicon LLC also operates our wholly owned MDI, TDI and polyol facilities at Geismar and is responsible for providing other auxiliary services to the entire Geismar complex. As a result of this joint venture, we are able to achieve greater scale and lower costs for our products than we would otherwise have been able to obtain.
Chinese MDI Joint Ventures. In January 2003, we entered into two related joint venture agreements to build MDI production facilities near Shanghai, China. The manufacturing joint venture with BASF and three Chinese chemical companies (the "Unconsolidated Chinese Manufacturing JV") will build three plants to manufacture MNB, aniline, and crude MDI. We effectively own 35% of the Unconsolidated Chinese Manufacturing JV. The other joint venture with Shanghai Chlor-Alkali Chemical Company, Ltd. (the "Consolidated Chinese Splitting JV"), will build a plant to manufacture pure MDI, polymeric MDI and MDI variants. We own 70% of the Consolidated Chinese Splitting JV. A feasibility study for the project has been approved by the appropriate Chinese authorities, preliminary engineering work has commenced and a business license was issued in March 2003, making the joint ventures the first entities with foreign investors to receive a license to construct an integrated MDI plant in China.
The project is funded by a combination of equity invested by the joint venture partners and borrowed funds. We anticipate that our equity investment in the joint ventures will be approximately $85 million, and of this amount approximately $42 will be an investment in an unconsolidated affiliate. The remaining approximately $43 million will be invested in a consolidated affiliate, which we expect will have approximately $125 million of total capital expenditures through project completion. Upon expected completion in 2006, the production capacity of this facility will be 525 million pounds per year.
Raw Materials
The primary raw materials for MDI-based polyurethane chemicals are benzene and PO. Benzene is a widely available commodity that is the primary feedstock for the production of MDI and aniline. Historically, benzene has been the largest component of our raw material costs. We use the benzene produced in our Base Chemicals segment and purchase benzene from third parties to manufacture nitrobenzene and aniline, almost all of which we then use to produce MDI. Our vertical integration provides us with a competitively priced supply of feedstocks and reduces our exposure to supply interruption.
8
A major cost in the production of polyols is attributable to the costs of PO. The integration of our PO business with our polyurethane chemicals business gives us access to a competitively priced, strategic source of PO and the opportunity to develop polyols that enhance our range of MDI products. The primary raw materials used in our PO production process are butane/isobutane, propylene, methanol and oxygen, which accounted for 55%, 29%, 14% and 2%, respectively, of total raw material costs in 2004. We purchase our raw materials primarily under long-term contracts. While most of these feedstocks are commodity materials generally available to us from a wide variety of suppliers at competitive prices in the spot market, all the propylene used in the production of our PO is produced internally and delivered through a pipeline connected to our PO facility.
Competition
Our competition in the polyurethane chemicals business includes BASF, Bayer, Dow and Lyondell. While these competitors and others produce various types and quantities of polyurethane chemicals, we focus on MDI and MDI-based polyurethane systems. We compete based on technological innovation, technical assistance, customer service and product reliability. Our polyurethane chemicals business competes in two basic ways: (1) where price is the dominant element of competition, our polyurethane chemicals business differentiates itself by its high level of customer support including cooperation on technical and safety matters; and (2) elsewhere, we compete on the basis of product performance and our ability to react quickly to changing customer needs and by providing customers with innovative solutions to their needs.
Performance Products
General
Our Performance Products include surfactants and amines. We have the capacity to produce approximately 1.7 billion pounds of surfactant products annually at our six facilities located in the U.K. (at Whitehaven), France (at Lavera and St. Mihiel), Spain (at Barcelona), and Italy (at Castiglione and Patrica). Our surfactants facilities are well located throughout Europe, with broad capabilities in conversion, sulfonation and ethoxylation. To improve competitiveness we are restructuring our European surfactants business.
We have the capacity to produce approximately 190 million pounds of ethyleneamines annually at our facilities located at Freeport, Texas and Dow Chemical's facilities located at Terneuzen, Netherlands.
Our Performance Products business accounted for 11%, 12% and 12% of net sales in 2004, 2003 and 2002, respectively.
Industry Overview
Surfactants
Surfactants or "surface active agents" are substances which combine a water-soluble component with a water insoluble component in the same molecule. While surfactants are most commonly used for their detergency in cleaning applications, they are also valued for their emulsification, foaming, dispersing, penetrating and wetting properties in a variety of industries. While growth in demand for surfactants is highly correlated with GDP due to its strong links with the household cleaning and general industrial markets, certain segments of the surfactants market, including personal care, are expected to grow faster than GDP.
9
The table below identifies the major surfactant product groups that we produce and some common applications.
| Product Group |
Application |
|
|---|---|---|
| Alkoxylates | household detergents industrial cleaners shampoos polymerization additives |
|
Sulfonates/Sulfates |
powdered detergents liquid detergents dishwashing liquids industrial cleaners emulsion polymerization concrete superplasticizers gypsum wallboard agricultural adjuvants for herbicides |
|
Esters and Derivatives |
shampoo body wash other personal care products textile and leather treatment |
|
Nitrogen Derivatives |
bleach thickeners shampoo fabric conditioners other personal care products and applications |
|
Formulated Blends |
household detergents textile and leather treatment personal care products and applications foundry catalysts concrete additives pharmaceutical intermediates |
|
EO/PO Block Co-Polymers |
automatic dishwasher detergents |
We believe that demand growth for surfactants is relatively stable and exhibits little cyclicality. The main consumer product applications for surfactants can demand new formulations with unproved performance characteristics which may require further development, and as a result life cycles for these consumer end products can often be quite short. This affords considerable opportunity for innovative surfactants manufacturers to provide surfactants and blends with differentiated specifications and properties. For basic surfactants, pricing tends to have a strong relationship to underlying raw material prices and usually lags petrochemical price movements.
Amines
Amines broadly refer to the family of intermediate chemicals that are produced by reacting ammonia with various ethylene and propylene derivatives. Generally, amines are valued for their properties such as reactivity, emulsification, dispersancy, detergency, and as solvents or corrosion inhibiting agents. Similar to surfactants, growth in demand for amines is highly correlated with GDP due to its strong links to general industrial and consumer products markets. However, certain segments of the amines market, including polyetheramines and carbonates, have grown at rates well in excess of
10
GDP due to new product development, technical innovation, and substitution and replacement of competing products.
As amines are generally sold based upon the performance characteristics that they provide to customer-specific end use applications, pricing for amines tends to be stable and does not generally fluctuate with movements in underlying raw materials.
| Product |
Applications |
|
|---|---|---|
| Ethyleneamines | lube oil additives epoxy hardeners wet strength resins chelating agents fungicides |
The primary raw materials for ethyleneamines are ethylene dichloride and caustic soda. We have entered into long-term arrangements for the supply of ethylene dichloride and caustic soda from Dow, which produces these raw materials at facilities that are in close proximity to our Freeport, Texas manufacturing facility.
Sales and Marketing
We sell our products to customers globally through a commercial organization which has extensive market knowledge, lengthy industry experience and long-standing customer relationships. Our sales force is organized into specialized teams tailored to each market segment's specific needs, thereby enhancing customer service.
We also provide extensive pre- and post-sales technical service support to our customers. Our technical service professionals bring sophisticated skills to our customers and are well regarded within their field of expertise. Moreover, these professionals help tailor the application of our products to meet our customers' unique needs and interact closely with our cross functional business teams.
In addition to direct sales efforts, we also sell some of our products through a network of distributors. In most cases, sales through these distributors have a higher profit margin than direct sales to end users. Distributors typically promote our products to smaller end use customers who cannot cost-effectively be served by our direct sales force.
Manufacturing and Operations
We have the capacity to produce approximately 1.9 billion pounds of surfactant products annually at our six facilities located in the U.K. (at Whitehaven), France (at Lavera and St. Mihiel), Spain (at Barcelona), and Italy (at Castiglione and Patrica). Our surfactants facilities are well located in Europe, with broad capabilities in conversion, sulfonation and ethoxylation. The surfactants facilities use modern production tools that allow for flexibility in production capabilities and technical innovation. In order to improve the competitiveness of our European surfactants business, we have taken measures to reduce the operating costs of the business. During 2003, the Performance Products segment recorded a charge of $22.1 million relating to the closure of a number of plants at the Whitehaven, U.K. facility, the closure of an administrative office in London, U.K., the rationalization of a surfactants technical center in Oldbury, U.K., and the restructuring of a facility in Barcelona, Spain. During 2004, the Company announced a further rationalization of its European surfactants business involving the elimination of approximately 320 jobs. These reductions will occur across all of our European manufacturing locations as well as in business support and administration. This plan includes the closure of substantially all of our Whitehaven, U.K. facility. During the year ended December 31, 2004, the Performance Products segment recorded additional restructuring charges of $73.0 million consisting of $48.6 million of charges payable in cash and $24.4 million of asset impairment charges.
11
We have the capacity to produce approximately 190 million pounds of ethyleneamines annually at our facilities located at Freeport, Texas and Dow Chemical's facilities located at Terneuzen, Netherlands. When we acquired our ethyleneamines business, we acquired a long-term supply arrangement for up to 50% of the existing production capacity of Dow Chemical's ethyleneamines plant in Terneuzen, Netherlands.
Competition
There are numerous surfactants producers in Europe and worldwide. Our main competitors include worldwide leading chemical companies such as Sasol, BASF, Shell, Cognis Group, Clariant Ltd, AKZO Nobel N.V., Dow, as well as various smaller or more local competitors. We compete on the basis of price with respect to our basic surfactant product offering and, in addition to price, on the basis of performance and service with respect to our specialty and blended surfactant products. Our main competitors in ethyleneamines include BASF, Dow and AKZO.
Pigments
General
We are a leading global manufacturer and marketer of titanium dioxide, which is a white pigment used to impart whiteness, brightness and opacity to products such as paints, plastics, paper, printing inks, fibers and ceramics. The global titanium dioxide market is characterized by a small number of large, global producers. We operate eight chloride-based and sulfate-based titanium dioxide manufacturing facilities located in North America, Europe, Asia and Africa.
We offer an extensive range of products that are sold worldwide to approximately 1,500 customers in all major titanium dioxide end markets and geographic regions. The geographic diversity of our manufacturing facilities allows our Pigments segment to service local customers, as well as global customers that require delivery to more than one location. Our diverse customer base includes Ampacet, A. Schulman, Akzo Nobel, Atofina, BASF, Cabot, Clariant, ICI, Jotun and PolyOne. Our pigments business has an aggregate annual nameplate capacity of approximately 550,000 tonnes at our eight production facilities. Five of our titanium dioxide manufacturing plants are located in Europe, one is in North America, one is in Asia, and one is in South Africa. Our North American operation consists of a 50% interest in a manufacturing joint venture with Kronos Worldwide, Inc.
Our Pigments segment is focused on cost control and productivity. In July 2004, we idled 15,000 tonnes of nameplate capacity at our Umbogintwini, South Africa facility, and in November 2004 we idled 40,000 tonnes of nameplate capacity at our Grimsby, U.K. facility, which together represent about 10% of our total titanium dioxide production capacity. Through these closures and other cost saving measures, we will improve our cost position and enhance our ability to compete in the global marketplace. Our other cost saving measures include the optimization of the geographic distribution of our sales, the consolidation of back-office functions and the continued reduction of our fixed and variable costs at each of our manufacturing facilities.
Our Pigments business accounted for 16%, 19% and 19% of net sales in 2004, 2003 and 2002, respectively.
12
Industry Overview
Historically, global titanium dioxide demand growth rates tend to closely track global GDP growth rates. However, the demand growth rate and its relationship with the GDP growth rate varies by region. Developed markets such as the U.S. and Western Europe exhibit higher absolute consumption but lower demand growth rates, while emerging markets such as Asia exhibit much higher demand growth rates. The titanium dioxide industry experiences some seasonality in its sales because paint sales generally peak during the spring and summer months in the northern hemisphere, resulting in greater sales volumes during the second and third quarters of the year.
There are two manufacturing processes for the production of titanium dioxide, the sulfate process and the chloride process. Most recent capacity additions have employed the chloride process technology and, currently, we believe that the chloride process accounts for approximately 70% of global production capacity. However, the global distribution of sulfate- and chloride-based titanium dioxide capacity varies by region, with the sulfate process being predominant in Europe, our primary market. The chloride process is the predominant process used in North America, and both processes are used in Asia. While most end-use applications can use pigments produced by either process, market preferences typically favor products that are locally available. We believe the chloride and sulfate manufacturing processes compete effectively in the marketplace.
The global titanium dioxide market is characterized by a small number of large global producers. The titanium dioxide industry currently has five major producers. Titanium dioxide supply has historically kept pace with increases in demand as producers increased capacity through low cost incremental debottlenecks and efficiency improvements. During periods of low titanium dioxide demand, the industry experiences high stock levels and consequently reduces production to manage working capital. Because pricing in the industry is driven primarily by supply/demand balance, prices have tended to be driven down by lower capacity utilization during periods of weak demand. The last major greenfield titanium dioxide capacity addition was in 1994. Based upon current price levels and the long lead times for planning, governmental approvals and construction, we do not expect significant additional greenfield capacity in the near future.
We believe that demand has recovered in 2004. In addition, capacity additions have been limited. These factors have resulted in higher industry operating rates and lower inventory levels.
Sales and Marketing
Approximately 85% of our titanium dioxide sales are made through our direct sales and technical services network, enabling us to cooperate more closely with our customers and to respond to our increasingly global customer base. Our concentrated sales effort and local manufacturing presence have allowed us to achieve our leading market shares in a number of the countries where we manufacture titanium dioxide.
In addition, we have focused on marketing products to higher growth industries. For example, we believe that our pigments business is well-positioned to benefit from the projected growth in the plastics sector which we expect to grow faster than the overall titanium dioxide market over the next several years.
13
Manufacturing and Operations
Our pigments business has eight manufacturing sites in seven countries with a total capacity of approximately 550,000 tonnes per year. Approximately 72% of our titanium dioxide capacity is located in Western Europe. The following table presents information regarding our titanium dioxide facilities:
| Region |
Site |
Annual Capacity |
Process |
|||
|---|---|---|---|---|---|---|
| |
|
(tonnes) |
|
|||
| Western Europe | Greatham, U.K Calais, France Huelva, Spain Scarlino, Italy Grimsby, U.K.(1) |
100,000 95,000 80,000 80,000 40,000 |
Chloride Sulfate Sulfate Sulfate Sulfate |
|||
| North America | Lake Charles, Louisiana(2) | 70,000 | Chloride | |||
| Asia | Teluk Kalung, Malaysia | 60,000 | Sulfate | |||
| Southern Africa | Umbogintwini, South Africa(3) | 25,000 | Sulfate | |||
| Total | 550,000 | |||||
We are well positioned to implement a number of low cost expansions of our Greatham, U.K. and Huelva, Spain plants. We are also well positioned to selectively invest in new plant capacity based upon our ICON chloride technology. ICON technology allows for the construction of new capacity with world-scale economics at a minimum nameplate size of 65,000 tonnes. We believe competing chloride technologies typically require a minimum capacity of 100,000 tonnes to achieve comparable economics. Our chloride additions can be more easily absorbed into the market, which provides higher investment returns than larger capacity additions.
Joint Ventures
We own a 50% interest in Louisiana Pigment Company L.P., a manufacturing joint venture located in Lake Charles, Louisiana. The remaining 50% interest is held by our joint venture partner, Kronos Worldwide. We share production offtake and operating costs of the plant equally with Kronos Worldwide, though we market our share of the production independently. The operations of the joint venture are under the direction of a supervisory committee on which each partner has equal representation.
Raw Materials
The primary raw materials used to produce titanium dioxide are titanium-bearing ores. We purchase the majority of our ore under long-term supply contracts with a number of ore suppliers. The majority of titanium-bearing ores are sourced from Australia, South Africa and Canada. Ore accounts for approximately 40% of pigment variable manufacturing costs, while utilities (electricity, gas and steam), sulfuric acid and chlorine collectively account for approximately 25% of our variable manufacturing costs.
14
The world market for titanium-bearing ores is dominated by Rio Tinto and Iluka, which account for approximately 55% of global supply. Both companies produce a range of ores for use in chloride and sulfate processes. We purchase approximately 75% of our ore from these two producers. New players, such as Taicor in South Africa and VV Minerals in India, have recently entered the market, however, creating an oversupply of most products. Consequently, the price of most titanium-bearing ores has declined in the last five years, and the ability of major producers to control prices has diminished. Given the small number of suppliers and end-users of titanium-bearing ores, we typically enter into longer-term supply agreements with beneficial terms. Approximately 80% of our ore purchases are made under agreements with terms of three to five years.
Titanium dioxide producers extract titanium from ores and process it into pigmentary titanium dioxide using either the chloride or sulfate process. Once an intermediate titanium dioxide pigment has been produced, it is "finished" into a product with specific performance characteristics for particular end-use applications. The finishing process is common to both the sulfate and chloride processes and is a major determinant of the final product's performance characteristics.
The sulfate process generally uses less-refined ores that are cheaper to purchase but produce more co-product than the chloride process. Co-products from both processes require treatment prior to disposal in order to comply with environmental regulations. In order to reduce our disposal costs and to increase our cost competitiveness, we have developed and marketed the co-products of our pigments business. We sell over 50% of the co-products generated by our business.
Competition
The global markets in which our pigments business operates are highly competitive. Competition is based primarily on price. In addition, we also compete on the basis of product quality and service. The major global producers against whom we compete are DuPont, Kerr McGee, Kronos and Lyondell. We believe that our competitive product offerings, combined with our presence in numerous local markets, makes us an effective competitor in the global market, particularly with respect to those global customers demanding presence in the various regions in which they conduct business.
Base Chemicals
General
We are a highly integrated European olefins and aromatics producer. Olefins, principally ethylene and propylene, are the largest volume basic petrochemicals and are the key building blocks from which many other chemicals are made. For example, olefins are used to manufacture most plastics, resins, adhesives, synthetic rubber and surfactants that are used in a variety of end-use applications. Aromatics, including paraxylene, cyclohexane and benzene, are basic petrochemicals used in the manufacture of polyurethane chemicals, nylon, polyester fibers, synthetic rubber and a variety of plastics.
Our Base Chemicals business accounted for 31%, 26% and 24% of net sales in 2004, 2003 and 2002, respectively.
Olefins
We are a leading European producer of olefins. Our Wilton facility has the capacity to produce approximately 1.9 billion pounds of ethylene, 880 million pounds of propylene and 225 million pounds of butadiene per year. Our Wilton olefins facility benefits from its North Sea location and significant feedstock flexibility, which allows for processing of naphthas, condensates and NGLs. In addition, the facility benefits from extensive underground storage capacity and logistics infrastructure, including pipelines, deepwater jetties and ethylene liquefaction facilities.
15
Aromatics
We produce aromatics in Europe at our two integrated manufacturing facilities located in Wilton, U.K. and North Tees, U.K. We are a leading European producer of cyclohexane with 725 million pounds of annual capacity, a leading producer of paraxylene with 800 million pounds of annual capacity and are among Europe's larger producers of benzene with 1,200 million pounds of annual capacity. We use most of the benzene produced by our aromatics business internally in the production of nitrobenzene for our Polyurethanes business and for the production of cyclohexane. The balance of our aromatics products are sold to several key customers.
Industry Overview
Petrochemical markets are global commodity markets. However, the olefins market is subject to some regional price differences due to the more limited inter-regional trade resulting from the high costs of product transportation. The global petrochemicals market is cyclical and is subject to pricing swings due to supply and demand imbalances, feedstock prices (primarily driven by crude oil and natural gas prices) and general economic conditions.
The olefins markets in Western Europe are supplied by numerous producers, none of whom has a dominant position in terms of its share of production capacity. The top three Western European producers of ethylene are AtoFina, Dow and EniChem.
The aromatics market is primarily composed of cyclohexane, benzene and paraxylene. Like the olefins market, the aromatics market is characterized by several major producers, including Dow, AtoFina, Shell, EniChem, ExxonMobil, BASF and ChevronPhillips.
Sales and Marketing
In recent years, our sales and marketing efforts have focused on developing long-term contracts with customers to minimize our selling expenses and administration costs.
Manufacturing and Operations
We produce olefins at our facility in Wilton, U.K. In addition, we own and operate integrated aromatics manufacturing facilities at Wilton U.K. and at North Tees, U.K. Information regarding these facilities is set forth below:
| Location |
Product |
Annual Capacity |
||
|---|---|---|---|---|
| |
|
(millions of pounds) |
||
| Wilton, U.K. | Ethylene Propylene Butadiene Paraxylene |
1,900 880 225 800 |
||
| North Tees, U.K. | Benzene Cyclohexane |
1,200 725 |
Raw Materials
The primary raw materials that we use as feedstocks in our Base Chemicals business are hydrocarbons produced as byproducts of the refining crude oil and natural gas, such as ethane, propane and butane. These materials are actively traded on the spot and futures markets and are readily available from multiple sources. We benefit from our locations in the U.K. where we are able to take advantage of our pipeline system and our proximity to refineries located near the North Sea. Our
16
North Tees facility, situated on the northeast coast of England, is near a substantial supply of oil, natural gas and chemical feedstocks. Due to our location at North Tees, we have the option to purchase feedstocks from a variety of sources. However, we have elected to procure the majority of our naphtha, condensates and NGLs from local producers as they have been the most economical sources. In order to secure the optimal mix of the required quality and type of feedstock for our petrochemical operations at fully competitive prices, we regularly engage in the purchase and sale of feedstocks.
Competition
The markets in which our Base Chemicals business operates are highly competitive. Our competitors in the olefins and aromatics business are frequently some of the world's largest chemical companies. The primary factors for competition in this business are price, service and reliability of supply. The technology used in these businesses is widely available and licensed.
Research and Development
For the years ended 2004, 2003 and 2002, we spent $40.9 million, $49.4 million and $54.6 million, respectively, on research and development of our products.
We support our business with a major commitment to R&D, technical services and process engineering improvement. Our primary R&D center is located in Everberg, Belgium. Other regional development/technical service centers are located in Billingham, England (Pigments); Auburn Hills, Michigan (Polyurethanes for the automotive industry); West Deptford, New Jersey, North Andover, Massachusetts; Shanghai, China; Deggendorf, Germany; Ternate, Italy (Polyurethanes); Oldbury, U.K. (surfactants) and Wilton, U.K. for process engineering support. We have announced that we intend to close our West Deptford and Oldbury facilities in late 2005. We intend to relocate the research and development capabilities of this facility to a new research and development center in The Woodlands, Texas that we expect to open in 2005.
Intellectual Property Rights
Proprietary protection of our processes, apparatuses, and other technology and inventions is important to our businesses. We own approximately 180 unexpired U.S. patents, approximately 59 patent applications (including provisionals) currently pending at the U.S. Patent and Trademark Office, and approximately 1,785 foreign counterparts, including both issued patents and pending patent applications. While a presumption of validity exists with respect to issued U.S. patents, we cannot assure that any of our patents will not be challenged, invalidated, circumvented or rendered unenforceable. Furthermore, we cannot assure the issuance of any pending patent application, or that if patents do issue, that these patents will provide meaningful protection against competitors or against competitive technologies. Additionally, our competitors or other third parties may obtain patents that restrict or preclude our ability to lawfully produce or sell our products in a competitive manner.
We also rely upon unpatented proprietary know-how and continuing technological innovation and other trade secrets to develop and maintain our competitive position. There can be no assurance, however, that confidentiality agreements into which we enter and have entered will not be breached, that they will provide meaningful protection for our trade secrets or proprietary know-how, or that adequate remedies will be available in the event of an unauthorized use or disclosure of such trade secrets and know-how. In addition, there can be no assurance that others will not obtain knowledge of these trade secrets through independent development or other access by legal means.
In addition to our own patents and patent applications and proprietary trade secrets and know-how, we have entered into certain licensing arrangements that authorize us to use certain trade secrets, know-how and related technology and/or operate within the scope of certain patents owned by other entities. We also license and sub-license certain intellectual property rights to affiliates and to
17
third parties. In connection with our transaction with HIH, ICI and Huntsman Specialty (under the terms of a technology transfer agreement and a PO/MTBE technology transfer agreement), we have licensed back to ICI and Huntsman LLC (on a non-exclusive basis) certain intellectual property rights for use in their respective retained businesses, and ICI and Huntsman LLC have each licensed certain retained intellectual property to us.
We have associated brand names with a number of our products, and we have approximately 35 U.S. trademark registrations (including applications for registration currently pending at the U.S. Patent and Trademark Office), and approximately 1,979 foreign counterparts, including both registrations and applications for registration. However, there can be no assurance that the trademark registrations will provide meaningful protection against the use of similar trademarks by competitors, or that the value of our trademarks will not be diluted.
Employees
As of December 31, 2004, we employed approximately 5,700 people in our operations around the world. Approximately 250 of these employees are located in the U.S., while approximately 5,450 are located in other countries. We believe our relations with our employees are good.
Huntsman LLC provides management and administrative services to us and also provides operating services for our PO business. See "Item 13—Certain Relationships and Related Transactions."
Environmental, Health and Safety Matters
General
We are subject to extensive federal, state, local and foreign laws, regulations, rules and ordinances relating to pollution, protection of the environment and the generation, storage, handling, transportation, treatment, disposal and remediation of hazardous substances and waste materials. In the ordinary course of business, we are subject to frequent environmental inspections and monitoring and occasional investigations by governmental enforcement authorities. In addition, our production facilities require operating permits that are subject to renewal, modification and, in certain circumstances, revocation. Actual or alleged violations of environmental laws or permit requirements could result in restrictions or prohibitions on plant operations, substantial civil or criminal sanctions, as well as, under some environmental laws, the assessment of strict liability and/or joint and several liability. Moreover, changes in environmental regulations could inhibit or interrupt our operations, or require us to modify our facilities or operations. Accordingly, environmental or regulatory matters may cause us to incur significant unanticipated losses, costs or liabilities.
Environmental, Health and Safety Systems
We are committed to achieving and maintaining compliance with all applicable environmental, health and safety ("EHS") legal requirements, and we have developed policies and management systems that are intended to identify the multitude of EHS legal requirements applicable to our operations, enhance compliance with applicable legal requirements, ensure the safety of our employees, contractors, community neighbors and customers and minimize the production and emission of wastes and other pollutants. Although EHS legal requirements are constantly changing and are frequently difficult to comply with, these EHS management systems are designed to assist us in our compliance goals while also fostering efficiency and improvement and minimizing overall risk to us.
18
EHS Capital Expenditures
We may incur future costs for capital improvements and general compliance under EHS laws, including costs to acquire, maintain and repair pollution control equipment. For the years ended December 31, 2004 and 2003, our capital expenditures for EHS matters totaled $27.8 million and $31.0 million, respectively. Since capital expenditures for these matters are subject to evolving regulatory requirements and depend, in part, on the timing, promulgation and enforcement of specific requirements, we cannot provide assurance that our recent expenditures will be indicative of future amounts required under EHS laws.
Governmental Enforcement Proceedings
On occasion, we receive notices of violation, enforcement and other complaints from regulatory agencies alleging non-compliance with applicable EHS law. By way of example, we are aware of the individual matters set out below, which we believe to be the most significant presently pending matters and unasserted claims. Although we may incur costs or penalties in connection with the governmental proceedings discussed below, based on currently available information and our past experience, we believe that the ultimate resolution of these matters will not have a material impact on our results of operations, financial position or liquidity.
In the third quarter of 2004, our Jefferson County, Texas facilities received notification from the Texas Commission on Environmental Quality ("TCEQ") of potential air emission violations relating to alleged upset air emissions. We have investigated the allegations and responded in writing to TCEQ. TCEQ has proposed a penalty of $174,219 for the alleged upset violations. Negotiations are anticipated between us and TCEQ with respect to the resolution of these alleged violations. We do not believe that the final cost to resolve these matters will be material.
See "Item 3. Legal Proceedings" for a discussion of environmental lawsuits brought by private party plaintiffs.
Remediation Liabilities
We have incurred, and we may in the future incur, liability to investigate and clean up waste or contamination at our current or former facilities or facilities operated by third parties at which we may have disposed of waste or other materials. Similarly, we may incur costs for the cleanup of wastes that were disposed of prior to the purchase of our businesses. Under some circumstances, the scope of our liability may extend to damages to natural resources. Specifically, under the U.S. Comprehensive Environmental Response, Compensation and Liability Act of 1980, as amended ("CERCLA"), and similar state laws, a current or former owner or operator of real property may be liable for remediation costs regardless of whether the release or disposal of hazardous substances was in compliance with law at the time it occurred, and a current owner or operator may be liable regardless of whether it owned or operated the facility at the time of the release. In addition, under the U.S. Resource Conservation and Recovery Act of 1976, as amended ("RCRA"), and similar state laws, we may be required to remediate contamination originating from our properties as a condition to our hazardous waste permit. In many cases, our potential liability arising from historical contamination is based on operations and other events occurring prior to our ownership of the relevant facility. In these situations, we obtained an indemnity agreement from the prior owner addressing remediation liabilities arising from pre-closing conditions. We make no assurance, however, that our existing indemnities will be sufficient to cover our liabilities for such matters.
Environmental Reserves
We have established financial reserves relating to anticipated environmental cleanup obligations, site reclamation and closure costs and known penalties. Liabilities are recorded when potential
19
liabilities are either known or considered probable and can be reasonably estimated. Our liability estimates are based upon available facts, existing technology and past experience. On a consolidated basis, we have accrued a total of approximately $21.2 million for environmental-related liabilities as of December 31, 2004. We believe these reserves are sufficient for known requirements relating to these matters. We may incur losses for environmental remediation in excess of the amounts accrued; however, we are not able to estimate the amount or range of such losses.
Regulatory Developments
Under the European Union ("EU") Integrated Pollution Prevention and Control Directive ("IPPC"), EU member governments are to adopt rules and implement a cross-media (air, water and waste) environmental permitting program for individual facilities. While the EU countries are at varying stages in their respective implementation of the IPPC permit program, we have submitted all necessary IPPC permit applications required to date, and in some cases received completed permits from the applicable government agency. We expect to submit all other IPPC applications and related documents on a timely basis as the various countries implement the IPPC permit program. Although we do not know with certainty what each IPPC permit will require, we believe, based upon our experience with the permits received to date, that the costs of compliance with the IPPC permit program will not be material to our results of operations, financial position or liquidity.
In October 2003, the European Commission adopted a proposal for a new EU regulatory framework for chemicals. Under this proposed new system called "REACH" (Registration, Evaluation and Authorization of Chemicals), companies that manufacture or import more than one ton of a chemical substance per year would be required to register such manufacture or import in a central database. The REACH initiative, as proposed, would require risk assessment of chemicals, preparations (e.g., soaps and paints) and articles (e.g., consumer products) before those materials could be manufactured or imported into EU countries. Where warranted by a risk assessment, hazardous substances would require authorizations for their use. This regulation could impose risk control strategies that would require capital expenditures by us. As proposed, REACH would take effect in three primary stages over the eleven years following the final effective date (assuming final approval). The impacts of REACH on the chemical industry and on us are unclear at this time because the parameters of the program are still being actively debated.
MTBE Developments
The use of MTBE is controversial in the U.S. and elsewhere and may be substantially curtailed or eliminated in the future by legislation or regulatory action. The presence of MTBE in some groundwater supplies in California and other states (primarily due to gasoline leaking from underground storage tanks) and in surface water (primarily from recreational watercraft) has led to public concern about MTBE's potential to contaminate drinking water supplies. Heightened public awareness regarding this issue has resulted in state, federal and foreign initiatives to rescind the federal oxygenate requirements for reformulated gasoline or restrict or prohibit the use of MTBE in particular. For example, California, New York and Connecticut have adopted rules that prohibit the use of MTBE in gasoline sold in those states as of January 1, 2004. Overall, states that have taken some action to prohibit or restrict the use of MTBE in gasoline account for a substantial portion of the "pre-ban" U.S. MTBE market. Thus far, attempts by others to challenge these state bans in federal court under the reformulated gasoline provisions of the federal Clean Air Act have been unsuccessful.
The U.S. Congress has been considering legislation that would eliminate the oxygenated fuels requirements in the Clean Air Act and phase out or curtail MTBE use over a period of several years. To date, no such legislation has become law. If it were to become law it could result in a federal phase-out of the use of MTBE in gasoline in the U.S., but it would not prevent us from manufacturing MTBE in our plants. In addition, in March 2000, the EPA announced its intention, through an
20
advanced notice of proposed rulemaking, to phase out the use of MTBE under authority of the federal Toxic Substances Control Act. EPA has not yet acted on this proposal, however. In Europe, the EU issued a final risk assessment report on MTBE in September 2002. No ban of MTBE was recommended, though several risk reduction measures relating to storage and handling of MTBE-containing fuel were recommended.
We currently market approximately 95% of our MTBE to customers located in the U.S. for use as a gasoline additive. Any phase-out or other future regulation of MTBE in other jurisdictions, nationally or internationally, may result in a significant reduction in demand for our MTBE and in a material loss in revenues or material costs or expenditures. In the event that there should be a complete phase-out of MTBE in the U.S., we believe we will be able to export MTBE to Europe, Asia or South America, although this may produce a lower level of cash flow than the sale of MTBE in the U.S. We may also elect to use all or a portion of our precursor TBA to produce saleable products other than MTBE. If we opt to produce products other than MTBE, necessary modifications to our facilities may require significant capital expenditures and the sale of the other products may produce a materially lower level of cash flow than the sale of MTBE.
In addition to the use limitations described above, a number of lawsuits have been filed, primarily against gasoline manufacturers, marketers and distributors, by persons seeking to recover damages allegedly arising from the presence of MTBE in groundwater. While we have not been named as a defendant in any litigation concerning the environmental effects of MTBE, we cannot provide assurances that we will not be involved in any such litigation or that such litigation will not have a material adverse effect on our results of operations, financial position or liquidity.
Available Information
We maintain an Internet website at http://www.huntsman.com. Our annual reports on Form 10-K, quarterly reports on Form 10-Q, current reports on Form 8-K and amendments to these reports are available free of charge through our website as soon as reasonably practicable after we file this material with the SEC. We also provide electronic or paper copies of our SEC filings free of charge upon request.
We own or lease chemical manufacturing and research facilities in the locations indicated in the list below, which we currently believe are adequate for our short-term and anticipated long-term needs. We own or lease office space and storage facilities throughout the U.S. and many foreign countries. Our principal executive offices, which are leased from Huntsman LLC, are located at 500 Huntsman Way, Salt Lake City, Utah 84108. Our operational headquarters, which are leased, are located at 10003
21
Woodloch Forest Drive, The Woodlands, Texas 77380. The following is a list of our material owned or leased properties where manufacturing, research and main office facilities are located.
| Location |
Description of Facility |
|
|---|---|---|
| Geismar, Louisiana(1) | MDI, TDI, Nitrobenzene(1), Aniline(1) and Polyols Manufacturing Facilities | |
| Rozenburg, Netherlands(2) | MDI Manufacturing Facility, Polyols Manufacturing Facilities and Systems House | |
| Wilton, U.K. | Aniline and Nitrobenzene Manufacturing Facilities | |
| Peel, Canada(2) | Polyurethane Systems House | |
| West Deptford, New Jersey(3) | Polyurethane Systems House, Research Facility and U.S. Regional Headquarters | |
| Auburn Hills, Michigan(2) | Polyurethane Office Space and Research Facility | |
| Deerpark, Australia(2) | Polyurethane Systems House | |
| Cartagena, Colombia | Polyurethane Systems House | |
| Deggendorf, Germany | Polyurethane Systems House | |
| Ternate, Italy | Polyurethane Systems House | |
| Shanghai, China(2) | Polyurethane Systems House | |
| Thane (Maharashtra), India(2) | Polyurethane Systems House | |
| Samuprakam, Thailand(2) | Polyurethane Systems House | |
| Kuan Yin, Taiwan(2) | Polyurethane Systems House | |
| Tlalnepantla, Mexico | Polyurethane Systems House | |
| Everberg, Belgium | Polyurethane Research Facility, Global Headquarters and European Headquarters | |
| Gateway West, Singapore(2) | Polyurethane Regional Headquarters | |
| Ringwood, Illinois(2) | TPU Manufacturing Facility | |
| Osnabrück, Germany | TPU Manufacturing Facility | |
| Port Neches, Texas | PO Manufacturing Facility and MTBE Manufacturing Facility | |
| Wilton, U.K. | Olefins and Aromatics Manufacturing Facilities, Base Chemicals Headquarters | |
| North Tees, U.K.(2) | Aromatics Manufacturing Facility and Logistics/Storage Facility | |
| Grimsby, U.K. | TiO2 Manufacturing Facility | |
| Greatham, U.K. | TiO2 Manufacturing Facility | |
| Calais, France | TiO2 Manufacturing Facility | |
| Huelva, Spain | TiO2 Manufacturing Facility | |
| Scarlino, Italy | TiO2 Manufacturing Facility | |
| Teluk Kalung, Malaysia | TiO2 Manufacturing Facility | |
| Lake Charles, Louisiana(4) | TiO2 Manufacturing Facility | |
| Umbogintwini, South Africa | TiO2 Manufacturing Facility | |
| Billingham, U.K. | TiO2 Research and Technical Facility, and Pigments Headquarters | |
| Warrenville, Illinois(1) | Titanium Dioxide North American Technical and Commercial Center | |
| Whitehaven, U.K.(5) | Surfactants Manufacturing Facility | |
| St Mihiel, France | Surfactants Manufacturing Facility | |
| Lavera, France(2) | Surfactants Manufacturing Facility | |
| Castiglione, Italy | Surfactants Manufacturing Facility | |
| Patrica/Frosinone, Italy | Surfactants Manufacturing Facility | |
| Barcelona, Spain | Surfactants Manufacturing Facility | |
| Oldbury, U.K(2)(6) | Surfactants Research Facility | |
| Warley, U.K(2)(6) | Surfactants Regional Headquarters | |
| Freeport, Texas | Amines Manufacturing Facility |
22
We have settled certain claims relating to discoloration of unplasticized polyvinyl chloride products allegedly caused by our titanium dioxide ("Discoloration Claims") during and prior to the second quarter of 2004. Substantially all of the titanium dioxide that was the subject of these claims was manufactured prior to our acquisition of our titanium dioxide business from ICI in 1999. Net of amounts we have received from insurers and pursuant to contracts of indemnity, we have paid approximately £8 million ($14.9 million) in costs and settlement amounts for Discoloration Claims as of December 31, 2004.
The following table presents information about the number of Discoloration Claims for the periods indicated. Claims include all claims for which service has been received by us, and each such claim represents a plaintiff who is pursuing a claim against us.
| |
Year ended December 31, 2004 |
Year ended December 31, 2003 |
Year ended December 31, 2002 |
|||
|---|---|---|---|---|---|---|
| Claims filed during period | 1 | 1 | 0 | |||
| Claims resolved during period | 2 | 2 | 0 | |||
| Claims unresolved at end of period | 3 | 4 | 5 |
The five Discoloration Claims unresolved at the end of 2002 included three claims that did not quantify monetary damages and two claims asserting aggregate damages of approximately $4.5 million. During the year ended December 31, 2003, we settled claims for approximately $77.7 million, all of which was paid by our insurers or ICI. The four Discoloration Claims unresolved at the end of 2003 included two claims that did not quantify monetary damages and two claims asserting aggregate damages of approximately $4.5 million. During the year ended December 31, 2004, we settled claims for approximately $45.3 million, approximately $30.4 million of which was paid by our insurers or ICI and approximately $14.9 million of which was paid by us. During 2004, we recorded charges of $15.1 million relating to Discoloration Claims. The three Discoloration Claims unresolved on December 31, 2004 asserted aggregate damages of approximately $6.7 million. A liability has been accrued for these Discoloration Claims. In March 2005, one of these Discoloration Claims was amended to assert additional damages of approximately $56 million. Based on our understanding of the merits of this claim and our rights under contracts of indemnity and insurance, we do not believe that the net impact on our financial condition, results of operations or liquidity will be material.
While additional Discoloration Claims may be made in the future, we cannot reasonably estimate the amount of loss related to such claims. Although we may incur additional costs as a result of future claims (including settlement costs), based on our history with Discoloration Claims to date, the fact that substantially all of the titanium dioxide that has been the subject of these Discoloration Claims was manufactured and sold more than five years ago, and the fact that we have rights under contract to indemnity, including from ICI, we do not believe that any unasserted possible Discoloration Claims, if any, will have a material impact on our financial condition, results of operations or liquidity. Based on this conclusion and our inability to reasonably estimate our expected costs with respect to these unasserted possible claims, we have made no accruals in our financial statements as of December 31, 2004 for costs associated with unasserted possible Discoloration Claims, if any.
Certain insurers have denied coverage with respect to certain Discoloration Claims. We brought suit against these insurers to recover the amounts we believe are due to us. The court found in favor of the insurers, and we lodged an application for leave to appeal that decision. Leave to appeal was granted in December 2004. We expect the appeal to be heard during the third quarter of 2005.
We are a party to various other proceedings instituted by private plaintiffs, governmental authorities and others arising under provisions of applicable laws, including various environmental, products liability and other laws. Except as otherwise disclosed in this report, we do not believe that the outcome of any of these matters will have a material adverse effect on our financial condition, results of operations or liquidity. See "Item 1—Business—Environmental, Health and Safety Matters" for a discussion of environmental proceedings.
ITEM 4. SUBMISSION OF MATTERS TO A VOTE OF SECURITY HOLDERS
Omitted pursuant to General Instruction I of Form 10-K.
23
ITEM 5. MARKET FOR REGISTRANT'S COMMON EQUITY, RELATED STOCKHOLDER MATTERS AND ISSUER PURCHASES OF EQUITY SECURITIES
Market Information
As of the date of this report, there was no established public trading market for any class of our membership interests.
Holders
As of the date of this report, HIH was the only holder of record of our membership interests. HIH is 100% owned, directly or indirectly, by Huntsman Corporation. For more information, see "Item 1—Business—Ownership" above.
Distributions
Pursuant to our limited liability company agreement and the limited liability company agreement of HIH, we have a tax sharing arrangement with all of our and HIH's membership interest holders. Under the arrangement, because we are treated as a partnership for United States income tax purposes, we make payments to our parent, HIH, which in turn makes payments to its membership interest holders, in an amount equal to the United States federal and state income taxes we and HIH would pay if HIH were treated as a corporation for tax purposes. The arrangement also provides that, if we previously made payments to HIH, and HIH has made payments out to its membership interest holders, we will receive cash payments back from the membership interest holders (through HIH) in amounts equal to the United States federal and state income tax refunds or benefit against future tax liabilities we would have received from the use of net operating losses or tax credits generated by us, up to the amount of payments that we have previously made. As of December 31, 2004, approximately $3.9 million is due to us from the membership interest holders (through HIH).
Except in accordance with the above paragraph, our senior secured credit facilities (the "HI Credit Facilities") restrict our ability to pay dividends or other distributions on our equity interests, including prohibiting us from making distributions to HIH for the purpose of paying principal, interest or premium on the outstanding notes of HIH. The indentures governing our outstanding notes also place certain restrictions on our ability to pay dividends and make other distributions.
The restrictions contained in the indentures governing our notes may prevent us from making any "restricted payments," including (i) any dividends, distributions or other payments to holders of our equity interests or (ii) payments to purchase, redeem or otherwise acquire or retire for value any of our equity interests, subject to certain exceptions contained in such indentures.
ITEM 6. SELECTED FINANCIAL DATA
The following table sets forth selected financial data for our Company as of the dates and for the periods indicated. Information should be read in conjunction with our Consolidated Financial Statements and Notes thereto included on the pages immediately following the Index to Consolidated
24
Financial Statements appearing on page F-1. See also "Item 7—Management's Discussion and Analysis of Financial Condition and Results of Operations."
| |
Year ended December 31, |
||||||||||||||
|---|---|---|---|---|---|---|---|---|---|---|---|---|---|---|---|
| |
2004 |
2003 |
2002 |
2001 |
2000 |
||||||||||
| Statement of Operations Data: | |||||||||||||||
| Revenues | $ | 6,503.4 | $ | 5,245.5 | $ | 4,518.1 | $ | 4,575.2 | $ | 4,447.9 | |||||
| Gross profit | 824.9 | 584.4 | 615.4 | 585.1 | 742.5 | ||||||||||
| Restructuring, impairment and plant closing costs | 249.5 | 56.7 | 7.7 | 46.6 | — | ||||||||||
| Operating income | 181.2 | 175.9 | 228.1 | 171.2 | 421.8 | ||||||||||
| Net (loss) income | (49.5 | ) | (130.9 | ) | 20.1 | (59.4 | ) | 150.7 | |||||||
| Other Data: | |||||||||||||||
| Depreciation and amortization | $ | 312.4 | $ | 277.9 | $ | 256.2 | $ | 229.0 | $ | 201.7 | |||||
| Capital expenditures | 141.3 | 127.4 | 190.5 | 291.0 | 204.5 | ||||||||||
| Balance Sheet Data (at period end): | |||||||||||||||
| Total assets | $ | 5,848.9 | $ | 5,492.7 | $ | 5,167.3 | $ | 4,862.1 | $ | 4,815.4 | |||||
| Total debt | 3,054.8 | 2,927.1 | 2,773.8 | 2,637.9 | 2,350.5 | ||||||||||
| Total liabilities | 4,641.4 | 4,335.4 | 4,102.0 | 3,862.6 | 3,677.1 | ||||||||||
ITEM 7. MANAGEMENT'S DISCUSSION AND ANALYSIS OF FINANCIAL CONDITION AND RESULTS OF OPERATIONS
We derive our revenues, earnings and cash flow from the sale of a wide variety of differentiated and commodity chemicals. We manage our operations through our four principal operating segments: Polyurethanes, Performance Products, Pigments and Base Chemicals. We manufacture products at facilities located in North America, Europe, Asia, Australia and Africa, and our products are sold throughout the world. The major products of each reportable operating segment are as follows:
| Segment |
Products |
|
|---|---|---|
| Polyurethanes | MDI, TDI, TPU, polyols, aniline, PO and MTBE | |
| Performance Products | Surfactants, ethyleneamines and other performance chemicals | |
| Pigments | Titanium dioxide ("TiO2") | |
| Base Chemicals | Ethylene, propylene, benzene, cyclohexane and paraxylene |
Our products are divided into two broad categories—differentiated and commodity chemicals. Our Polyurethanes and Performance Products businesses mainly produce differentiated products and our Pigments and Base Chemicals businesses mainly produce commodity chemicals. Among our commodity products, our Pigments business, while cyclical, tends to follow different trends and is not influenced by the same factors as our petrochemical-based commodity products. In addition, there are a limited number of significant competitors in our Pigments business, relatively high barriers to entry and strong customer loyalty. Each of our four operating segments is impacted to varying degrees by economic conditions, prices of raw materials and global supply and demand pressures.
Growth in our Polyurethanes segment has been driven by the continued substitution of our products for other materials across a broad range of applications as well as the level of global economic activity. Historically, demand for many of these products has grown at rates in excess of GDP growth. In Polyurethanes, this growth, particularly in Asia, has recently resulted in improved demand and higher industry capacity utilization rates for many of our key products, including MDI. In 2004, the profitability of our Polyurethanes segment improved due to increased demand in several of our key
25
industrial end markets. This allowed us to increase selling prices, which more than offset increases in the cost of our primary raw materials.
The global PO market is influenced by supply and demand imbalances. PO demand is largely driven by growth in the polyurethane industry, and, as a result, growth rates for PO have generally exceeded GDP growth rates. As a co-product of our PO manufacturing process, we also produce MTBE. MTBE is an oxygenate that is blended with gasoline to reduce harmful vehicle emissions and to enhance the octane rating of gasoline. See "Item 1—Business—Environmental, Health and Safety Matters—MTBE Developments" for more information on the legal and regulatory developments that may curtail or eliminate the use of MTBE in gasoline in the U.S.
In our Performance Products segment, demand for our ethyleneamines has generally continued to grow at rates in excess of GDP as overall demand is significantly influenced by new product and application development. In 2004, excess surfactants manufacturing capacity in Europe limited our ability to increase prices in response to higher raw material costs.
Historically, demand for titanium dioxide pigments has grown at rates approximately equal to global GDP growth. Pigment prices have historically reflected industry-wide operating rates but have typically lagged behind movements in these rates by up to twelve months due to the effects of product stocking and destocking by customers and producers, contract arrangements and seasonality. The industry experiences some seasonality in its sales because sales of paints, the largest end use for titanium dioxide, generally peak during the spring and summer months in the northern hemisphere. This results in greater sales volumes in the second and third quarters of the year.
The profitability of our Base Chemicals segment has historically been cyclical in nature. The industry has recently operated in a down cycle that resulted from significant new capacity additions, weak demand reflecting soft global economic conditions and high crude oil and natural gas-based raw material costs. Despite continued high feedstock costs, the profitability of our Base Chemicals segment improved in 2004 as demand strengthened and average selling prices and profit margins increased in most of our product lines.
26
The following sets forth the consolidated results of operations for the three years ended December 31, 2004.
| |
Year Ended December 31, 2004 |
Year Ended December 31, 2003 |
Year Ended December 31, 2002 |
Percent Change 2004 vs 2003 |
Percent Change 2003 vs 2002 |
|||||||||
|---|---|---|---|---|---|---|---|---|---|---|---|---|---|---|
| Revenues | $ | 6,503.4 | $ | 5,245.5 | $ | 4,518.1 | 24 | % | 16 | % | ||||
| Cost of goods sold | 5,678.5 | 4,661.1 | 3,902.7 | 22 | % | 19 | % | |||||||
| Gross profit | 824.9 | 584.4 | 615.4 | 41 | % | (5 | )% | |||||||
| Operating expenses (including expenses of selling, general, and administrative, research and development and other operating costs) | 394.2 | 351.8 | 379.6 | 12 | % | (7 | )% | |||||||
| Restructuring and plant closing costs | 249.5 | 56.7 | 7.7 | 340 | % | 636 | % | |||||||
| Operating income | 181.2 | 175.9 | 228.1 | 3 | % | (23 | )% | |||||||
| Interest expense, net | (254.2 | ) | (251.5 | ) | (245.4 | ) | 1 | % | 2 | % | ||||
| Loss on accounts receivable securitization program | (15.6 | ) | (32.4 | ) | (5.5 | ) | (52 | )% | 489 | % | ||||
| Other (expense) income | (19.5 | ) | (1.3 | ) | 1.3 | NM | NM | |||||||
| Loss before income taxes | (108.1 | ) | (109.3 | ) | (21.5 | ) | (1 | )% | 408 | % | ||||
| Income tax benefit (expense) | 58.6 | (21.6 | ) | 41.5 | NM | NM | ||||||||
| Minority interests in subsidiaries' income | — | — | 0.1 | NM | NM | |||||||||
| Net (loss) income | (49.5 | ) | (130.9 | ) | 20.1 | (62 | )% | NM | ||||||
| Interest expense, net | 254.2 | 251.5 | 245.4 | 1 | % | 2 | % | |||||||
| Income tax (benefit) expense | (58.6 | ) | 21.6 | (41.5 | ) | NM | NM | |||||||
| Depreciation and amortization | 312.4 | 277.9 | 256.2 | 12 | % | 8 | % | |||||||
| EBITDA(1) | $ | 458.5 | $ | 420.1 | $ | 480.2 | 9 | % | (13 | )% | ||||
NM—Not meaningful
Included in EBITDA are the following unusual items of expense:
| |
Years ended December 31, |
|||||||||||
|---|---|---|---|---|---|---|---|---|---|---|---|---|
| |
2004 |
2003 |
2002 |
|||||||||
| Loss on sale of accounts receivable securitization program | $ | (15.6 | ) | $ | (32.4 | ) | $ | (5.5 | ) | |||
| Asset write-downs | — | (5.8 | ) | — | ||||||||
| Legal Settlement, net of recoveries | (15.1 | ) | — | — | ||||||||
| Loss on early extinguishment of debt | (19.5 | ) | — | — | ||||||||
| Restructuring, impairment, and plant closing costs: | ||||||||||||
| Polyurethanes | $ | (36.9 | ) | $ | (28.1 | ) | $ | — | ||||
| Performance Products | (73.0 | ) | (22.1 | ) | (4.6 | ) | ||||||
| Pigments | (123.3 | ) | (6.5 | ) | (3.1 | ) | ||||||
| Base Chemicals | (16.3 | ) | — | — | ||||||||
| Total restructuring and plant closing costs | $ | (249.5 | ) | $ | (56.7 | ) | $ | (7.7 | ) | |||
27
We believe that net income (loss) is the performance measure calculated and presented in accordance with GAAP that is most directly comparable to EBITDA and that cash provided by (used in) operating activities is the liquidity measure calculated and presented in accordance with
28
GAAP that is most directly comparable to EBITDA. The following table reconciles EBITDA to our net loss and to our cash provided by (used in) operations:
| |
Years ended December 31, |
|||||||||
|---|---|---|---|---|---|---|---|---|---|---|
| |
2004 |
2003 |
2002 |
|||||||
| EBITDA | $ | 458.5 | $ | 420.1 | $ | 480.2 | ||||
| Depreciation and amortization expense | (312.4 | ) | (277.9 | ) | (256.2 | ) | ||||
| Interest expense, net | (254.2 | ) | (251.5 | ) | (245.4 | ) | ||||
| Income tax benefit (expense) | 58.6 | (21.6 | ) | 41.5 | ||||||
| Net (loss) income | (49.5 | ) | (130.9 | ) | 20.1 | |||||
| Depreciation and amortization expense | 312.4 | 277.9 | 256.2 | |||||||
| Non-cash restructuring, plant closing and asset | ||||||||||
| impairment charges | 116.4 | 11.4 | 6.1 | |||||||
| Loss on early extinguishment of debt | 19.5 | — | — | |||||||
| Deferred income taxes | (75.3 | ) | — | (59.8 | ) | |||||
| Unrealized gains on foreign currency transactions | (61.5 | ) | (64.3 | ) | (29.5 | ) | ||||
| Other, net | 18.5 | 26.4 | 16.7 | |||||||
| Changes in operating assets and liabilities | (134.7 | ) | (22.0 | ) | (31.7 | ) | ||||
| Net cash provided by operating activities | $ | 145.8 | $ | 98.5 | $ | 178.1 | ||||
Year Ended December 31, 2004 Compared to Year Ended December 31, 2003
For the year ended December 31, 2004, we had a net loss of $49.5 million on revenues of $6,503.4 million as compared to a net loss of $130.9 million on revenues of $5,245.5 million for 2003. The decrease of $81.4 million in net loss was the result of the following items:
29
The following table sets forth the revenues and segment EBITDA for each of our operating segments.
| |
Year Ended December 31, 2004 |
Year Ended December 31, 2003 |
Percent Change |
|||||||
|---|---|---|---|---|---|---|---|---|---|---|
| Revenues | ||||||||||
| Polyurethanes | $ | 2,877.4 | $ | 2,297.5 | 25 | % | ||||
| Performance Products | 751.3 | 659.6 | 14 | % | ||||||
| Pigments | 1,048.1 | 1,009.9 | 4 | % | ||||||
| Base Chemicals | 2,118.5 | 1,421.8 | 49 | % | ||||||
| Eliminations | (291.9 | ) | (143.3 | ) | (104 | )% | ||||
| Total | $ | 6,503.4 | $ | 5,245.5 | 24 | % | ||||
| Segment EBITDA | ||||||||||
| Polyurethanes | $ | 364.0 | $ | 233.4 | 56 | % | ||||
| Performance Products | (69.1 | ) | (15.8 | ) | (337 | )% | ||||
| Pigments | (30.0 | ) | 105.4 | NM | ||||||
| Base Chemicals | 206.9 | 77.7 | 166 | % | ||||||
| Corporate and other | (13.3 | ) | 19.4 | NM | ||||||
| Total | $ | 458.5 | $ | 420.1 | 9 | % | ||||
NM—Not meaningful
Polyurethanes
For the year ended December 31, 2004, Polyurethanes revenues increased by $579.9 million, or 25%, as compared to 2003, primarily from higher average selling prices and higher sales volumes for MDI. MDI revenues increased by 31%, resulting from 17% higher average selling prices and 12% higher sales volumes. The increase in MDI average selling prices resulted principally from improved market demand coupled with tighter supply, the strength of the major European currencies versus the
30
U.S. dollar and in response to higher raw material and energy costs. Higher MDI volumes reflect further extension of markets for MDI and recent improvements in global economic conditions.
For the year ended December 31, 2004, Polyurethanes segment EBITDA increased by $130.6 million, or 56%, as compared to 2003. Restructuring and plant closing costs of $36.9 million and $28.1 million for the years ended December 31, 2004 and 2003, respectively, were included in segment EBITDA. For further discussion of restructuring activities, see "—Restructuring and Plant Closing Costs" below. Excluding restructuring charges, segment EBITDA increased by $139.4 million in 2004, resulting mainly from higher contribution margins as average selling prices increased more than raw material and energy costs.
Performance Products
For the year ended December 31, 2004, Performance Products revenues increased by $91.7 million, or 14%, as compared to 2003, primarily as a result of higher average selling prices, offset somewhat by lower sales volumes. Overall, average selling prices increased by 17% in response to higher raw material costs and the strengthening of the major European currencies versus the U.S. dollar. A 2% decrease in sales volumes resulted principally from lower surfactants sales.
For the year ended December 31, 2004, Performance Products segment EBITDA decreased by $53.3 million to a loss of $69.1 million from a loss of $15.8 million in 2003. This decrease was due primarily to a $50.8 million increase in restructuring and plant closing costs in 2004. Restructuring and plant closing costs of $73.0 million and $22.1 million for the years ended December 31, 2004 and 2003, respectively, were included in segment EBITDA. For further discussion of restructuring activities, see "—Restructuring and Plant Closing Costs" below. Excluding restructuring charges, 2004 EBITDA was relatively unchanged from 2003.
Pigments
For the year ended December 31, 2004, Pigments revenues increased by $38.2 million, or 4%, as compared to 2003, resulting principally from 4% higher average selling prices. Average selling prices benefited primarily from the strengthening of the major European currencies versus the U.S. dollar.
Pigments segment EBITDA for the year ended December 31, 2004 decreased by $135.4 million to a loss of $30.0 million from income of $105.4 million in 2003. The decrease is mainly the result of an increase in restructuring and plant closing costs of $116.8 million and charges of $15.1 million relating to the payment of costs and settlement amounts relating to Discoloration Claims recorded in 2004. The remaining decrease in segment EBITDA of $3.5 million resulted principally from a $14.5 million reduction in EBITDA primarily in response to the strengthening of the major European currencies versus the U.S. dollar, offset somewhat by lower fixed costs resulting from cost reduction initiatives. During 2004 and 2003, our Pigments segment recorded restructuring and plant closing charges of $123.3 million and $6.5 million, respectively. For further discussion of restructuring activities, see "—Restructuring and Plant Closing Costs" below.
Base Chemicals
For the year ended December 31, 2004, Base Chemicals revenues increased by $696.7 million, or 49%, as compared to 2003, primarily resulting from a 40% increase in average selling prices and a 6% increase in sales volumes. Average selling prices were higher primarily in response to higher raw material and energy costs and the strengthening of the major European currencies versus the U.S. dollar. Sales volumes increased for all key products, principally as a result of increased customer demand.
31
For the year ended December 31, 2004, Base Chemicals segment EBITDA increased by $129.2 million, or 166%, as compared to 2003, principally as a result of higher contribution margins as higher average selling prices more than offset higher raw material costs. EBITDA for the year ended December 31, 2004 included charges for restructuring and plant closing costs of $16.3 million. For further discussion of restructuring activities, see "—Restructuring and Plant Closing Costs" below.
Corporate and Other
Corporate and other items include unallocated corporate overhead, loss on our accounts receivable securitization program and unallocated foreign exchange gains and losses. For the year ended December 31, 2004, EBITDA from corporate and other items decreased by $32.7 million to a loss of $13.3 million from income of $19.4 million in 2003. The increase resulted primarily from a reduction in unallocated foreign exchange gains.
Year Ended December 31, 2003 Compared to Year Ended December 31, 2002
For the year ended December 31, 2003, we had a net loss of $130.9 million on revenues of $5,245.5 million, compared to net income of $20.1 million on revenues of $4,518.1 million for 2002. The increase of $151.0 million in net loss was the result of the following items:
32
2002. Losses on the accounts receivable securitization program include the discount on receivables sold into the program, fees and expenses associated with the program and gains (losses) on foreign currency hedge contracts mandated by the terms of the program to hedge currency exposures on the collateral supporting the off-balance sheet debt issued. This increase is mainly attributable to losses on foreign currency hedge contracts mandated by the accounts receivable securitization program, and the increase in the size of our accounts receivable securitization program effective October 2002.
The following table sets forth the revenues and EBITDA for each of our operating segments.
| |
Year Ended December 31, 2003 |
Year Ended December 31, 2002 |
Percent Change |
|||||||
|---|---|---|---|---|---|---|---|---|---|---|
| Revenues | ||||||||||
| Polyurethanes | $ | 2,297.5 | $ | 2,066.0 | 11 | % | ||||
| Performance Products | 659.6 | 574.3 | 15 | % | ||||||
| Pigments | 1,009.9 | 880.3 | 15 | % | ||||||
| Base Chemicals | 1,421.8 | 1,097.5 | 30 | % | ||||||
| Eliminations | (143.3 | ) | (100.0 | ) | (43 | )% | ||||
| Total | $ | 5,245.5 | $ | 4,518.1 | 16 | % | ||||
| Segment EBITDA | ||||||||||
| Polyurethanes | $ | 233.4 | $ | 365.1 | (36 | )% | ||||
| Performance Products | (15.8 | ) | 27.2 | NM | ||||||
| Pigments | 105.4 | 68.3 | 54 | % | ||||||
| Base Chemicals | 77.7 | 13.8 | 463 | % | ||||||
| Corporate and other | 19.4 | 5.8 | 234 | % | ||||||
| Total | $ | 420.1 | $ | 480.2 | (13 | )% | ||||
NM—Not meaningful
Polyurethanes
For the year ended December 31, 2003, Polyurethanes revenues increased by $231.5 million, or 11%, to $2,297.5 million from $2,066.0 million for 2002. MDI sales revenue increased by 11%, due to 11% higher average selling prices and relatively flat volumes. The overall lack of MDI volume growth was largely the result of a reduction in spot sales to co-producers in 2003. MDI sales volumes, excluding spot sales, rose by 6%, with increases of 20%, 6% and 2% in Asia, the Americas and Europe, respectively, driven by the improved rigid polyurethanes market in the fourth quarter 2003. MDI overall average selling prices increased by 11%, 7% of which was attributable to the strength of the major European currencies versus the U.S. dollar and 4% of which was attributable to our continued efforts to increase sales prices as raw material costs increased. Polyol sales revenue increased by 16% as sales volumes increased by 4%, consistent with underlying MDI volumes, and average selling prices increased by 12%, 7% of which was attributable to the strength of the major European currencies versus the U.S. dollar. PO revenue decreased 8%, primarily due to the conversion of certain
33
sales to a tolling arrangement, which affected revenues but only had a minimal impact on gross margin. MTBE sales revenue increased by 14% due to a 7% increase in volumes and a 7% increase in selling prices due to stronger crude oil and gasoline markets.
For the year ended 2003, Polyurethanes segment EBITDA decreased by $131.7 million to $233.4 million from $365.1 million for the same period in 2002. Lower EBITDA resulted mainly from a $271.9 million increase in raw material and energy costs, partly offset by a $200.5 million improvement in average selling prices. We also recorded $28.1 million in restructuring charges in connection with the integration of our global flexible products unit into our urethane specialties unit and cost reduction efforts at our Rozenburg, Netherlands site. These charges are part of an overall cost reduction program that is expected to be implemented and recorded from 2003 to 2005. We also incurred a $2.5 million charge due to the write-off of an asset formerly used in connection with our Geismar, Louisiana TDI facility. Fixed production costs increased $33.6 million, primarily due to the $18.9 million impact of the strengthening of the major European currencies versus the U.S. dollar, increased pension costs of $10.1 million and a $7.1 million fixed cost absorption as a result of a reduction in inventory levels. Operating expenses also increased by $1.5 million due to a $16.6 million adverse foreign currency exchange impact, partly offset by $15.1 million in cost savings as measured in local currencies.
Performance Products
For the year ended 2003, Performance Products revenues increased by $85.3 million, or 15%, to $659.6 million from $574.3 million in 2002. Overall, Performance Products sales volumes fell by 4% and average selling prices increased by 20%, of which 12% was due to foreign currency movements. Surfactants revenues increased by 6% as compared to 2002, resulting from a 15% increase in average selling prices and a 7% decrease in sales volumes. Average selling prices of surfactants in local currencies fell due to intense competition, but our selling prices increased by 19% due to the strength of the major European currencies versus the U.S. dollar. The reduction in surfactants' sales volumes was largely the result of softer European demand, competitive activity and decreased export business as a result of the strength of the major European currencies versus the U.S. dollar. Ethyleneamines revenues increased by 17% compared with 2002, resulting primarily from a 7% increase in average selling prices and a 9% increase in sales volumes. The increase in ethyleneamines average selling prices was due to price increases implemented to offset increased raw material costs. Sales volumes of ethyleneamines increased largely due to higher export sales. Other sales revenues, primarily amines, increased by 56% compared with 2002. This increase resulted primarily from a 19% increase in sales volumes and a 31% increase in average selling prices. These increases were primarily the result of the initiation of tolling agreements with affiliates.
For the year ended 2003, Performance Products segment EBITDA decreased by $43.0 million to a loss of $15.8 million from a profit of $27.2 million in 2002. Restructuring costs in the year ended December 31, 2003 were $17.5 million higher than in the same period in 2002, due to the $20.1 million charge taken in connection with the closure of certain units at our Whitehaven, U.K. facility in September 2003 and $2.0 million charged in respect of severance costs arising from the closure of an administrative office in London, U.K., the rationalization of our surfactants technical center in Oldbury, U.K. and the restructuring of our facility in Barcelona, Spain. Lower sales volumes negatively impacted EBITDA by approximately $3.7 million. An $89.0 million increase in selling prices was largely offset by raw material cost increases of $87.5 million. Fixed production costs were relatively unchanged as negative currency impacts of $10.0 million were offset by the effect of cost reduction programs and the operation of only one of our two ethyleneamines units at our Freeport, Texas facility for much of the year. Operating expenses increased by $22.6 million, of which $9.0 million was attributable to adverse currency movements and $9.0 million of which was due mainly to costs paid to Huntsman LLC under tolling and commercial arrangements for the sale of performance products on their behalf, which were entirely offset by the margin earned on the sale of such products.
34
Pigments
For the year ended December 31, 2003, Pigments revenues increased by $129.6 million, or 15%, to $1,009.9 million from $880.3 million for the same period in 2002. Average selling prices increased by 13%, of which 9% resulted from the strength of the major European currencies versus the U.S. dollar, and the remainder of which resulted from improved supply and demand conditions. Average selling prices as measured in local currencies increased by 5%, 3% and 6% in Europe, North America and Asia-Pacific ("APAC"), respectively, due to price increases implemented in early 2003 as a result of favorable supply and demand conditions that existed at that time. Sales volumes increased overall by 1%, with North America showing an increase of 1% and APAC showing an increase of 6%, while Europe was unchanged.
For the year ended December 31, 2003, Pigments segment EBITDA increased by $37.1 million to $105.4 million from $68.3 million in 2002. The increase in EBITDA is primarily a result of a $114.6 million increase in selling prices and the $5.3 million impact of the 1% increase in sales volume, partially offset by an increase in manufacturing costs of $83.1 million. The manufacturing costs increase was caused mainly by foreign currency movements of $84.6 million, which were partially offset by savings of $4.9 million, as measured in local currencies, from our cost reduction initiatives. Operating expenses increased by $1.6 million mainly due to an increase in restructuring charges of $3.4 million and a $3.2 million increase in pension costs, partially offset by the release of $2.6 million of surplus environmental provisions recorded in relation to our Tracy, Canada facility which was closed in 2000.
Base Chemicals
For the year ended December 31, 2003, Base Chemicals revenues increased by $324.3 million, or 30%, to $1,421.8 million from $1,097.5 million for 2002. The increase in revenues was caused by a 33% increase in average selling prices, partially offset by a 3% reduction in overall sales volumes. Base Chemicals average selling prices were up 21% in response to higher raw material and energy prices and favorable supply and demand conditions, and 12% due to the strength of the major European currencies versus the U.S. dollar. The reduction in Base Chemicals volumes was caused primarily by reduced sales of raw materials, primarily naphtha, which we sell from time to time as favorable opportunities arise. Ethylene revenues increased 39%, resulting from a 12% increase in volumes and a 24% increase in average sales prices. Propylene revenues increased 50%, resulting from a 17% increase in volumes and a 28% increase in average sales prices. Paraxylene revenues increased 28%, resulting from a 4% decrease in volumes and a 34% increase in average sales prices. Benzene revenues increased 17%, resulting from a 15% decrease in volumes and a 37% increase in average sales prices. Cyclohexane revenues increased 41%, resulting from a 7% increase in volumes and a 32% increase in average sales prices. Sales volume increases for ethylene and propylene reflected increased demand and the fact that 2002 included a turnaround at our Wilton, U.K. olefins facility.
For the year ended December 31, 2003, Base Chemicals segment EBITDA increased by $63.9 million to $77.7 million from $13.8 million in 2002. Increased segment EBITDA primarily resulted from the impact of increased selling prices of $348.4 million, offset by increased raw material costs of $258.2 million, mainly due to a 23% increase in the cost of our main feedstock, naphtha. Fixed production costs increased $37.0 million, of which $16.0 million was due to foreign currency impacts, $11.0 million due to costs reclassified from operating expenses and $7.0 million due to higher pension costs. Operating expenses decreased $11.9 million, which included $11.0 million of costs reclassified as fixed production costs, insurance claim recoveries of $2.6 million and recoveries from the sale of precious metals used in the manufacturing process amounting to $3.3 million. These operating expense decreases were partially offset by $2.4 million associated with various terminated capital projects and reduced foreign currency translation gains of $1.9 million.
35
Corporate and Other
Corporate and other items include unallocated corporate overhead, loss on our accounts receivable securitization program and unallocated foreign exchange gains and losses. For the year ended December 31, 2003, EBITDA from corporate and other items increased by $13.6 million to $19.4 million from $5.8 million for 2002. The increase resulted primarily from increased unallocated foreign exchange gains caused primarily by the strength of the major European currencies versus the U.S. dollar. Unallocated foreign exchange gains were $48.3 million higher, with a gain of $95.3 million in the year ended December 31, 2003 as compared to a gain of $47.0 million in the year ended December 31, 2002. In general, our unallocated foreign exchange gains and losses result primarily from movements in the foreign exchange rates used to translate the current portion of intercompany balances to the functional currency at the end of the period and from the translation of foreign currency receivable balances sold into our accounts receivable securitization program to U.S. dollars.
The increased unallocated foreign exchange gains were partially offset by increased losses on the accounts receivable securitization program, which increased by $26.9 million to a loss of $32.4 million in the year ended December 31, 2003 as compared to a loss of $5.5 million in 2002. Losses on the accounts receivable securitization program include the discount on receivables sold into the program, fees and expenses associated with the program and gains (losses) on foreign currency hedge contracts mandated by the terms of the program to hedge currency exposures on the collateral supporting the off-balance sheet debt issued. The increased losses on the accounts receivable securitization program were primarily due to losses on foreign exchange hedge contracts mandated by our accounts receivable securitization program and the increase in the size of our securitization facility effective October 2002. Other cost increases were the result of a higher management fee paid to Huntsman LLC of $3.5 million, an asset valuation adjustment of $2.8 million, and the expensing of $1.1 million of abandoned transaction costs.
Liquidity and Capital Resources
Cash
Net cash provided by operating activities for the year ended December 31, 2004 increased by $47.3 million to $145.8 million from $98.5 million provided by operating activities in 2003. The increase is primarily attributable to a reduced net loss of $81.4 and favorable variances in adjustments to reconcile net income (loss) to net cash provided by operations, including favorable variances of $105.0 million in non-cash restructuring charges, $34.5 million in depreciation and $19.5 million on early extinguishment of debt, partially offset by a negative variance of $112.7 million in changes in operating assets and liabilities and $75.3 million in deferred income taxes.
Net cash used in investing activities for the year ended December 31, 2004 increased by $11.4 million to $147.1 million from $135.7 million for 2003, partly as a result of increased capital expenditures and investments associated with our Chinese joint ventures.
Net cash provided by financing activities for the year ended December 31, 2004 decreased by $24.4 million to $30.0 million, as compared to $54.4 million in 2003. The decrease is mainly a result of reduced net borrowings to fund operating cash requirements. The financing activities for the year ended December 31, 2003 include (i) the issuance of $205 million of additional term loans under the HI Credit Facilities, the net proceeds of which were applied to pay down a portion of outstanding borrowings under the HI revolving credit facility and other term debt under the HI Credit Facilities, and (ii) the issuance of $150 million of additional senior unsecured notes, the net proceeds of which were used to repay amounts outstanding under the HI Credit Facilities. The financing activities for the year ended December 31, 2004 include (i) the refinancing of the HI Credit Facilities, (ii) the issuance of $175 million 7.50% and €135 million 7.375% HI Senior Subordinated Notes due 2015 (defined below), the net proceeds of which were used to redeem in part the HI Senior Subordinated Notes
36
(defined below), and (iii) the repayment of $59.0 million of debt under the HI Credit Facilities with excess cash flow on December 31, 2004.
Changes in Financial Condition
| |
December 31, 2004 |
December 31, 2003 |
Difference |
Percent Change |
||||||||||
|---|---|---|---|---|---|---|---|---|---|---|---|---|---|---|
| Current assets: | ||||||||||||||
| Cash and cash equivalents | $ | 138.0 | $ | 97.8 | $ | 40.2 | 41 | % | ||||||
| Accounts and notes receivable | 806.0 | 564.4 | 241.6 | 43 | % | |||||||||
| Inventories | 735.6 | 596.9 | 138.7 | 23 | % | |||||||||
| Prepaid expenses | 30.8 | 23.6 | 7.2 | 31 | % | |||||||||
| Deferred income taxes | 10.2 | 3.0 | 7.2 | NM | ||||||||||
| Other current assets | 50.5 | 83.6 | (33.1 | ) | (40 | )% | ||||||||
| Total current assets | 1,771.1 | 1,369.3 | 401.8 | 29 | % | |||||||||
| Current liabilities: | ||||||||||||||
| Accounts payable | 688.3 | 561.3 | 127.0 | 23 | % | |||||||||
| Accrued liabilities | 419.7 | 387.7 | 32.0 | 8 | % | |||||||||
| Current portion of long-term debt | 10.5 | 1.8 | 8.7 | NM | ||||||||||
| Total current liabilities | 1,118.5 | 950.8 | 167.7 | 18 | % | |||||||||
| Working capital | $ | 652.6 | $ | 418.5 | $ | 234.1 | 56 | % | ||||||
NM—Not meaningful
As of December 31, 2004, our working capital increased by $234.1 million as a result of the net impact of the following significant changes:
37
Debt and Liquidity
HI Credit Facilities
On July 13, 2004, we completed an amendment and restatement of the HI Credit Facilities. Pursuant to the amendment and restatement, the revolving loan facility (the "HI Revolving Facility") was reduced from $400 million to $375 million and the maturity was extended from June 2006 to September 2008. The HI Revolving Facility includes a $50 million multicurrency revolving loan facility available in euros, GBP Sterling and U.S. dollars. As of December 31, 2004, there were no outstanding loans under the HI Revolving Facility and there were $7.4 million in letters of credit outstanding. In addition, pursuant to the amendment and restatement, term loans B and C, totaling $1,240.2 million, were repaid and replaced with the new term facility (the "HI Term Facility") consisting of a $1,305 million term portion and a €50 million (approximately $61.6 million as of July 13, 2004) term portion. The additional proceeds from the HI Term Facility of approximately $126.6 million were applied to repay the $82.4 million of outstanding borrowings as of July 13, 2004 on the HI Revolving Facility and for general corporate purposes and to provide a portion of the funds for the construction of a polyethylene production facility at our Wilton, U.K. facility. The HI Credit Facilities are secured by a first priority lien on substantially all the assets of HIH, our domestic subsidiaries, and certain of our foreign subsidiaries.
In compliance with applicable provisions of the HI Credit Facilities, on December 31, 2004, we prepaid $59 million on the HI Term Facility as a result of excess cash flow. This prepayment was applied in accordance with the provisions of the HI Credit Facilities in such a manner that there will be no scheduled maturities under the HI Credit Facilities due until June 2006 and such that all remaining scheduled maturities under the HI Term Facility will be reduced on a pro rata basis. As of December 31, 2004, subsequent to this prepayment, the HI Term Facility had a balance of $1,314.1 million, consisting of a $1,248.9 million term portion and a €47.8 million ($65.2 million) term portion.
Pursuant to the July 13, 2004 amendment and restatement of the HI Credit Facilities, interest rates on the HI Revolving Facility and the HI Term Facility decreased from a weighted LIBOR spread of 3.50% and 4.125% to 3.25% and 3.25%, respectively. In addition, scheduled amortization of the HI Term Facility, subsequent to the excess cash payment discussed above, is approximately $13.3 million per year, commencing June 30, 2006, with the remaining unpaid balance due at maturity on December 31, 2010. Maturity will be accelerated to December 31, 2008 if we have not refinanced all of our outstanding HI Senior Notes (as defined below) and HI Senior Subordinated Notes due 2009 (as defined below) on or before December 31, 2008 on terms satisfactory to the administrative agent under the HI Credit Facilities. On December 21, 2004, we further amended the HI Credit Facilities to, among other things, reduce the applicable base (prime) rate margin for the term loan B dollar loans from a range of 1.75% to 2.00% to a range of 1.00% to 1.25% and to reduce the applicable Eurocurrency (LIBOR) rate margin for the term loan B dollar loans from a range of 3.00% to 3.25% to a range of 2.25% to 2.50%.
The HI Credit Facilities contain customary financial covenants, covenants relating to the incurrence of debt and the purchase and sale of assets, limitations on investments and affiliate transactions, change in control provisions, events of default and acceleration provisions. The amendment and restatement of the HI Credit Facilities amended certain financial covenants. These amendments, among other things, included changes to the maximum leverage ratio, the minimum interest coverage ratio, and provided for an increase in the permitted amount of annual consolidated capital expenditures from $250 million to $300 million, with a provision for carryover to subsequent years. In addition, the mandatory prepayment level in connection with our accounts receivable securitization program was increased from $310 million to $325 million. For more information, see "—Liquidity and Capital Resources—Off-Balance Sheet Arrangements" below. The HI Credit Facilities
38
contain covenants that, as of December 31, 2004, require us to maintain a leverage ratio of consolidated net debt to consolidated EBITDA (as defined in the HI Credit Facilities) equal to or less than 6.75 to 1.00 and an interest coverage ratio of consolidated EBITDA to consolidated cash interest expense (as defined in the HI Credit Facilities) equal to or greater than 1.80 to 1.00. As of December 31, 2004, our leverage ratio of consolidated net debt to consolidated EBITDA was 4.29 to 1.00, and its interest coverage ratio of consolidated EBITDA to consolidated cash interest expense was 2.88 to 1.00. In addition, the HI Credit Facilities contain a limit on calendar year consolidated capital expenditures (as defined in the HI Credit Facilities) of $400 million ($300 million annual allowance plus $100 million in prior year carryover) for 2004. For the year ended December 31, 2004, our consolidated capital expenditures for covenant purposes totaled $147.1 million.
Notes
In March 2002, we sold $300 million aggregate principal amount of our 9.875% senior unsecured notes due 2009 (the "HI Senior Notes"). On April 11, 2003, we sold an additional $150 million aggregate principal amount of the HI Senior Notes at an issue price of 105.25%. Net proceeds from the sale of these notes were used to repay amounts outstanding under the HI Credit Facilities. The HI Senior Notes are unsecured obligations. Interest on the HI Senior Notes is payable semi-annually in March and September of each year. The HI Senior Notes are redeemable after March 1, 2006 at 104.937% of the principal amount thereof, declining ratably to par on and after March 1, 2008.
On December 17, 2004, we completed an offering of $175 million of our 7.375% senior subordinated notes due 2015 and €135 million of our 7.5% senior subordinated notes due 2015 (the "HI Senior Subordinated Notes due 2015"). We used all of the net proceeds to redeem part of our outstanding 10.125% senior subordinated notes due 2009 (the "HI Senior Subordinated Notes due 2009" and, together with the HI Senior Subordinated Notes due 2015, the "HI Senior Subordinated Notes"). Prior to the partial redemptions of the HI Senior Subordinated Notes due 2009 discussed below, we had outstanding $600 million and €450 million ($559.6 million, which includes $5.2 million of unamortized premium). The HI Senior Subordinated Notes due 2009 became redeemable on July 1, 2004 at 105.063% of the principal amount thereof, which declines ratably to par on and after July 1, 2007. In advance of the issuance of the HI Senior Subordinated Notes due 2015, we gave notice that we would redeem $231 million and €77 million of HI Senior Subordinated Notes due 2009 on December 31, 2004 and $2.9 million and €1.0 million of HI Senior Subordinated Notes due 2009 on January 3, 2005. We completed these redemptions as scheduled. In connection with these redemptions, we paid approximately $17.0 million and $0.2 million in U.S. dollar equivalents in redemption premiums on December 31, 2004 and January 3, 2005, respectively.
As of December 31, 2004, following the December 31, 2004 partial redemption of the HI Senior Subordinated Notes due 2009, we have outstanding $369 million and €373 million of HI Senior Subordinated Notes due 2009 and $175 million and €135 million of HI Senior Subordinated Notes due 2015, for a combined total of $544 million and €508 million of HI Senior Subordinated Notes plus $5.3 million of unamortized premium. Following the January 3, 2005 partial redemption, we have outstanding $366.1 million and €372 million of HI Senior Subordinated Notes due 2009 and $175 million and €135 million of HI Senior Subordinated Notes due 2015, for a combined total of $541.1 million and €507 million of HI Senior Subordinated Notes plus $5.3 million of unamortized premium. The $175 million and €135 million HI Senior Subordinated Notes due 2015 are redeemable on or after January 1, 2010 at 103.688% and 103.750%, respectively, of the principal amount thereof, which declines ratably to par on and after January 1, 2013. In addition, at any time prior to January 1, 2008, we may redeem up to 40% of the aggregate principal amount of the $175 million and €135 million HI Senior Subordinated Notes due 2015 at redemption prices of 107.375% and 107.500% plus accrued and unpaid interest, respectively, with the net proceeds of a qualified equity offering. The
39
HI Senior Subordinated Notes are unsecured and interest is payable semi-annually in January and July of each year.
On December 10, 2004, we entered into a cross-currency swap. The cross-currency swap requires us to pay euros and receive U.S. dollars at the maturity date of January 1, 2010. The U.S. dollar notional amount is $175 million and bears interest at a fixed rate of 7.375%, payable semiannually on January 1 and July 1. The euro notional amount is approximately €132 million and bears interest at a blended fixed rate of approximately 6.63%, payable semiannually on January 1 and July 1.
Other Debt
We maintain a $25 million multicurrency overdraft facility for our European subsidiaries (the "HI European Overdraft Facility"), all of which was available as of December 31, 2004. As of December 31, 2003, we had approximately $7.5 million outstanding under the HI European Overdraft Facility included within trade payables. The HI European Overdraft Facility is used for daily working capital needs.
Included within other debt is debt associated with one of our Chinese MDI joint ventures. In January 2003, we entered into a joint venture agreement with Shanghai Chlor-Alkali Chemical Company, Ltd. to build MDI production facilities near Shanghai, China. We own 70% of the Consolidated Chinese Splitting JV, Huntsman Polyurethanes Shanghai Ltd., which is a consolidated affiliate. On September 19, 2003, the Consolidated Chinese Splitting JV obtained secured financing for the construction of the production facilities, consisting of various committed loans in the aggregate amount of approximately $119 million in U.S. dollar equivalents. As of December 31, 2004, there were $8.0 million outstanding in U.S. dollar borrowings and 20.0 million in RMB borrowings ($2.4 million) under these facilities. The interest rate on these facilities is LIBOR plus 0.48% for U.S. dollar borrowings and 90% of the Peoples Bank of China rate for RMB borrowings. As of December 31, 2004, the interest rate for U.S. dollar borrowings was approximately 3.1% and 5.5% for RMB borrowings. The loans are secured by substantially all the assets of the Consolidated Chinese Splitting JV and will be repaid in 16 semi-annual installments, beginning no later than June 30, 2007. The financing is non-recourse to us, but is guaranteed during the construction phase by affiliates of the Consolidated Chinese Splitting JV, including Huntsman Corporation, as the successor to Huntsman Holdings. Huntsman Corporation has unconditionally guaranteed 70% of any amounts due and unpaid by the Consolidated Chinese Splitting JV under the loans described above (except for the VAT facility, which is not guaranteed). Huntsman Corporation's guarantees remain in effect until the Consolidated Chinese Splitting JV has (i) commenced production at least 70% of capacity for at least 30 days, and (ii) achieved a debt service cover ratio of at least 1.5:1.
Short-Term and Long-Term Liquidity; Compliance with Covenants
We depend upon the HI Revolving Facility and our off-balance sheet accounts receivable securitization facility (the "HI A/R Securitization Program") to provide liquidity for our operations and working capital needs. For further discussion of the HI A/R Securitization Program, see "—Off-Balance Sheet Arrangements" below. As of December 31, 2004, we had no outstanding borrowings and approximately $7.4 million of outstanding letters of credit under the HI Revolving Facility, and we had $138.0 million in cash. We also maintain $25.0 million of short-term overdraft facilities, of which the entire amount was available at December 31, 2004. Furthermore, as of December 31, 2004, we had available capacity of approximately $116.6 million under the HI A/R Securitization Program. Our total cash and unused borrowing capacity as of December 31, 2004 was approximately $647.2 million.
On February 28, 2005, we paid a dividend to HIH of $35 million. The dividend was used together with proceeds from the Huntsman Corporation initial public offering to redeem the HIH senior discount notes due 2009.
40
We believe our current liquidity, together with funds generated by our businesses, is sufficient to meet the short-term and long-term needs of our businesses, including funding operations, making capital expenditures and servicing our debt obligations in the ordinary course. We believe that we are currently in compliance with the covenants contained in the agreements governing all of our debt obligations.
Off-Balance Sheet Arrangements
Receivables Securitization
We maintain an off-balance sheet accounts receivables securitization facility to provide liquidity for our operations and working capital needs. Under the HI A/R Securitization Program, interests in certain of our trade receivables are transferred to a qualified off-balance sheet entity (the "Receivables Trust"). The Receivables Trust is not our affiliate. The acquisitions of these receivables by the Receivables Trust are financed through the issuance of dollar- or euro-denominated commercial paper and/or medium term notes of the Receivables Trust. The debt associated with the commercial paper and medium term notes is not reflected on our balance sheet. The HI A/R Securitization Program is an important source of liquidity to our Company.
A portion of the medium term notes (€90.5 million) is denominated in euros and is subject to fluctuation in currency rates versus the U.S. dollar. The total outstanding balance of medium term notes was approximately $208.4 million and $198.4 million in U.S. dollar equivalents as of December 31, 2004 and December 31, 2003, respectively. In addition to medium term notes, the Receivables Trust also maintains an annual commitment with a third party to issue commercial paper for an amount up to $125 million. As of December 31, 2004, we had no commercial paper issued and outstanding under the facility. As of December 31, 2003, we had $100 million of commercial paper outstanding under the facility. The commercial paper facility matures on March 31, 2007, and the medium term notes mature in June 2006.
Subject to the annual seasonality of our accounts receivable, we estimate that the total availability from the sale of accounts receivable under the accounts receivable securitization facility will be approximately $325 million (the mandatory prepayment limit under the HI Credit Facilities, as discussed below) during the calendar year. The weighted average interest rates on the medium term notes and commercial paper was approximately 2.7% as of December 31, 2004. Losses on the HI A/R Securitization Program in the year ended December 31, 2004 were $15.6 million. Losses on the HI A/R Securitization Program include the discount on receivables sold into the program, fees and expenses associated with the program and gains (losses) on foreign currency hedge contracts mandated by the terms of the program to hedge currency exposures on the collateral supporting the off-balance sheet debt issued. For the year ended December 31, 2004, losses on the accounts receivable securitization program include losses of $2.4 million on foreign currency hedge contracts mandated by the accounts receivable securitization program. We believe that the multicurrency commercial paper facility discussed above has enabled us to better naturally hedge the off-balance sheet debt to the underlying collateral supporting such debt and thereby reduce the impact on, and need for, foreign currency hedges as experienced in prior periods under the accounts receivable securitization program.
The HI Credit Facilities require a mandatory prepayment to the extent that the proceeds from the sale of accounts receivable under the accounts receivable securitization program exceed $325 million at any time, except if such excess is attributed to the change in foreign currency rates within a 30-day period. We do not guarantee the medium term notes or commercial paper issued under the program, but we are responsible for dilution adjustments and insuring that the collection policies relating to the receivables are followed. We also indemnify the Receivables Trust if account debtors raise defenses, disputes, offsets or counterclaims, we breach our administrative or other obligations with respect to accounts or any account ceases to be an eligible receivable for purposes of the program. In addition,
41
while we do not anticipate it, if at any time we were unable to sell sufficient receivables into the program to support the volume of commercial paper and medium term notes issued under the program, we would be required to inject cash into the program as collateral. Under such circumstance, and depending on the timing of such circumstance, the requirement to provide cash collateral to the program could have a negative effect on our liquidity.
Financing of Chinese MDI Facilities
In 2003, we entered into two related joint venture agreements to build MDI production facilities near Shanghai, China. Our Unconsolidated Chinese Manufacturing JV,, with BASF AG and three Chinese chemical companies, will build three plants to manufacture MNB, aniline, and crude MDI. We effectively own 35% of the Unconsolidated Chinese Manufacturing JV. Our Consolidated Chinese Splitting JV, with Shanghai Chlor-Alkali Chemical Company, Ltd., will build a plant to manufacture pure MDI, polymeric MDI and MDI variants. We own 70% of the Consolidated Chinese Splitting JV.
On September 19, 2003, the joint ventures obtained secured financing for the construction of the production facilities. The Consolidated Chinese Splitting JV is our consolidated subsidiary, and the details of its financing are described in "—Debt and Liquidity—Other Debt" above. The Unconsolidated Chinese Manufacturing JV is not our consolidated subsidiary. The Unconsolidated Chinese Manufacturing JV obtained various committed loans in the aggregate amount of approximately $224 million in U.S. dollar equivalents. As of December 31, 2004, there were $4.0 million outstanding in U.S. dollar borrowings and 172 million in outstanding RMB ($20.8 million) borrowings under these facilities. The interest rate on these facilities is LIBOR plus 0.48% for U.S. dollar borrowings and 90% of the Peoples Bank of China rate for RMB borrowings. The loans are secured by substantially all the assets of the Unconsolidated Chinese Manufacturing JV and will be paid in 16 semi-annual installments, beginning no later than June 30, 2007. Huntsman Corporation, as successor to Huntsman Holdings, unconditionally guarantees 35% of any amounts due and unpaid by the Unconsolidated Chinese Manufacturing JV under the loans described above (except for a VAT facility of approximately $1.5 million which is not guaranteed). Huntsman Corproation's guarantee remains in effect until the Unconsolidated Chinese Manufacturing JV has commenced production of at least 70% of capacity for at least 30 days and achieved a debt service coverage ratio of at least 1:1.
Contractual Obligations and Commercial Commitments
We have various purchase commitments for materials and supplies entered into in the ordinary course of business. Those commitments extend up to 13 years and the purchase price is generally based on market prices subject to certain minimum price provisions.
As of December 31, 2004, the maturity of our debt is as follows (dollars in millions):
| |
2005 |
2006-2007 |
2008-2009 |
Thereafter |
Total |
||||||||||
|---|---|---|---|---|---|---|---|---|---|---|---|---|---|---|---|
| Long-term debt | $ | 8.9 | $ | 27.5 | $ | 1,366.1 | $ | 1,642.3 | $ | 3,044.8 | |||||
| Capital lease obligations | 1.6 | 3.0 | 3.7 | 1.7 | 10.0 | ||||||||||
| Operating leases | 16.4 | 19.3 | 7.6 | 46.7 | 90.0 | ||||||||||
| Purchase commitments(1) | 1,282.8 | 1,627.9 | 486.5 | 331.9 | 3,729.1 | ||||||||||
| Interest on long-term debt (assuming December 31, 2004 interest rates on variable rate debt) | 231.6 | 460.8 | 391.1 | 243.0 | 1,326.5 | ||||||||||
| Total | $ | 1,541.3 | $ | 2,138.5 | $ | 2,255.0 | $ | 2,265.6 | $ | 8,200.4 | |||||
42
table above are contracts which require minimum volume purchases that extend beyond one year or are renewable annually and have been renewed for 2005. Certain contracts allow for changes in minimum required purchase volumes in the event of a temporary or permanent shutdown of a facility. To the extent the contract requires a minimum notice period, such notice period has been included in the above table. The contractual purchase price for substantially all of these contracts is variable based upon market prices, subject to annual negotiations. We have estimated our contractual obligations by using the terms of our 2004 pricing for each contract. We also have a limited number of contracts which require a minimum payment, even if no volume is purchased. These contracts approximate $143 million in 2005, declining to approximately $17 million after 2009, and are included in the table above. We believe that all of our purchase obligations will be utilized in our normal operations.
| |
2005-2007 |
2008-2009 |
Average Annual Amount for Next Five years |
||||||
|---|---|---|---|---|---|---|---|---|---|
| Pension plans | $ | 189.1 | $ | 137.7 | $ | 355.6 | |||
| Other postretirement obligations | 2.4 | 1.7 | 4.4 | ||||||
| Total | $ | 191.5 | $ | 139.4 | $ | 360.0 | |||
Restructuring and Plant Closing Costs
As of December 31, 2004, accrued restructuring and plant closing costs by type of cost and activity consist of the following (dollars in millions):
| |
Workforce reductions(1) |
Demolition and decommissioning |
Noncancelable lease costs |
Other restructuring costs |
Total(2) |
|||||||||||
|---|---|---|---|---|---|---|---|---|---|---|---|---|---|---|---|---|
| Accrued liabilities as of December 31, 2001 | $ | 31.3 | $ | — | $ | — | $ | — | $ | 31.3 | ||||||
| 2002 charges for 2002 initiatives | — | — | — | 1.6 | 1.6 | |||||||||||
| 2002 payments for 2001 initiatives(3) | (24.2 | ) | — | — | — | (24.2 | ) | |||||||||
| 2002 payments for 2002 initiatives(3) | — | — | — | (1.6 | ) | (1.6 | ) | |||||||||
| Accrued liabilities as of December 31, 2002 | 7.1 | — | — | — | 7.1 | |||||||||||
| 2003 charges for 2003 initiatives | 45.2 | — | — | — | 45.2 | |||||||||||
| 2003 payments for 2001 initiatives(3) | (7.1 | ) | — | — | — | (7.1 | ) | |||||||||
| 2003 payments for 2003 initiatives(3) | (22.7 | ) | — | — | — | (22.7 | ) | |||||||||
| Accrued liabilities as of December 31, 2003 | 22.5 | — | — | — | 22.5 | |||||||||||
| 2004 charges for 2003 initiatives | 24.5 | — | — | 0.4 | 24.9 | |||||||||||
| 2004 charges for 2004 initiatives | 84.9 | 4.8 | 5.1 | 13.4 | 108.2 | |||||||||||
| 2004 payments for 2003 initiatives(3) | (24.8 | ) | — | — | — | (24.8 | ) | |||||||||
| 2004 payments for 2004 initiatives(3) | (27.9 | ) | — | — | — | (27.9 | ) | |||||||||
| Foreign currency effect on reserve balance | 3.7 | — | — | — | 3.7 | |||||||||||
| Accrued liabilities as of December 31, 2004 | $ | 82.9 | $ | 4.8 | $ | 5.1 | $ | 13.8 | $ | 106.6 | ||||||
43
| |
December 31, 2004 |
December 31, 2003 |
December 31, 2002 |
||||||
|---|---|---|---|---|---|---|---|---|---|
| 2001 initiatives | $ | — | $ | — | $ | 7.1 | |||
| 2002 initiatives | — | — | — | ||||||
| 2003 initiatives | 22.6 | 22.5 | — | ||||||
| 2004 initiatives | 80.3 | — | — | ||||||
| Foreign currency effect on reserve balance | 3.7 | — | — | ||||||
| Total | $ | 106.6 | $ | 22.5 | $ | 7.1 | |||
Details with respect to our reserves for restructuring and plant closing costs are provided below by segments and activity (dollars in millions):
| |
Polyurethanes |
Performance Products |
Pigments |
Base Chemicals |
Total |
|||||||||||||
|---|---|---|---|---|---|---|---|---|---|---|---|---|---|---|---|---|---|---|
| Accrued liabilities as of December 31, 2001 | $ | 29.4 | $ | — | $ | 1.9 | $ | — | $ | 31.3 | ||||||||
| 2002 charges for 2002 initiatives | — | 1.6 | — | — | 1.6 | |||||||||||||
| 2002 payments for 2001 initiatives(2) | (22.3 | ) | — | (1.9 | ) | — | (24.2 | ) | ||||||||||
| 2002 payments for 2002 initiatives(2) | — | (1.6 | ) | — | — | (1.6 | ) | |||||||||||
| Accrued liabilities as of December 31, 2002 | 7.1 | — | — | — | 7.1 | |||||||||||||
| 2003 charges for 2003 initiatives | 28.0 | 10.7 | 6.5 | — | 45.2 | |||||||||||||
| 2003 payments for 2001 initiatives(2) | (7.1 | ) | — | — | (7.1 | ) | ||||||||||||
| 2003 payments for 2003 initiatives(2) | (12.2 | ) | (8.3 | ) | (2.2 | ) | — | (22.7 | ) | |||||||||
| Accrued liabilities as of December 31, 2003 | 15.8 | 2.4 | 4.3 | — | 22.5 | |||||||||||||
| 2004 charges for 2003 initiatives | 10.0 | 0.4 | 14.5 | — | 24.9 | |||||||||||||
| 2004 charges for 2004 initiatives(1) | 16.4 | 48.2 | 27.3 | 16.3 | 108.2 | |||||||||||||
| 2004 payments for 2003 initiatives | (11.5 | ) | (2.4 | ) | (10.9 | ) | — | (24.8 | ) | |||||||||
| 2004 payments for 2004 initiatives | (11.8 | ) | — | (14.3 | ) | (1.8 | ) | (27.9 | ) | |||||||||
| Foreign currency effect on reserve balance | 0.1 | 1.9 | 1.1 | 0.6 | 3.7 | |||||||||||||
| Accrued liabilities as of December 31, 2004 | $ | (19.0 | ) | $ | 50.5 | $ | 22.0 | $ | 15.1 | $ | 106.6 | |||||||
Current portion of restructuring reserve |
$ |
19.0 |
$ |
31.5 |
$ |
22.0 |
$ |
15.1 |
$ |
87.6 |
||||||||
| Long-term portion of restructuring reserve | — | 19.0 | — | — | 19.0 | |||||||||||||
Estimated additional future charges for current restructuring projects: |
||||||||||||||||||
| Estimated additional charges within one year | ||||||||||||||||||
| Cash charges | $ | 5.5 | $ | — | $ | 6.0 | $ | 3.5 | $ | 15.0 | ||||||||
| Noncash charges | — | — | — | — | — | |||||||||||||
Estimated additional charges beyond one year |
||||||||||||||||||
| Cash charges | $ | — | $ | — | $ | 4.7 | $ | — | $ | 4.7 | ||||||||
| Noncash charges | — | — | — | — | — | |||||||||||||
44
The following table sets forth the expected effects from our restructuring and plant closing activities in process as of December 31, 2004:
| |
Year Ending December 31, |
|||||||
|---|---|---|---|---|---|---|---|---|
| |
2005 |
2006 |
||||||
| |
(in millions) |
|||||||
| Expected increase (decrease) from restructuring and plant closing activities on: | ||||||||
| Revenues | $ | (22.0 | ) | $ | (43.0 | ) | ||
| Cost of goods sold | (72.0 | ) | (117.0 | ) | ||||
| Gross Profit | 51 | 74 | ||||||
| Selling, general and administrative expenses | — | (8 | ) | |||||
| Operating income | 51 | 82 | ||||||
| Net cash provided by operating activities | (25 | ) | 73 | |||||
2004 Restructuring Activities
As of December 31, 2004 and December 31, 2003, we had reserves for restructuring and plant closing costs of $106.6 million and $22.5 million, respectively. During the year ended December 31, 2004, we, on a consolidated basis, recorded additional charges of $249.5 million, including $116.4 million of charges for asset impairment and write downs, and $133.1 million payable in cash for workforce reductions, demolition and decommissioning and other restructuring costs associated with closure or curtailment of activities at our smaller, less efficient manufacturing facilities. During 2004, we made cash payments against these reserves of $52.7 million. For purposes of measuring impairment charges, the fair value of the assets was determined by using the present value of expected cash flows.
As of December 31, 2003, the Polyurethanes segment reserve consisted of $15.8 million related to the restructuring activities at the Rozenburg, Netherlands site (as announced in 2003), the workforce reductions throughout the Polyurethanes segment (as announced in 2003), and the closure of the Shepton Mallet, U.K. site (as announced in 2002). During the year ended December 31, 2004, the Polyurethanes segment recorded additional restructuring charges of $36.9 million consisting of $26.4 million of charges for restructuring activities payable in cash and $10.5 of asset impairment and made cash payments of $23.3 million. These restructuring activities are expected to result in additional restructuring charges of approximately $5.5 million through 2005 and result in workforce reductions of approximately 160 positions, of which 86 positions have been reduced during the year ended December 31, 2004. As of December 31, 2004, the balance of the Polyurethanes segment reserve totaled $19.0 million.
As of December 31, 2003, our Performance Products segment reserve consisted of $2.4 million relating to the closure of a number of plants at our Whitehaven, U.K. facility, the closure of an administrative office in London, U.K., the rationalization of a surfactants technical center in Oldbury, U.K., and the restructuring of a facility in Barcelona, Spain. During the year ended December 31, 2004, our Performance Products segment recorded additional restructuring charges of $73.0 million consisting of $48.6 million of charges payable in cash and $24.4 million of asset impairment charges. During 2004, we adopted a plan to reduce our workforce across all locations in our European surfactants business by approximately 320 positions over a period of 15 months. This plan included the closure of substantially all of our Whitehaven, U.K. surfactants facility. During the third quarter 2004, we recorded a restructuring charge of $17.5 million, all payable in cash, in respect of workforce reductions across a
45
number of our European facilities. In connection with the further rationalization of our Whitehaven facility, we recognized a restructuring charge of $55.4 million in the fourth quarter of 2004, of which approximately $31.1 million is payable in cash and $24.4 million is impairment of assets. During the year ended December 31, 2004, we made cash payments of $2.4 million related to restructuring activities. These restructuring activities are not expected to result in additional charges. As of December 31, 2004, the balance of our Performance Products segment reserve totaled $50.5 million.
As of December 31, 2003, our Pigments segment reserve consisted of $4.3 million relating to global workforce reductions announced in August 2003. During the year ended December 31, 2004, our Pigments segment recorded additional restructuring charges of $123.3 million and made cash payments of $25.2 million. During 2004, our Pigments segment recorded restructuring expenses of $17.3 million related to global workforce reductions, all of which are payable in cash. In addition, in April 2004, we announced that, following a review of our Pigments business, we would idle approximately 55,000 tonnes, or about 10%, of our total TiO2 production capacity in the third and fourth quarters of 2004. As a result of this decision, we recorded a restructuring charge of $24.5 million to be paid in cash, a $77.2 million asset impairment charge and a $4.3 million charge for the write-off of spare parts inventory and other assets. These combined restructuring activities are expected to result in additional restructuring charges of approximately $10.7 million through 2010 and result in workforce reductions of approximately 600 positions, of which approximately 400 positions have been reduced as of December 31, 2004. During 2004, our Pigments segment made cash payments of $25.2 million related to restructuring activities. As of December 31, 2004, the balance of our Pigments segment reserve totaled $22.0 million.
As of December 31, 2004, the Base Chemicals segment reserve consisted of $15.1 million related to workforce reductions arising from the announced change in work shift schedules and in the engineering and support functions at our Wilton and North Tees, U.K. facilities. During the year ended December 31, 2004, our Base Chemicals segment recorded restructuring charges of $16.3 million, all of which are payable in cash. These restructuring activities are expected to result in additional charges of approximately $3.5 million and in workforce reductions of approximately 100 positions through 2005. As of December 31, 2004, the balance of the Base Chemicals segment reserve totaled $15.1 million.
2003 Restructuring Activities
On March 11, 2003, our Polyurethanes segment announced that it would integrate its global flexible products unit into its urethane specialties unit, and recorded a restructuring charge of $19.2 million for workforce reductions of approximately 118 employees. During the remainder of the year, charges of $8.8 million were taken for workforce reductions relating to this restructuring at the Rozenberg, Netherlands site.
In June 2003, we announced that our Performance Products segment would close a number of plants at our Whitehaven, U.K. facility and recorded a charge of $20.1 million in the second quarter 2003. This charge represents $11.4 million relating to an impairment of assets at Whitehaven (in connection with the plant shutdowns) and $8.7 million of workforce reduction costs. We also recorded a $2.0 million charge in respect of severance costs arising from the closure of an administrative office in London, U.K., the rationalization of our surfactants technical center in Oldbury, U.K., and the restructuring of our facility in Barcelona, Spain. These charges are part of an overall cost reduction program for this segment that is expected to be implemented through 2005.
In August 2003, we recorded a restructuring charge of $6.5 million related to workforce reductions of approximately 63 employees across our global Pigments operations. The overall cost reduction program to be completed through 2005 for the Pigments segment will involve 250 employees and is estimated to cost an additional $16.5 million. At December 31, 2003, $4.3 million remained in the reserve for restructuring and plant closing costs related to these restructuring activities.
46
2002 Restructuring Activities
In 2002, our Pigments segment recorded $3.1 million in asset write-downs related to the closure of our titanium dioxide manufacturing facility in Greatham, U.K..
During 2002, our Performance Products segment recorded $4.6 million in restructuring charges. These charges consist of $1.4 million in asset impairments related to the closure of our Alcover, Spain surfactants plant, $1.6 million in asset impairments at our Castiglione, Italy surfactants plant and $1.6 million in cash charges for other exit costs.
Capital Expenditures
Estimates for 2005
During 2005, we expect to spend approximately $265 million on capital projects, including capital expenditures on our LDPE facility at Wilton, U.K., plus an additional $57 million in capital expenditures associated with our Consolidated Chinese Splitting JV. During 2005, we expect to invest, as equity, approximately $14 million in the Unconsolidated Chinese Manufacturing JV. In addition, during 2005, we expect to invest approximately $8 million in the Consolidated Chinese Splitting JV, which expects to have capital expenditures of approximately $57 million. The remaining funding of the Consolidated Chinese Splitting JV's capital expenditures will be financed through equity investments by the other joint venture partners and loans from local Chinese lenders. We expect that our total equity investment in the Chinese joint ventures will be approximately $85 million, of which approximately $42 million will be in the Unconsolidated Chinese Manufacturing JV and approximately $43 million in the Consolidated Chinese Splitting JV. We expect that the total project capital expenditures by the Consolidated Chinese Splitting JV will be approximately $125 million, of which approximately $43 million will be funded from our equity investment and the remainder from equity investments by joint venture partners and loans from local Chinese lenders. We expect completion of our spending on the Chinese joint ventures in 2006.
We believe that the cost position of our Wilton, U.K. olefins facility uniquely positions it to be the site of a polyethylene production facility. While we export approximately one-third of our ethylene production each year to continental Europe, incurring significant shipping and handling costs, the U.K. annually imports approximately 1.9 billion pounds of polyethylene. We believe this provides an opportunity to capitalize on the low-cost operating environment and extensive petrochemical infrastructure and logistics at Wilton, as supported by a feasibility study that was conducted with respect to the construction of a world-scale LDPE facility at our Wilton site. The LDPE facility will have the capacity to produce approximately 900 million pounds of LDPE annually and is estimated to cost $300 million to construct net of any grant proceeds obtained. We have been awarded a grant of £16.5 million (approximately $30 million) from the U.K. Government's Department of Trade and Industry to finance a portion of the construction of the LDPE facility. We expect construction of the LDPE facility to be complete in late 2007. During 2005, we expect to spend approximately $80 million in capital expenditures associated with the LDPE facility at Wilton, U.K.
We expect to finance our capital expenditure commitments through a combination of our financing arrangements and cash flow from operations.
Year Ended December 31, 2004
Capital expenditures for the year ended December 31, 2004 were $141.3 million compared to $127.4 million for the same period in 2003. This increase is due in part to increased capital expenditures and investments in our Chinese joint ventures. In 2004, we spent $11.8 million to fund the Unconsolidated Chinese Manufacturing JV as an investment in unconsolidated affiliates. In 2004, we also invested $12.5 million in the Consolidated Chinese Splitting JV, which had $23.4 million in total
47
capital expenditures. The remaining funding for the Consolidated Chinese Splitting JV's capital expenditures was financed through equity investments by the other joint venture partners and loans from local Chinese lenders.
In connection with our agreements with our Rubicon and Louisiana Pigment joint ventures, we are obligated to fund our proportionate share of capital expenditures. During the year ended December 31, 2004 and 2003, we invested $1.8 million and $2.2 million, respectively, in Rubicon. With respect to Louisiana Pigment, during the years ended December 31, 2004 and 2003, we received $9.1 million and $2.1 million, respectively.
Environmental, Health and Safety Matters
For a discussion of environmental health and safety matters, please see "Item 1—Business—Environmental, Health and Safety Matters" above.
Recently Issued Financial Accounting Standards
In January 2003, the Financial Accounting Standards Board ("FASB") issued Financial Interpretation No. ("FIN") 46, "Consolidation of Variable Interest Entities." FIN 46 addresses the requirements for business enterprises to consolidate related entities, for which they do not have controlling interests through voting or other rights, if they are determined to be the primary beneficiary as a result of variable economic interests. Transfers to a qualifying special purpose entity are not subject to this interpretation. In December 2003, the FASB issued a complete replacement of FIN 46 (FIN 46R), to clarify certain complexities. We adopted this standard on January 1, 2005. The impact of FIN 46R on our financial statements will not be significant.
In May 2003, the FASB issued Statement of Financial Accounting Standards ("SFAS") No. 150, "Accounting for Certain Financial Instruments with Characteristics of Both Liabilities and Equity." SFAS No. 150 establishes standards for classifying and measuring as liabilities certain financial instruments that embody obligations of the issuer and have characteristics of both liabilities and equity. SFAS No. 150 is effective for all financial instruments created or modified after May 31, 2003 and otherwise is effective at the beginning of the first interim period beginning after June 15, 2003. The adoption of SFAS No. 150 did not have a material impact on our consolidated financial statements.
In November 2004, the FASB issued SFAS No. 151, "Inventory Costs—an amendment of ARB No. 43." SFAS No. 151 requires abnormal amounts of idle facility expense, freight, handling costs, and wasted material to be recognized as current-period charges. It also requires that allocation of fixed production overheads to the costs of conversion be based on the normal capacity of the production facilities. The requirements of the standard will be effective for inventory costs incurred during fiscal years beginning after June 15, 2005. We are reviewing SFAS No. 151 to determine the statement's impact on our consolidated financial statements.
In December 2004, the FASB issued SFAS No. 153, "Exchanges of Nonmonetary Assets—an amendment of APB Opinion No. 29." SFAS No. 153 addresses the measurement of exchanges of nonmonetary assets and eliminates the exception from fair value measurement for nonmonetary exchanges of similar productive assets in APB Opinion No. 29 and replaces it with an exception for exchanges that do not have commercial substance. SFAS No. 153 specifies that a nonmonetary exchange has commercial substance if the future cash flows of the entity are expected to change significantly as a result of the exchange. The provisions of this standard are effective for nonmonetary exchanges occurring in fiscal periods beginning after June 15, 2005. We will apply this standard prospectively.
In December 2004, the FASB issued SFAS No. 123R, "Share Based Payment." SFAS No. 123R requires entities to measure the cost of employee services received in exchange for an award of equity
48
instruments based on the grant-date fair value of the award. That cost will be recognized over the period during which the employee is required to provide services in exchange for the award. This standard eliminates the alternative to use the intrinsic value method of accounting for share based payments as previously provided in APB Opinion No. 25, "Accounting for Stock Issued to Employees." This standard is effective for us beginning in January 2006. We are reviewing SFAS No. 123R to determine the statement's impact on our consolidated financial statements.
The preparation of financial statements and related disclosures in conformity with accounting principles generally accepted in the United States of America requires management to make judgments, estimates and assumptions that affect the reported amounts in the consolidated financial statements. Our significant accounting policies are summarized in "Note 2—Summary of Significant Accounting Policies" to our consolidated financial statements. Summarized below are our critical accounting policies:
Revenue Recognition
We generate substantially all of our revenues through sales in the open market and long-term supply agreements. We recognize revenue when it is realized or realizable and earned. Revenue for product sales is recognized when a sales arrangement exists, risk and title to the product transfer to the customer, collectibility is reasonably assured and pricing is fixed or determinable. This occurs at the time shipment is made.
Long-Lived Assets
The determination of useful lives of our property, plant and equipment is considered a critical accounting estimate. Such lives are estimated based upon our historical experience, engineering estimates and industry information and are reviewed when economic events indicate that we may not be able to recover the carrying value of the assets. The estimated lives of our property range from 3 to 30 years and depreciation is recorded on the straight-line method. Inherent in our estimates of useful lives is the assumption that periodic maintenance and an appropriate level of annual capital expenditures will be performed. Without on-going capital improvements and maintenance, the productivity and cost efficiency of our assets would decline and the useful lives of our assets would be shorter.
Management uses judgment to estimate the useful lives of our long-lived assets. If the useful life of our property, plant and equipment as of December 31, 2004 were to have been estimated to be one year greater or one year less, then depreciation expense for the twelve month period ending December 31, 2004 would have been approximately $17 million less or approximately $20 million greater, respectively.
We are required to evaluate our plant assets whenever events indicate that the carrying value may not be recoverable in the future or when management's plans change regarding those assets, such as idling or closing a plant. We evaluate impairment by comparing undiscounted cash flows of the related property to the carrying value. Key assumptions in determining the future cash flows include the useful life, technology, competitive pressures, raw material pricing and regulations.
Restructuring and Plant Closing Costs
We have recorded restructuring charges in recent periods in connection with closing certain plant locations, work force reductions and other cost savings programs. These charges are recorded when management has committed to a plan and incurred a liability related to the plan. Estimates for plant closing include the write-off of the carrying value of the plant, any necessary environmental and/or
49
regulatory costs, contract termination and demolition costs. Estimates for work force reductions and other costs savings are recorded based upon estimates of the number of positions to be terminated, termination benefits to be provided and other information as necessary. While management evaluates the estimates on a quarterly basis and will adjust the reserve when information indicates that the estimate is above or below the initial estimate, management's estimates on a project-by-project basis have not varied to a material degree. See "Note 10—Restructuring and Plant Closing Costs" to our consolidated financial statements included elsewhere in this report for further discussion of our restructuring activities.
Income Taxes
Deferred income taxes are provided for temporary differences between financial statement income and taxable income using the asset and liability approach. We have significant NOLs in various non-U.S. jurisdictions. While the majority of the NOLs have no expiration date, certain NOLs have a limited life and begin to expire in 2006. We record valuation allowances based upon our evaluation of positive and negative evidence regarding the realization of such deferred tax assets. Such evaluations require us to consider future taxable income in the related jurisdictions. Significant judgment is required due to the nature of our operations and the complexity of the numerous tax jurisdictions in which we operate.
Employee Benefit Programs
We sponsor various contributory and non-contributory defined benefit plans covering employees in the U.S., U.K., Netherlands, Belgium, Canada and a number of other countries. We fund the material plans through trust arrangements (or local equivalents) where the assets are held separately from the employer. We also sponsor unfunded post-retirement plans which provide medical and life insurance benefits covering certain employees in the U.S. and Canada. Amounts recorded in the consolidated financial statements are recorded based upon actuarial valuations performed by various independent actuaries. Inherent in these valuations are numerous assumptions regarding expected return on assets, discount rates, compensation increases, mortality rates and health care costs trends. These assumptions are disclosed in the notes to the consolidated financial statements.
During 2004, we revised our expected return on plan assets and rate of compensation increases for our defined benefit plans to 7.26% from 7.29% and to 3.90% from 3.76% respectively, and the discount rate on our defined benefit plans to 5.03% from 5.51%, respectively, as a result of current economic conditions based upon discussions with our actuaries, the historical long-term returns of our pension assets, recent market information related to interest rates and equity performance.
50
Management, with the advice of its actuaries, uses judgment to make assumptions on which our employee benefit plan liabilities and expenses are based. The effect of a 1% change in three key assumptions is summarized as follows (dollars in millions):
| Assumption |
Income Statement Impact(1) |
Balance Sheet Impact(2) |
||||||
|---|---|---|---|---|---|---|---|---|
| Discount rate | ||||||||
| —1% increase | $ | (20.6 | ) | $ | (86.6 | ) | ||
| —1% decrease | 25.7 | 165.9 | ||||||
| Expected return on assets | ||||||||
| —1% increase | (11.6 | ) | — | |||||
| —1% decrease | 11.6 | — | ||||||
| Rate of compensation increase | ||||||||
| —1% increase | 19.6 | — | ||||||
| —1% decrease | (13.5 | ) | — | |||||
Environmental Reserves
Environmental remediation costs for our facilities are accrued when it is probable that a liability has been incurred and the amount can be reasonably estimated. Estimates of environmental reserves require evaluating government regulation, available technology, site-specific information and remediation alternatives. We accrue an amount equal to our best estimate of the costs to remediate based upon the available information. Adjustments to our estimates are made periodically based upon additional information received as remediation progresses. For further information see "Item 1—Business—Environmental, Health and Safety Matters" and "Note 22—Environmental, Health and Safety Matters" to the consolidated financial statements.
Cautionary Statement for Forward-Looking Information
Certain information set forth in this report contains "forward-looking statements" within the meaning of the federal securities laws. Forward-looking statements include statements concerning our plans, objectives, goals, strategies, future events, future revenues or performance, capital expenditures, financing needs, plans or intentions relating to acquisitions and other information that is not historical information. In some cases, forward-looking statements can be identified by terminology such as "believes," "expects," "may," "will," "should," "anticipates," or "intends" or the negative of such terms or other comparable terminology, or by discussions of strategy. We may also make additional forward-looking statements from time to time. All such subsequent forward-looking statements, whether written or oral, by us or on our behalf, are also expressly qualified by these cautionary statements.
All forward-looking statements, including without limitation, management's examination of historical operating trends, are based upon our current expectations and various assumptions. Our expectations, beliefs and projections are expressed in good faith and we believe there is a reasonable basis for them, but, there can be no assurance that management's expectations, beliefs and projections will result or be achieved. All forward-looking statements apply only as of the date made. We undertake no obligation to publicly update or revise forward-looking statements which may be made to reflect events or circumstances after the date made or to reflect the occurrence of unanticipated events.
There are a number of risks and uncertainties that could cause our actual results to differ materially from the forward-looking statements contained in or contemplated by this report. The following are among the factors that could cause actual results to differ materially from the forward-
51
looking statements. There may be other factors, including those discussed elsewhere in this report, that may cause our actual results to differ materially from the forward-looking statements. Any forward-looking statements should be considered in light of all such factors including the factors set forth below:
52
ITEM 7A. QUANTITATIVE AND QUALITATIVE DISCLOSURES ABOUT MARKET RISK
We are exposed to market risk, including changes in currency exchange rates, interest rates and certain commodity prices. To manage the volatility relating to these exposures, from time to time, we enter into various derivative transactions. We hold and issue derivative financial instruments for economic hedging purposes only.
Currency Exchange Rates
Our cash flows and earnings are subject to fluctuations due to exchange rate variation. Our sales prices are typically denominated in euros or U.S. dollars. From time to time, we may enter into foreign currency derivative instruments to minimize the short-term impact of movements in foreign currency rates. Short-term exposures to changing foreign currency exchange rates at certain foreign subsidiaries are generally netted where practicable with exposures of other subsidiaries and the remaining exposures then, from time to time, may be managed through financial market transactions, principally through the purchase of spot or forward foreign exchange contracts (with maturities of nine months or less) with various financial institutions, to reflect the currency denomination of our cash flows. We do not hedge our currency exposures in a manner that would entirely eliminate the effect of changes in exchange rates on our cash flows and earnings. Our hedging activity from time to time comprises selling forward surpluses of non-dollar receivables for U.S. dollars. In addition, our accounts receivable securitization program requires in certain circumstances that we enter into certain forward foreign currency hedges intended to hedge currency exposures on the collateral supporting the off-balance sheet debt issued in the program. As of December 31, 2004, our outstanding forward foreign exchange contracts were not considered material.
On December 10, 2004, we entered into a cross currency swap of fixed rate debt with several financial institutions in order to more effectively hedge our overall underlying euro long-term net asset and euro cash flow exposures. In this transaction, we agreed to swap $175 million of 7.375% fixed rate debt for €132.4 million of 6.63% fixed rate debt. As a result, we will pay fixed rate interest at an annual rate of 6.63% on €132.4 million of principal and will receive fixed rate interest at an annual rate of 7.375% on $175 million of principal through January 1, 2010. At maturity on January 1, 2010, we are required to pay principal of €132.4 million and will receive principal of $175 million. Interest installments are paid semi-annually on January 1 and July 1 of each year beginning July 1, 2005 through maturity. The swap will receive effective treatment as a net investment hedge under GAAP.
We finance certain of our non-U.S. subsidiaries with intercompany loans. In some cases, these loans are denominated in currencies other than the subsidiaries' functional currency. Foreign currency transaction gains and losses on intercompany loans that are expected to be repaid in the foreseeable future are recorded in earnings. Foreign currency transaction gains and losses on intercompany loans that are not expected to be repaid in the foreseeable future ("Permanent Loans") are recorded in other comprehensive income. As a result of our review of certain of our intercompany loans in the first quarter of 2005, we have increased the amount of our Permanent Loans. We expect that this will result in less foreign currency transaction gains and losses reflected in earnings.
Interest Rates
As of December 31, 2004, the estimated fair value of our consolidated debt was approximately $3,111.2 million, and the weighted average interest rate of our combined borrowings was approximately 7.4%. As of December 31, 2004, we had combined outstanding variable rate borrowings of approximately $1.4 billion. The weighted average interest rate of these borrowings was approximately 5.0%. Assuming a 1.0% increase in interest rates, the effect on the annual interest expense would be an increase of approximately $14 million.
53
Commodity Prices
Our exposure to changing commodity prices is somewhat limited since the majority of our raw materials are acquired at posted or market related prices, and sales prices for finished products are generally at market related prices which are largely set on a monthly or quarterly basis in line with industry practice. In order to reduce overall raw material cost volatility, from time to time we enter into various commodity contracts to hedge our purchase of commodity products. We do not hedge our commodity exposure in a manner that would eliminate the effects of changes in commodity prices on our cash flows and earnings. At December 31, 2004, we had forward purchase and sale contracts for 66,000 tonnes of naphtha and 124,000 tonnes of other hydrocarbons, which do not qualify for hedge accounting. Assuming a 10% increase or a 10% decrease in the price per tonne of naphtha, the impact on the forward purchase contracts would result in losses or gains of approximately $2.2 million, respectively.
ITEM 8. FINANCIAL STATEMENTS AND SUPPLEMENTARY DATA
Our Consolidated Financial Statements required by this item are included on the pages immediately following the Index to Consolidated Financial Statements appearing on page F-1.
ITEM 9. CHANGES IN AND DISAGREEMENTS WITH ACCOUNTANTS ON ACCOUNTING AND FINANCIAL DISCLOSURE
There have been no changes in our independent accountants, Deloitte & Touche LLP, or disagreements with them on matters of accounting or financial disclosure.
ITEM 9A. CONTROLS AND PROCEDURES
In connection with the audit of the financial statements of our parent and its subsidiaries (the "Huntsman Companies" or "Group") for the year ended December 31, 2003, the Group's independent registered public accounting firm, or auditors, identified several matters that they deemed to be "material weaknesses" in the Group's internal controls as defined in standards established by the American Institute of Certified Public Accountants. The auditors noted that these material weaknesses had led to restatements of the financial statements of certain of the Huntsman Companies, including us, in recent periods.
The principal material weakness identified by the auditors was that the Group's controllership function did not have an adequate formal process in place to gather the data required to prepare the financial statements and disclosures required for the numerous financial reporting requirements of the Huntsman Companies. Specifically, the auditors noted that there was not a detailed review of the data supporting the disclosures in the Group's financial statements by a senior member of the Group's controllership function, that supporting documentation for certain disclosures was very limited, that the processes used to aggregate the information varied by company, without a standard, comprehensive package of supporting disclosure, and that information delivered to senior management and the audit committee was not timely and was often incomplete.
In addition, the auditors noted that we had made a data entry error during the transition of our PO business to the SAP enterprise resource planning system in April 2003. This error, which was not detected until February 2004, led to the restatement of our third quarter 2003 financial statements, resulting in a $12.3 million increase in our net loss for the three months ended September 30, 2003. The auditors also noted that during 2003, loss on sale of accounts receivable related to our receivables securitization program was reported incorrectly due to a failure to properly understand certain aspects of the securitization program and a lack of oversight in the accounting for the program. This error led to the restatement of our financial statements for the first three quarters of 2003, resulting in a $17.9 million decrease in our net loss for the three months ended March 31, 2003, a $12.3 million
54
decrease in our net loss for the three months ended June 30, 2003 and a $6.4 million decrease in our net loss for the three months ended September 30, 2003.
On October 12, 2004, we announced that we had determined to reclassify certain amounts in our consolidated statements of cash flows caused by an error in the automated process by which we determined the effect and classification of foreign exchange rates on our statement of cash flows. This error led to a restatement of our financial statements for the years ended December 31, 2003, 2002 and 2001. These reclassifications had no impact on our consolidated statements of operations or balance sheets.
In connection with the audit of the Group's financial statements for the nine months ended September 30, 2004, the auditors advised our parent of various matters involving internal controls, relating to the closing of books and records, that they considered to be a "reportable condition." The auditors advised our parent that they believed this condition contributed to a number of misstatements in the Group's financial statements that individually and in the aggregate were not material. Although the auditors advised our parent of this reportable condition, they did not judge it to be a material weakness in connection with the audit of the Group's financial statements for the nine months ended September 30, 2004. In conducting such audit the auditors did not undertake to audit the Group's internal controls, and thus we cannot give any assurance that they would not note additional material weaknesses or reiterate the material weaknesses described above had they done so.
The Huntsman Companies entered into a number of significant transactions in 2003 which significantly increased their financial reporting obligations. To improve the Group's financial accounting organization and processes, our parent appointed a new independent director as the chairman of the audit committee in December 2003. In addition, since the beginning of 2004, the Huntsman Companies have replaced their Controller and have added 13 new positions in the areas of finance, treasury, internal controls and internal audit, including a Director of Financial Reporting and a Director of Internal Controls. The Group intends to add two more positions in internal audit before the end of the first quarter of 2005. The Group has also adopted and implemented additional policies and procedures to strengthen its financial reporting system.
Our management, with the participation of our chief executive officer and chief financial officer, has evaluated the effectiveness of our disclosure controls and procedures (as defined in Rules 13a-15(e) and 15d-15(e) under the Securities Exchange Act of 1934 (the "Exchange Act")) as of December 31, 2004. In undertaking this evaluation, our management has considered the matters identified by the auditors. Based on this evaluation, our chief executive officer and chief financial officer have concluded that, as of December 31, 2004, our disclosure controls and procedures were (1) designed to ensure that material information relating to our Company, including our consolidated subsidiaries, is made known to the chief executive officer and chief financial officer by others within those entities, particularly during the period in which this report was being prepared, and (2) effective, in that they provide reasonable assurance that information required to be disclosed by our Company in the reports that we file or submit under the Exchange Act are recorded, processed, summarized and reported within the time periods specified in the applicable rules and forms.
Other than as specified above, no change in our internal control over financial reporting occurred during the three months ended December 31, 2004 that has materially affected, or is reasonably likely to materially affect, our internal control over financial reporting (as defined in Rules 13a-15(f) and 15d-15(f) under the Exchange Act).
None.
55
ITEM 10. DIRECTORS AND EXECUTIVE OFFICERS OF THE REGISTRANT
Omitted pursuant to General Instruction I of Form 10-K.
ITEM 11. EXECUTIVE COMPENSATION
Omitted pursuant to General Instruction I of Form 10-K.
ITEM 12. SECURITY OWNERSHIP OF CERTAIN BENEFICIAL OWNERS AND MANAGEMENT AND RELATED STOCKHOLDER MATTERS
Omitted pursuant to General Instruction I of Form 10-K.
ITEM 13. CERTAIN RELATIONSHIPS AND RELATED TRANSACTIONS
Omitted pursuant to General Instruction I of Form 10-K.
ITEM 14. PRINCIPAL ACCOUNTANT FEES AND SERVICES
Fees billed to our Company by Deloitte & Touche LLP, the member firms of Deloitte Touche Tohmatsu, and their respective affiliates (collectively, "Deloitte & Touche") for the years specified below were as follows (dollars in millions):
| Year |
Audit |
Audit Related |
Tax |
Other |
||||||||
|---|---|---|---|---|---|---|---|---|---|---|---|---|
| 2004(1) | $ | 3.4 | $ | 0.3 | $ | 1.5 | $ | — | ||||
| 2003 | 3.0 | 0.7 | 1.0 | 0.1 | ||||||||
Pre-approval Policy
Our Audit Committee has, by resolution, adopted policies and procedures regarding the pre-approval of the performance by Deloitte & Touche of certain audit and non-audit services. Deloitte & Touche may not perform any service enumerated in Section 201(a) of the Sarbanes-Oxley Act of 2002, except as may otherwise be provided by law or regulation. Deloitte & Touche may not perform any service unless approval of the Audit Committee is obtained prior to the performance of the services, except as may otherwise be provided by law or regulation. The Audit Committee has pre-approved, by category, the performance by Deloitte & Touche of certain audit and accounting services, certain tax services, and, provided that fees do not exceed $250,000 per individual project, certain other tax services and audit-related services. The Audit Committee has delegated to the committee chairperson the power to pre-approve services beyond those previously described, provided that no services may be approved that are prohibited pursuant to Section 201(a) of the Sarbanes-Oxley Act of 2002 or that appear reasonably likely to compromise the independence of Deloitte & Touche. Any pre-approval granted by the chairperson will be reviewed by the Audit Committee at its next regularly scheduled meeting. In addition, the Audit Committee will receive an annual report detailing the prior year's expenditures consistent with the SEC fee disclosure requirements.
56
ITEM 15. EXHIBITS AND FINANCIAL STATEMENT SCHEDULES
See Index to Consolidated Financial Statements on page F-1.
See Index to Consolidated Financial Statements on page F-1.
The exhibits to this report are listed on the Exhibit Index below.
| Number |
Description of Exhibits |
|
|---|---|---|
| 3.1 | Certificate of Formation of Huntsman International LLC (incorporated by reference to Exhibit 3.1 to our registration statement on Form S-4 (File No. 333-85141)) | |
3.2 |
Second Amended and Restated Limited Liability Company Agreement of Huntsman International LLC dated December 20, 2001 (incorporated by reference to Exhibit 3.2 to amendment no. 1 to our annual report on Form 10-K/A for the year ended December 31, 2001) |
|
3.3 |
Certificate of Formation of Huntsman International Financial LLC (incorporated by reference to Exhibit 3.3 to our registration statement on Form S-4 (File No. 333-85141)) |
|
3.4 |
Limited Liability Company Agreement of Huntsman International Financial LLC dated June 18, 1999, as amended by the First Amendment dated June 19, 1999 (incorporated by reference to Exhibit 3.4 to our registration statement on Form S-4 (File No. 333-85141)) |
|
3.5 |
Memorandum of Association of Tioxide Group (incorporated by reference to Exhibit 3.5 to our registration statement on Form S-4 (File No. 333-85141)) |
|
3.6 |
Articles of Association of Tioxide Group (incorporated by reference to Exhibit 3.6 to our registration statement on Form S-4 (File No. 333-85141)) |
|
3.7 |
Memorandum of Association of Tioxide Americas Inc. (incorporated by reference to Exhibit 3.7 to our registration statement on Form S-4 (File No. 333-85141)) |
|
3.8 |
Articles of Association of Tioxide Americas Inc. (incorporated by reference to Exhibit 3.8 to our registration statement on Form S-4 (File No. 333-85141)) |
|
3.9 |
Certificate of Amendment to Certificate of Formation of Huntsman International LLC (incorporated by reference to Exhibit 3.9 to our annual report on Form 10-K for the year ended December 31, 2000) |
|
3.10 |
Certificate of Amendment to Certificate of Formation of Huntsman International Financial LLC (incorporated by reference to Exhibit 3.10 to our annual report on Form 10-K for the year ended December 31, 2000) |
|
3.11 |
Certificate of Formation of Huntsman Propylene Oxide Holdings LLC (incorporated by reference to Exhibit 3.7 to our registration statement on Form S-4 (File No. 333-58578)) |
|
57
3.12 |
Limited Liability Company Agreement of Huntsman Propylene Oxide Holdings LLC dated July 12, 2000 (incorporated by reference to Exhibit 3.8 to our registration statement on Form S-4 (File No. 333-58578)) |
|
3.13 |
Certificate of Formation of Huntsman EA Holdings LLC (incorporated by reference to Exhibit 3.9 to our registration statement on Form S-4 (File No. 333-58578)) |
|
3.14 |
Limited Liability Company Agreement of Huntsman EA Holdings LLC dated December 22, 2000 (incorporated by reference to Exhibit 3.10 to our registration statement on Form S-4 (File No. 333-58578)) |
|
3.15 |
Certificate of Formation of Huntsman Texas Holdings LLC (incorporated by reference to Exhibit 3.11 to our registration statement on Form S-4 (File No. 333-58578)) |
|
3.16 |
Limited Liability Company Agreement of Huntsman Texas Holdings LLC dated July 12, 2000 (incorporated by reference to Exhibit 3.12 to our registration statement on Form S-4 (File No. 333-58578)) |
|
3.17 |
Certificate of Formation of Eurofuels LLC (incorporated by reference to Exhibit 3.13 to our registration statement on Form S-4 (File No. 333-58578)) |
|
3.18 |
Limited Liability Company Agreement of Eurofuels LLC dated July 12, 2000 (incorporated by reference to Exhibit 3.14 to our registration statement on Form S-4 (File No. 333-58578)) |
|
3.19 |
Certificate of Formation of Eurostar Industries LLC (incorporated by reference to Exhibit 3.15 to our registration statement on Form S-4 (File No. 333-58578)) |
|
3.20 |
Limited Liability Company Agreement of Eurostar Industries LLC dated July 12, 2000 (incorporated by reference to Exhibit 3.16 to our registration statement on Form S-4 (File No. 333-58578)) |
|
3.21 |
Certificate of Limited Partnership of Huntsman Ethyleneamines Ltd. (incorporated by reference to Exhibit 3.17 to our registration statement on Form S-4 (File No. 333-58578)) |
|
3.22 |
Articles of Limited Partnership of Huntsman Ethyleneamines Ltd. dated January 5, 2001 (incorporated by reference to Exhibit 3.18 to our registration statement on Form S-4 (File No. 333-58578)) |
|
3.23 |
Certificate of Limited Partnership of Huntsman Propylene Oxide Ltd. (incorporated by reference to Exhibit 3.19 to our registration statement on Form S-4 (File No. 333-58578)) |
|
3.24 |
First Amended and Restated Articles of Limited Partnership of Huntsman Propylene Oxide Ltd. dated October 1, 2000 (incorporated by reference to Exhibit 3.20 to our registration statement on Form S-4 (File No. 333-58578)) |
|
3.25 |
Certificate of Limited Partnership of Huntsman International Fuels, L.P. (incorporated by reference to Exhibit 3.21 to our registration statement on Form S-4 (File No. 333-58578)) |
|
3.26 |
Certificate of First Amendment to Certificate of Limited Partnership of Huntsman International Fuels, L.P. (incorporated by reference to Exhibit 3.22 to our registration statement on Form S-4 (File No. 333-58578)) |
|
3.27 |
First Amended and Restated Articles of Limited Partnership of Huntsman International Fuels, L.P. dated October 1, 2000 (incorporated by reference to Exhibit 3.23 to our registration statement on Form S-4 (File No. 333-58578)) |
|
58
4.1 |
Indenture, dated as of June 30, 1999, among Huntsman International LLC (f/k/a Huntsman ICI Chemicals LLC), the Guarantors party thereto and Bank One, N.A., as Trustee, relating to the 101/8% Senior Subordinated Notes due 2009 (incorporated by reference to Exhibit 4.1 to our registration statement on Form S-4 (File No. 333-85141)) |
|
4.2 |
Form of 101/8% Senior Subordinated Note due 2009 denominated in dollars (included as Exhibit A-3 to Exhibit 4.1) |
|
4.3 |
Form of 101/8% Senior Subordinated Note due 2009 denominated in euros (included as Exhibit A-4 to Exhibit 4.1) |
|
4.4 |
Form of Guarantee relating to the 101/8% Senior Subordinated Notes due 2009 (included as Exhibit E of Exhibit 4.1) |
|
4.5 |
First Amendment, dated January 5, 2000, to Indenture, dated as of June 30, 1999, among Huntsman International LLC (f/k/a Huntsman ICI Chemicals LLC), as Issuer, each of the Guarantors named therein and Bank One, N.A., as Trustee (incorporated by reference to Exhibit 4.6 to our registration statement on Form S-4 (File No. 333-85141)) |
|
4.6 |
Indenture, dated as of March 13, 2001, among Huntsman International LLC, as Issuer, the Guarantors named therein and The Bank of New York, as Trustee, relating to 101/8% Senior Subordinated Notes due 2009 (incorporated by reference to Exhibit 4.6 to amendment no. 1 to our annual report on Form 10-K/A for the year ended December 31, 2001) |
|
4.7 |
Form of 101/8% Senior Subordinated Note due 2009 denominated in dollars (included as Exhibit A-3 to Exhibit 4.6) |
|
4.8 |
Form of 101/8% Senior Subordinated Note due 2009 denominated in euros (included as Exhibit A-4 to Exhibit 4.6) |
|
4.9 |
Form of Guarantee relating to the 101/8% Senior Subordinated Notes due 2009 (included as Exhibit E of Exhibit 4.6) |
|
4.10 |
First Supplemental Indenture, dated as of January 11, 2002, among Huntsman International LLC, as Issuer, the Guarantors named therein and The Bank of New York, as Trustee, relating to 101/8% Senior Subordinated Notes due 2009 (incorporated by reference to Exhibit 4.7 to amendment no. 1 to our annual report on Form 10-K/A for the year ended December 31, 2001) |
|
4.11 |
Indenture, dated as of March 21, 2002, among Huntsman International LLC, as Issuer, the Guarantors named therein and Wells Fargo Bank Minnesota, National Association, as Trustee, relating to the 97/8% Senior Notes due 2009 (incorporated by reference to Exhibit 4.8 to amendment no. 1 to our annual report on Form 10-K/A for the year ended December 31, 2001) |
|
4.12 |
Form of 97/8% Senior Note due 2009 denominated in dollars (included as Exhibit A-3 to Exhibit 4.11) |
|
4.13 |
Form of 97/8% Senior Note due 2009 denominated in euros (included as Exhibit A-4 to Exhibit 4.11) |
|
4.14 |
Form of Guarantee relating to the 97/8% Senior Notes due 2009 (included as Exhibit E of Exhibit 4.11) |
|
59
4.15 |
Amended and Restated Guarantee, dated as of April 11, 2003, among the Guarantors named therein and Wells Fargo Bank Minnesota, National Association, as Trustee, relating to the 97/8% Senior Notes due 2009 (incorporated by reference to Exhibit 4.15 to our registration statement on Form S-4 (File No. 333-106482)) |
|
4.16 |
Exchange and Registration Rights Agreement, dated as of March 21, 2002, among Huntsman International LLC, the Guarantors as defined therein, and the Purchasers as defined therein, relating to the 97/8% Senior Notes due 2009 (incorporated by reference to Exhibit 4.9 to amendment no. 1 to our annual report on Form 10-K/A for the year ended December 31, 2001) |
|
4.17 |
Exchange and Registration Rights Agreement, dated as of April 11, 2003, among Huntsman International LLC, the Guarantors, as defined therein, and the Purchasers as defined therein, relating to the 97/8% Senior Notes due 2009 (incorporated by reference to Exhibit 4.17 to our registration statement on Form S-4 (File No. 333-106482)) |
|
4.18 |
Indenture, dated as of December 17, 2004, among Huntsman International LLC, as Issuer, the Guarantors named therein and Wells Fargo Bank, National Association, as Trustee, relating to 73/8% Senior Subordinated Notes due 2015 and 71/2% Senior Subordinated Notes due 2015 (incorporated by reference to Exhibit 4.1 to our current report on Form 8-K dated December 17, 2004 (File No. 333-85141)) |
|
4.19 |
Form of 73/8% Senior Subordinated Notes due 2015 denominated in dollars (included as Exhibit A-1 to Exhibit 4.18) |
|
4.20 |
Form of 71/2% Senior Subordinated Notes due 2015 denominated in euros (included as Exhibit A-2 to Exhibit 4.18) |
|
4.21 |
Form of Guarantee (included as Exhibit E to Exhibit 4.18) |
|
4.22 |
Exchange and Registration Rights Agreement, dated as of December 17, 2004, among Huntsman International LLC, the Guarantors as defined therein, and the Purchasers as defined therein, relating to the 73/8% Senior Subordinated Notes due 2015 and the 71/2% Senior Subordinated Notes due 2015 (incorporated by reference to Exhibit 4.2 to our current report on Form 8-K dated December 17, 2004 (File No. 333-85141)) |
|
10.1 |
Contribution Agreement, dated as of April 15, 1999, by and among Imperial Chemical Industries PLC, Huntsman Specialty Chemicals Corporation, Huntsman International Holdings LLC (f/k/a Huntsman ICI Holdings LLC) and Huntsman International LLC (f/k/a Huntsman ICI Chemicals LLC) as amended by the first Amending Agreement, dated June 4, 1999, the second Amending Agreement, dated June 30, 1999, and the third Amending Agreement, dated June 30, 1999 (incorporated by reference to Exhibit 10.1 to our registration statement on Form S-4 (File No. 333-85141)) |
|
10.2 |
Purchase and Sale Agreement (PO/MTBE Business), dated March 21, 1997, among Texaco, Texaco Chemical Inc. and Huntsman Specialty Chemicals Corporation (incorporated by reference to Exhibit 10.2 to our registration statement on Form S-4 (File No. 333-85141)) |
|
10.3 |
Operating and Maintenance Agreement, dated as of March 21, 1997, by and between Huntsman Specialty Chemicals Corporation and Huntsman Petrochemical Corporation (incorporated by reference to Exhibit 10.3 to our registration statement on Form S-4 (File No. 333-85141)) |
|
60
10.4 |
Credit Agreement, dated as of June 30, 1999, by and among Huntsman International LLC (f/k/a Huntsman ICI Chemicals LLC), Huntsman International Holdings LLC (f/k/a Huntsman ICI Holdings LLC), Bankers Trust Company, Goldman Sachs Credit Partners LP, The Chase Manhattan Bank, and Warburg Dillon Read and various lending institutions party thereto (incorporated by reference to Exhibit 10.4 to our registration statement on Form S-4 (File No. 333-85141)) |
|
10.5 |
Asset Sale Agreement, dated June 30, 1999, by and between BP Chemicals Limited and Huntsman International LLC (f/k/a Huntsman ICI Chemicals LLC) (incorporated by reference to Exhibit 10.5 to our registration statement on Form S-4 (File No. 333-85141)) |
|
10.6 |
First Amendment, dated as of December 21, 2000, by and among Huntsman International LLC, Huntsman International Holdings LLC, the financial institutions named therein, as Lenders, Bankers Trust Company, as Lead Arranger, Administrative Agent for the Lenders and Sole Book Manager, Goldman Sachs Credit Partners L.P., as Syndication Agent and Co-Arranger and The Chase Manhattan Bank and Warburg Dillon Read (a division of UBS AG), as Co-Arrangers and as Co-Documentation Agents, to the Credit Agreement dated as of June 30, 1999 (incorporated by reference to Exhibit 10.15 to our annual report on Form 10-K for the year ended December 31, 2000) |
|
10.7 |
Second Amendment, dated as of March 5, 2001, is entered into by and among Huntsman International LLC, Huntsman International Holdings LLC, the undersigned financial institutions, including Bankers Trust Company, in their capacities as lenders hereunder, Bankers Trust Company, as Lead Arranger, Administrative Agent for the Lenders and Sole Book Manager, Goldman Sachs Credit Partners L.P., as Syndication Agent and Co-Arranger and The Chase Manhattan Bank and UBS Warburg LLC (as successor to Warburg Dillon Read), as Co-Arrangers and as Co-Documentation Agents, to the Credit Agreement dated as of June 30, 1999 (incorporated by reference to Exhibit 10.16 to our annual report on Form 10-K for the year ended December 31, 2000) |
|
10.8 |
Contribution Agreement, among Huntsman International LLC, as Contributor and Originator, and Huntsman Receivables Finance LLC, as the Company, dated as of December 20, 2000 (incorporated by reference to Exhibit 10.17 to our annual report on Form 10-K for the year ended December 31, 2000) |
|
10.9 |
Huntsman Master Trust Pooling Agreement, dated as of December 21, 2000, among Huntsman Receivables Finance LLC, as Company, Huntsman (Europe) BVBA, as Master Servicer, and Chase Manhattan Bank (Ireland) Plc, as Trustee (incorporated by reference to Exhibit 10.18 to our annual report on Form 10-K for the year ended December 31, 2000) |
|
10.10 |
Huntsman Master Trust, Series 2000-1 Supplement, dated as of December 21, 2000, to Pooling Agreement dated as of December 21, 2000, among Huntsman Receivables Finance LLC, as Company, Huntsman (Europe), BVBA, as Master Servicer, The Chase Manhattan Bank, as Funding Agent, Park Avenue Receivables Corp., as Series 2000-1 Initial Purchaser, the several financial institutions party thereto from time to time as Series 2000-1 APA Banks, and Chase Manhattan Bank (Ireland) Plc, as Trustee (incorporated by reference to Exhibit 10.19 to our annual report on Form 10-K for the year ended December 31, 2000) |
|
61
10.11 |
Servicing Agreement, dated as of December 21, 2000, among Huntsman Receivables Finance LLC, as the Company, Huntsman (Europe) BVBA, as Master Servicer, Tioxide Americas Inc., Huntsman ICI Holland B.V., Tioxide Europe Limited, Huntsman International LLC, Huntsman Petrochemicals (U.K.) Limited, Huntsman Propylene Oxide Ltd., Huntsman International Fuels L.P., as Local Servicers, Chase Manhattan Bank (Ireland) Plc, as Trustee, Pricewaterhousecoopers, as Liquidation Servicer, and Huntsman International LLC, as Servicer Guarantor (incorporated by reference to Exhibit 10.20 to our annual report on Form 10-K for the year ended December 31, 2000) |
|
10.12 |
U.S. Receivables Purchase Agreement, Huntsman International LLC, as Purchaser, and Tioxide Americas Inc., Huntsman Propylene Oxide Ltd. and Huntsman International Fuels, L.P., each as a Seller and an Originator (incorporated by reference to Exhibit 10.21 to our annual report on Form 10-K for the year ended December 31, 2000) |
|
10.13 |
Dutch Receivables Purchase Agreement, dated as of December 21, 2000, between Huntsman International LLC, as Purchaser, Huntsman ICI Holland B.V., as Originator, Huntsman ICI (Europe) B.V.B.A., as Master Servicer (incorporated by reference to Exhibit 10.22 to our annual report on Form 10-K for the year ended December 31, 2000) |
|
10.14 |
U.K. Receivables Purchase Agreement, dated as of December 20, 2000, between Huntsman International LLC, as Purchaser, Tioxide Europe Limited and Huntsman Petrochemicals (U.K.) Limited, as Originators, and Huntsman (Europe) B.V.B.A., as Master Servicer (incorporated by reference to Exhibit 10.23 to our annual report on Form 10-K for the year ended December 31, 2000) |
|
10.15 |
Third Amendment, dated as of November 30, 2001, by and among Huntsman International LLC, Huntsman International Holdings LLC and the various agents and lending institutions party thereto (incorporated by reference to Exhibit 10.1 to our current report on Form 8-K filed December 4, 2001) |
|
10.16 |
Fourth Amendment to Credit Agreement, dated as of March 15, 2002, by and among Huntsman International LLC, Huntsman International Holdings LLC and the various agents and lending institutions party thereto (incorporated by reference to Exhibit 10.25 to amendment no. 1 to our annual report on Form 10-K/A for the year ended December 31, 2001) |
|
10.17 |
Amendment Agreement, dated December 20, 2001, between Imperial Chemical Industries PLC, Huntsman Specialty Chemicals Corporation, Huntsman International Holdings LLC and Huntsman International LLC, to amend the Contribution Agreement dated as of April 15, 1999 (incorporated by reference to Exhibit 10.26 to our registration statement on Form S-4 (File No. 333-106482)) |
|
10.18 |
Second Amendment, dated as of October 21, 2002, between Huntsman Receivables Finance LLC, Huntsman (Europe), BVBA, and J.P. Morgan (Ireland) PLC, to Series 2000-1 Supplement, dated as of December 21, 2000 (incorporated by reference to Exhibit 10.27 to our annual report on Form 10-K for the year ended December 31, 2002) |
|
10.19 |
First Amendment to Series 2001-1 Supplement, dated as of October 21, 2002, among Huntsman Receivables Finance LLC, Huntsman (Europe) BVBA and J.P. Morgan Bank (Ireland) PLC (incorporated by reference to Exhibit 10.28 to our annual report on Form 10-K for the year ended December 31, 2002) |
|
62
10.20 |
First Amendment to Amended and Restated Pooling Agreement, dated as of October 21, 2002, among Huntsman Receivables Finance LLC, Huntsman (Europe) BVBA and J.P. Morgan Bank (Ireland) PLC (incorporated by reference to Exhibit 10.29 to our annual report on Form 10-K for the year ended December 31, 2002) |
|
10.21 |
Amended and Restated Servicing Agreement, dated as of October 21, 2002, among Huntsman Receivables Finance LLC, as the Company, Huntsman (Europe) BVBA, as Master Servicer, Tioxide Americas Inc., Huntsman Holland B.V., Tioxide Europe Limited, Huntsman International LLC, Huntsman Petrochemicals (UK) Limited, Huntsman Propylene Oxide Ltd., Huntsman International Fuels L.P., Tioxide Europe SRL, Huntsman Surface Sciences Italia SRL, Huntsman Patrica S.R.L., Tioxide Europe S.L., Huntsman Surface Sciences Ibérica, S.L., Tioxide Europe SAS, Huntsman Surface Sciences (France) S.A.S., Huntsman Surface Sciences UK Ltd, Huntsman Ethyleneamines Ltd., as Local Servicers, J.P. Morgan Bank (Ireland) PLC, as Trustee, Pricewaterhousecoopers, as Liquidation Servicer, and Huntsman International LLC, as Servicer Guarantor (incorporated by reference to Exhibit 10.30 to our annual report on Form 10-K for the year ended December 31, 2002) |
|
10.22 |
Amended and Restated U.S. Receivables Purchase Agreement, dated as of October 21, 2002, among Huntsman International LLC, as Purchaser, and Tioxide Americas Inc., Huntsman Propylene Oxide Ltd., Huntsman International Fuels L.P., and Huntsman Ethyleneamines Ltd., each as a Seller and an Originator (incorporated by reference to Exhibit 10.31 to our annual report on Form 10-K for the year ended December 31, 2002) |
|
10.23 |
Amended and Restated UK Receivables Purchase Agreement, dated as of October 21, 2002, among Huntsman International LLC, as Purchaser, Huntsman Surface Sciences UK Limited, Tioxide Europe Limited, and Huntsman Petrochemicals (UK) Limited, as Originators, Huntsman (Europe) B.V.B.A, as Master Servicer (incorporated by reference to Exhibit 10.32 to our annual report on Form 10-K for the year ended December 31, 2002) |
|
10.24 |
Fifth Amendment to Credit Agreement, dated as of February 7, 2003, among Huntsman International LLC, Huntsman International Holdings LLC and the various agents and lending institutions party thereto (incorporated by reference to Exhibit 10.33 to our annual report on Form 10-K for the year ended December 31, 2002) |
|
10.25 |
Deed of Amendment to Contribution Agreement, dated as of November 27, 2002, among Imperial Chemical Industries PLC, Huntsman Specialty Chemicals Corporation, Huntsman International Holdings, LLC, and Huntsman International LLC (incorporated by reference to Exhibit 10.34 to our annual report on Form 10-K for the year ended December 31, 2002) |
|
10.26 |
Sixth Amendment to Credit Agreement, dated as of April 9, 2003, among Huntsman International LLC, Huntsman International Holdings LLC and the various agents and lending institutions party thereto (incorporated by reference to Exhibit 10.1 to our quarterly report on Form 10-Q for the quarter ended March 31, 2003) |
|
10.27 |
Business Consulting Agreement, dated as of June 3, 2003, between Huntsman International LLC and Jon M. Huntsman (incorporated by reference to Exhibit 10.41 to our registration statement on Form S-4 (File No. 333-106482)) |
|
10.28 |
Seventh Amendment to Credit Agreement, dated as of October 17, 2003, among Huntsman International LLC, Huntsman International Holdings LLC and the various agents and lending institutions party thereto (incorporated by reference to Exhibit 10.42 to our registration statement on Form S-4 (File No. 333-106482)) |
|
63
10.29 |
First Amendment to Amended and Restated Credit Agreement, dated as of December 21, 2004, among Huntsman International LLC, Huntsman International Holdings LLC and the various agents and lending institutions party thereto (incorporated by reference to Exhibit 10.1 to our current report on Form 8-K dated December 17, 2004 (File No. 333-85141)) |
|
21.1 |
Omitted pursuant to General Instruction I of Form 10-K. |
|
31.1* |
Certification of Chief Executive Officer pursuant to Section 302 of the Sarbanes-Oxley Act of 2002 |
|
31.2* |
Certification of Chief Financial Officer pursuant to Section 302 of the Sarbanes-Oxley Act of 2002 |
|
32.1* |
Certification of Chief Executive Officer pursuant to Section 906 of the Sarbanes-Oxley Act of 2002 |
|
32.2* |
Certification of Chief Financial Officer pursuant to Section 906 of the Sarbanes-Oxley Act of 2002 |
64
Pursuant to the requirements of Section 13 or 15(d) of the Securities Exchange Act of 1934, the Registrant has duly caused this report to be signed on its behalf by the undersigned, thereunto duly authorized.
Dated: March 14, 2005 |
HUNTSMAN INTERNATIONAL LLC |
|||
By: |
/s/ J. KIMO ESPLIN J. Kimo Esplin Executive Vice President and Chief Financial Officer |
|||
Pursuant to the requirements of the Securities Exchange Act of 1934, this report has been signed below by the following persons on behalf of the Registrant and in the capacities indicated on the 14th day of March 2005.
| /s/ JON M. HUNTSMAN Jon M. Huntsman Chairman of the Board and Manager |
/s/ PETER R. HUNTSMAN Peter R. Huntsman President and Chief Executive Officer and Manager (Principal Executive Officer) |
|
/s/ J. KIMO ESPLIN J. Kimo Esplin Executive Vice President and Chief Financial Officer (Principal Financial Officer) |
/s/ L. RUSSELL HEALY L. Russell Healy Vice President and Controller (Principal Accounting Officer) |
SUPPLEMENTAL INFORMATION TO BE FURNISHED WITH REPORTS FILED PURSUANT TO SECTION 15(d) OF THE SECURITIES EXCHANGE ACT OF 1934 BY REGISTRANTS WHICH HAVE NOT REGISTERED SECURITIES PURSUANT TO SECTION 12 OF THE SECURITIES EXCHANGE ACT OF 1934
The registrant has not sent to its security holders any annual report to security holders covering the registrant's last fiscal year or any proxy statement, form of proxy or other proxy soliciting material sent to more than 10 of the registrant's security holders with respect to any annual or other meeting of security holders.
65
HUNTSMAN INTERNATIONAL LLC AND SUBSIDIARIES
INDEX TO CONSOLIDATED FINANCIAL STATEMENTS
F-1
RESPONSIBILITY FOR THE CONSOLIDATED FINANCIAL STATEMENTS
Company management is responsible for the preparation, accuracy and integrity of the consolidated financial statements and other financial information included in this Annual Report. This responsibility includes preparing the statements in accordance with accounting principles generally accepted in the United States of America and necessarily includes estimates based upon management's best judgment.
To help ensure the accuracy and integrity of Company financial data, management maintains internal controls which are designed to provide reasonable assurance that transactions are executed as authorized, that they are accurately recorded and that assets are properly safeguarded. It is essential for all Company employees to conduct their business affairs in keeping with the highest ethical standards as outlined in our code of conduct policy, "Business Conduct Guidelines." Careful selection of employees, and appropriate divisions of responsibility also help us to achieve our control objectives.
The consolidated balance sheets of Huntsman International LLC and subsidiaries as of December 31, 2004 and 2003, and the related consolidated statements of operations and comprehensive income (loss), member's equity, and cash flows for the years ended December 31, 2004, 2003 and 2002 have been audited by the Company's independent registered public accounting firm Deloitte & Touche LLP. Their report is shown on page F-3.
The Board of Managers oversees the adequacy of the Company's control environment. Representatives of the Audit Committee meet periodically with representatives of Deloitte & Touche LLP, internal financial management and the internal auditor to review accounting, control, auditing and financial reporting matters. The independent registered public accounting firm and the internal auditor also have full and free access to meet privately with the Audit Committee.
F-2
REPORT OF INDEPENDENT REGISTERED PUBLIC ACCOUNTING FIRM
To the Board of Managers and Member of
Huntsman International LLC and Subsidiaries:
We have audited the accompanying consolidated balance sheets of Huntsman International LLC and subsidiaries (the "Company") as of December 31, 2004 and 2003, and the related consolidated statements of operations and comprehensive income (loss), member's equity, and cash flows for the each of the three years in the period ended December 31, 2004. Our audits also included the financial statement schedule listed on page F-1. These financial statements and financial statement schedule are the responsibility of the Company's management. Our responsibility is to express an opinion on these financial statements and financial statement schedule based on our audits.
We conducted our audits in accordance with the standards of the Public Company Accounting Oversight Board (United States). Those standards require that we plan and perform the audit to obtain reasonable assurance about whether the financial statements are free of material misstatement. The Company is not required to have, nor were we engaged to perform, an audit of its controls over financial reporting. Our audit included consideration of internal control over financial reporting as a basis for designing audit procedures that are appropriate in the circumstances, but not for the purpose of expressing an opinion on the effectiveness of the Company's internal control over financial reporting. Accordingly, we express no such opinion. An audit also includes examining, on a test basis, evidence supporting the amounts and disclosures in the financial statements, assessing the accounting principles used and significant estimates made by management, as well as evaluating the overall financial statement presentation. We believe that our audits provide a reasonable basis for our opinion.
In our opinion, such consolidated financial statements present fairly, in all material respects, the financial position of Huntsman International LLC and subsidiaries as of December 31, 2004 and 2003 and the results of their operations and their cash flows for each of the three years in the period ended December 31, 2004 in conformity with accounting principles generally accepted in the United States of America. Also, in our opinion, such financial statement schedule, when considered in relation to the basic consolidated financial statements taken as a whole, presents fairly in all material respects the information set forth therein.
/s/ DELOITTE & TOUCHE LLP
Houston,
Texas
March 14, 2005
F-3
HUNTSMAN INTERNATIONAL LLC AND SUBSIDIARIES
CONSOLIDATED BALANCE SHEETS
(Dollars in Millions)
| |
December 31, 2004 |
December 31, 2003 |
||||||
|---|---|---|---|---|---|---|---|---|
| ASSETS | ||||||||
| Current assets: | ||||||||
| Cash and cash equivalents | $ | 138.0 | $ | 97.8 | ||||
| Accounts receivable (net of allowance for doubtful accounts of $10.7 and $13.4, respectively) | 770.1 | 538.5 | ||||||
| Accounts receivable from affiliates | 35.9 | 25.9 | ||||||
| Inventories | 735.6 | 596.9 | ||||||
| Prepaid expenses | 30.8 | 23.6 | ||||||
| Deferred income taxes | 10.2 | 3.0 | ||||||
| Other current assets | 50.5 | 83.6 | ||||||
| Total current assets | 1,771.1 | 1,369.3 | ||||||
Property, plant and equipment, net |
3,183.7 |
3,256.2 |
||||||
| Investment in unconsolidated affiliates | 146.2 | 138.7 | ||||||
| Intangible assets, net | 254.0 | 283.4 | ||||||
| Notes receivable—affiliates | 10.8 | 13.5 | ||||||
| Other noncurrent assets | 483.1 | 431.6 | ||||||
| Total assets | $ | 5,848.9 | $ | 5,492.7 | ||||
| LIABILITIES AND MEMBER'S EQUITY | ||||||||
| Current liabilities: | ||||||||
| Accounts payable (including overdraft facilities of nil and $7.5, respectively) | $ | 589.2 | $ | 483.6 | ||||
| Accounts payable to affiliates | 99.1 | 77.7 | ||||||
| Accrued liabilities | 419.7 | 387.7 | ||||||
| Current portion of long-term debt | 10.5 | 1.8 | ||||||
| Total current liabilities | 1,118.5 | 950.8 | ||||||
| Long-term debt | 3,044.3 | 2,925.3 | ||||||
| Deferred income taxes | 179.2 | 234.8 | ||||||
| Notes payable—affiliates | 29.9 | 29.1 | ||||||
| Other noncurrent liabilities | 269.5 | 195.4 | ||||||
| Total liabilities | 4,641.4 | 4,335.4 | ||||||
| Minority interests | 8.8 | 3.6 | ||||||
| Commitments and contingencies (Notes 19, 21, and 22) | ||||||||
| Member's equity: | ||||||||
| Member's equity, 1,000 units | 1,026.1 | 1,026.1 | ||||||
| Retained earnings | 6.1 | 55.6 | ||||||
| Accumulated other comprehensive income | 166.5 | 72.0 | ||||||
| Total member's equity | 1,198.7 | 1,153.7 | ||||||
| Total liabilities and member's equity | $ | 5,848.9 | $ | 5,492.7 | ||||
See accompanying notes to consolidated financial statements.
F-4
HUNTSMAN INTERNATIONAL LLC AND SUBSIDIARIES
CONSOLIDATED STATEMENTS OF OPERATIONS AND COMPREHENSIVE INCOME
(Dollars in Millions)
| |
Year Ended December 31, 2004 |
Year Ended December 31, 2003 |
Year Ended December 31, 2002 |
|||||||||
|---|---|---|---|---|---|---|---|---|---|---|---|---|
| Revenues: | ||||||||||||
| Trade sales, services, and fees | $ | 6,312.1 | $ | 5,041.7 | $ | 4,184.4 | ||||||
| Related party sales | 191.3 | 203.8 | 333.7 | |||||||||
| Total revenues | 6,503.4 | 5,245.5 | 4,518.1 | |||||||||
| Cost of goods sold | 5,678.5 | 4,661.1 | 3,902.7 | |||||||||
| Gross profit | 824.9 | 584.4 | 615.4 | |||||||||
Expenses: |
||||||||||||
| Selling, general and administrative | 367.7 | 368.0 | 331.6 | |||||||||
| Research and development | 40.9 | 49.4 | 54.6 | |||||||||
| Other operating income | (14.4 | ) | (65.6 | ) | (6.6 | ) | ||||||
| Restructuring and plant closing costs | 249.5 | 56.7 | 7.7 | |||||||||
| Total expenses | 643.7 | 408.5 | 387.3 | |||||||||
| Operating income | 181.2 | 175.9 | 228.1 | |||||||||
Interest expense, net |
(254.2 |
) |
(251.5 |
) |
(245.4 |
) |
||||||
| Loss on accounts receivable securitization program | (15.6 | ) | (32.4 | ) | (5.5 | ) | ||||||
| Other (expense) income | (19.5 | ) | (1.3 | ) | 1.3 | |||||||
| Loss before income taxes | (108.1 | ) | (109.3 | ) | (21.5 | ) | ||||||
| Income tax benefit (expense) | 58.6 | (21.6 | ) | 41.5 | ||||||||
| Minority interests | — | — | 0.1 | |||||||||
| Net (loss) income | (49.5 | ) | (130.9 | ) | 20.1 | |||||||
Other comprehensive income |
94.5 |
219.4 |
53.4 |
|||||||||
| Comprehensive income | $ | 45.0 | $ | 88.5 | $ | 73.5 | ||||||
See accompanying notes to consolidated financial statements.
F-5
HUNTSMAN INTERNATIONAL LLC AND SUBSIDIARIES
CONSOLIDATED STATEMENTS OF MEMBER'S EQUITY
(Dollars in Millions)
| |
Member's Equity |
|
Accumulated Other Comprehensive Income (Loss) |
|
|||||||||||
|---|---|---|---|---|---|---|---|---|---|---|---|---|---|---|---|
| |
Retained Earnings |
|
|||||||||||||
| |
Units |
Amount |
Total |
||||||||||||
| Balance, January 1, 2002 | 1,000 | $ | 1,026.1 | $ | 166.4 | $ | (200.8 | ) | $ | 991.7 | |||||
Net income |
— |
20.1 |
— |
20.1 |
|||||||||||
| Other comprehensive income | — | — | 53.4 | 53.4 | |||||||||||
| Balance, December 31, 2002 | 1,000 | 1,026.1 | 186.5 | (147.4 | ) | 1,065.2 | |||||||||
Net loss |
— |
(130.9 |
) |
— |
(130.9 |
) |
|||||||||
| Other comprehensive income | — | — | 219.4 | 219.4 | |||||||||||
| Balance, December 31, 2003 | 1,000 | 1,026.1 | 55.6 | 72.0 | 1,153.7 | ||||||||||
Net loss |
— |
(49.5 |
) |
— |
(49.5 |
) |
|||||||||
| Other comprehensive income | — | — | 94.5 | 94.5 | |||||||||||
| Balance, December 31, 2004 | 1,000 | $ | 1,026.1 | $ | 6.1 | $ | 166.5 | $ | 1,198.7 | ||||||
See accompanying notes to consolidated financial statements.
F-6
HUNTSMAN INTERNATIONAL LLC AND SUBSIDIARIES
CONSOLIDATED STATEMENTS OF CASH FLOWS
(Dollars in Millions)
| |
Year Ended December 31, 2004 |
Year Ended December 31, 2003 |
Year Ended December 31, 2002 |
||||||||
|---|---|---|---|---|---|---|---|---|---|---|---|
| Cash Flows From Operating Activities: | |||||||||||
| Net (loss) income | $ | (49.5 | ) | $ | (130.9 | ) | $ | 20.1 | |||
| Adjustments to reconcile net (loss) income to net cash provided by operating activities: | |||||||||||
| Depreciation and amortization | 312.4 | 277.9 | 256.2 | ||||||||
| Provision for losses on accounts receivable | 2.0 | 10.2 | 4.1 | ||||||||
| Loss on early extinguishment of debt | 19.5 | — | — | ||||||||
| Noncash restructuring and plant closing charges | 116.4 | 11.4 | 6.1 | ||||||||
| Noncash interest expense | 16.5 | 16.2 | 12.9 | ||||||||
| Deferred income taxes | (75.3 | ) | — | (59.8 | ) | ||||||
| Gain on foreign currency transactions | (61.5 | ) | (64.3 | ) | (29.5 | ) | |||||
| Minority interests in subsidiaries | — | — | (0.1 | ) | |||||||
| Equity in earnings of investment in unconsolidated affiliates | — | — | (0.2 | ) | |||||||
| Changes in operating assets and liabilities: | |||||||||||
| Accounts and notes receivables | (94.2 | ) | (6.6 | ) | 1.6 | ||||||
| Change in receivables sold, net | (90.0 | ) | 18.6 | 99.7 | |||||||
| Inventories | (93.6 | ) | 26.6 | (12.6 | ) | ||||||
| Prepaid expenses | (4.2 | ) | 1.1 | (9.1 | ) | ||||||
| Other current assets | 59.7 | (29.2 | ) | (15.0 | ) | ||||||
| Other noncurrent assets | (1.1 | ) | — | (9.4 | ) | ||||||
| Accounts payable | 46.0 | (58.5 | ) | (0.5 | ) | ||||||
| Accrued liabilities | 41.9 | 32.6 | (70.2 | ) | |||||||
| Other noncurrent liabilities | 0.8 | (6.6 | ) | (16.2 | ) | ||||||
| Net cash provided by operating activities | 145.8 | 98.5 | 178.1 | ||||||||
| Investing Activities: | |||||||||||
| Capital expenditures | (141.3 | ) | (127.4 | ) | (190.5 | ) | |||||
| Acquisitions of business and minority interest | — | — | (9.0 | ) | |||||||
| Investments in unconsolidated affiliate | (11.8 | ) | (6.1 | ) | — | ||||||
| Net cash received from unconsolidated affiliate | 8.6 | 0.8 | 8.0 | ||||||||
| Advances to unconsolidated affiliates | (2.6 | ) | (3.0 | ) | (3.3 | ) | |||||
| Proceeds from sale of fixed assets | — | — | 5.9 | ||||||||
| Net cash used in investing activities | (147.1 | ) | (135.7 | ) | (188.9 | ) | |||||
| Financing Activities: | |||||||||||
| Repayments under revolving loan facilities | (22.0 | ) | (45.0 | ) | (43.6 | ) | |||||
| Proceeds from long-term debt | 1,369.6 | 205.0 | 300.0 | ||||||||
| Issuance of Senior Notes | 354.5 | 157.9 | — | ||||||||
| Repayment of long-term debt | (1,302.4 | ) | (264.0 | ) | (245.0 | ) | |||||
| Repayments under overdraft facility | (7.5 | ) | 7.5 | — | |||||||
| Repayments of Senior Notes | (333.4 | ) | — | — | |||||||
| Shares issued to minority shareholders for cash | 5.4 | 2.7 | — | ||||||||
| Cost of early extinguishment of debt | (17.0 | ) | — | — | |||||||
| Debt issuance costs | (17.2 | ) | (9.7 | ) | (10.3 | ) | |||||
| Net cash provided by financing activities | 30.0 | 54.4 | 1.1 | ||||||||
| Effect of exchange rate changes on cash | 11.5 | 5.2 | 1.2 | ||||||||
| Increase (decrease) in cash and cash equivalents | 40.2 | 22.4 | (8.5 | ) | |||||||
| Cash and cash equivalents at beginning of period | 97.8 | 75.4 | 83.9 | ||||||||
| Cash and cash equivalents at end of period | $ | 138.0 | $ | 97.8 | $ | 75.4 | |||||
| Supplemental cash flow information: | |||||||||||
| Cash paid for interest | $ | 260.9 | $ | 222.5 | $ | 235.0 | |||||
| Cash paid for income taxes | $ | 13.2 | $ | 13.8 | $ | 12.3 | |||||
See accompanying notes to consolidated financial statements.
F-7
HUNTSMAN INTERNATIONAL LLC AND SUBSIDIARIES
NOTES TO CONSOLIDATED FINANCIAL STATEMENTS
1. General
Description of Business
Huntsman International LLC (the "Company," including its subsidiaries, unless the context otherwise requires) is a global manufacturer and marketer of differentiated and commodity chemicals. The Company manages its business through four segments: Polyurethanes, Performance Products, Pigments and Base Chemicals. The Company manufactures its products at facilities located in North America, Europe, Asia and Africa and sells its products throughout the world.
Company
The Company is a wholly-owned subsidiary of Huntsman International Holdings LLC ("HIH"). All of the membership interests of HIH are owned directly and indirectly by Huntsman Corporation.
Initial Public Offering of Huntsman Corporation
On February 16, 2005, Huntsman Corporation, the Company's parent corporation, completed initial public offerings of (i) 55,681,819 shares of its common stock sold by Huntsman Corporation and 13,579,546 shares of its common stock sold by a selling stockholder, in each case at a price to the public of $23 per share, and (ii) 5,750,000 shares of its 5% Mandatory Convertible Preferred Stock sold by Huntsman Corporation at a price to the public of $50 per share. Net proceeds to Huntsman Corporation from the offering were approximately $1,500 million, substantially all of which has been used to repay outstanding indebtedness of certain of Huntsman Corporation's subsidiaries, including HMP, Huntsman LLC and HIH.
2. Summary of Significant Accounting Policies
Principles of Consolidation
The consolidated financial statements of the Company include the accounts of the Company and its majority wholly-owned subsidiaries. All intercompany accounts and transactions have been eliminated.
Revenue Recognition
The Company generates substantially all of its revenues through sales in the open market and long-term supply agreements. The Company recognizes revenue when it is realized or realizable, and earned. Revenue for product sales is recognized when a sales arrangement exists, risk and title to the product transfer to the customer, collectibility is reasonably assured, and pricing is fixed or determinable. This occurs at the time shipment is made.
Cost of Goods Sold
The Company classifies the costs of manufacturing and distributing its products as cost of goods sold. Manufacturing costs include variable costs, primarily raw materials and energy, and fixed expenses directly associated with production. Manufacturing costs include, among other things, plant site operating costs and overhead, production planning and logistics costs, repair and maintenance costs, plant site purchasing costs, and engineering and technical support costs. Distribution, freight and warehousing costs are also included in cost of goods sold.
F-8
Use of Estimates
The preparation of financial statements in conformity with accounting principles generally accepted in the United States requires management to make estimates and assumptions that affect the reported amounts of assets and liabilities and disclosure of contingent assets and liabilities at the date of the financial statements and the reported amounts of revenues and expenses during the reporting period. Actual results could differ from those estimates.
Cash and Cash Equivalents
The Company considers cash in checking accounts and cash in short-term highly liquid investments with an original maturity of three months or less to be cash and cash equivalents.
Securitization of Accounts Receivable
The Company securitizes certain trade receivables in connection with a revolving accounts receivable securitization program in which the Company grants a participating undivided interest in certain of its trade receivables to a qualified off-balance sheet entity. The Company retains the servicing rights and a retained interest in the securitized receivables. Losses are recorded on the sale and are based on the carrying value of the receivables as allocated between the receivables sold and the retained interests and their relative fair value at the date of the transfer. Retained interests are subsequently carried at fair value which is estimated based on the present value of expected cash flows, calculated using management's best estimates of key assumptions including credit losses and discount rates commensurate with the risks involved. For more information, see "Note 11 Securitization of Accounts Receivable".
Inventories
Inventories are stated at the lower of cost or market, with cost determined using last-in first-out, first-in first-out, and average costs methods for different components of inventory.
Property, Plant and Equipment
Property, plant and equipment is stated at cost less accumulated depreciation. Depreciation is computed using the straight-line method over the estimated useful lives or lease term as follows:
| Buildings | 20-30 years | |
| Plant and equipment | 3-20 years |
Interest costs are capitalized as part of major construction projects. Interest expense capitalized as part of plant and equipment was $4.5 million, $4.4 million and $10.5 million for the years ended December 31, 2004, 2003 and 2002, respectively.
Periodic maintenance and repairs applicable to major units of manufacturing facilities are accounted for on the prepaid basis by capitalizing the costs of the turnaround and amortizing the costs over the estimated period until the next turnaround. Normal maintenance and repairs of all other plant and equipment are charged to expense as incurred. Renewals, betterments and major repairs that materially extend the useful life of the assets are capitalized, and the assets replaced, if any, are retired.
Investment in Unconsolidated Affiliates
Investments in companies in which the Company exercises significant management influence are accounted for using the equity method.
F-9
Intangible Assets
Intangible assets are stated at cost (fair value at the time of acquisition) and are amortized using the straight-line method over the estimated useful lives or the life of the related agreement as follows:
| Patents and technology | 5 - 30 years | |
| Trademarks | 15 - 30 years | |
| Other intangibles | 5 - 15 years |
Other Noncurrent Assets
Other non current assets consist primarily of spare parts, debt issuance costs, notes receivable, employee benefit assets and turnaround costs. Debt issuance costs are amortized using the interest method over the term of the related debt.
Carrying Value of Long-Term Assets
Upon the occurrence of a triggering event, the Company evaluates the carrying value of long-term assets based upon current and anticipated undiscounted cash flows and recognizes an impairment when such estimated cash flows are less than the carrying value of the asset. Measurement of the amount of impairment, if any, is based upon the difference between carrying value and fair value. Fair value is generally estimated by discounting estimated future cash flows using a discount rate commensurate with the risks involved. See "Note 10—Restructuring, Plant Closing and Impairment Costs."
Financial Instruments
The carrying amount reported in the balance sheet for cash and cash equivalents, accounts receivable and accounts payable approximates fair value because of the immediate or short-term maturity of these financial instruments. The carrying value of the senior secured credit facilities of the Company's subsidiaries approximates fair value since they bear interest at a variable rate plus an applicable margin.
Derivatives and Hedging Activities
The Company follows Statement of Financial Accounting Standards ("SFAS") No. 133, "Accounting For Derivative Instruments And Hedging Activities." SFAS No. 133, as amended and interpreted, establishes accounting and reporting standards for derivative instruments, including certain derivative instruments embedded in other contracts, and for hedging activities. All derivatives, whether designated in hedging relationships or not, are required to be recorded on the balance sheet at fair value. If the derivative is designated in a fair-value hedge, the changes in the fair value of the derivative and the hedged items are recognized in earnings. If the derivative is designated in a cash-flow hedge, changes in the fair value of the derivative are recorded in other comprehensive income and will be recognized in the income statement when the hedged item affects earnings. SFAS No. 133 defines new requirements for designation and documentation of hedging relationships as well as ongoing effectiveness assessments in order to use hedge accounting. For a derivative that does not qualify as a hedge, changes in fair value are recognized in earnings.
Income Taxes
The Company and its U.S. subsidiaries are organized as limited liability companies. These entities are treated similar to a partnership for U.S. income tax purposes, and therefore are not subject to U.S. federal tax on their income. Subsidiaries outside the U.S. are generally taxed on the income generated in the local country.
F-10
Deferred income taxes are provided for temporary differences between financial statement income and taxable income using the asset and liability method in accordance with SFAS No. 109, "Accounting for Income Taxes." The Company evaluates the resulting deferred tax assets to determine whether it is more likely than not that they will be realized. Valuation allowances have been established against certain of the non-U.S. deferred tax assets due to uncertainty of realization. Valuation allowances are reviewed each period on a tax jurisdiction by jurisdiction basis to analyze whether there is sufficient positive or negative evidence to support a change in judgment about the realizability of the related deferred tax asset. The Company does not provide for income taxes or benefits on the undistributed earnings of its international subsidiaries as earnings are reinvested and, in the opinion of management, will continue to be reinvested indefinitely.
Asset Retirement Obligations
The Company accrues for asset retirement obligations, which consist primarily of landfill closure costs in the period in which the obligations are incurred and the Company has sufficient information to estimate a range of potential settlement dates for the obligation. These costs are accrued at estimated fair value. When the related liability is initially recorded, the Company capitalizes the cost by increasing the carrying amount of the related long-lived asset. Over time, the liability is accreted to its settlement value and the capitalized cost is depreciated over the useful life of the related asset. Upon settlement of the liability, the Company will recognize a gain or loss for any difference between the settlement amount and the liability recorded.
Asset retirement obligations consist primarily of landfill capping and closure and post-closure costs. The Company is legally required to perform capping and closure and post-closure care on the landfills and reclamation on the quarries. In accordance with SFAS No. 143, "Accounting for Asset Retirement Obligations," each landfill the Company recognizes the fair value of a liability for an asset retirement obligation and capitalizes that cost as part of the cost basis of the related asset. The related assets are being depreciated on a straight-line basis over 27 years. The Company has additional asset retirement obligations with indeterminate settlement dates; the fair value of these asset retirement obligations cannot be estimated due to the lack of sufficient information to estimate a range of potential settlement dates for the obligation. An asset retirement obligation related to these assets will be recognized when the Company knows such information.
The following table describes changes to the asset retirement obligation liability:
| |
Year Ended December 31, 2004 |
||
|---|---|---|---|
| |
In millions |
||
| Asset retirement obligation at the beginning of the period | $ | — | |
| Liabilities incurred | 6.7 | ||
| Accretion expense | 0.5 | ||
| Liabilities settled | — | ||
| Revisions in estimated cash flows | — | ||
| Asset retirement obligation at the end of the period | $ | 7.2 | |
If the asset retirement obligation and measurement provisions of SFAS No. 143 had been in effect on January 1, 2002, the aggregate carrying amount of those obligations would have been $5.0 million. The amortization of the asset retirement cost and accretion of asset retirement obligation for each of 2002 and 2003 would have been immaterial.
Research and Development
Research and development costs are expensed as incurred.
F-11
Foreign Currency Translation
The accounts of the Company's subsidiaries outside of the United States, except for those operating in highly inflationary economic environments, consider local currency to be the functional currency. Accordingly, assets and liabilities are translated at rates prevailing at the balance sheet date. Revenues, expenses, gains and losses are translated at a weighted average rate for the period. Cumulative translation adjustments are recorded to stockholder's equity as a component of accumulated other comprehensive income (loss).
Subsidiaries that operate in economic environments that are highly inflationary consider the U.S dollar to be the functional currency and include gains and losses from translation to the U.S. dollar from the local currency in the statement of operations.
Transaction gains and losses are recorded in selling, general and administrative expenses in the consolidated statement of operations and were net gains of $67.6 million, $91.9 million and $48.3 million for the years ended December 31, 2004, 2003 and 2002, respectively.
Environmental Expenditures
Environmental related restoration and remediation costs are recorded as liabilities and expensed when site restoration and environmental remediation and cleanup obligations are either known or considered probable and the related costs can be reasonably estimated. Other environmental expenditures, which are principally maintenance or preventative in nature, are recorded when incurred and are expensed or capitalized as appropriate. See "Note 22—Environmental, Health and Safety Matters."
Earnings per Member Equity Unit
Earnings per member equity unit is not presented because it is not considered meaningful information due to the Company's ownership by a single equity holder.
Reclassifications
Certain amounts in the consolidated financial statements for prior periods have been reclassified to conform with the current presentation.
Recently Issued Accounting Standards
In January 2003, the Financial Accounting Standards Board ("FASB") issued Financial Interpretation No. ("FIN") 46, "Consolidation of Variable Interest Entities." FIN 46 addresses the requirements for business enterprises to consolidate related entities, for which they do not have controlling interests through voting or other rights, if they are determined to be the primary beneficiary as a result of variable economic interests. Transfers to a qualifying special purpose entity are not subject to this interpretation. In December 2003, the FASB issued a complete replacement of FIN 46 (FIN 46R) to clarify certain complexities. The Company is required to adopt this financial interpretation on January 1, 2005. The adoption of the standard will require the consolidation of the Company's Rubicon Inc. joint venture; however the consolidation of the joint venture will not be significant to the financial statements.
In May 2003, the FASB issued SFAS No. 150, "Accounting for Certain Financial Instruments with Characteristics of Both Liabilities and Equity." SFAS No. 150 establishes standards for classifying and measuring as liabilities certain financial instruments that embody obligations of the issuer and have characteristics of both liabilities and equity. SFAS No. 150 is effective for all financial instruments created or modified after May 31, 2003 and otherwise is effective at the beginning of the first interim
F-12
period beginning after June 15, 2003. The adoption of SFAS No. 150 did not have a material impact on the Company's consolidated financial statements.
In November 2004, the FASB issued SFAS No. 151, "Inventory Costs—an amendment of ARB No. 43". SFAS No. 151 requires abnormal amounts of idle facility expense, freight, handling costs, and wasted material to be recognized as current-period charges. It also requires that allocation of fixed production overheads to the costs of conversion be based on the normal capacity of the production facilities. The requirements of the standard will be effective for inventory costs incurred during fiscal years beginning after June 15, 2005. The Company is reviewing SFAS No. 151 to determine the statement's impact on its consolidated financial statements.
In December 2004, the FASB issued SFAS No. 153, "Exchanges of Nonmonetary Assets an amendment of APB Opinion No. 29." SFAS No. 153 addresses the measurement of exchanges of nonmonetary assets and eliminates the exception from fair value measurement for nonmonetary exchanges of similar productive assets in APB Opinion No. 29 and replaces it with an exception for exchanges that do not have commercial substance. SFAS No. 153 specifies that a nonmonetary exchange has commercial substance if the future cash flows of the entity are expected to change significantly as a result of the exchange. The provisions of this standard are effective for nonmonetary exchanges occurring in fiscal periods beginning after June 15, 2005. The Company will apply this standard prospectively.
In December 2004, the FASB issued SFAS No. 123R, "Share Based Payment." SFAS No. 123R requires entities to measure the cost of employee services received in exchange for an award of equity instruments based on the grant-date fair value of the award. That cost will be recognized over the period during which the employee is required to provide services in exchange for the award. This standard eliminates the alternative to use the intrinsic value method of accounting for share based payments as previously provided in APB Opinion No. 25, "Accounting for Stock Issued to Employees." This standard is effective for the Company beginning in January 2006. The Company is reviewing SFAS No. 123R to determine the statement's impact on its consolidated financial statements.
3. Inventories
Inventories consist of the following (dollars in millions):
| |
December 31, 2004 |
December 31, 2003 |
||||
|---|---|---|---|---|---|---|
| Raw materials and supplies | $ | 191.4 | $ | 180.2 | ||
| Work in progress | 45.4 | 18.0 | ||||
| Finished goods | 498.8 | 398.7 | ||||
| Total | $ | 735.6 | $ | 596.9 | ||
In the normal course of operations, the Company exchanges raw materials with other companies. No gains or losses are recognized on these exchanges, and the net open exchange positions are valued at the Company's cost. The amount included in inventory under open exchange agreements receivable by the Company at December 31, 2004 was $1.1 million (2.1 million pounds of feedstock and products), which represented the amount to be received by the Company under open exchange agreements. The amount deducted from inventory under open exchange agreements owed by the Company at December 31, 2003 was $6.6 million (18.7 million pounds of feedstock and products), which represented the amount payable by the Company under open exchange agreements.
F-13
4. Property, Plant and Equipment
The cost and accumulated depreciation of property, plant and equipment are as follows (dollars in millions):
| |
December 31, 2004 |
December 31, 2003 |
|||||
|---|---|---|---|---|---|---|---|
| Land | $ | 56.7 | $ | 49.4 | |||
| Buildings | 230.9 | 201.0 | |||||
| Plant and equipment | 4,095.9 | 3,938.9 | |||||
| Construction in progress | 173.2 | 156.1 | |||||
| Total | 4,556.7 | 4,345.4 | |||||
| Less accumulated depreciation | (1,373.0 | ) | (1,089.2 | ) | |||
| Net | $ | 3,183.7 | $ | 3,256.2 | |||
Depreciation expense for the years ended December 31, 2004, 2003 and 2002 was $281.3 million, $245.5 million, and $220.4 million respectively.
Property, plant and equipment includes gross assets acquired under capital leases of $19.6 million and $19.0 million at December 31, 2004 and December 31, 2003, respectively; related amounts included in accumulated depreciation were $7.6 million and $5.3 million at December 31, 2004 and December 31, 2003, respectively.
5. Investments in Unconsolidated Affiliates
The Company's ownership percentage and investments in unconsolidated affiliates, primarily manufacturing joint ventures, are as follows (dollars in millions):
| |
December 31, 2004 |
December 31, 2003 |
||||
|---|---|---|---|---|---|---|
| Louisiana Pigment Company, L.P. (50%) | $ | 121.6 | $ | 130.4 | ||
| BASF Huntsman Shanghai Isocyanate Investment BV (50%) | 17.9 | 6.1 | ||||
| Rubicon, Inc. (50%) | 5.7 | 1.0 | ||||
| Others | 1.0 | 1.2 | ||||
| Total | $ | 146.2 | $ | 138.7 | ||
As noted, the Company owns 50% of BASF Huntsman Shanghai Isocyanate Investment BV. BASF Huntsman Shanghai Isocyanate Investment BV owns a 70% interest in a manufacturing joint venture, thus giving the Company an indirect 35% interest in the manufacturing joint venture.
Summarized approximate financial information of such affiliated companies as a group as of December 31, 2004 and 2003 and for the years then ended is presented below (dollars in millions):
| |
December 31, 2004 |
December 31, 2003 |
December 31, 2002 |
|||||||
|---|---|---|---|---|---|---|---|---|---|---|
| Assets | $ | 507.1 | $ | 466.1 | $ | 488.3 | ||||
| Liabilities | 216.8 | 189.9 | 222.5 | |||||||
| Revenues | 976.1 | 768.0 | 651.3 | |||||||
| Net income | 0.2 | 0.1 | 0.2 | |||||||
| The Company's equity in: | ||||||||||
| Net assets | 146.2 | 138.7 | 133.9 | |||||||
| Net income | 0.4 | 0.1 | 0.2 | |||||||
F-14
6. Intangible Assets
The gross carrying amount and accumulated amortization of intangible assets were as follows (dollars in millions):
| |
December 31, 2004 |
December 31, 2003 |
||||||||||||||||
|---|---|---|---|---|---|---|---|---|---|---|---|---|---|---|---|---|---|---|
| |
Carrying Amount |
Accumulated Amortization |
Net |
Carrying Amount |
Accumulated Amortization |
Net |
||||||||||||
| Patents, trademarks, and technology | $ | 389.9 | $ | 142.7 | $ | 247.2 | $ | 389.2 | $ | 116.9 | $ | 272.3 | ||||||
| Non-compete agreements | 49.9 | 43.1 | 6.8 | 49.6 | 38.5 | 11.1 | ||||||||||||
| Total | $ | 439.8 | $ | 185.8 | $ | 254.0 | $ | 438.8 | $ | 155.4 | $ | 283.4 | ||||||
Amortization expense for intangible assets for years ended 2004, 2003 and 2002 was $28.6 million, $32.4 million and $33.9 million, respectively. Estimated future amortization expense for intangible assets through December 31, 2009 is $26.2 million annually in 2005, $25.9 million annually in 2006, $23.9 million annually for 2007, 2008 and 2009.
7. Other Noncurrent Assets
Other noncurrent assets consist of the following (dollars in millions):
| |
December 31, 2004 |
December 31, 2003 |
||||
|---|---|---|---|---|---|---|
| Prepaid pension costs | $ | 266.0 | $ | 235.1 | ||
| Debt issuance costs | 52.5 | 54.4 | ||||
| Capitalized turnaround expense | 72.7 | 52.6 | ||||
| Spare parts inventory | 56.7 | 55.6 | ||||
| Other noncurrent assets | 35.2 | 33.9 | ||||
| Total | $ | 483.1 | $ | 431.6 | ||
8. Accrued Liabilities
Accrued liabilities consist of the following (dollars in millions):
| |
December 31, 2004 |
December 31, 2003 |
||||
|---|---|---|---|---|---|---|
| Payroll and related costs | $ | 112.1 | $ | 77.1 | ||
| Interest | 62.8 | 78.5 | ||||
| Volume and rebates accruals | 64.1 | 64.8 | ||||
| Income tax payable | 26.7 | 35.5 | ||||
| Taxes (property and VAT) | 36.5 | 32.0 | ||||
| Restructuring and plant closing costs | 87.6 | 22.5 | ||||
| Interest and commodity hedging accruals | — | 10.8 | ||||
| Environmental accruals | 5.7 | 5.7 | ||||
| Other miscellaneous accruals | 24.2 | 60.8 | ||||
| Total | $ | 419.7 | $ | 387.7 | ||
F-15
9. Other Noncurrent Liabilities
Other noncurrent liabilities consist of the following (dollars in millions):
| |
December 31, 2004 |
December 31, 2003 |
||||
|---|---|---|---|---|---|---|
| Pension liabilites | $ | 168.6 | $ | 149.0 | ||
| Restructuring and plant closing costs | 19.0 | — | ||||
| Other postretirement benefits | 12.2 | 11.8 | ||||
| Environmental accruals | 15.5 | 11.6 | ||||
| Other noncurrent liabilities | 54.2 | 23.0 | ||||
| Total | $ | 269.5 | $ | 195.4 | ||
10. Restructuring and Plant Closing Costs
As of December 31, 2004, accrued restructuring and plant closing costs by type of cost and activity consist of the following (dollars in millions):
| |
Workforce reductions(1) |
Demolition and decommissioning |
Non-cancelable lease costs |
Other restructuring costs |
Total(2) |
|||||||||||
|---|---|---|---|---|---|---|---|---|---|---|---|---|---|---|---|---|
| Accrued liabilities as of December 31, 2001 | $ | 31.3 | $ | — | $ | — | $ | — | $ | 31.3 | ||||||
| 2002 charges for 2002 initiatives | — | — | — | 1.6 | 1.6 | |||||||||||
| 2002 payments for 2001 initiatives(3) | (24.2 | ) | — | — | — | (24.2 | ) | |||||||||
| 2002 payments for 2002 initiatives(3) | — | — | — | (1.6 | ) | (1.6 | ) | |||||||||
| Accrued liabilities as of December 31, 2002 | 7.1 | — | — | — | 7.1 | |||||||||||
| 2003 charges for 2003 initiatives | 45.2 | — | — | — | 45.2 | |||||||||||
| 2003 payments for 2001 initiatives(3) | (7.1 | ) | — | — | — | (7.1 | ) | |||||||||
| 2003 payments for 2003 initiatives(3) | (22.7 | ) | — | — | — | (22.7 | ) | |||||||||
| Accrued liabilities as of December 31, 2003 | 22.5 | — | — | — | 22.5 | |||||||||||
| 2004 charges for 2003 initiatives | 24.5 | — | — | 0.4 | 24.9 | |||||||||||
| 2004 charges for 2004 initiatives | 84.9 | 4.8 | 5.1 | 13.4 | 108.2 | |||||||||||
| 2004 payments for 2003 initiatives(3) | (24.8 | ) | — | — | — | (24.8 | ) | |||||||||
| 2004 payments for 2004 initiatives(3) | (27.9 | ) | — | — | — | (27.9 | ) | |||||||||
| Foreign currency effect on reserve balance | 3.7 | — | — | — | 3.7 | |||||||||||
| Accrued liabilities as of December 31, 2004 | $ | 82.9 | $ | 4.8 | $ | 5.1 | $ | 13.8 | $ | 106.6 | ||||||
F-16
| |
December 31, 2004 |
December 31, 2003 |
December 31, 2002 |
||||||
|---|---|---|---|---|---|---|---|---|---|
| 2001 initiatives | $ | — | $ | — | $ | 7.1 | |||
| 2002 initiatives | — | — | — | ||||||
| 2003 initiatives | 22.6 | 22.5 | — | ||||||
| 2004 initiatives | 80.3 | — | — | ||||||
| Foreign currency effect on reserve balance | 3.7 | — | — | ||||||
| Total | $ | 106.6 | $ | 22.5 | $ | 7.1 | |||
Details with respect to the Company's reserves for restructuring and plant closing costs are provided below by segments and activity (dollars in millions):
| |
Polyurethanes |
Performance Products |
Pigments |
Base Chemicals |
Total |
|||||||||||||
|---|---|---|---|---|---|---|---|---|---|---|---|---|---|---|---|---|---|---|
| Accrued liabilities as of December 31, 2001 | $ | 29.4 | $ | — | $ | 1.9 | $ | — | $ | 31.3 | ||||||||
| 2002 charges for 2002 initiatives | — | 1.6 | — | — | 1.6 | |||||||||||||
| 2002 payments for 2001 initiatives(2) | (22.3 | ) | — | (1.9 | ) | — | (24.2 | ) | ||||||||||
| 2002 payments for 2002 initiatives(2) | — | (1.6 | ) | — | — | (1.6 | ) | |||||||||||
| Accrued liabilities as of December 31, 2002 | 7.1 | — | — | — | 7.1 | |||||||||||||
| 2003 charges for 2003 initiatives | 28.0 | 10.7 | 6.5 | — | 45.2 | |||||||||||||
| 2003 payments for 2001 initiatives(2) | (7.1 | ) | — | — | (7.1 | ) | ||||||||||||
| 2003 payments for 2003 initiatives(2) | (12.2 | ) | (8.3 | ) | (2.2 | ) | — | (22.7 | ) | |||||||||
| Accrued liabilities as of December 31, 2003 | 15.8 | 2.4 | 4.3 | — | 22.5 | |||||||||||||
| 2004 charges for 2003 initiatives | 10.0 | 0.4 | 14.5 | — | 24.9 | |||||||||||||
| 2004 charges for 2004 initiatives(1) | 16.4 | 48.2 | 27.3 | 16.3 | 108.2 | |||||||||||||
| 2004 payments for 2003 initiatives | (11.5 | ) | (2.4 | ) | (10.9 | ) | — | (24.8 | ) | |||||||||
| 2004 payments for 2004 initiatives | (11.8 | ) | — | (14.3 | ) | (1.8 | ) | (27.9 | ) | |||||||||
| Foreign currency effect on reserve balance | 0.1 | 1.9 | 1.1 | 0.6 | 3.7 | |||||||||||||
| Accrued liabilities as of December 31, 2004 | $ | (19.0 | ) | $ | 50.5 | $ | 22.0 | $ | 15.1 | $ | 106.6 | |||||||
| Current portion of restructuring reserve | $ | 19.0 | $ | 31.5 | $ | 22.0 | $ | 15.1 | $ | 87.6 | ||||||||
| Long-term portion of restructuring reserve | — | 19.0 | — | — | 19.0 | |||||||||||||
| Estimated additional future charges for current restructuring projects: | ||||||||||||||||||
| Estimated additional charges within one year | ||||||||||||||||||
| Cash charges | $ | 5.5 | $ | — | $ | 6.0 | $ | 3.5 | $ | 15.0 | ||||||||
| Noncash charges | — | — | — | — | — | |||||||||||||
| Estimated additional charges beyond one year | ||||||||||||||||||
| Cash charges | $ | — | $ | — | $ | 4.7 | $ | — | $ | 4.7 | ||||||||
| Noncash charges | — | — | — | — | — | |||||||||||||
F-17
As of December 31, 2004 and December 31, 2003, the Company had reserves for restructuring and plant closing costs of $106.6 million and $22.5 million, respectively. During the year ended December 31, 2004, the Company, on a consolidated basis, recorded additional charges of $249.5 million, including $116.4 million of charges for asset impairment and write downs, and $133.1 million payable in cash for workforce reductions, demolition and decommissioning and other restructuring costs associated with closure or curtailment of activities at the Company's smaller, less efficient manufacturing facilities. During the 2004 period, the Company made cash payments against these reserves of $52.7 million. For purposes of measuring impairment charges, the fair value of the assets was determined by using the present value of expected cash flows.
As of December 31, 2003, the Polyurethanes segment reserve consisted of $15.8 million related to the restructuring activities at the Rozenburg, Netherlands site (as announced in 2003), the workforce reductions throughout the Polyurethanes segment (as announced in 2003), and the closure of the Shepton Mallet, U.K. site (as announced in 2002). During the year ended December 31, 2004, the Polyurethanes segment recorded additional restructuring charges of $36.9 million consisting of $26.4 million of cash charges and $10.5 of asset impairment and made cash payments of $23.3 million. These restructuring activities are expected to result in additional restructuring charges of approximately $5.5 million through 2005 and result in workforce reductions of approximately 160 positions, of which 86 positions have been reduced during the year ended December 31, 2004. As of December 31, 2004, the balance of the Polyurethanes segment reserve totaled $19.0 million.
As of December 31, 2003, the Performance Products segment reserve consisted of $2.4 million relating to the closure of a number of plants at the Whitehaven, U.K. facility, the closure of an administrative office in London, U.K., the rationalization of a surfactants technical center in Oldbury, U.K., and the restructuring of a facility in Barcelona, Spain. During the year ended December 31, 2004, the Performance Products segment recorded additional restructuring charges of $73 million consisting of $48.6 million of charges payable in cash and $24.4 million of asset impairment charges. During 2004, the Company adopted a plan to reduce the workforce across all locations in its European surfactants business by approximately 320 positions over a period of 15 months. This plan included the closure of substantially all of the Company's Whitehaven, U.K. surfactants facility. During the third quarter the Company recorded a restructuring charge of $17.5 million, all payable in cash, in respect of workforce reductions across a number of its European facilities. In connection with the further rationalization of the Whitehaven facility, the Company recognized a restructuring charge of $55.4 million in the fourth quarter of 2004, of which approximately $31.1 million is payable in cash and $24.4 million is impairment of assets. During the year ended December 31, 2004, the Company made cash payments of $2.4 million related to restructuring activities. These restructuring activities are not expected to result in additional charges. As of December 31, 2004, the balance of the Performance Products segment reserve totaled $50.5 million.
As of December 31, 2003, the Pigments segment reserve consisted of $4.3 million relating to its global workforce reductions announced in August 2003. During the year ended December 31, 2004, the Pigments segment recorded additional restructuring charges of $123.3 million and made cash payments of $25.2 million. During 2004, the Pigments segment recorded restructuring expenses of $17.3 million related to global workforce reductions, all of which are payable in cash. In addition, in April 2004, the Company announced that, following a review of the Pigments business, it would idle approximately 55,000 tonnes, or about 10%, of its total titanium dioxide ("TiO2") production capacity in the third and fourth quarter of 2004. As a result of this decision, the Company recorded a restructuring charge of $24.5 million to be paid in cash, a $77.2 million asset impairment charge and a $4.3 million charge for the write-off of spare parts inventory and other assets. These combined restructuring activities are expected to result in additional restructuring charges of approximately $11 million through 2010 and result in workforce reductions of approximately 600 positions, of which approximately 400 positions
F-18
have been reduced as of December 31, 2004. As of December 31, 2004, the balance of the Pigments segment reserve totaled $22.0 million.
As of December 31, 2004, the Base Chemicals segment reserve consisted of $15.1 million related to workforce reductions arising from the announced change in work shift schedules and in the engineering and support functions at the Wilton and North Tees, U.K. facilities. During the year ended December 31, 2004, the Base Chemicals segment recorded restructuring charges of $16.3 million, all of which is payable in cash. These restructuring activities are expected to result in additional charges of approximately $3.5 million and in workforce reductions of approximately 100 positions through 2005. As of December 31, 2004, the balance of the Base Chemicals segment reserve totaled $15.1 million.
2003 Restructuring Activities
On March 11, 2003, the Polyurethanes segment announced that it would integrate its global flexible products unit into its urethane specialties unit, and recorded a restructuring charge of $19.2 million for workforce reductions of approximately 118 employees. During the remainder of the year, charges of $8.8 million were taken for workforce reductions relating to this restructuring at the Rozenberg, Netherlands site.
In June 2003, the Company announced that its Performance Products segment would close a number of plants at its Whitehaven, U.K. facility and recorded a charge of $20.1 million in the second quarter 2003. This charge represents $11.4 million relating to an impairment of assets at Whitehaven (in connection with the plant shutdowns) and $8.7 million of workforce reduction costs. The Company also recorded a $2.0 million charge in respect of severance costs arising from the closure of an administrative office in London, U.K., the rationalization of the surfactants technical center in Oldbury, U.K., and the restructuring of the facility in Barcelona, Spain. These charges are part of an overall cost reduction program for this segment that is expected to be implemented through 2005.
In August 2003, the Company recorded a restructuring charge of $6.5 million related to workforce reductions of approximately 63 employees across its global Pigments operations. The overall cost reduction program to be completed through 2005 for the Pigments segment will involve 250 employees and is estimated to cost an additional $16.5 million. At December 31, 2003, $4.3 million remains in the reserve for restructuring and plant closing costs related to these restructuring activities.
2002 Restructuring Activities
In 2002, the Pigments segment recorded $3.1 million in asset write-downs related to the closure of the Company's titanium dioxide manufacturing facility in Greatham, U.K..
During 2002, the Performance Products segment recorded $4.6 million in restructuring charges. These charges consist of $1.4 million in asset impairments related to the closure of the Alcover, Spain surfactants plant, $1.6 million in asset impairments at the Castiglione, Italy surfactants plant and $1.6 million in cash charges for other exit costs.
11. Securitization of Accounts Receivable
On December 21, 2000, the Company initiated an accounts receivable securitization program under which it grants an undivided interest in certain of its trade receivables to a qualified off-balance sheet entity (the "Receivables Trust") at a discount. This undivided interest serves as security for the issuance of commercial paper and medium term notes by the Receivables Trust.
At December 31, 2004 and December 31, 2003, the Receivables Trust had approximately $208.4 million and $198.4 million, respectively in U.S. dollar equivalents in medium term notes outstanding and approximately nil and $100 million, respectively in commercial paper outstanding. Under the terms of the agreements, the Company and its subsidiaries continue to service the
F-19
receivables in exchange for a 1% fee of the outstanding receivables, and the Company is subject to recourse provisions.
The Company's retained interest in receivables (including servicing assets) subject to the program was approximately $337.8 million and $154 million as of December 31, 2004 and 2003, respectively. The value of the retained interest is subject to credit and interest rate risk. For the year ended December 31, 2004 and 2003, new sales of accounts receivable sold into the program totaled approximately $5,057.1 million and $4,132 million, respectively, and cash collections from receivables sold into the program that were reinvested totaled approximately $5,016.9 million and $4,135.6 million, respectively. Servicing fees received during the year ended December 31, 2004 and 2003 were approximately $5.5 million and $4.9 million, respectively.
The Company incurs losses on the accounts receivable securitization program for the discount on receivables sold into the program and fees and expenses associated with the program. The Company also retains responsibility for the economic gains and losses on forward contracts mandated by the terms of the program to hedge the currency exposures on the collateral supporting the off-balance sheet debt issued. Gains and losses on forward contracts included as a component of the loss on accounts receivable securitization program are a loss of $2.4 million and a loss of $24.6 million for the year ended December 31, 2004 and 2003, respectively. As of December 31, 2004 and December 31, 2003, the fair value of the open forward currency contracts was $0 million and $6.8 million, respectively, which is included as a component of the residual interest that is included as a component of trade receivables on the Company's balance sheet. On April 16, 2004, the Company amended the commercial paper facility. Pursuant to the amendment, the maturity of the commercial paper facility was extended to March 31, 2007. In addition, the amendment permits the issuance of euro-denominated commercial paper.
The key economic assumptions used in valuing the residual interest are presented below:
| |
December 31, 2004 |
December 31, 2003 |
||
|---|---|---|---|---|
| Weighted average life (in months) | Approx. 1.5 | Approx. 3 | ||
| Credit losses (annual rate) | Less than 1% | Less than 1% | ||
| Discount rate (annual rate) | Approx. 1% | Approx. 2% |
A 10% and 20% adverse change in any of the key economic assumptions would not have a material impact on the fair value of the retained interest. Total receivables over 60 days past due as of December 31, 2004 and December 31, 2003 were $12.1 million and $15.6 million, respectively.
F-20
12. Debt
Outstanding debt consists of the following (dollars in millions):
| |
December 31, 2004 |
December 31, 2003 |
||||||
|---|---|---|---|---|---|---|---|---|
| HI Credit Facilities: | ||||||||
| Revolving loan facility | $ | — | $ | 22.0 | ||||
| Term B loan | 1,314.1 | 620.1 | ||||||
| Term C loan | — | 620.1 | ||||||
| HI Senior Notes | 456.0 | 457.1 | ||||||
| HI Subordinated Notes | 1,242.0 | 1,169.8 | ||||||
| Other debt | 42.7 | 38.0 | ||||||
| Total Debt | 3,054.8 | 2,927.1 | ||||||
| Less current portion | (10.5 | ) | (1.8 | ) | ||||
| Long Term Debt | $ | 3,044.3 | $ | 2,925.3 | ||||
HI Credit Facilities
As of December 31, 2004, the Company had senior secured credit facilities (the "HI Credit Facilities") which consisted of a revolving loan facility of up to $375 million maturing in September 2008 (the "HI Revolving Facility"), which includes a $50 million multicurrency revolving loan facility available in euros, GBP Sterling and U.S. dollars, and a term loan B facility consisting of a $1,248.9 million term portion and a €47.8 million (approximately $65.2 million) term portion (the "HI Term Facility"). On July 13, 2004, the Company amended and restated the HI Credit Facilities. Prior to the amendment and restatement, the HI Credit Facilities consisted of a $400 million revolving facility that was scheduled to mature on June 30, 2005, a $620.1 million term loan B facility that was scheduled to mature on June 30, 2007, and a $620.1 million term loan C facility that was scheduled to mature on June 30, 2008. At the closing of the amendment and restatement of the HI Credit Facilities on July 13, 2004, the Company raised approximately $126.6 million of net proceeds from the issuance of additional term loan borrowings, of which $82.4 million was applied to repay all outstanding borrowings on the HI Revolving Facility and the balance, net of fees, increased cash and cash equivalents. The increase in cash and availability under the HI Revolving Facility is available for general corporate purposes and to provide a portion of funds for the construction of a polyethylene production facility at the Company's Wilton, U.K. facility. Scheduled amortization of the HI Term Facility is approximately $13.3 million per annum, commencing June 30, 2006, with the remaining unpaid balance due at maturity. The maturity of the HI Term Facility is December 31, 2010; provided that the maturity will be accelerated to December 31, 2008 if the Company has not refinanced all of the outstanding HI Senior Notes and the HI Subordinated Notes (as defined below) on or before December 31, 2008 on terms satisfactory to the administrative agent under the HI Credit Facilities.
In compliance with applicable provisions in its credit facilities, on December 31, 2004, the Company prepaid $59 million on the HI Term Facility as a result of excess cash flow. Such prepayment has been applied in accordance with the provisions of the HI Credit Facilities in such a manner that there will be no scheduled maturities under the HI Credit Facilities due until June 2006 and such that all remaining scheduled maturities under the HI Term Facility shall be reduced pro rata.
Interest rates for the amended and restated HI Credit Facilities are based upon, at the Company's option, either a eurocurrency rate (LIBOR) or a base rate (prime) plus the applicable spread. The applicable spreads vary based on a pricing grid, in the case of eurocurrency-based loans, from 2.25% to 3.25% per annum depending on the loan facility and whether specified conditions have been satisfied, and, in the case of base rate loans, from 1.00% to 2.00% per annum. As of December 31, 2004 and
F-21
December 31, 2003 (which was prior to the amendment and restatement of the HI Credit Facilities), the average interest rates on the HI Credit Facilities were 5.0% and 5.6%, respectively, excluding the impact of interest rate hedges. On December 21, 2004, the Company amended the HI Credit Facilities which amendment, among other things, reduced the applicable base (prime) rate margin for the term loan B dollar loans from a range of 1.75% to 2.00% to a range of 1.00% to 1.25% and reduced the applicable Eurocurrency (LIBOR) rate margin for the term loan B dollar loans from a range of 3.00% to 3.25% to a range of 2.25% to 2.50%.
The HI Credit Facilities are secured by a first priority lien on substantially all the assets of HIH, its domestic subsidiaries and certain of HIH's foreign subsidiaries. The HI Credit Facilities are also guaranteed by HIH, the Company's domestic subsidiaries and certain of its foreign subsidiaries (the "HI Guarantors").
The HI Credit Facilities contain financial covenants including a minimum interest coverage ratio and a maximum debt to EBITDA ratio, as defined, and limits on capital expenditures. In addition to financial covenants, the HI Credit Facilities contain other customary covenants relating to the incurrence of debt, the purchase and sale of assets, limitations on investments, affiliate transactions, change in control provisions, events of default and acceleration provisions. Management believes that the Company was in compliance with the covenants of the HI Credit Facilities as of December 31, 2004.
The HI Credit Facility allows the Company to borrow up to $100 million secured by letters of credit; however, the $375 million revolving credit facility is reduced dollar-for-dollar by any letters of credit outstanding. As of December 31, 2004, there were no loans outstanding on the HI Revolving Facility, and there were $7.4 million in letters of credit outstanding.
HI Senior Notes and HI Subordinated Notes
In March 2002, the Company sold $300 million aggregate principal amount of HI Senior Notes due 2009. On April 11, 2003, the Company sold an additional $150 million aggregate principal amount of the HI Senior Notes at an issue price of 105.25%. Net proceeds from the sale of these notes were used to repay amounts outstanding under the HI Credit Facilities. The HI Senior Notes are unsecured obligations. Interest on the HI Senior Notes is payable semi-annually in March and September of each year. The HI Senior Notes are redeemable after March 1, 2006 at 104.937 of the principal amount thereof, declining ratably to par on and after March 1, 2008.
On December 17, 2004, the Company completed an offering of $175 million of its 7.375% senior subordinated notes due 2015 and €135 million of its 7.5% senior subordinated notes due 2015 (the "HI Senior Subordinated Notes due 2015"). The Company used all of the net proceeds to redeem part of its outstanding 10.125% senior subordinated notes due 2009 (the "HI Senior Subordinated Notes due 2009" and, together with the HI Senior Subordinated Notes due 2015, the "HI Senior Subordinated Notes"). Prior to the partial redemptions of the HI Senior Subordinated Notes due 2009 discussed below, the Company had outstanding $600 million and €450 million ($559.6 million, which includes $5.2 million of unamortized premium). The HI Senior Subordinated Notes due 2009 became redeemable on July 1, 2004 at 105.063% of the principal amount thereof, which declines ratably to par on and after July 1, 2007. In advance of the issuance of the HI Senior Subordinated Notes due 2015, the Company gave notice that it would redeem $231 million and €77 million of Senior Subordinated Notes due 2009 on December 31, 2004 and $2.9 million and €1.0 million of Senior Subordinated Notes due 2009 on January 3, 2005. The Company completed these redemptions as scheduled. In connection with these redemptions, the Company paid approximately $17.0 million and $0.2 million in U.S. dollar equivalents in redemption premiums on December 31, 2004 and January 3, 2005, respectively.
As of December 31, 2004, following the December 31, 2004 partial redemption of the HI Senior Subordinated Notes due 2009, the Company has outstanding $369 million and €373 million of Senior
F-22
Subordinated Notes due 2009 and $175 million and €135 million of Senior Subordinated Notes due 2015, for a combined total of $544 million and €508 million of Senior Subordinated Notes plus $5.3 million of unamortized premium. Following the January 3, 2005 partial redemption, the Company has outstanding $366.1 million and €372 million of Senior Subordinated Notes due 2009 and $175 million and €135 million of Senior Subordinated Notes due 2015, for a combined total of $541.1 million and €507 million of Senior Subordinated Notes plus $5.3 million of unamortized premium. The $175 million and €135 million HI Senior Subordinated Notes due 2015 are redeemable on or after January 1, 2010 at 103.688% and 103.750%, respectively, of the principal amount thereof, which declines ratably to par on and after January 1, 2013. In addition, at any time prior to January 1, 2008, the Company may redeem up to 40% of the aggregate principal amount of the $175 million and €135 million Senior Subordinated Notes due 2015 at redemption prices of 107.375% and 107.5% plus accrued and unpaid interest, respectively. The HI Senior Subordinated Notes are unsecured and interest is payable semi-annually in January and July of each year.
The HI Senior Notes and the HI Senior Subordinated Notes contain covenants relating to the incurrence of debt, limitations on distributions, asset sales and affiliate transactions, among other things. They also contain a change of control provision requiring the Company to offer to repurchase the HI Senior Notes and the HI Subordinated Notes upon a change of control. Management believes that the Company was in compliance with the covenants of the HI Senior Notes and the HI Senior Subordinated Notes as of December 31, 2004.
On December 10, 2004, the Company entered into a cross-currency swap. The cross-currency swap requires the Company to pay euros and receive U.S. dollars at the maturity date of January 1, 2010. The U.S. dollar notional amount is $175 million and bears interest at a fixed rate of 7.375%, payable semiannually on January 1 and July 1. The euro notional amount is approximately €132 million and bears interest at a blended fixed rate of approximately 6.63%, payable semiannually on January 1 and July 1.
Other Debt
The Company maintains a $25 million multicurrency overdraft facility for its European subsidiaries (the "HI European Overdraft Facility"), all of which was available as of December 31, 2004. As of December 31, 2003, the Company had approximately $7.5 million outstanding under the HI European Overdraft Facility included within trade payables. The HI European Overdraft Facility is used for daily working capital needs.
Included within other debt is debt associated with one of the Company's Chinese MDI joint ventures. In January 2003, the Company entered into a joint venture agreement with Shanghai Chlor-Alkali Chemical Company, Ltd. to build MDI production facilities near Shanghai, China. The Company owns 70% of Huntsman Polyurethanes Shanghai Ltd. ("Consolidated Chinese Splitting JV"), which is a consolidated affiliate. On September 19, 2003, the Consolidated Chinese Splitting JV obtained secured financing for the construction of the production facilities, consisting of various committed loans in the aggregate amount of approximately $119 million in U.S. dollar equivalents. As of December 31, 2004, there were $8.0 million outstanding in U.S. dollar borrowings and 20.0 million in RMB borrowings ($2.4 million) under these facilities. The interest rate on these facilities is LIBOR plus 0.48% for U.S. dollar borrowings and 90% of the Peoples Bank of China rate for RMB borrowings. As of December 31, 2004, the interest rate for U.S. dollar borrowings was approximately 3.1% and 5.5% for RMB borrowings. The loans are secured by substantially all the assets of the Consolidated Chinese Splitting JV and will be repaid in 16 semi-annual installments, beginning no later than June 30, 2007. The financing is non-recourse to the Company, but is guaranteed during the construction phase by affiliates of the Consolidated Chinese Splitting JV, including Huntsman Corporation, as the successor to Huntsman Holdings. Huntsman Corporation has unconditionally guaranteed 70% of any amounts due and unpaid by the Consolidated Chinese Splitting JV under the loans described above (except for the
F-23
VAT facility, which is not guaranteed). Huntsman Corporation's guarantees remain in effect until the Consolidated Chinese Splitting JV has (i) commenced production at least 70% of capacity for at least 30 days, and (ii) achieved a debt service cover ratio of at least 1.5:1.
Maturities
The scheduled maturities of the Company's debt are as follows (dollars in millions):
| Year ended December 31: |
|
||
|---|---|---|---|
| 2005 | $ | 10.5 | |
| 2006 | 15.5 | ||
| 2007 | 15.0 | ||
| 2008 | 15.2 | ||
| 2009 | 1,354.6 | ||
| Later Years | 1,644.0 | ||
| Total | $ | 3,054.8 | |
13. Derivative Instruments and Hedging Activities
The Company is exposed to market risks, such as changes in interest rates, foreign exchange rates and commodity pricing risks. From time to time, the Company enters into transactions, including transactions involving derivative instruments, to manage interest rate exposure, but does not currently hedge for movements in commodities or foreign exchange rates. The Company manages interest rate exposure through a program designed to reduce the impact of fluctuations in variable interest rates and to meet the requirements of certain credit agreements.
Interest Rate Hedging
Through the Company's borrowing activities, it is exposed to interest rate risk. Such risk arises due to the structure of the Company's debt portfolio, including the duration of the portfolio and the mix of fixed and floating interest rates. Prior to the amendment and restatement of the HI Credit Facilities on July 13, 2004, the HI Credit Facilities required that a certain portion of debt be at fixed rates through either interest rate hedges or through other means that provided a similar effect. Effective July 13, 2004, the HI Credit Facilities no longer require interest rate hedging. In recent years, the Company has issued fixed rate debt in the form of the HI Senior Notes and HI Subordinated Notes that serves to reduce overall risk to interest fluctuations.
Prior to September 30, 2004, the Company purchased interest rate cap and interest rate collar agreements to reduce the impact of changes in interest rates on its floating-rate long-term debt. The cap agreements entitled the Company to receive from the counterparties (major banks) the amounts, if any, by which the Company's interest payments on certain of its floating-rate borrowings exceeded a certain rate. The floor agreements required the Company to pay to the counterparties (major banks)
F-24
the amount, if any, by which the Company's interest payments on certain of its floating-rate borrowings were less than a certain rate.
| |
December 31, 2003 |
December 31, 2002 |
||||||
|---|---|---|---|---|---|---|---|---|
| |
(Dollars in Millions) |
|||||||
| Interest rate swaps | ||||||||
| Notional amount | $ | 212.7 | $ | 202.4 | ||||
| Fair value | (4.9 | ) | (11.8 | ) | ||||
| Weighted average pay rate | 5.65 | % | 5.72 | % | ||||
| Maximum weighted average pay rate | 6.60 | % | 6.62 | % | ||||
| Maturing | 2004 | 2004 | ||||||
Interest rate collars |
||||||||
| Notional amount | $ | 150.0 | $ | 150.0 | ||||
| Fair value | (4.8 | ) | (11.6 | ) | ||||
| Weighted average cap rate | 7.00 | % | 7.00 | % | ||||
| Weighted average floor rate | 5.08 | % | 5.08 | % | ||||
| Maximum weighted average floor rate | 6.25 | % | 6.25 | % | ||||
| Maturing | 2004 | 2004 | ||||||
As of December 31, 2003, the majority of the interest rate contracts had been designated as cash flow hedges of future interest payments on its variable rate debt. The fair value of these interest rate contracts designated as hedges as of December 31, 2003 was a loss of approximately $6.2 million, which is recorded in accrued liabilities and in accumulated other comprehensive income (loss) to the extent of the effective portions of the hedging instruments. Gains and losses related to these contracts will be reclassified from other comprehensive income (loss) into earnings in the periods in which the related hedged interest payments are made. Gains and losses on these agreements, including amounts recorded related to hedge ineffectiveness, are reflected as interest expense in the statement of operations. A gain of $0.2 million, a gain of $2.5million, and a net loss of $4.2 million were recorded in interest income in 2004, 2003, and 2002, respectively.
As of December 31, 2004 there were no swap agreement liabilities. As of December 31, 2003, swap agreement liabilities with a fair value of $3.4 million have not been designated as hedges for financial reporting purposes. The change in the liability resulted in interest income for 2004, 2003 and 2002 of $3.4 million, $4.6 million and $0.2 million respectively.
Commodity Price Hedging
As of December 31, 2004, there was $0.1 million included in other current assets and accrued liabilities relating to cash flow commodity price hedging contracts. As of December 31, 2003, there were no cash flow commodity price hedging contracts recorded in other current assets, accrued liabilities or other comprehensive income.
As of December 31, 2004, commodity price hedging contracts designated as fair value hedges are included in the balance sheet as $1.5 million increase in other current assets and $1.8 million decrease in inventory. As of December 31, 2003, commodity price hedging contracts designated as fair value hedges are included in the balance sheet as $0.8 million increase in accrued liabilities and $0.5 million increase in inventory.
Commodity price contracts not designated as hedges as defined by SFAS No. 133 are reflected in the balance sheet as $5.6 million and $1.8 million in other current assets and accrued liabilities, respectively, as of December 31, 2004, and as $0.5 million and $0.3 million in other current assets and accrued liabilities, respectively, as of December 31, 2003.
F-25
During 2004, 2003, and 2002, the Company recorded increases of $2.4 million, $1.2 million, and $3.5 million respectively, in cost of goods sold related to net gains and losses from settled contracts, net gains and losses in fair value price hedges, and the change in fair value on commodity price hedges not designated as hedges as defined in SFAS No. 133.
Foreign Currency Rate Hedging
The Company may enter into foreign currency derivative instruments to minimize the short-term impact of movements in foreign currency rates. These contracts designated as hedges for financial reporting purposes and are recorded at fair value. As of December 31, 2004 and December 31, 2003 and for the year ended December 31, 2004, 2003, and 2002, the fair value, change in fair value, and realized gains (losses) of outstanding foreign currency rate hedging contracts was not material.
Net Investment Hedging
The Company has designated all of its Euro-denominated debt as a hedge of its net investments in foreign operations. Currency effects of net investment hedges produced a loss of $45.2 million, a loss of $93.6 million, and loss of 95.9 million in other comprehensive income (loss) (foreign currency translation adjustments) for the year ended December 31, 2004, 2003, and 2002, respectively. As of December 31, 2004 and December 31, 2003, there was a cumulative net loss of approximately $171.5 million and $126.3 million, respectively.
On December 10, 2004, we entered into a cross-currency swap. The cross-currency swap requires the Company to pay euros and receive U.S. dollars at the maturity date of January 1, 2010. The U.S. dollar notional amount is $175 million and bears interest at a fixed rate of 7.375%, payable semiannually on January 1 and July 1. The euro notional amount is approximately and €132 million and bears interest at a blended fixed rate of approximately 6.63%, payable semiannually on January 1 and July 1. The Company has designated this cross-currency swap as a hedge of its net investment in euro-denominated operations.
14. Lease Commitments
The Company leases a number of assets which are accounted for as operating leases. The lease obligation reflected in the Company's statement of operations as rental expense, totaled $9.1 million, $11.0 million and $15.8 million for the three years ended December 31, 2004, 2003 and 2002, respectively. The minimum future rental payments due under existing agreements are by year (dollars in millions):
| Year |
Amount |
||
|---|---|---|---|
| 2005 | $ | 16.4 | |
| 2006 | 11.5 | ||
| 2007 | 7.8 | ||
| 2008 | 4.1 | ||
| 2009 | 3.5 | ||
| Later years | 46.7 | ||
| Total minimum lease payments | $ | 90.0 | |
The Company also has lease obligations accounted for as capital leases which are included in other long term debt. The present value of the future net minimum lease payments is $10.0 million at December 31, 2004.
F-26
15. Income Taxes
The loss before income tax consists of the following (dollars in millions):
| |
Year Ended December 31, 2004 |
Year Ended December 31, 2003 |
Year Ended December 31, 2002 |
|||||||
|---|---|---|---|---|---|---|---|---|---|---|
| U.S. income (loss) | $ | 38.0 | $ | 11.5 | $ | 101.3 | ||||
| Non-U.S. income (loss) | (146.1 | ) | (120.8 | ) | (122.8 | ) | ||||
| Total | $ | (108.1 | ) | $ | (109.3 | ) | $ | (21.5 | ) | |
The provision (benefit) for income taxes consists of the following (dollars in millions):
| |
Year Ended December 31, 2004 |
Year Ended December 31, 2003 |
Year Ended December 31, 2002 |
||||||||
|---|---|---|---|---|---|---|---|---|---|---|---|
| U.S.: | |||||||||||
| Current | $ | 0.5 | $ | 0.5 | $ | 1.4 | |||||
| Deferred | — | — | — | ||||||||
| Non-U.S.: | |||||||||||
| Current | 16.2 | 21.1 | 16.9 | ||||||||
| Deferred | (75.3 | ) | — | (59.8 | ) | ||||||
| Total | $ | (58.6 | ) | $ | 21.6 | $ | (41.5 | ) | |||
The following schedule reconciles the differences between the United States federal income taxes at the United States statutory rate to the Company's provision (benefit) for income taxes (dollars in millions):
| |
Year Ended December 31, 2004 |
Year Ended December 31, 2003 |
Year Ended December 31, 2002 |
|||||||
|---|---|---|---|---|---|---|---|---|---|---|
| Income taxes at U.S. federal statutory rate | $ | (37.7 | ) | $ | (38.3 | ) | $ | (7.5 | ) | |
| Income not subject to U.S. federal income tax | (13.3 | ) | (4.0 | ) | (23.10 | ) | ||||
| State income taxes | 0.5 | 0.5 | 0.4 | |||||||
| Foreign country incentive tax benefits | (13.3 | ) | (3.5 | ) | (17.0 | ) | ||||
| Foreign currency exchange gains and losses | (6.2 | ) | (13.0 | ) | 0.8 | |||||
| Effects of non-U.S. operations and tax rate differential | (24.1 | ) | 21.9 | 8.8 | ||||||
| Change in valuation allowance | 35.3 | 50.6 | — | |||||||
| Expiration and utilization of net operating losses | — | 7.6 | — | |||||||
| Other | 0.2 | (0.2 | ) | (3.9 | ) | |||||
| Total | $ | (58.6 | ) | $ | 21.6 | $ | (41.5 | ) | ||
| Effective income tax rate | 54 | % | 19 | % | 193 | % | ||||
F-27
The components of deferred tax assets and liabilities are as follows (dollars in millions):
| |
December 31, 2004 |
December 31, 2003 |
|||||||||||
|---|---|---|---|---|---|---|---|---|---|---|---|---|---|
| |
Current |
Long-term |
Current |
Long-term |
|||||||||
| Deferred income tax assets: | |||||||||||||
| Net operating loss carryforwards | $ | — | $ | 228.1 | $ | — | $ | 266.5 | |||||
| Tax basis of plant and equipment in excess of book basis | — | 36.4 | — | 31.9 | |||||||||
| Employee benefits | — | 24.2 | — | 0.5 | |||||||||
| Intangible Assets | 14.6 | ||||||||||||
| Other accruals and reserves | 38.0 | — | 14.6 | — | |||||||||
| Valuation allowance-Operations | (25.2 | ) | (69.3 | ) | — | (64.5 | ) | ||||||
| Valuation allowance-Other Comprehensive Income | — | (5.8 | ) | — | — | ||||||||
| Total | 12.8 | 228.2 | 14.6 | 234.4 | |||||||||
Deferred income tax liabilities: |
|||||||||||||
| Book basis of plant and equipment in excess of tax basis | — | (359.9 | ) | — | (413.6 | ) | |||||||
| Employee benefits | — | (47.5 | ) | — | (55.6 | ) | |||||||
| Other accruals and reserves | (2.6 | ) | — | (11.6 | ) | — | |||||||
| Total | (2.6 | ) | (407.4 | ) | (11.6 | ) | (469.2 | ) | |||||
| Net deferred tax asset (liability) | $ | 10.2 | $ | (179.2 | ) | $ | 3.0 | $ | (234.8 | ) | |||
The Company is treated as a partnership for U.S. federal income tax purposes and as such is generally not subject to U.S. income tax, but rather such income is taxed directly to the Company's owners. For the year ended December 31, 2004, the Company recognized non-recurring benefits in Spain, France and Holland of approximately $28.3 million associated with enacted changes in tax rates, the settlement of tax authority examinations and the reversal of previously established valuation allowances. In addition, the Company recognized an approximately $63.6 million benefit from losses in jurisdictions not subject to valuation allowances as well as treaty negotiated reductions in statutory rates.
The Company has net operating loss carryforwards ("NOLs") of approximately $721.4 million in various non-U.S. jurisdictions. While the majority of the NOLs have no expiration date, $132.3 million have a limited life and begin to expire in 2006. If the valuation allowance recorded against the deferred tax asset is reversed, substantially all of the benefit will be allocated to the income tax provision on the statement of operations while $2.9 million of the benefit will be used to reduce intangible assets. During 2003 and 2004, the company recorded additional valuation allowance of $54.4 and $35.3 million respectively as a result of increasing NOLs in the UK and other non-U.S. jurisdictions.
For non-U.S. entities that are not treated as branches for U.S tax purposes, the Company does not provide for income taxes on the undistributed earnings of these subsidiaries as earnings are reinvested and, in the opinion of management, will continue to be reinvested indefinitely. The undistributed earnings of foreign subsidiaries that are deemed to be permanently invested were $9.5 million at December 31, 2004. It is not practicable to determine the unrecognized deferred tax liability on those earnings.
Because the Company is treated as a partnership for U.S. federal income tax purposes, its income is taxed directly to the Company's owners. Pursuant to the Company's limited liability agreement and the limited liability company agreement of HIH, the Company has a tax sharing arrangement with HIH's membership interest holders. Under the arrangement, the Company will make payments to its parent, HIH, which will in turn make payments to its membership interest holders, in an amount approximately equal to the United States federal and state income taxes we and HIH would have paid had HIH been treated as a corporation for tax purposes. The arrangement also provides that, if we had previously made payments to HIH, and HIH had made payments out to its membership interest holders, the Company will receive cash payments back from the membership interest holders (through HIH) in amounts equal to the United States, federal and state income tax refunds or benefit against future tax liabilities we would have received from the use of net operating losses or tax credits generated by the Company, up to the amount of payments that we had previously made. As of December 31, 2004, approximately $3.9 million is due to HIH from its membership interest holders (and from HIH) to the Company.
F-28
As of December 31, 2004, the net difference of the Company's book basis of the U.S. assets and liabilities over the tax basis of those assets and liabilities is approximately $533 million.
16. Other Comprehensive Income (Loss)
The components of other comprehensive income (loss) are as follows (dollars in millions):
| |
December 31, 2004 |
December 31, 2003 |
December 31, 2002 |
||||||||||||||||
|---|---|---|---|---|---|---|---|---|---|---|---|---|---|---|---|---|---|---|---|
| |
Accumulated other comprehensive income (loss) |
Other comprehensive Income (loss) |
Accumulated other comprehensive income (loss) |
Other comprehensive Income (loss) |
Accumulated other comprehensive income (loss) |
Other comprehensive Income (loss) |
|||||||||||||
| Foreign currency translation adjustments | $ | 273.3 | $ | 113.6 | $ | 159.7 | $ | 198.4 | $ | (38.7 | ) | $ | 148.1 | ||||||
| Additional minimum pension liability, net of tax of $29.3 million and $29.6 million as of December 31, 2004. and 2003 respectively | (93.2 | ) | (16.1 | ) | (77.1 | ) | 11.0 | (88.1 | ) | (88.1 | ) | ||||||||
| Additional minimum pension liability—unconsolidated affiliate | (8.8 | ) | (3.2 | ) | (5.6 | ) | (0.2 | ) | (5.4 | ) | (5.4 | ) | |||||||
| Unrealized gain (loss) on securities | 0.9 | (0.1 | ) | 1.0 | 4.6 | (3.6 | ) | (3.6 | ) | ||||||||||
| Net unrealized gain (loss) on derivative instruments | (5.7 | ) | 0.3 | (6.0 | ) | 5.6 | (11.6 | ) | 2.4 | ||||||||||
| Total | $ | 166.5 | $ | 94.5 | $ | 72.0 | $ | 219.4 | $ | (147.4 | ) | $ | 53.4 | ||||||
Items of other comprehensive income of the Company and its consolidated affiliates have been recorded net of tax, with the exception of the foreign currency translation adjustments related to subsidiaries with earnings permanently reinvested. The tax effect is determined based upon the jurisdiction where the income or loss was recognized and is net of valuation allowances that have been recorded.
17. Employee Benefit Plans
The Company sponsors various contributory and non-contributory defined benefit pension plans covering employees in the U.S., the U.K., Netherlands, Belgium, Canada and a number of other countries. The Company funds the material plans through trust arrangements (or local equivalents) where the assets of the fund are held separately from the employer. The level of funding is in line with local practice and in accordance with the local tax and supervisory requirements. The plan assets consist primarily of equity and fixed income securities.
The Company also sponsors unfunded post-retirement benefit plans other than pensions which provide medical and life insurance benefits covering certain employees in the U.S. and Canada. In 2004, the healthcare trend rate used to measure the expected increase in the cost of benefits was assumed to be 10% per annum decreasing to 5% per annum after four years. In 2003, the healthcare trend rate used to measure the expected increase in the cost of benefits was assumed to be 10% per annum decreasing to 5.0% per annum after five years.
International employees are covered by various post employment arrangements consistent with local practices and regulations. Such obligations are included in the consolidated financial statements in other long term liabilities.
F-29
Components of the net periodic benefit costs for the year ended December 31, 2004 and 2003, are as follows (dollars in millions):
| |
Defined Benefit Plans |
Other Postretirement Benefit Plans |
|||||||||||||
|---|---|---|---|---|---|---|---|---|---|---|---|---|---|---|---|
| |
2004 |
2003 |
2004 |
2003 |
|||||||||||
| Change in benefit obligation | |||||||||||||||
| Benefit obligation as of beginning of year | $ | 1,424.5 | $ | 1,144.4 | $ | 13.7 | $ | 11.6 | |||||||
| Service cost | 40.2 | 36.9 | 0.4 | 0.4 | |||||||||||
| Interest cost | 77.7 | 64.2 | 0.8 | 0.8 | |||||||||||
| Participant Contributions | 2.6 | 2.4 | — | — | |||||||||||
| Plan amendments | (8.5 | ) | 0.3 | — | (1.4 | ) | |||||||||
| Exchange rate changes | 125.9 | 162.6 | 0.3 | 0.7 | |||||||||||
| Settlements/transfers | — | — | — | — | |||||||||||
| Other | 2.7 | 3.9 | — | — | |||||||||||
| Curtailments | (0.1 | ) | (1.9 | ) | — | — | |||||||||
| Special termination benefits | 10.5 | 9.8 | — | — | |||||||||||
| Tranfers | (1.2 | ) | — | — | |||||||||||
| Actuarial (gain)/loss | 90.6 | 45.2 | (0.9 | ) | 2.3 | ||||||||||
| Benefits Paid | (55.1 | ) | (43.3 | ) | (1.1 | ) | (0.7 | ) | |||||||
| Benefit obligation as of end of year | $ | 1,709.8 | $ | 1,424.5 | $ | 13.2 | $ | 13.7 | |||||||
F-30
| |
Defined Benefit Plans |
Other Postretirement Benefit Plans |
|||||||||||||
|---|---|---|---|---|---|---|---|---|---|---|---|---|---|---|---|
| |
2004 |
2003 |
2004 |
2003 |
|||||||||||
| Change in plan assets | |||||||||||||||
| Fair Value of plan assets at beginning of year | $ | 1,176.8 | $ | 907.9 | — | $ | — | ||||||||
| Actual return on plan assets | 129.1 | 129.6 | — | — | |||||||||||
| Adjustments to opening value | (4.0 | ) | — | — | — | ||||||||||
| Exchange rate changes | 105.2 | 139.6 | — | — | |||||||||||
| Employer contributions | 51.4 | 1.1 | |||||||||||||
| Participant contributions | 2.6 | 2.4 | — | — | |||||||||||
| Other | (2.3 | ) | 2.3 | — | — | ||||||||||
| Administrative expenses | (0.5 | ) | — | — | — | ||||||||||
| Company contributions | — | 38.3 | — | 0.7 | |||||||||||
| Tranfers | (1.1 | ) | — | — | — | ||||||||||
| Benefits Paid | (55.1 | ) | (43.3 | ) | (1.1 | ) | (0.7 | ) | |||||||
| Fair Value of plan assets at end of year | $ | 1,402.1 | $ | 1,176.8 | — | $ | — | ||||||||
Funded status |
|||||||||||||||
| Funded status | $ | (307.7 | ) | $ | (247.7 | ) | $ | (13.2 | ) | $ | (13.7 | ) | |||
| Unrecognized net actuarial (gain)/loss | 534.4 | 439.3 | 3.7 | 4.7 | |||||||||||
| Unrecognized prior service cost | (2.6 | ) | 6.4 | (2.7 | ) | (2.8 | ) | ||||||||
| Fair Value of plan assets at end of year | $ | 224.1 | $ | 198.0 | $ | (12.2 | ) | $ | (11.8 | ) | |||||
Amounts recognized in balance sheet: |
|||||||||||||||
| Accrued benefit cost recognized in accrued liabilities and other non current liabilites | $ | (42.0 | ) | $ | (149.0 | ) | $ | (12.2 | ) | $ | (11.8 | ) | |||
| Prepaid pension costs | 266.0 | 235.1 | — | — | |||||||||||
| Intangible asset | 4.2 | 5.2 | — | — | |||||||||||
| Additional minimum liability | (126.6 | ) | — | — | — | ||||||||||
| Accumulated other comprehensive income | 122.5 | 106.7 | — | — | |||||||||||
| Accrued benefit cost | $ | 224.1 | $ | 198.0 | $ | (12.2 | ) | $ | (11.8 | ) | |||||
Components of the net periodic benefit costs for the years ended December 31, 2004, 2003, and 2002 are as follows (dollars in millions):
| |
Defined Benefit Plans |
Other Postretirement Benefit Plans |
||||||||||||||||||
|---|---|---|---|---|---|---|---|---|---|---|---|---|---|---|---|---|---|---|---|---|
| |
2004 |
2003 |
2002 |
2004 |
2003 |
2002 |
||||||||||||||
| Service Costs | $ | 40.2 | $ | 36.9 | $ | 28.9 | $ | 0.4 | $ | 0.4 | $ | 0.4 | ||||||||
| Interest Costs | 77.7 | 64.2 | 52.3 | 0.8 | 0.8 | 0.7 | ||||||||||||||
| Expected return on assets | (86.0 | ) | (66.5 | ) | (73.4 | ) | — | — | — | |||||||||||
| Amortization of prior service costs | 0.5 | 0.6 | 0.3 | (0.2 | ) | (0.2 | ) | (0.2 | ) | |||||||||||
| Amortization of actuarial (gain)/loss | 20.9 | 22.9 | (0.2 | ) | 0.2 | 0.2 | 0.1 | |||||||||||||
| Benefit obligation as of end of year | $ | 53.3 | $ | 58.1 | $ | 7.9 | $ | 1.2 | $ | 1.2 | $ | 1.0 | ||||||||
F-31
The following assumptions were used in the above calculations (dollars in millions):
| |
Defined Benefit Plans |
Other Postretirement Benefit Plans |
|||||||||||
|---|---|---|---|---|---|---|---|---|---|---|---|---|---|
| |
2004 |
2003 |
2002 |
2004 |
2003 |
2002 |
|||||||
| Weighted average assumptions as of December 31: | |||||||||||||
| Discount Rate | 5.03 | % | 5.51 | % | 5.51 | % | 5.75 | % | 6.25 | % | 6.62 | % | |
| Expected return on plan assets | 7.26 | % | 7.29 | % | 7.00 | % | N/A | N/A | N/A | ||||
| Rate of compensation increase | 3.90 | % | 3.76 | % | 3.39 | % | 4.00 | % | 4.00 | % | 4.00 | % | |
The projected benefit obligation, accumulated benefit obligation, and fair value of plan assets for the defined benefit plans with accumulated benefit obligations in excess of plan assets were as follows (dollars in millions):
| |
2004 |
2003 |
||||
|---|---|---|---|---|---|---|
| Projected benefit obligation | $ | 1,709.8 | $ | 1,424.5 | ||
| Accumulated benefit obligation | 1,400.6 | 1,172.1 | ||||
| Fair value of plan assets | 1,402.1 | 1,176.8 | ||||
Expected future contributions and benefit payments are as follows for the U.S. plans (dollars in millions):
| |
Defined Benefit Plans |
Other Postretirement Benefit Plans |
|||||
|---|---|---|---|---|---|---|---|
| 2005 expected employer contributions: | |||||||
| To plan trusts | $ | 43.3 | $ | 0.8 | |||
| To plan participants | 0.5 | — | |||||
| Expected benefit payments: | |||||||
| 2005 | 62.1 | 0.8 | |||||
| 2006 | 63.2 | 0.8 | |||||
| 2007 | 63.7 | 0.8 | |||||
| 2008 | 68.6 | 0.8 | |||||
| 2009 | 69.1 | 0.8 | |||||
| 2010-2014 | 355.6 | 4.4 | |||||
The asset allocation for the Company's pension plans at the end of 2004 and the target allocation for 2005, by asset category, follows. The fair value of plan assets for these plans is $1,402.1 million at
F-32
the end of 2004. Based on historical returns, the expectations of the Company's investment committee and outside advisors, the long term rate of return on these assets is expected to be 7.26%.
| Asset category |
Target Allocation 2005 |
Allocation at December 31, 2004 |
Allocation at December 31, 2003 |
||||
|---|---|---|---|---|---|---|---|
| Large cap equities | 25-35% | 29 | % | 28 | % | ||
| Small/Mid cap equities | 15-25% | 22 | % | 21 | % | ||
| International equities | 10-20% | 16 | % | 15 | % | ||
| Fixed income | 15-25% | 18 | % | 19 | % | ||
| Real estate/other | 10-20% | 14 | % | 5 | % | ||
| Cash | 0-5% | 1 | % | 12 | % | ||
| Total U.S. plans | 100 | % | 100 | % | |||
Equities |
59% |
62 |
% |
62 |
% |
||
| Fixed income | 36% | 33 | % | 32 | % | ||
| Real estate | 4% | 3 | % | 4 | % | ||
| Cash | 1% | 2 | % | 2 | % | ||
| Total non-U.S. plans | 100 | % | 100 | % | |||
If the healthcare cost trend rate assumptions were increased by 1%, the postretirement benefit obligation as of December 31, 2004 would be increased by $1.3 million. The effect of this change on the sum of the service cost and interest cost would be an increase of $0.2 million. If the healthcare cost trend rate assumptions were decreased by 1%, the postretirement benefit obligation as of December 31, 2004 would be decreased by $1.1 million. The effect of this change on the sum of the service cost and interest cost would be a decrease of $0.1 million.
Equity securities in the Company's pension plans did not include any equity securities of the Company or its affiliates at the end of 2003.
The Company's employees participate in a trusteed, non-contributory defined benefit pension plan (the "Plan") that covers substantially all full-time employees of the Company. The Plan provides benefits based on years of service and final average salary. However, effective July 1, 2004, the existing Plan formula for employees not covered by a collective bargaining agreement was converted to a cash balance design. For represented employees, participation in the cash balance design is subject to the terms of negotiated contracts. For participating employees, benefits accrued as of June 30, 2004 under the prior formula were converted to opening cash balance accounts. The new cash balance benefit formula provides annual pay credits from 4% to 12% of eligible pay, depending on age and service, plus accrued interest. Participants in the plan on July 1, 2004 may be eligible for additional annual pay credits from 1% to 8%, depending on their age and service as of that date, for up to five years.
In May 2004, the FASB issued FASB Staff Position ("FSP") No. 106-2, "Accounting and Disclosure Requirements Related to the Medicare Prescription Drug, Improvement and Modernization Act of 2003." FSP No. 106-2 provides accounting guidance for the effects of the Medicare Prescription Drug, Improvement and Modernization Act of 2003 (the "Act") to a sponsor of a postretirement health care plan. On July 1, 2004, the Company adopted the provisions of FSP No. 106-2. The adoption of FSP No. 106-2 reduced the Company's non-pension postretirement accumulated benefit obligation by approximately $0.3 million, which has been recognized as a change in the Company's unrecognized actuarial gain (loss). The adoption of FSP No. 106-2 reduced the net periodic postretirement benefit cost recognized during the year ended December 31, 2004 by an insignificant amount.
F-33
Defined Contribution Plans
The Company has defined contribution plans covering its domestic employees and employees in some foreign subsidiaries who have completed at least two years of service.
The Company's total combined expense for the above defined contribution plans for the years ended December 31, 2004, 2003 and 2002 were approximately $7.4 million, $6.9 million, and $6.1 million.
18. Related Party Transactions
The Company shares numerous services and resources with Huntsman LLC and its subsidiaries. In accordance with various agreements, Huntsman LLC provides management, operating, maintenance, steam, electricity, water and other services to the Company. The Company also relies on Huntsman LLC to supply certain raw materials and to purchase products. Rubicon, LLC, and Louisiana Pigment Company are unconsolidated 50% owned affiliates of the Company. The amounts which the Company purchased from or sold to related parties are as follows (dollars in millions):
| |
Year Ended December 31, 2004 |
Year Ended December 31, 2003 |
Year Ended December 31, 2002 |
|||||||||||||||
|---|---|---|---|---|---|---|---|---|---|---|---|---|---|---|---|---|---|---|
| |
Purchases From |
Sales To |
Purchases From |
Sales To |
Purchases From |
Sales To |
||||||||||||
| Huntsman LLC and subsidiaries | $ | 204.3 | $ | 138.4 | $ | 200.9 | $ | 72.4 | $ | 226.6 | $ | 57.7 | ||||||
| ICI and subsidiaries(1) | — | — | 6.7 | 107.5 | 188.6 | 252.6 | ||||||||||||
| Other unconsolidated affiliates | 404.4 | 52.9 | 392.7 | 23.9 | 392.7 | 23.4 | ||||||||||||
Included in purchases from Huntsman LLC and its subsidiaries for the years ended December 31, 2004, 2003 and 2002 is $84.6 million, $74 million and $65 million, respectively, of allocated management costs which are reported in selling, general and administrative expenses.
The amounts which the Company is owed or owes to related parties are as follows (dollars in millions):
| |
December 31, 2004 |
December 31, 2003 |
||||||||||||||||||||||
|---|---|---|---|---|---|---|---|---|---|---|---|---|---|---|---|---|---|---|---|---|---|---|---|---|
| |
Receivables From |
Payables To |
Receivables From |
Payables To |
||||||||||||||||||||
| |
Current |
Non-current |
Current |
Non-current |
Current |
Non-current |
Current |
Non-current |
||||||||||||||||
| Huntsman LLC and subsidiaries | $ | 27.1 | $ | — | $ | 63.4 | $ | — | $ | 15.6 | $ | — | $ | 52.5 | $ | — | ||||||||
| Other unconsolidated affiliates | 8.8 | 10.8 | 35.7 | 29.9 | 10.3 | 13.5 | 25.2 | 29.1 | ||||||||||||||||
19. Commitments and Contingencies
The Company has various purchase commitments extending through 2023 for materials, supplies and services entered into in the ordinary course of business. The purchase commitments are contracts that require minimum volume purchases. Certain contracts allow for changes in minimum required purchase volumes in the event of a temporary or permanent shutdown of a facility. The contractual purchase price for substantially all of these contracts is variable based upon market prices, subject to annual negotiations. The Company has also entered into a limited number of contracts which require minimum payments, even if no volume is purchased. These contracts approximate $143 million in 2005, declining to approximately $17 million after 2009. Historically, the Company has not made any minimum payments under its take or pay contracts.
F-34
20. Fair Value of Financial Instruments
| |
As of December 31, 2004 |
As of December 31, 2003 |
||||||||||
|---|---|---|---|---|---|---|---|---|---|---|---|---|
| |
Carrying Amount |
Estimated Fair Value |
Carrying Amount |
Estimated Fair Value |
||||||||
| |
(Dollars in Millions) |
|||||||||||
| Total debt | $ | 3,054.8 | $ | 3,111.2 | $ | 2,927.1 | $ | 2,995.6 | ||||
| Notes receivable from affiliates | 10.8 | 10.8 | 13.5 | 13.5 | ||||||||
Interest rates that are currently available to the Company for issuance of debt with similar terms and remaining maturities are used to estimate fair value for debt issues that are not quoted on an exchange.
Other Financial Instruments
The carrying amount reported in the balance sheets for cash and cash equivalents, accounts receivable, and accounts payable approximates fair value because of the immediate or short-term maturity of these financial instruments.
The fair value estimates presented herein are based on pertinent information available to management as of December 31, 2004 and 2003. Although management is not aware of any factors that would significantly affect the estimated fair value amounts, such amounts have not been comprehensively revalued for purposes of these financial statements since that date, and current estimates of fair value may differ significantly from the amounts presented herein.
21. Legal Matters
The Company has settled certain claims relating to discoloration of unplasticized polyvinyl chloride products allegedly caused by its titanium dioxide ("Discoloration Claims") during and prior to the second quarter of 2004. Substantially all of the titanium dioxide that was the subject of these claims was manufactured prior to the Company's acquisition of its titanium dioxide business from ICI in 1999. Net of amounts it has received from insurers and pursuant to contracts of indemnity, the Company has paid approximately £8 million ($14.9 million) in costs and settlement amounts for Discoloration Claims as of December 31, 2004.
The following table presents information about the number of Discoloration Claims for the periods indicated. Claims include all claims for which service has been received by the Company, and each such claim represents a plaintiff who is pursuing a claim against the Company.
| |
Year ended December 31, 2004 |
Year ended December 31, 2003 |
Year ended December 31, 2002 |
|||
|---|---|---|---|---|---|---|
| Claims filed during period | 1 | 1 | 0 | |||
| Claims resolved during period | 2 | 2 | 0 | |||
| Claims unresolved at end of period | 3 | 4 | 5 |
The five Discoloration Claims unresolved at the end of 2002 included three claims that did not quantify monetary damages and two claims asserting aggregate damages of approximately $4.5 million. During the year ended December 31, 2003, the Company settled claims for approximately $77.7 million, all of which was paid by its insurers or ICI. The four Discoloration Claims unresolved at the end of 2003 included two claims that did not quantify monetary damages and two claims asserting aggregate damages of approximately $4.5 million. During the year ended December 31, 2004, the Company settled claims for approximately $45.3 million, approximately $30.4 million of which was paid by its insurers or ICI and approximately $14.9 million of which was paid by it. During 2004, the Company
F-35
recorded charges of $15.1 million relating to Discoloration Claims. The three Discoloration Claims unresolved on December 31, 2004 asserted aggregate damages of approximately $6.7 million. A liability has been accrued for these Discoloration Claims. In March 2005, one of these Discoloration Claims was amended to assert additional damages of approximately $56 million. Based on the Company's understanding of the merits of this claim and its rights under contracts of indemnity and insurance, the Company does not believe that the net impact on its financial condition, results of operations or liquidity will be material.
While additional Discoloration Claims may be made in the future, the Company cannot reasonably estimate the amount of loss related to such claims. Although the Company may incur additional costs as a result of future claims (including settlement costs), based on its history with Discoloration Claims to date, the fact that substantially all of the titanium dioxide that has been the subject of these Discoloration Claims was manufactured and sold more than five years ago, and the fact that it has rights under contract to indemnity, including from ICI, the Company does not believe that any unasserted possible Discoloration Claims, if any, will have a material impact on its financial condition, results of operations or liquidity. Based on this conclusion and the Company's inability to reasonably estimate its expected costs with respect to these unasserted possible claims, the Company has made no accruals in the Company's financial statements as of December 31, 2004 for costs associated with unasserted possible Discoloration Claims, if any.
Certain insurers have denied coverage with respect to certain Discoloration Claims. The Company brought suit against these insurers to recover the amounts it believes are due to it. The court found in favor of the insurers, and the Company lodged an application for leave to appeal that decision. Leave to appeal was granted in December 2004. The Company expects the appeal to be heard during the third quarter of 2005.
The Company is a party to various other proceedings instituted by private plaintiffs, governmental authorities and others arising under provisions of applicable laws, including various environmental, products liability and other laws. Except as otherwise disclosed in this report, the Company does not believe that the outcome of any of these matters will have a material adverse effect on its financial condition, results of operations or liquidity. See "Note 22—Environmental, Health and Safety Matters" for a discussion of environmental proceedings.
22. Environmental, Health and Safety Matters
General
The Company is subject to extensive federal, state, local and foreign laws, regulations, rules and ordinances relating to pollution, protection of the environment and the generation, storage, handling, transportation, treatment, disposal and remediation of hazardous substances and waste materials. In the ordinary course of business, the Company is subject to frequent environmental inspections and monitoring and occasional investigations by governmental enforcement authorities. In addition, the Company's production facilities require operating permits that are subject to renewal, modification and, in certain circumstances, revocation. Actual or alleged violations of environmental laws or permit requirements could result in restrictions or prohibitions on plant operations, substantial civil or criminal sanctions, as well as, under some environmental laws, the assessment of strict liability and/or joint and several liability. Moreover, changes in environmental regulations could inhibit or interrupt the Company's operations, or require it to modify its facilities or operations. Accordingly, environmental or regulatory matters may cause the Company to incur significant unanticipated losses, costs or liabilities.
Environmental, Health and Safety Systems
The Company is committed to achieving and maintaining compliance with all applicable environmental, health and safety ("EHS") legal requirements, and the Company has developed policies
F-36
and management systems that are intended to identify the multitude of EHS legal requirements applicable to its operations, enhance compliance with applicable legal requirements, ensure the safety of its employees, contractors, community neighbors and customers and minimize the production and emission of wastes and other pollutants. Although EHS legal requirements are constantly changing and are frequently difficult to comply with, these EHS management systems are designed to assist the Company in its compliance goals while also fostering efficiency and improvement and minimizing overall risk to the Company.
EHS Capital Expenditures
The Company may incur future costs for capital improvements and general compliance under EHS laws, including costs to acquire, maintain and repair pollution control equipment. Since capital expenditures for these matters are subject to evolving regulatory requirements and depend, in part, on the timing, promulgation and enforcement of specific requirements, the Company cannot provide assurance that its expenditures will be indicative of future amounts required under EHS laws. The Company's EHS capital expenditures for 2004 and 2003 were $27.8 million and $31.0 million, respectively. Capital costs relating to environmental matters in 2005 are expected to total approximately $32 million. A total of $21.2 million has been accrued related to environmental related liabilities as of December 31, 2004.
Governmental Enforcement Proceedings
On occasion, the Company receive notices of violation, enforcement and other complaints from regulatory agencies alleging non-compliance with applicable EHS law. By way of example, the Company is aware of the individual matters set out below, which the Company believes to be the most significant presently pending matters and unasserted claims. Although the Company may incur costs or penalties in connection with the governmental proceedings discussed below, based on currently available information and its past experience, the Company believes that the ultimate resolution of these matters will not have a material impact on the Company's results of operations, financial position or liquidity.
In the third quarter of 2004, the Company's Jefferson County, Texas facilities received notification from the Texas Commission on Environmental Quality ("TCEQ") of potential air emission violations relating to alleged upset air emissions. The Company has investigated the allegations and responded in writing to TCEQ. TCEQ has proposed a penalty of $174,219 for the alleged upset violations. Negotiations are anticipated between the Company and TCEQ with respect to the resolution of these alleged violations. The Company does not believe that the final cost to resolve these matters will be material.
See "Item 3. Legal Proceedings" for a discussion of environmental lawsuits brought by private party plaintiffs.
Remediation Liabilities
The Company has incurred, and it may in the future incur, liability to investigate and clean up waste or contamination at its current or former facilities or facilities operated by third parties at which it may have disposed of waste or other materials. Similarly, the Company may incur costs for the cleanup of wastes that were disposed of prior to the purchase of its businesses. Under some circumstances, the scope of the Company's liability may extend to damages to natural resources. Specifically, under the U.S. Comprehensive Environmental Response, Compensation and Liability Act of 1980, as amended ("CERCLA"), and similar state laws, a current or former owner or operator of real property may be liable for remediation costs regardless of whether the release or disposal of hazardous substances was in compliance with law at the time it occurred, and a current owner or operator may be liable regardless of whether it owned or operated the facility at the time of the
F-37
release. In addition, under the U.S. Resource Conservation and Recovery Act of 1976, as amended ("RCRA"), and similar state laws, the Company may be required to remediate contamination originating from the Company's properties as a condition to its hazardous waste permit. In many cases, the Company's potential liability arising from historical contamination is based on operations and other events occurring prior to its ownership of the relevant facility. In these situations, the Company obtained an indemnity agreement from the prior owner addressing remediation liabilities arising from pre-closing conditions. The Company make no assurance, however, that its existing indemnities will be sufficient to cover its liabilities for such matters.
Environmental Reserves
The Company has established financial reserves relating to anticipated environmental cleanup obligations, site reclamation and closure costs and known penalties. Liabilities are recorded when potential liabilities are either known or considered probable and can be reasonably estimated. The Company's liability estimates are based upon available facts, existing technology and past experience. On a consolidated basis, the Company has accrued a total of approximately $21.2 million for environmental-related liabilities as of December 31, 2004. The Company believes these reserves are sufficient for known requirements relating to these matters. The Company may incur losses for environmental remediation in excess of the amounts accrued; however, the Company is not able to estimate the amount or range of such losses.
Regulatory Developments
Under the European Union ("EU") Integrated Pollution Prevention and Control Directive ("IPPC"), EU member governments are to adopt rules and implement a cross-media (air, water and waste) environmental permitting program for individual facilities. While the EU countries are at varying stages in their respective implementation of the IPPC permit program, the Company has submitted all necessary IPPC permit applications required to date, and in some cases received completed permits from the applicable government agency. The Company expects to submit all other IPPC applications and related documents on a timely basis as the various countries implement the IPPC permit program. Although the Company does not know with certainty what each IPPC permit will require, it believes, based upon its experience with the permits received to date, that the costs of compliance with the IPPC permit program will not be material to its results of operations, financial position or liquidity.
In October 2003, the European Commission adopted a proposal for a new EU regulatory framework for chemicals. Under this proposed new system called "REACH" (Registration, Evaluation and Authorization of Chemicals), companies that manufacture or import more than one ton of a chemical substance per year would be required to register such manufacture or import in a central database. The REACH initiative, as proposed, would require risk assessment of chemicals, preparations (e.g., soaps and paints) and articles (e.g., consumer products) before those materials could be manufactured or imported into EU countries. Where warranted by a risk assessment, hazardous substances would require authorizations for their use. This regulation could impose risk control strategies that would require capital expenditures by us. As proposed, REACH would take effect in three primary stages over the eleven years following the final effective date (assuming final approval). The impacts of REACH on the chemical industry and on us are unclear at this time because the parameters of the program are still being actively debated.
MTBE Developments
The use of MTBE is controversial in the U.S. and elsewhere and may be substantially curtailed or eliminated in the future by legislation or regulatory action. The presence of MTBE in some groundwater supplies in California and other states (primarily due to gasoline leaking from
F-38
underground storage tanks) and in surface water (primarily from recreational watercraft) has led to public concern about MTBE's potential to contaminate drinking water supplies. Heightened public awareness regarding this issue has resulted in state, federal and foreign initiatives to rescind the federal oxygenate requirements for reformulated gasoline or restrict or prohibit the use of MTBE in particular. For example, California, New York and Connecticut have adopted rules that prohibit the use of MTBE in gasoline sold in those states as of January 1, 2004. Overall, states that have taken some action to prohibit or restrict the use of MTBE in gasoline account for a substantial portion of the "pre-ban" U.S. MTBE market. Thus far, attempts by others to challenge these state bans in federal court under the reformulated gasoline provisions of the federal Clean Air Act have been unsuccessful.
The U.S. Congress has been considering legislation that would eliminate the oxygenated fuels requirements in the Clean Air Act and phase out or curtail MTBE use over a period of several years. To date, no such legislation has become law. If it were to become law it could result in a federal phase-out of the use of MTBE in gasoline in the U.S., but it would not prevent the Company from manufacturing MTBE in its plants. In addition, in March 2000, the EPA announced its intention, through an advanced notice of proposed rulemaking, to phase out the use of MTBE under authority of the federal Toxic Substances Control Act. EPA has not yet acted on this proposal, however. In Europe, the EU issued a final risk assessment report on MTBE in September 2002. No ban of MTBE was recommended, though several risk reduction measures relating to storage and handling of MTBE-containing fuel were recommended.
The Company currently markets approximately 95% of its MTBE to customers located in the U.S. for use as a gasoline additive. Any phase-out or other future regulation of MTBE in other jurisdictions, nationally or internationally, may result in a significant reduction in demand for the Company's MTBE and in a material loss in revenues or material costs or expenditures. In the event that there should be a complete phase-out of MTBE in the U.S., the Company believes it will be able to export MTBE to Europe, Asia or South America, although this may produce a lower level of cash flow than the sale of MTBE in the U.S. The Company may also elect to use all or a portion of its precursor TBA to produce saleable products other than MTBE. If the Company opts to produce products other than MTBE, necessary modifications to its facilities may require significant capital expenditures and the sale of the other products may produce a materially lower level of cash flow than the sale of MTBE.
In addition to the use limitations described above, a number of lawsuits have been filed, primarily against gasoline manufacturers, marketers and distributors, by persons seeking to recover damages allegedly arising from the presence of MTBE in groundwater. While the Company has not been named as a defendant in any litigation concerning the environmental effects of MTBE, it cannot provide assurances that it will not be involved in any such litigation or that such litigation will not have a material adverse effect on its results of operations, financial position or liquidity.
F-39
Other operating income consists of the following (dollars in millions):
| |
Year Ended December 31, |
|||||||||
|---|---|---|---|---|---|---|---|---|---|---|
| |
2004 |
2003 |
2002 |
|||||||
| Foreign exchange (gains) losses | $ | (67.6 | ) | $ | (91.9 | ) | $ | (48.3 | ) | |
| Bad debts | 2.0 | 10.2 | 4.1 | |||||||
| Legal settlements | 15.1 | — | — | |||||||
| Information systems implementation costs | — | — | 3.8 | |||||||
| Other | 36.1 | 16.1 | 33.8 | |||||||
| Total other operating income | $ | (14.4 | ) | $ | (65.6 | ) | $ | (6.6 | ) | |
24. Other Income (Expense)
Other income (expense) is comprised of the following significant items (dollars in millions):
| |
Year Ended December 31, |
||||||||
|---|---|---|---|---|---|---|---|---|---|
| |
2004 |
2003 |
2002 |
||||||
| Loss on early extinguishment of debt | (19.5 | ) | — | — | |||||
| Other | — | (1.3 | ) | 1.3 | |||||
| Total | $ | (19.5 | ) | $ | (1.3 | ) | $ | 1.3 | |
25. Operating Segment Information
The Company derives its revenues, earnings and cash flows from the manufacture and sale of a wide variety of differentiated and commodity chemical products. The Company has four reportable operating segments: Polyurethanes, Performance Products, Pigments and Base Chemicals. Sales between segments are generally recognized at external market prices.
The major products of each reportable operating segment are as follows:
| Segment |
Products |
|
|---|---|---|
| Polyurethanes | MDI, TDI, TPU, polyols, aniline, PO and MTBE | |
| Performance Products | Surfactants, ethyleneamines and other performance chemicals | |
| Pigments | Titanium dioxide | |
| Base Chemicals | Ethylene, propylene, benzene, cyclohexane and paraxylene |
The Company uses EBITDA to measure the financial performance of its global business units and for reporting the results of its operating segments. This measure includes all operating items relating to the businesses. The EBITDA of operating segments excludes items that principally apply to the Company as a whole. The Company believes that EBITDA is useful in helping investors assess the
F-40
results of its business operations. The revenues and EBITDA for each of the Company's reportable operating segments are as follows (dollars in millions):
| |
Year Ended December 31, 2004 |
Year Ended December 31, 2003 |
Year Ended December 31, 2002 |
||||||||||
|---|---|---|---|---|---|---|---|---|---|---|---|---|---|
| Revenues: | |||||||||||||
| Polyurethanes | $ | 2,877.4 | $ | 2,297.5 | $ | 2,066.0 | |||||||
| Performance Products | 751.3 | 659.6 | 574.3 | ||||||||||
| Pigments | 1,048.1 | 1,009.9 | 880.3 | ||||||||||
| Base Chemicals | 2,118.5 | 1,421.8 | 1,097.5 | ||||||||||
| Eliminations | (291.9 | ) | (143.3 | ) | (100.0 | ) | |||||||
| Total | $ | 6,503.4 | $ | 5,245.5 | $ | 4,518.1 | |||||||
| EBITDA(1): | |||||||||||||
| Polyurethanes | $ | 364.0 | $ | 233.4 | $ | 365.1 | |||||||
| Performance Products | (69.1 | ) | (15.8 | ) | 27.2 | ||||||||
| Pigments | (30.0 | ) | 105.4 | 68.3 | |||||||||
| Base Chemicals | 206.9 | 77.7 | 13.8 | ||||||||||
| Corporate and other items(2) | (13.3 | ) | 19.4 | 5.8 | |||||||||
| Total EBITDA | 458.5 | 420.1 | 480.2 | ||||||||||
| Interest expense, net | (254.2 | ) | (251.5 | ) | (245.4 | ) | |||||||
| Income tax benefit (expense) | 58.6 | (21.6 | ) | 41.5 | |||||||||
| Depreciation and amortization | (312.4 | ) | (277.9 | ) | (256.2 | ) | |||||||
| Net (loss) income | $ | (49.5 | ) | $ | (130.9 | ) | $ | 20.1 | |||||
| Depreciation and Amortization: | |||||||||||||
| Polyurethanes | $ | 147.7 | $ | 142.6 | $ | 134.7 | |||||||
| Performance Products | 13.5 | 12.7 | 10.6 | ||||||||||
| Pigments | 85.6 | 65.2 | 54.2 | ||||||||||
| Base Chemicals | 60.6 | 49.9 | 47.3 | ||||||||||
| Corporate and other items(2) | 5.0 | 7.5 | 9.4 | ||||||||||
| Total | $ | 312.4 | $ | 277.9 | $ | 256.2 | |||||||
| Capital Expenditures: | |||||||||||||
| Polyurethanes | $ | 45.8 | $ | 39.1 | $ | 58.3 | |||||||
| Performance Products | 12.3 | 12.2 | 11.5 | ||||||||||
| Pigments | 42.7 | 51.7 | 97.4 | ||||||||||
| Base Chemicals | 40.5 | 24.4 | 23.3 | ||||||||||
| Corporate and other items | — | — | — | ||||||||||
| Total | $ | 141.3 | $ | 127.4 | $ | 190.5 | |||||||
| Total Assets: | |||||||||||||
| Polyurethanes | $ | 4,056.0 | $ | 3,733.9 | $ | 3,489.4 | |||||||
| Performance Products | 291.3 | 307.6 | 307.7 | ||||||||||
| Pigments | 1,514.5 | 1,554.5 | 1,502.8 | ||||||||||
| Base Chemicals | 1,455.1 | 1,168.2 | 1,052.6 | ||||||||||
| Corporate and other items(2) | 3,613.4 | 3,585.8 | 3,372.7 | ||||||||||
| Eliminations | (5,081.4 | ) | (4,857.3 | ) | (4,557.9 | ) | |||||||
| Total | $ | 5,848.9 | $ | 5,492.7 | $ | 5,167.3 | |||||||
F-41
| |
(In millions) |
||||||||||||
|---|---|---|---|---|---|---|---|---|---|---|---|---|---|
| |
Year Ended December 31, 2004 |
Year Ended December 31, 2003 |
Year Ended December 31, 2002 |
||||||||||
| By Geographic Area | |||||||||||||
Revenues: |
|||||||||||||
| United States | $ | 2,213.4 | $ | 1,853.1 | $ | 1,742.4 | |||||||
| United Kingdom | 2,637.1 | 1,927.0 | 1,537.9 | ||||||||||
| Netherlands | 1,274.6 | 1,019.8 | 894.6 | ||||||||||
| Other nations | 1,815.2 | 1,640.6 | 1,457.6 | ||||||||||
| Adjustments and eliminations | (1,436.9 | ) | (1,195.0 | ) | (1,114.4 | ) | |||||||
| Total | $ | 6,503.4 | $ | 5,245.5 | $ | 4,518.1 | |||||||
| Long-lived Assets: | |||||||||||||
| United States | $ | 807.9 | $ | 858.0 | $ | 901.6 | |||||||
| United Kingdom | 1,084.7 | 1,133.5 | 1,077.8 | ||||||||||
| Netherlands | 402.6 | 410.6 | 366.7 | ||||||||||
| Other nations | 888.5 | 854.1 | 725.0 | ||||||||||
| Total | $ | 3,183.7 | $ | 3,256.2 | $ | 3,071.1 | |||||||
26. Selected Unaudited Quarterly Financial Data
A summary of selected unaudited quarterly financial data for the years ended December 31, 2004 and 2003 is as follows (dollars in millions):
| |
Three Months Ended March 31, 2004 |
Three Months Ended June 30, 2004 |
Three Months Ended September 30, 2004 |
Three Months Ended December 31, 2004 |
Year Ended December 31, 2004 |
|||||||||||
|---|---|---|---|---|---|---|---|---|---|---|---|---|---|---|---|---|
| Revenues | $ | 1,498.1 | $ | 1,623.7 | $ | 1,651.6 | $ | 1,730.0 | $ | 6,503.4 | ||||||
| Gross profit | 148.1 | 231.4 | 226.7 | 218.7 | 824.9 | |||||||||||
| Restructuring and plant closing costs | 8.7 | 124.9 | 37.9 | 78.0 | 249.5 | |||||||||||
| Operating income | 39.4 | (19.9 | ) | 83.3 | 78.4 | 181.2 | ||||||||||
| Net (loss) income | (36.9 | ) | (90.5 | ) | 80.9 | (3.0 | ) | (49.5 | ) | |||||||
| |
Three Months Ended March 31, 2003 |
Three Months Ended June 30, 2003 |
Three Months Ended September 30, 2003 |
Three Months Ended December 31, 2003 |
Year Ended December 31, 2003 |
|||||||||||
|---|---|---|---|---|---|---|---|---|---|---|---|---|---|---|---|---|
| Revenues | $ | 1,297.7 | $ | 1,307.4 | $ | 1,275.7 | $ | 1,364.7 | $ | 5,245.5 | ||||||
| Gross profit | 135.4 | 154.4 | 136.4 | 158.2 | 584.4 | |||||||||||
| Restructuring and plant closing costs | 17.1 | 21.5 | 4.8 | 13.3 | 56.7 | |||||||||||
| Operating income: | 35.0 | 52.4 | 32.5 | 56.0 | 175.9 | |||||||||||
| Net loss | (32.1 | ) | (22.3 | ) | (25.9 | ) | (50.6 | ) | (130.9 | ) | ||||||
27. Condensed Consolidating Financial Statements
The following condensed consolidating financial statements present, in separate columns, financial information for the following: Huntsman International LLC (on a parent only basis), with its investment in subsidiaries recorded under the equity method; the HI Guarantors on a combined, and where appropriate, consolidated basis; and the non-guarantors on a combined, and where appropriate, consolidated basis. Additional columns present eliminating adjustments and consolidated totals as of December 31, 2004 and December 31, 2003 and for the periods ended December 31, 2004, 2003, and 2002. There are no contractual restrictions limiting transfers of cash from guarantor subsidiaries to the Company. Each of the HI Guarantors is 100% owned by the Company and has fully and unconditionally guaranteed the HI Senior Notes and the HI Subordinated Notes on a joint and several basis. The Company has not presented separate financial statements and other disclosures for each of the HI Guarantors because management believes that such information is not material to investors.
F-42
HUNTSMAN INTERNATIONAL LLC AND SUBSIDIARIES
CONDENSED CONSOLIDATING BALANCE SHEETS
AS OF DECEMBER 31, 2004
(Dollars in Millions)
| |
Parent Only Huntsman International |
Guarantors |
Non- Guarantors |
Eliminations |
Consolidated Huntsman International |
||||||||||||
|---|---|---|---|---|---|---|---|---|---|---|---|---|---|---|---|---|---|
| ASSETS | |||||||||||||||||
Current Assets: |
|||||||||||||||||
| Cash and cash equivalents | $ | 7.4 | $ | (0.4 | ) | $ | 131.0 | $ | — | $ | 138.0 | ||||||
| Accounts and notes receivables, net | 72.2 | 102.8 | 731.2 | (100.2 | ) | 806.0 | |||||||||||
| Inventories | 81.3 | 85.0 | 569.3 | — | 735.6 | ||||||||||||
| Prepaid expenses | 2.4 | 1.8 | 26.6 | — | 30.8 | ||||||||||||
| Deferred tax asset | — | — | 10.2 | — | 10.2 | ||||||||||||
| Other current assets | 59.5 | 401.6 | 71.5 | (482.1 | ) | 50.5 | |||||||||||
| Total current assets | 222.8 | 590.8 | 1,539.8 | (582.3 | ) | 1,771.1 | |||||||||||
| Property, plant and equipment, net | 494.0 | 313.9 | 2,375.8 | — | 3,183.7 | ||||||||||||
| Investment in unconsolidated affiliates | 3,814.7 | 788.2 | 18.9 | (4,475.6 | ) | 146.2 | |||||||||||
| Intangible assets, net | 230.6 | 2.9 | 20.5 | — | 254.0 | ||||||||||||
| Notes receivable—affiliates | 10.8 | 1,889.9 | — | (1,889.9 | ) | 10.8 | |||||||||||
| Other noncurrent assets | 65.2 | 28.0 | 389.9 | — | 483.1 | ||||||||||||
| Total assets | $ | 4,838.1 | $ | 3,613.7 | $ | 4,344.9 | $ | (6,947.8 | ) | $ | 5,848.9 | ||||||
LIABILITIES AND EQUITY |
|||||||||||||||||
Current liabilities: |
|||||||||||||||||
| Accounts payable | $ | 70.2 | $ | 105.4 | $ | 612.9 | $ | (100.2 | ) | $ | 688.3 | ||||||
| Accrued liabilities | 456.4 | 32.9 | 412.5 | (482.1 | ) | 419.7 | |||||||||||
| Current portion of long-term debt | 1.6 | — | 8.9 | — | 10.5 | ||||||||||||
| Total current liabilities | 528.2 | 138.3 | 1,034.3 | (582.3 | ) | 1,118.5 | |||||||||||
| Long-term debt | 3,046.5 | — | 1,887.7 | (1,889.9 | ) | 3,044.3 | |||||||||||
| Deferred income taxes | — | — | 179.2 | — | 179.2 | ||||||||||||
| Notes payable—affiliates | 29.9 | — | — | — | 29.9 | ||||||||||||
| Other noncurrent liabilities | 34.8 | 0.2 | 234.5 | — | 269.5 | ||||||||||||
| Total liabilities | 3,639.4 | 138.5 | 3,335.7 | (2,472.2 | ) | 4,641.4 | |||||||||||
| Minority interests | — | — | 8.8 | — | 8.8 | ||||||||||||
| Equity: | |||||||||||||||||
| Member's equity | 1,026.1 | — | — | — | 1,026.1 | ||||||||||||
| Subsidiary equity | — | 2,198.3 | 1,128.0 | (3,326.3 | ) | — | |||||||||||
| Retained earnings | 6.1 | 736.0 | (146.6 | ) | (589.4 | ) | 6.1 | ||||||||||
| Accumulated other bcomprehensive income | 166.5 | 540.9 | 19.0 | (559.9 | ) | 166.5 | |||||||||||
| Total equity | 1,198.7 | 3,475.2 | 1,000.4 | (4,475.6 | ) | 1,198.7 | |||||||||||
| Total liabilities and equity | $ | 4,838.1 | $ | 3,613.7 | $ | 4,344.9 | $ | (6,947.8 | ) | $ | 5,848.9 | ||||||
F-43
HUNTSMAN INTERNATIONAL LLC AND SUBSIDIARIES
CONDENSED CONSOLIDATING BALANCE SHEETS
AS OF DECEMBER 31, 2003
(Dollars in Millions)
| |
Parent Only Huntsman International |
Guarantors |
Non- Guarantors |
Eliminations |
Consolidated Huntsman International |
||||||||||||
|---|---|---|---|---|---|---|---|---|---|---|---|---|---|---|---|---|---|
| ASSETS | |||||||||||||||||
Current Assets: |
|||||||||||||||||
| Cash and cash equivalents | $ | 16.6 | $ | (0.3 | ) | $ | 81.5 | $ | — | $ | 97.8 | ||||||
| Accounts and notes receivables, net | 63.5 | 91.3 | 515.0 | (105.4 | ) | 564.4 | |||||||||||
| Inventories | 47.9 | 78.6 | 470.4 | — | 596.9 | ||||||||||||
| Prepaid expenses | 5.8 | 1.7 | 16.1 | — | 23.6 | ||||||||||||
| Deferred tax asset | — | — | 3.0 | — | 3.0 | ||||||||||||
| Other current assets | 224.1 | 316.9 | 85.5 | (542.9 | ) | 83.6 | |||||||||||
| Total current assets | 357.9 | 488.2 | 1,171.5 | (648.3 | ) | 1,369.3 | |||||||||||
| Property, plant and equipment, net | 526.5 | 331.5 | 2,398.2 | — | 3,256.2 | ||||||||||||
| Investment in unconsolidated affiliates | 3,356.8 | 791.8 | 7.3 | (4,017.2 | ) | 138.7 | |||||||||||
| Intangible assets, net | 259.5 | 4.6 | 19.3 | — | 283.4 | ||||||||||||
| Notes receivable—affiliates | 13.5 | — | — | — | 13.5 | ||||||||||||
| Other noncurrent assets | 67.0 | 1,696.9 | 355.2 | (1,687.5 | ) | 431.6 | |||||||||||
| Total assets | $ | 4,581.2 | $ | 3,313.0 | $ | 3,951.5 | $ | (6,353.0 | ) | $ | 5,492.7 | ||||||
LIABILITIES AND EQUITY |
|||||||||||||||||
Current liabilities: |
|||||||||||||||||
| Accounts payable | $ | 64.0 | $ | 68.3 | $ | 533.9 | $ | (104.9 | ) | $ | 561.3 | ||||||
| Accrued liabilities | 381.4 | 40.1 | 509.6 | (543.4 | ) | 387.7 | |||||||||||
| Current portion of long- term debt | 1.7 | — | 0.1 | — | 1.8 | ||||||||||||
| Total current liabilities | 447.1 | 108.4 | 1,043.6 | (648.3 | ) | 950.8 | |||||||||||
| Long-term debt | 2,926.5 | — | 1,686.3 | (1,687.5 | ) | 2,925.3 | |||||||||||
| Deferred income taxes | — | — | 234.8 | — | 234.8 | ||||||||||||
| Notes payable—affiliates | 29.1 | — | — | — | 29.1 | ||||||||||||
| Other noncurrent liabilities | 24.8 | — | 170.6 | — | 195.4 | ||||||||||||
| Total liabilities | 3,427.5 | 108.4 | 3,135.3 | (2,335.8 | ) | 4,335.4 | |||||||||||
| Minority interests | — | — | 3.6 | — | 3.6 | ||||||||||||
| Equity: | |||||||||||||||||
| Member's equity | 1,026.1 | — | — | — | 1,026.1 | ||||||||||||
| Subsidiary equity | — | 2,220.0 | 874.0 | (3,094.0 | ) | — | |||||||||||
| Retained earnings | 55.6 | 591.1 | (58.1 | ) | (533.0 | ) | 55.6 | ||||||||||
| Accumulated other comprehensive income (loss) | 72.0 | 393.5 | (3.3 | ) | (390.2 | ) | 72.0 | ||||||||||
| Total equity | 1,153.7 | 3,204.6 | 812.6 | (4,017.2 | ) | 1,153.7 | |||||||||||
| Total liabilities and equity | $ | 4,581.2 | $ | 3,313.0 | $ | 3,951.5 | $ | (6,353.0 | ) | $ | 5,492.7 | ||||||
F-44
HUNTSMAN INTERNATIONAL LLC AND SUBSIDIARIES
CONDENSED CONSOLIDATING STATEMENTS OF OPERATIONS AND COMPREHENSIVE INCOME (LOSS)
YEAR ENDED DECEMBER 31, 2004
(Dollars in Millions)
| |
Parent Only Huntsman International |
Guarantors |
Non- Guarantors |
Eliminations |
Consolidated Huntsman International |
|||||||||||||
|---|---|---|---|---|---|---|---|---|---|---|---|---|---|---|---|---|---|---|
| Revenues: | ||||||||||||||||||
| Trade sales, services, and fees | $ | 821.2 | $ | 739.8 | $ | 4,751.1 | $ | — | $ | 6,312.1 | ||||||||
| Related party sales | 181.3 | 228.3 | 85.0 | (303.3 | ) | 191.3 | ||||||||||||
| Total revenue | 1,002.5 | 968.1 | 4,836.1 | (303.3 | ) | 6,503.4 | ||||||||||||
| Cost of goods sold | 818.7 | 875.6 | 4,287.5 | (303.3 | ) | 5,678.5 | ||||||||||||
| Gross profit | 183.8 | 92.5 | 548.6 | — | 824.9 | |||||||||||||
Expenses: |
||||||||||||||||||
| Selling, general and administrative | 77.2 | 19.5 | 271.0 | — | 367.7 | |||||||||||||
| Research and development | 32.2 | 1.5 | 7.2 | — | 40.9 | |||||||||||||
| Other operating (income) expense | (7.3 | ) | (12.1 | ) | 5.0 | — | (14.4 | ) | ||||||||||
| Restructuring and plant closing costs | — | — | 249.5 | — | 249.5 | |||||||||||||
| Total expenses | 102.1 | 8.9 | 532.7 | — | 643.7 | |||||||||||||
| Operating income | 81.7 | 83.6 | 15.9 | — | 181.2 | |||||||||||||
Interest (expense) income, net |
(260.5 |
) |
152.8 |
(146.5 |
) |
— |
(254.2 |
) |
||||||||||
| Gain (loss) on sale of accounts receivable | 3.6 | (2.0 | ) | (17.2 | ) | — | (15.6 | ) | ||||||||||
| Equity in earnings (losses) of unconsolidated affiliates | 145.2 | (88.8 | ) | — | (56.4 | ) | — | |||||||||||
| Other (expense) income | (19.5 | ) | (0.7 | ) | 0.7 | — | (19.5 | ) | ||||||||||
| (Loss) income before income taxes | (49.5 | ) | 144.9 | (147.1 | ) | (56.4 | ) | (108.1 | ) | |||||||||
| Income tax expense | — | — | 58.6 | — | 58.6 | |||||||||||||
| Net (loss) income | (49.5 | ) | 144.9 | (88.5 | ) | (56.4 | ) | (49.5 | ) | |||||||||
Other comprehensive income |
94.5 |
147.4 |
22.3 |
(169.7 |
) |
94.5 |
||||||||||||
| Comprehensive income (loss) | $ | 45.0 | $ | 292.3 | $ | (66.2 | ) | $ | (226.1 | ) | $ | 45.0 | ||||||
F-45
HUNTSMAN INTERNATIONAL LLC AND SUBSIDIARIES
CONDENSED CONSOLIDATING STATEMENTS OF OPERATIONS AND COMPREHENSIVE INCOME (LOSS)
YEAR ENDED DECEMBER 31, 2003
(Dollars in Millions)
| |
Parent Only Huntsman International |
Guarantors |
Non- Guarantors |
Eliminations |
Consolidated Huntsman International |
|||||||||||||
|---|---|---|---|---|---|---|---|---|---|---|---|---|---|---|---|---|---|---|
| Revenues: | ||||||||||||||||||
| Trade sales, services, and fees | $ | 705.0 | $ | 676.0 | $ | 3,660.7 | $ | — | $ | 5,041.7 | ||||||||
| Related party sales | 138.7 | 118.6 | 201.0 | (254.5 | ) | 203.8 | ||||||||||||
| Total revenue | 843.7 | 794.6 | 3,861.7 | (254.5 | ) | 5,245.5 | ||||||||||||
| Cost of goods sold | 684.4 | 717.6 | 3,513.6 | (254.5 | ) | 4,661.1 | ||||||||||||
| Gross profit | 159.3 | 77.0 | 348.1 | — | 584.4 | |||||||||||||
Expenses: |
||||||||||||||||||
| Selling, general and administrative | 65.2 | (3.4 | ) | 240.6 | — | 302.4 | ||||||||||||
| Research and development | 37.7 | 1.9 | 9.8 | — | 49.4 | |||||||||||||
| Restructuring and plant closing costs | — | — | 56.7 | — | 56.7 | |||||||||||||
| Total expenses | 102.9 | (1.5 | ) | 307.1 | — | 408.5 | ||||||||||||
| Operating income | 56.4 | 78.5 | 41.0 | — | 175.9 | |||||||||||||
Interest (expense) income, net |
(254.4 |
) |
150.0 |
(147.1 |
) |
— |
(251.5 |
) |
||||||||||
| (Loss) gain on sale of accounts receivable | (64.3 | ) | (2.8 | ) | 34.7 | — | (32.4 | ) | ||||||||||
| Equity in earnings (losses) of unconsolidated affiliates | 132.7 | (141.1 | ) | — | 8.4 | — | ||||||||||||
| Other expense | (1.3 | ) | — | — | — | (1.3 | ) | |||||||||||
| (Loss) income before income taxes | (130.9 | ) | 84.6 | (71.4 | ) | 8.4 | (109.3 | ) | ||||||||||
| Income tax expense | — | — | (21.6 | ) | — | (21.6 | ) | |||||||||||
| Net (loss) income | (130.9 | ) | 84.6 | (93.0 | ) | 8.4 | (130.9 | ) | ||||||||||
Other comprehensive income |
219.4 |
492.6 |
106.8 |
(599.4 |
) |
219.4 |
||||||||||||
| Comprehensive income | $ | 88.5 | $ | 577.2 | $ | 13.8 | $ | (591.0 | ) | $ | 88.5 | |||||||
F-46
HUNTSMAN INTERNATIONAL LLC AND SUBSIDIARIES
CONDENSED CONSOLIDATING STATEMENTS OF OPERATIONS AND COMPREHENSIVE INCOME (LOSS)
YEAR ENDED DECEMBER 31, 2002
(Dollars in Millions)
| |
Parent Only Huntsman International |
Guarantors |
Non- Guarantors |
Eliminations |
Consolidated Huntsman International |
|||||||||||||
|---|---|---|---|---|---|---|---|---|---|---|---|---|---|---|---|---|---|---|
| Revenues: | ||||||||||||||||||
| Trade sales, services, and fees | $ | 674.3 | $ | 628.5 | $ | 2,881.6 | $ | — | $ | 4,184.4 | ||||||||
| Related party sales | 129.2 | 111.4 | 331.5 | (238.4 | ) | 333.7 | ||||||||||||
| Total revenue | 803.5 | 739.9 | 3,213.1 | (238.4 | ) | 4,518.1 | ||||||||||||
| Cost of goods sold | 573.2 | 603.2 | 2,964.7 | (238.4 | ) | 3,902.7 | ||||||||||||
| Gross profit | 230.3 | 136.7 | 248.4 | — | 615.4 | |||||||||||||
Expenses: |
||||||||||||||||||
| Selling, general and administrative | 100.1 | 8.1 | 216.8 | — | 325.0 | |||||||||||||
| Research and development | 35.1 | 1.7 | 17.8 | — | 54.6 | |||||||||||||
| Restructuring and plant closing costs | — | — | 7.7 | — | 7.7 | |||||||||||||
| Total expenses | 135.2 | 9.8 | 242.3 | — | 387.3 | |||||||||||||
| Operating income | 95.1 | 126.9 | 6.1 | — | 228.1 | |||||||||||||
Interest (expense) income, net |
(248.9 |
) |
117.9 |
(114.4 |
) |
— |
(245.4 |
) |
||||||||||
| Gain (loss) on sale of accounts receivable | 0.6 | (3.3 | ) | (2.8 | ) | — | (5.5 | ) | ||||||||||
| Equity in earnings (losses) of unconsolidated affiliates | 173.6 | (79.6 | ) | — | (93.8 | ) | 0.2 | |||||||||||
| Other income | 0.1 | 0.1 | 0.9 | — | 1.1 | |||||||||||||
| Income (loss) before income taxes | 20.5 | 162.0 | (110.2 | ) | (93.8 | ) | (21.5 | ) | ||||||||||
| Income tax (expense) benefit | (0.4 | ) | 0.1 | 41.8 | — | 41.5 | ||||||||||||
| Minority interests in subsidiaries income | — | — | 0.1 | — | 0.1 | |||||||||||||
| Net income (loss) | 20.1 | 162.1 | (68.3 | ) | (93.8 | ) | 20.1 | |||||||||||
Other comprehensive income (loss) |
53.4 |
155.9 |
(16.7 |
) |
(139.2 |
) |
53.4 |
|||||||||||
| Comprehensive income (loss) | $ | 73.5 | $ | 318.0 | $ | (85.0 | ) | $ | (233.0 | ) | $ | 73.5 | ||||||
F-47
HUNTSMAN INTERNATIONAL LLC AND SUBSIDIARIES
CONDENSED CONSOLIDATING STATEMENTS OF CASH FLOW
YEAR ENDED DECEMBER 31, 2004
(Dollars in Millions)
| |
Parent Only Huntsman International |
Guarantors |
Non- Guarantors |
Eliminations |
Consolidated Huntsman International |
|||||||||||
|---|---|---|---|---|---|---|---|---|---|---|---|---|---|---|---|---|
| Net cash (used in) provided by operating activities | $ | (128.3 | ) | $ | 256.1 | $ | 18.0 | $ | — | $ | 145.8 | |||||
| Investing activities: | ||||||||||||||||
| Capital expenditures | (13.7 | ) | (7.1 | ) | (120.5 | ) | — | (141.3 | ) | |||||||
| Investment in unconsolidated affiliate | — | — | (11.8 | ) | — | (11.8 | ) | |||||||||
| Net cash received from unconsolidated affiliates | — | 8.6 | — | — | 8.6 | |||||||||||
| Advances to unconsolidated affiliates | (2.6 | ) | — | — | — | (2.6 | ) | |||||||||
| Net cash used in (provided by) investing activities | (16.3 | ) | 1.5 | (132.3 | ) | — | (147.1 | ) | ||||||||
| Financing activities: | ||||||||||||||||
| Net repayments under revolving loan facilities | (22.0 | ) | — | — | — | (22.0 | ) | |||||||||
| Issuance of senior notes | 354.5 | — | — | — | 354.5 | |||||||||||
| Proceeds from long term debt | 1,369.6 | — | — | — | 1,369.6 | |||||||||||
| Repayment of long term debt | (1,302.4 | ) | — | — | — | (1,302.4 | ) | |||||||||
| Repayments of senior notes | (333.4 | ) | — | — | — | (333.4 | ) | |||||||||
| Net borrowings under overdraft facilities | (7.5 | ) | — | — | — | (7.5 | ) | |||||||||
| Cash contributions by parent | — | 331.3 | 5,240.3 | (5,571.6 | ) | — | ||||||||||
| Cash distributions from subsidiaries | 5,343.5 | — | — | (5,343.5 | ) | — | ||||||||||
| Cash distributions to parent | — | (353.0 | ) | (4,990.5 | ) | 5,343.5 | — | |||||||||
| Cash distributions to subsidiaries | (5,496.6 | ) | (75.0 | ) | — | 5,571.6 | — | |||||||||
| Shares issued to minorities for cash | — | — | 5.4 | — | 5.4 | |||||||||||
| Cost of early extinguishment of debt | (17.0 | ) | — | — | — | (17.0 | ) | |||||||||
| Debt issuance costs | (17.2 | ) | — | — | — | (17.2 | ) | |||||||||
| Intercompany advances—net of repayments | 263.9 | (161.0 | ) | (102.9 | ) | — | — | |||||||||
| Net cash provided by (used in) financing activities | 135.4 | (257.7 | ) | 152.3 | — | 30.0 | ||||||||||
| Effect of exchange rate changes on cash | — | — | 11.5 | — | 11.5 | |||||||||||
| (Decrease) increase in cash and cash equivalents | (9.2 | ) | (0.1 | ) | 49.5 | — | 40.2 | |||||||||
| Cash and cash equivalents at beginning of period | 16.6 | (0.3 | ) | 81.5 | — | 97.8 | ||||||||||
| Cash and cash equivalents at end of period | $ | 7.4 | $ | (0.4 | ) | $ | 131.0 | $ | — | $ | 138.0 | |||||
F-48
HUNTSMAN INTERNATIONAL LLC AND SUBSIDIARIES
CONDENSED CONSOLIDATING STATEMENTS OF CASH FLOW
YEAR ENDED DECEMBER 31, 2003
(Dollars in Millions)
| |
Parent Only Huntsman International |
Guarantors |
Non- Guarantors |
Eliminations |
Consolidated Huntsman International |
|||||||||||
|---|---|---|---|---|---|---|---|---|---|---|---|---|---|---|---|---|
| Net cash (used in) provided by operating activities | $ | (244.8 | ) | $ | 287.2 | $ | 56.1 | $ | — | $ | 98.5 | |||||
| Investing activities: | ||||||||||||||||
| Capital expenditures | (6.9 | ) | (9.5 | ) | (111.0 | ) | — | (127.4 | ) | |||||||
| Investment in unconsolidated affiliate | — | — | (6.1 | ) | — | (6.1 | ) | |||||||||
| Net cash received from unconsolidated affiliates | — | 0.8 | — | — | 0.8 | |||||||||||
| Advances to unconsolidated affiliates | (3.0 | ) | — | — | — | (3.0 | ) | |||||||||
| Net cash used in investing activities | (9.9 | ) | (8.7 | ) | (117.1 | ) | — | (135.7 | ) | |||||||
| Financing activities: | ||||||||||||||||
| Net repayments under revolving loan facilities | (45.0 | ) | — | — | — | (45.0 | ) | |||||||||
| Issuance of senior notes | 157.9 | — | — | — | 157.9 | |||||||||||
| Proceeds from long term debt | 205.0 | — | — | — | 205.0 | |||||||||||
| Repayment of long term debt | (259.1 | ) | — | (4.9 | ) | — | (264.0 | ) | ||||||||
| Net borrowings under overdraft facilities | 7.5 | — | — | — | 7.5 | |||||||||||
| Cash contributions by parent | — | 248.9 | 4,159.5 | (4,408.4 | ) | — | ||||||||||
| Cash distributions from subsidiaries | 4,716.7 | — | — | (4,716.7 | ) | — | ||||||||||
| Cash distributions to parent | — | (548.9 | ) | (4,167.8 | ) | 4,716.7 | — | |||||||||
| Cash distributions to subsidiaries | (4,408.4 | ) | — | — | 4,408.4 | — | ||||||||||
| Shares issued to minorities for cash | — | — | 2.7 | — | 2.7 | |||||||||||
| Debt issuance costs | (9.7 | ) | — | — | — | (9.7 | ) | |||||||||
| Intercompany advances—net of repayments | (112.6 | ) | 20.9 | 91.7 | — | — | ||||||||||
| Net cash provided by (used in) financing activities | 252.3 | (279.1 | ) | 81.2 | — | 54.4 | ||||||||||
| Effect of exchange rate changes on cash | — | — | 5.2 | — | 5.2 | |||||||||||
| (Decrease) increase in cash and cash equivalents | (2.4 | ) | (0.6 | ) | 25.4 | — | 22.4 | |||||||||
| Cash and cash equivalents at beginning of period | 19.0 | 0.3 | 56.1 | — | 75.4 | |||||||||||
| Cash and cash equivalents at end of period | $ | 16.6 | $ | (0.3 | ) | $ | 81.5 | $ | — | $ | 97.8 | |||||
F-49
HUNTSMAN INTERNATIONAL LLC AND SUBSIDIARIES
CONDENSED CONSOLIDATING STATEMENTS OF CASH FLOW
YEAR ENDED DECEMBER 31, 2002
(Dollars in Millions)
| |
Parent Only Huntsman International |
Guarantors |
Non- Guarantors |
Eliminations |
Consolidated Huntsman International |
|||||||||||
|---|---|---|---|---|---|---|---|---|---|---|---|---|---|---|---|---|
| Net cash provided by (used in) operating activities | $ | 56.4 | $ | (7.7 | ) | $ | 129.4 | $ | — | $ | 178.1 | |||||
| Investing activities: | ||||||||||||||||
| Capital expenditures | (9.4 | ) | (3.1 | ) | (178.0 | ) | — | (190.5 | ) | |||||||
| Investment in unconsolidated affiliate | — | — | (9.0 | ) | — | (9.0 | ) | |||||||||
| Net cash received from unconsolidated affiliates | — | 8.0 | — | — | 8.0 | |||||||||||
| Advances to unconsolidated affiliates | (3.3 | ) | — | — | — | (3.3 | ) | |||||||||
| Proceeds from sale of fixed assets | (0.4 | ) | — | 6.3 | — | 5.9 | ||||||||||
| Net cash (used in) investing activities | (13.1 | ) | 4.9 | (180.7 | ) | — | (188.9 | ) | ||||||||
| Financing activities: | ||||||||||||||||
| Net repayments under revolving loan facilities | (43.6 | ) | — | — | — | (43.6 | ) | |||||||||
| Issuance of senior notes | 300.0 | — | — | — | 300.0 | |||||||||||
| Repayment of long term debt | (247.2 | ) | — | 2.2 | — | (245.0 | ) | |||||||||
| Debt issuance costs | (10.3 | ) | — | — | — | (10.3 | ) | |||||||||
| Cash contributions by parent | — | 441.5 | 3,232.5 | (3,674.0 | ) | — | ||||||||||
| Cash distributions from subsidiaries | 3,612.5 | — | — | (3,612.5 | ) | — | ||||||||||
| Cash distributions to parent | — | (431.8 | ) | (3,180.7 | ) | 3,612.5 | — | |||||||||
| Cash distributions to subsidiaries | (3,674.0 | ) | — | — | 3,674.0 | — | ||||||||||
| Intercompany advances—net of repayments | 17.3 | (9.4 | ) | (7.9 | ) | — | — | |||||||||
| Net cash (used in) provided by financing activities | (45.3 | ) | 0.3 | 46.1 | — | 1.1 | ||||||||||
| Effect of exchange rate changes on cash | — | — | 1.2 | — | 1.2 | |||||||||||
| Decrease in cash and cash equivalents | (2.0 | ) | (2.5 | ) | (4.0 | ) | — | (8.5 | ) | |||||||
| Cash and cash equivalents at beginning of period | 21.0 | 2.8 | 60.1 | — | 83.9 | |||||||||||
| Cash and cash equivalents at end of period | $ | 19.0 | $ | 0.3 | $ | 56.1 | $ | — | $ | 75.4 | ||||||
F-50
HUNTSMAN INTERNATIONAL LLC AND SUBSIDIARIES
Schedule II—Valuation and Qualifying Accounts
(Dollars in Millions)
| Column A |
Column B |
Column C |
Column D |
Column E |
||||||||||||
|---|---|---|---|---|---|---|---|---|---|---|---|---|---|---|---|---|
| |
|
Additions |
|
|
||||||||||||
| |
Balance at Beginning of Period |
|
|
|||||||||||||
| Description |
Charged to cost and expenses |
Charged to other accounts |
Deductions |
Balance at End of Period |
||||||||||||
| Allowance for Doubtful Accounts | ||||||||||||||||
| Year Ended December 31, 2004 | $ | 13.4 | $ | 2.0 | $ | — | $ | (4.7 | ) | $ | 10.7 | |||||
| Year Ended December 31, 2003 | $ | 14.5 | $ | 10.2 | $ | — | $ | (11.3 | ) | $ | 13.4 | |||||
| Year Ended December 31, 2002 | $ | 15.2 | $ | 4.1 | $ | — | $ | (4.8 | ) | $ | 14.5 | |||||
F-51
| Number |
Description of Exhibits |
|
|---|---|---|
| 3.1 | Certificate of Formation of Huntsman International LLC (incorporated by reference to Exhibit 3.1 to our registration statement on Form S-4 (File No. 333-85141)) | |
3.2 |
Second Amended and Restated Limited Liability Company Agreement of Huntsman International LLC dated December 20, 2001 (incorporated by reference to Exhibit 3.2 to amendment no. 1 to our annual report on Form 10-K/A for the year ended December 31, 2001) |
|
3.3 |
Certificate of Formation of Huntsman International Financial LLC (incorporated by reference to Exhibit 3.3 to our registration statement on Form S-4 (File No. 333-85141)) |
|
3.4 |
Limited Liability Company Agreement of Huntsman International Financial LLC dated June 18, 1999, as amended by the First Amendment dated June 19, 1999 (incorporated by reference to Exhibit 3.4 to our registration statement on Form S-4 (File No. 333-85141)) |
|
3.5 |
Memorandum of Association of Tioxide Group (incorporated by reference to Exhibit 3.5 to our registration statement on Form S-4 (File No. 333-85141)) |
|
3.6 |
Articles of Association of Tioxide Group (incorporated by reference to Exhibit 3.6 to our registration statement on Form S-4 (File No. 333-85141)) |
|
3.7 |
Memorandum of Association of Tioxide Americas Inc. (incorporated by reference to Exhibit 3.7 to our registration statement on Form S-4 (File No. 333-85141)) |
|
3.8 |
Articles of Association of Tioxide Americas Inc. (incorporated by reference to Exhibit 3.8 to our registration statement on Form S-4 (File No. 333-85141)) |
|
3.9 |
Certificate of Amendment to Certificate of Formation of Huntsman International LLC (incorporated by reference to Exhibit 3.9 to our annual report on Form 10-K for the year ended December 31, 2000) |
|
3.10 |
Certificate of Amendment to Certificate of Formation of Huntsman International Financial LLC (incorporated by reference to Exhibit 3.10 to our annual report on Form 10-K for the year ended December 31, 2000) |
|
3.11 |
Certificate of Formation of Huntsman Propylene Oxide Holdings LLC (incorporated by reference to Exhibit 3.7 to our registration statement on Form S-4 (File No. 333-58578)) |
|
3.12 |
Limited Liability Company Agreement of Huntsman Propylene Oxide Holdings LLC dated July 12, 2000 (incorporated by reference to Exhibit 3.8 to our registration statement on Form S-4 (File No. 333-58578)) |
|
3.13 |
Certificate of Formation of Huntsman EA Holdings LLC (incorporated by reference to Exhibit 3.9 to our registration statement on Form S-4 (File No. 333-58578)) |
|
3.14 |
Limited Liability Company Agreement of Huntsman EA Holdings LLC dated December 22, 2000 (incorporated by reference to Exhibit 3.10 to our registration statement on Form S-4 (File No. 333-58578)) |
|
3.15 |
Certificate of Formation of Huntsman Texas Holdings LLC (incorporated by reference to Exhibit 3.11 to our registration statement on Form S-4 (File No. 333-58578)) |
|
3.16 |
Limited Liability Company Agreement of Huntsman Texas Holdings LLC dated July 12, 2000 (incorporated by reference to Exhibit 3.12 to our registration statement on Form S-4 (File No. 333-58578)) |
|
3.17 |
Certificate of Formation of Eurofuels LLC (incorporated by reference to Exhibit 3.13 to our registration statement on Form S-4 (File No. 333-58578)) |
|
3.18 |
Limited Liability Company Agreement of Eurofuels LLC dated July 12, 2000 (incorporated by reference to Exhibit 3.14 to our registration statement on Form S-4 (File No. 333-58578)) |
|
3.19 |
Certificate of Formation of Eurostar Industries LLC (incorporated by reference to Exhibit 3.15 to our registration statement on Form S-4 (File No. 333-58578)) |
|
3.20 |
Limited Liability Company Agreement of Eurostar Industries LLC dated July 12, 2000 (incorporated by reference to Exhibit 3.16 to our registration statement on Form S-4 (File No. 333-58578)) |
|
3.21 |
Certificate of Limited Partnership of Huntsman Ethyleneamines Ltd. (incorporated by reference to Exhibit 3.17 to our registration statement on Form S-4 (File No. 333-58578)) |
|
3.22 |
Articles of Limited Partnership of Huntsman Ethyleneamines Ltd. dated January 5, 2001 (incorporated by reference to Exhibit 3.18 to our registration statement on Form S-4 (File No. 333-58578)) |
|
3.23 |
Certificate of Limited Partnership of Huntsman Propylene Oxide Ltd. (incorporated by reference to Exhibit 3.19 to our registration statement on Form S-4 (File No. 333-58578)) |
|
3.24 |
First Amended and Restated Articles of Limited Partnership of Huntsman Propylene Oxide Ltd. dated October 1, 2000 (incorporated by reference to Exhibit 3.20 to our registration statement on Form S-4 (File No. 333-58578)) |
|
3.25 |
Certificate of Limited Partnership of Huntsman International Fuels, L.P. (incorporated by reference to Exhibit 3.21 to our registration statement on Form S-4 (File No. 333-58578)) |
|
3.26 |
Certificate of First Amendment to Certificate of Limited Partnership of Huntsman International Fuels, L.P. (incorporated by reference to Exhibit 3.22 to our registration statement on Form S-4 (File No. 333-58578)) |
|
3.27 |
First Amended and Restated Articles of Limited Partnership of Huntsman International Fuels, L.P. dated October 1, 2000 (incorporated by reference to Exhibit 3.23 to our registration statement on Form S-4 (File No. 333-58578)) |
|
4.1 |
Indenture, dated as of June 30, 1999, among Huntsman International LLC (f/k/a Huntsman ICI Chemicals LLC), the Guarantors party thereto and Bank One, N.A., as Trustee, relating to the 101/8% Senior Subordinated Notes due 2009 (incorporated by reference to Exhibit 4.1 to our registration statement on Form S-4 (File No. 333-85141)) |
|
4.2 |
Form of 101/8% Senior Subordinated Note due 2009 denominated in dollars (included as Exhibit A-3 to Exhibit 4.1) |
|
4.3 |
Form of 101/8% Senior Subordinated Note due 2009 denominated in euros (included as Exhibit A-4 to Exhibit 4.1) |
|
4.4 |
Form of Guarantee relating to the 101/8% Senior Subordinated Notes due 2009 (included as Exhibit E of Exhibit 4.1) |
|
4.5 |
First Amendment, dated January 5, 2000, to Indenture, dated as of June 30, 1999, among Huntsman International LLC (f/k/a Huntsman ICI Chemicals LLC), as Issuer, each of the Guarantors named therein and Bank One, N.A., as Trustee (incorporated by reference to Exhibit 4.6 to our registration statement on Form S-4 (File No. 333-85141)) |
|
4.6 |
Indenture, dated as of March 13, 2001, among Huntsman International LLC, as Issuer, the Guarantors named therein and The Bank of New York, as Trustee, relating to 101/8% Senior Subordinated Notes due 2009 (incorporated by reference to Exhibit 4.6 to amendment no. 1 to our annual report on Form 10-K/A for the year ended December 31, 2001) |
|
4.7 |
Form of 101/8% Senior Subordinated Note due 2009 denominated in dollars (included as Exhibit A-3 to Exhibit 4.6) |
|
4.8 |
Form of 101/8% Senior Subordinated Note due 2009 denominated in euros (included as Exhibit A-4 to Exhibit 4.6) |
|
4.9 |
Form of Guarantee relating to the 101/8% Senior Subordinated Notes due 2009 (included as Exhibit E of Exhibit 4.6) |
|
4.10 |
First Supplemental Indenture, dated as of January 11, 2002, among Huntsman International LLC, as Issuer, the Guarantors named therein and The Bank of New York, as Trustee, relating to 101/8% Senior Subordinated Notes due 2009 (incorporated by reference to Exhibit 4.7 to amendment no. 1 to our annual report on Form 10-K/A for the year ended December 31, 2001) |
|
4.11 |
Indenture, dated as of March 21, 2002, among Huntsman International LLC, as Issuer, the Guarantors named therein and Wells Fargo Bank Minnesota, National Association, as Trustee, relating to the 97/8% Senior Notes due 2009 (incorporated by reference to Exhibit 4.8 to amendment no. 1 to our annual report on Form 10-K/A for the year ended December 31, 2001) |
|
4.12 |
Form of 97/8% Senior Note due 2009 denominated in dollars (included as Exhibit A-3 to Exhibit 4.11) |
|
4.13 |
Form of 97/8% Senior Note due 2009 denominated in euros (included as Exhibit A-4 to Exhibit 4.11) |
|
4.14 |
Form of Guarantee relating to the 97/8% Senior Notes due 2009 (included as Exhibit E of Exhibit 4.11) |
|
4.15 |
Amended and Restated Guarantee, dated as of April 11, 2003, among the Guarantors named therein and Wells Fargo Bank Minnesota, National Association, as Trustee, relating to the 97/8% Senior Notes due 2009 (incorporated by reference to Exhibit 4.15 to our registration statement on Form S-4 (File No. 333-106482)) |
|
4.16 |
Exchange and Registration Rights Agreement, dated as of March 21, 2002, among Huntsman International LLC, the Guarantors as defined therein, and the Purchasers as defined therein, relating to the 97/8% Senior Notes due 2009 (incorporated by reference to Exhibit 4.9 to amendment no. 1 to our annual report on Form 10-K/A for the year ended December 31, 2001) |
|
4.17 |
Exchange and Registration Rights Agreement, dated as of April 11, 2003, among Huntsman International LLC, the Guarantors, as defined therein, and the Purchasers as defined therein, relating to the 97/8% Senior Notes due 2009 (incorporated by reference to Exhibit 4.17 to our registration statement on Form S-4 (File No. 333-106482)) |
|
4.18 |
Indenture, dated as of December 17, 2004, among Huntsman International LLC, as Issuer, the Guarantors named therein and Wells Fargo Bank, National Association, as Trustee, relating to 73/8% Senior Subordinated Notes due 2015 and 71/2% Senior Subordinated Notes due 2015 (incorporated by reference to Exhibit 4.1 to our current report on Form 8-K dated December 17, 2004 (File No. 333-85141)) |
|
4.19 |
Form of 73/8% Senior Subordinated Notes due 2015 denominated in dollars (included as Exhibit A-1 to Exhibit 4.18) |
|
4.20 |
Form of 71/2% Senior Subordinated Notes due 2015 denominated in euros (included as Exhibit A-2 to Exhibit 4.18) |
|
4.21 |
Form of Guarantee (included as Exhibit E to Exhibit 4.18) |
|
4.22 |
Exchange and Registration Rights Agreement, dated as of December 17, 2004, among Huntsman International LLC, the Guarantors as defined therein, and the Purchasers as defined therein, relating to the 73/8% Senior Subordinated Notes due 2015 and the 71/2% Senior Subordinated Notes due 2015 (incorporated by reference to Exhibit 4.2 to our current report on Form 8-K dated December 17, 2004 (File No. 333-85141)) |
|
10.1 |
Contribution Agreement, dated as of April 15, 1999, by and among Imperial Chemical Industries PLC, Huntsman Specialty Chemicals Corporation, Huntsman International Holdings LLC (f/k/a Huntsman ICI Holdings LLC) and Huntsman International LLC (f/k/a Huntsman ICI Chemicals LLC) as amended by the first Amending Agreement, dated June 4, 1999, the second Amending Agreement, dated June 30, 1999, and the third Amending Agreement, dated June 30, 1999 (incorporated by reference to Exhibit 10.1 to our registration statement on Form S-4 (File No. 333-85141)) |
|
10.2 |
Purchase and Sale Agreement (PO/MTBE Business), dated March 21, 1997, among Texaco, Texaco Chemical Inc. and Huntsman Specialty Chemicals Corporation (incorporated by reference to Exhibit 10.2 to our registration statement on Form S-4 (File No. 333-85141)) |
|
10.3 |
Operating and Maintenance Agreement, dated as of March 21, 1997, by and between Huntsman Specialty Chemicals Corporation and Huntsman Petrochemical Corporation (incorporated by reference to Exhibit 10.3 to our registration statement on Form S-4 (File No. 333-85141)) |
|
10.4 |
Credit Agreement, dated as of June 30, 1999, by and among Huntsman International LLC (f/k/a Huntsman ICI Chemicals LLC), Huntsman International Holdings LLC (f/k/a Huntsman ICI Holdings LLC), Bankers Trust Company, Goldman Sachs Credit Partners LP, The Chase Manhattan Bank, and Warburg Dillon Read and various lending institutions party thereto (incorporated by reference to Exhibit 10.4 to our registration statement on Form S-4 (File No. 333-85141)) |
|
10.5 |
Asset Sale Agreement, dated June 30, 1999, by and between BP Chemicals Limited and Huntsman International LLC (f/k/a Huntsman ICI Chemicals LLC) (incorporated by reference to Exhibit 10.5 to our registration statement on Form S-4 (File No. 333-85141)) |
|
10.6 |
First Amendment, dated as of December 21, 2000, by and among Huntsman International LLC, Huntsman International Holdings LLC, the financial institutions named therein, as Lenders, Bankers Trust Company, as Lead Arranger, Administrative Agent for the Lenders and Sole Book Manager, Goldman Sachs Credit Partners L.P., as Syndication Agent and Co-Arranger and The Chase Manhattan Bank and Warburg Dillon Read (a division of UBS AG), as Co-Arrangers and as Co-Documentation Agents, to the Credit Agreement dated as of June 30, 1999 (incorporated by reference to Exhibit 10.15 to our annual report on Form 10-K for the year ended December 31, 2000) |
|
10.7 |
Second Amendment, dated as of March 5, 2001, is entered into by and among Huntsman International LLC, Huntsman International Holdings LLC, the undersigned financial institutions, including Bankers Trust Company, in their capacities as lenders hereunder, Bankers Trust Company, as Lead Arranger, Administrative Agent for the Lenders and Sole Book Manager, Goldman Sachs Credit Partners L.P., as Syndication Agent and Co-Arranger and The Chase Manhattan Bank and UBS Warburg LLC (as successor to Warburg Dillon Read), as Co-Arrangers and as Co-Documentation Agents, to the Credit Agreement dated as of June 30, 1999 (incorporated by reference to Exhibit 10.16 to our annual report on Form 10-K for the year ended December 31, 2000) |
|
10.8 |
Contribution Agreement, among Huntsman International LLC, as Contributor and Originator, and Huntsman Receivables Finance LLC, as the Company, dated as of December 20, 2000 (incorporated by reference to Exhibit 10.17 to our annual report on Form 10-K for the year ended December 31, 2000) |
|
10.9 |
Huntsman Master Trust Pooling Agreement, dated as of December 21, 2000, among Huntsman Receivables Finance LLC, as Company, Huntsman (Europe) BVBA, as Master Servicer, and Chase Manhattan Bank (Ireland) Plc, as Trustee (incorporated by reference to Exhibit 10.18 to our annual report on Form 10-K for the year ended December 31, 2000) |
|
10.10 |
Huntsman Master Trust, Series 2000-1 Supplement, dated as of December 21, 2000, to Pooling Agreement dated as of December 21, 2000, among Huntsman Receivables Finance LLC, as Company, Huntsman (Europe), BVBA, as Master Servicer, The Chase Manhattan Bank, as Funding Agent, Park Avenue Receivables Corp., as Series 2000-1 Initial Purchaser, the several financial institutions party thereto from time to time as Series 2000-1 APA Banks, and Chase Manhattan Bank (Ireland) Plc, as Trustee (incorporated by reference to Exhibit 10.19 to our annual report on Form 10-K for the year ended December 31, 2000) |
|
10.11 |
Servicing Agreement, dated as of December 21, 2000, among Huntsman Receivables Finance LLC, as the Company, Huntsman (Europe) BVBA, as Master Servicer, Tioxide Americas Inc., Huntsman ICI Holland B.V., Tioxide Europe Limited, Huntsman International LLC, Huntsman Petrochemicals (U.K.) Limited, Huntsman Propylene Oxide Ltd., Huntsman International Fuels L.P., as Local Servicers, Chase Manhattan Bank (Ireland) Plc, as Trustee, Pricewaterhousecoopers, as Liquidation Servicer, and Huntsman International LLC, as Servicer Guarantor (incorporated by reference to Exhibit 10.20 to our annual report on Form 10-K for the year ended December 31, 2000) |
|
10.12 |
U.S. Receivables Purchase Agreement, Huntsman International LLC, as Purchaser, and Tioxide Americas Inc., Huntsman Propylene Oxide Ltd. and Huntsman International Fuels, L.P., each as a Seller and an Originator (incorporated by reference to Exhibit 10.21 to our annual report on Form 10-K for the year ended December 31, 2000) |
|
10.13 |
Dutch Receivables Purchase Agreement, dated as of December 21, 2000, between Huntsman International LLC, as Purchaser, Huntsman ICI Holland B.V., as Originator, Huntsman ICI (Europe) B.V.B.A., as Master Servicer (incorporated by reference to Exhibit 10.22 to our annual report on Form 10-K for the year ended December 31, 2000) |
|
10.14 |
U.K. Receivables Purchase Agreement, dated as of December 20, 2000, between Huntsman International LLC, as Purchaser, Tioxide Europe Limited and Huntsman Petrochemicals (U.K.) Limited, as Originators, and Huntsman (Europe) B.V.B.A., as Master Servicer (incorporated by reference to Exhibit 10.23 to our annual report on Form 10-K for the year ended December 31, 2000) |
|
10.15 |
Third Amendment, dated as of November 30, 2001, by and among Huntsman International LLC, Huntsman International Holdings LLC and the various agents and lending institutions party thereto (incorporated by reference to Exhibit 10.1 to our current report on Form 8-K filed December 4, 2001) |
|
10.16 |
Fourth Amendment to Credit Agreement, dated as of March 15, 2002, by and among Huntsman International LLC, Huntsman International Holdings LLC and the various agents and lending institutions party thereto (incorporated by reference to Exhibit 10.25 to amendment no. 1 to our annual report on Form 10-K/A for the year ended December 31, 2001) |
|
10.17 |
Amendment Agreement, dated December 20, 2001, between Imperial Chemical Industries PLC, Huntsman Specialty Chemicals Corporation, Huntsman International Holdings LLC and Huntsman International LLC, to amend the Contribution Agreement dated as of April 15, 1999 (incorporated by reference to Exhibit 10.26 to our registration statement on Form S-4 (File No. 333-106482)) |
|
10.18 |
Second Amendment, dated as of October 21, 2002, between Huntsman Receivables Finance LLC, Huntsman (Europe), BVBA, and J.P. Morgan (Ireland) PLC, to Series 2000-1 Supplement, dated as of December 21, 2000 (incorporated by reference to Exhibit 10.27 to our annual report on Form 10-K for the year ended December 31, 2002) |
|
10.19 |
First Amendment to Series 2001-1 Supplement, dated as of October 21, 2002, among Huntsman Receivables Finance LLC, Huntsman (Europe) BVBA and J.P. Morgan Bank (Ireland) PLC (incorporated by reference to Exhibit 10.28 to our annual report on Form 10-K for the year ended December 31, 2002) |
|
10.20 |
First Amendment to Amended and Restated Pooling Agreement, dated as of October 21, 2002, among Huntsman Receivables Finance LLC, Huntsman (Europe) BVBA and J.P. Morgan Bank (Ireland) PLC (incorporated by reference to Exhibit 10.29 to our annual report on Form 10-K for the year ended December 31, 2002) |
|
10.21 |
Amended and Restated Servicing Agreement, dated as of October 21, 2002, among Huntsman Receivables Finance LLC, as the Company, Huntsman (Europe) BVBA, as Master Servicer, Tioxide Americas Inc., Huntsman Holland B.V., Tioxide Europe Limited, Huntsman International LLC, Huntsman Petrochemicals (UK) Limited, Huntsman Propylene Oxide Ltd., Huntsman International Fuels L.P., Tioxide Europe SRL, Huntsman Surface Sciences Italia SRL, Huntsman Patrica S.R.L., Tioxide Europe S.L., Huntsman Surface Sciences Ibérica, S.L., Tioxide Europe SAS, Huntsman Surface Sciences (France) S.A.S., Huntsman Surface Sciences UK Ltd, Huntsman Ethyleneamines Ltd., as Local Servicers, J.P. Morgan Bank (Ireland) PLC, as Trustee, Pricewaterhousecoopers, as Liquidation Servicer, and Huntsman International LLC, as Servicer Guarantor (incorporated by reference to Exhibit 10.30 to our annual report on Form 10-K for the year ended December 31, 2002) |
|
10.22 |
Amended and Restated U.S. Receivables Purchase Agreement, dated as of October 21, 2002, among Huntsman International LLC, as Purchaser, and Tioxide Americas Inc., Huntsman Propylene Oxide Ltd., Huntsman International Fuels L.P., and Huntsman Ethyleneamines Ltd., each as a Seller and an Originator (incorporated by reference to Exhibit 10.31 to our annual report on Form 10-K for the year ended December 31, 2002) |
|
10.23 |
Amended and Restated UK Receivables Purchase Agreement, dated as of October 21, 2002, among Huntsman International LLC, as Purchaser, Huntsman Surface Sciences UK Limited, Tioxide Europe Limited, and Huntsman Petrochemicals (UK) Limited, as Originators, Huntsman (Europe) B.V.B.A, as Master Servicer (incorporated by reference to Exhibit 10.32 to our annual report on Form 10-K for the year ended December 31, 2002) |
|
10.24 |
Fifth Amendment to Credit Agreement, dated as of February 7, 2003, among Huntsman International LLC, Huntsman International Holdings LLC and the various agents and lending institutions party thereto (incorporated by reference to Exhibit 10.33 to our annual report on Form 10-K for the year ended December 31, 2002) |
|
10.25 |
Deed of Amendment to Contribution Agreement, dated as of November 27, 2002, among Imperial Chemical Industries PLC, Huntsman Specialty Chemicals Corporation, Huntsman International Holdings, LLC, and Huntsman International LLC (incorporated by reference to Exhibit 10.34 to our annual report on Form 10-K for the year ended December 31, 2002) |
|
10.26 |
Sixth Amendment to Credit Agreement, dated as of April 9, 2003, among Huntsman International LLC, Huntsman International Holdings LLC and the various agents and lending institutions party thereto (incorporated by reference to Exhibit 10.1 to our quarterly report on Form 10-Q for the quarter ended March 31, 2003) |
|
10.27 |
Business Consulting Agreement, dated as of June 3, 2003, between Huntsman International LLC and Jon M. Huntsman (incorporated by reference to Exhibit 10.41 to our registration statement on Form S-4 (File No. 333-106482)) |
|
10.28 |
Seventh Amendment to Credit Agreement, dated as of October 17, 2003, among Huntsman International LLC, Huntsman International Holdings LLC and the various agents and lending institutions party thereto (incorporated by reference to Exhibit 10.42 to our registration statement on Form S-4 (File No. 333-106482)) |
|
10.29 |
First Amendment to Amended and Restated Credit Agreement, dated as of December 21, 2004, among Huntsman International LLC, Huntsman International Holdings LLC and the various agents and lending institutions party thereto (incorporated by reference to Exhibit 10.1 to our current report on Form 8-K dated December 17, 2004 (File No. 333-85141)) |
|
21.1 |
Omitted pursuant to General Instruction I of Form 10-K. |
|
31.1* |
Certification of Chief Executive Officer pursuant to Section 302 of the Sarbanes-Oxley Act of 2002 |
|
31.2* |
Certification of Chief Financial Officer pursuant to Section 302 of the Sarbanes-Oxley Act of 2002 |
|
32.1* |
Certification of Chief Executive Officer pursuant to Section 906 of the Sarbanes-Oxley Act of 2002 |
|
32.2* |
Certification of Chief Financial Officer pursuant to Section 906 of the Sarbanes-Oxley Act of 2002 |