Use these links to rapidly review the document
TABLE OF CONTENTS
SECURITIES AND EXCHANGE COMMISSION
WASHINGTON, D.C. 20549
Form 10-Q
| (Mark One) | |
ý |
QUARTERLY REPORT PURSUANT TO SECTION 13 OR 15(d) OF THE SECURITIES EXCHANGE ACT OF 1934 |
For the quarterly period ended June 30, 2005 |
|
OR |
|
o |
TRANSITION REPORT PURSUANT TO SECTION 13 OR 15(d) OF THE SECURITIES EXCHANGE ACT OF 1934 |
For the transition period from to |
|
Commission file number 333-85141
HUNTSMAN INTERNATIONAL LLC
(Exact name of registrant as specified in its charter)
| Delaware (State or other jurisdiction of incorporation or organization) |
87-0630358 (I.R.S. Employer Identification No.) |
500 Huntsman Way
Salt Lake City, Utah 84108
(801) 584-5700
(Address of principal executive offices and telephone number)
Indicate by check mark whether the registrant: (1) has filed all reports required to be filed by Section 13 or 15(d) of the Securities Exchange Act of 1934 during the preceding 12 months (or for such shorter period that the registrant was required to file such reports), and (2) has been subject to such filing requirements for the past 90 days. YES ý NO o
Indicate by check mark whether the registrant is an accelerated filer (as defined in Exchange Act Rule 12b-2). YES o NO ý
On August 10, 2005, 1,000 units of membership interest of the registrant were outstanding. There is no established trading market for the registrant's units of membership interest. All of the registrant's units of membership interest are held by an affiliate.
HUNTSMAN INTERNATIONAL LLC
QUARTERLY REPORT ON FORM 10-Q FOR THE QUARTERLY PERIOD
ENDED JUNE 30, 2005
2
HUNTSMAN INTERNATIONAL LLC AND SUBSIDIARIES
CONDENSED CONSOLIDATED BALANCE SHEETS (UNAUDITED)
(Dollars in Millions)
| |
June 30, 2005 |
December 31, 2004 |
||||||
|---|---|---|---|---|---|---|---|---|
| ASSETS | ||||||||
| Current assets: | ||||||||
| Cash and cash equivalents | $ | 112.2 | $ | 138.0 | ||||
| Accounts receivable (net of allowance for doubtful accounts of $9.0 and $10.7, respectively) | 793.2 | 770.1 | ||||||
| Accounts receivable from affiliates | 17.0 | 35.9 | ||||||
| Inventories, net | 759.1 | 735.6 | ||||||
| Prepaid expenses | 16.0 | 30.8 | ||||||
| Deferred income taxes | 10.2 | 10.2 | ||||||
| Other current assets | 55.8 | 50.5 | ||||||
| Total current assets | 1,763.5 | 1,771.1 | ||||||
| Property, plant and equipment, net | 2,921.4 | 3,183.7 | ||||||
| Investment in unconsolidated affiliates | 151.5 | 146.2 | ||||||
| Intangible assets, net | 236.1 | 254.0 | ||||||
| Notes receivable from affiliates | — | 10.8 | ||||||
| Other noncurrent assets | 477.0 | 483.1 | ||||||
| Total assets | $ | 5,549.5 | $ | 5,848.9 | ||||
| LIABILITIES AND MEMBER'S EQUITY | ||||||||
| Current liabilities: | ||||||||
| Accounts payable | $ | 583.4 | $ | 589.2 | ||||
| Accounts payable to affiliates | 79.8 | 99.1 | ||||||
| Accrued liabilities | 324.9 | 419.7 | ||||||
| Current portion of long-term debt | 20.7 | 10.5 | ||||||
| Total current liabilities | 1,008.8 | 1,118.5 | ||||||
| Long-term debt | 2,775.1 | 3,044.3 | ||||||
| Deferred income taxes | 164.5 | 179.2 | ||||||
| Notes payable to affiliates | — | 29.9 | ||||||
| Other noncurrent liabilities | 355.4 | 269.5 | ||||||
| Total liabilities | 4,303.8 | 4,641.4 | ||||||
| Minority interests | 18.2 | 8.8 | ||||||
| Commitments and contingencies (Notes 16 and 17) | ||||||||
| Member's equity: | ||||||||
| Member's equity, 1,000 units | 1,026.1 | 1,026.1 | ||||||
| Retained earnings | 174.7 | 6.1 | ||||||
| Accumulated other comprehensive income | 26.7 | 166.5 | ||||||
| Total member's equity | 1,227.5 | 1,198.7 | ||||||
| Total liabilities and member's equity | $ | 5,549.5 | $ | 5,848.9 | ||||
See accompanying notes to unaudited condensed consolidated financial statements.
3
HUNTSMAN INTERNATIONAL LLC AND SUBSIDIARIES
CONDENSED CONSOLIDATED STATEMENTS OF OPERATIONS AND
COMPREHENSIVE INCOME (LOSS) (UNAUDITED)
(Dollars in Millions)
| |
Three Months Ended June 30, 2005 |
Three Months Ended June 30, 2004 |
Six Months Ended June 30, 2005 |
Six Months Ended June 30, 2004 |
|||||||||||
|---|---|---|---|---|---|---|---|---|---|---|---|---|---|---|---|
| Revenues: | |||||||||||||||
| Trade sales, services and fees | $ | 1,868.4 | $ | 1,538.1 | $ | 3,750.5 | $ | 2,981.7 | |||||||
| Related party sales | 61.8 | 67.4 | 128.0 | 103.9 | |||||||||||
| Total revenues | 1,930.2 | 1,605.5 | 3,878.5 | 3,085.6 | |||||||||||
| Cost of goods sold | 1,599.8 | 1,373.2 | 3,189.1 | 2,704.4 | |||||||||||
| Gross profit | 330.4 | 232.3 | 689.4 | 381.2 | |||||||||||
| Expenses: | |||||||||||||||
| Selling, general and administrative | 95.5 | 92.8 | 182.1 | 185.8 | |||||||||||
| Research and development | 11.9 | 8.8 | 22.4 | 21.0 | |||||||||||
| Other operating (income) expense | (3.4 | ) | 24.8 | 30.2 | 19.6 | ||||||||||
| Restructuring and plant closing costs | 18.5 | 124.9 | 25.5 | 133.6 | |||||||||||
| Total expenses | 122.5 | 251.3 | 260.2 | 360.0 | |||||||||||
| Operating income (loss) | 207.9 | (19.0 | ) | 429.2 | 21.2 | ||||||||||
| Interest expense, net | (53.3 | ) | (62.9 | ) | (117.1 | ) | (131.9 | ) | |||||||
| Loss on accounts receivable securitization program | (2.4 | ) | (3.0 | ) | (5.6 | ) | (6.5 | ) | |||||||
| Other expense | (1.8 | ) | — | (3.1 | ) | (0.2 | ) | ||||||||
| Income (loss) from continuing operations before income taxes and minority interest | 150.4 | (84.9 | ) | 303.4 | (117.4 | ) | |||||||||
| Income tax expense | (33.2 | ) | (4.7 | ) | (56.7 | ) | (8.3 | ) | |||||||
| Minority interest | — | — | (0.1 | ) | — | ||||||||||
| Income (loss) from continuing operations | 117.2 | (89.6 | ) | 246.6 | (125.7 | ) | |||||||||
| Loss from discontinued operations (including loss on pending disposal of $36.4 in 2005), net of tax | (40.4 | ) | (0.9 | ) | (43.0 | ) | (1.7 | ) | |||||||
| Net income (loss) | 76.8 | (90.5 | ) | 203.6 | (127.4 | ) | |||||||||
| Other comprehensive loss | (94.6 | ) | (15.5 | ) | (139.8 | ) | (13.7 | ) | |||||||
| Comprehensive (loss) income | $ | (17.8 | ) | $ | (106.0 | ) | $ | 63.8 | $ | (141.1 | ) | ||||
See accompanying notes to unaudited condensed consolidated financial statements.
4
HUNTSMAN INTERNATIONAL LLC AND SUBSIDIARIES
CONDENSED CONSOLIDATED STATEMENTS OF MEMBER'S EQUITY (UNAUDITED)
(Dollars in Millions)
| |
Member's Equity |
|
Accumulated Other Comprehensive Income |
|
|||||||||||
|---|---|---|---|---|---|---|---|---|---|---|---|---|---|---|---|
| |
Retained Earnings |
|
|||||||||||||
| |
Units |
Amount |
Total |
||||||||||||
| Balance, January 1, 2005 | 1,000 | $ | 1,026.1 | $ | 6.1 | $ | 166.5 | $ | 1,198.7 | ||||||
| Net income | — | — | 203.6 | — | 203.6 | ||||||||||
| Dividend paid to parent | — | — | (35.0 | ) | — | (35.0 | ) | ||||||||
| Other comprehensive loss | — | — | — | (139.8 | ) | (139.8 | ) | ||||||||
| Balance, June 30, 2005 | 1,000 | $ | 1,026.1 | $ | 174.7 | $ | 26.7 | $ | 1,227.5 | ||||||
See accompanying notes to unaudited condensed consolidated financial statements.
5
HUNTSMAN INTERNATIONAL LLC AND SUBSIDIARIES
CONDENSED CONSOLIDATED STATEMENTS OF CASH FLOWS (UNAUDITED)
(Dollars in Millions)
| |
Six Months Ended June 30, 2005 |
Six Months Ended June 30, 2004 |
||||||
|---|---|---|---|---|---|---|---|---|
| Operating Activities: | ||||||||
| Net income (loss) | $ | 203.6 | $ | (127.4 | ) | |||
| Adjustments to reconcile net income (loss) to net cash provided by operating activities: | ||||||||
| Depreciation and amortization | 149.2 | 156.8 | ||||||
| (Recovery of) provision for losses on accounts receivable | (6.2 | ) | 3.3 | |||||
| Noncash restructuring and plant closing costs | 0.1 | 81.1 | ||||||
| Loss on early extinguishment of debt | 3.0 | — | ||||||
| Loss on pending disposal of discontinued operations | 36.4 | — | ||||||
| Noncash interest expense | 5.5 | 10.1 | ||||||
| Deferred income taxes | 26.3 | 6.0 | ||||||
| Unrealized gains on foreign currency transactions | (4.1 | ) | (14.8 | ) | ||||
| Changes in operating assets and liabilities | ||||||||
| Accounts and notes receivables | 26.6 | (128.7 | ) | |||||
| Change in receivables sold, net | 4.1 | 29.7 | ||||||
| Inventories | (33.1 | ) | 6.9 | |||||
| Prepaid expenses | 14.0 | 3.6 | ||||||
| Other current assets | (9.4 | ) | (25.3 | ) | ||||
| Other noncurrent assets | (1.3 | ) | (8.0 | ) | ||||
| Accounts payable | (58.7 | ) | 5.5 | |||||
| Accrued liabilities | (60.4 | ) | 42.6 | |||||
| Other noncurrent liabilities | (23.4 | ) | 1.6 | |||||
| Net cash provided by operating activities | 272.2 | 43.0 | ||||||
| Investing Activities: | ||||||||
| Capital expenditures | (83.1 | ) | (60.4 | ) | ||||
| Investments in unconsolidated affiliate | (11.2 | ) | (11.8 | ) | ||||
| Net cash received from unconsolidated affiliate | 0.7 | 8.3 | ||||||
| Proceeds from sale of assets | 4.6 | — | ||||||
| Advances to unconsolidated affiliate | — | (1.2 | ) | |||||
| Net cash used in investing activities | (89.0 | ) | (65.1 | ) | ||||
| Financing Activities: | ||||||||
| Net borrowings under revolving loan facilities | — | 15.0 | ||||||
| Repayment of credit facilities | (174.9 | ) | — | |||||
| Repayment of senior notes | (4.3 | ) | — | |||||
| Net repayments of overdraft facility | — | (7.5 | ) | |||||
| Dividend paid to parent | (35.0 | ) | ||||||
| Other | 6.2 | — | ||||||
| Capital contributions received from minority shareholders | 3.6 | 2.7 | ||||||
| Net cash (used in) provided by financing activities | (204.4 | ) | 10.2 | |||||
| Effect of exchange rate changes on cash | (4.6 | ) | (0.7 | ) | ||||
| Decrease in cash and cash equivalents | (25.8 | ) | (12.6 | ) | ||||
| Cash and cash equivalents at beginning of period | 138.0 | 97.8 | ||||||
| Cash and cash equivalents at end of period | $ | 112.2 | $ | 85.2 | ||||
| Supplemental cash flow information: | ||||||||
| Cash paid for interest | $ | 106.6 | $ | 124.5 | ||||
| Cash paid for income taxes | $ | 9.5 | $ | 4.1 | ||||
See accompanying notes to unaudited condensed consolidated financial statements.
6
HUNTSMAN INTERNATIONAL LLC AND SUBSIDIARIES
NOTES TO CONDENSED CONSOLIDATED FINANCIAL STATEMENTS (UNAUDITED)
1. General
Certain Definitions
For convenience in this report, the terms "Company," "our," "us" or "we" may be used to refer to Huntsman International LLC and, unless the context otherwise requires, its subsidiaries. In this report, "HIH" refers to Huntsman International Holdings, LLC, "Huntsman LLC" or "HLLC" refers to Huntsman LLC and, unless the context otherwise requires, its subsidiaries, "HMP" refers to HMP Equity Holdings Corporation, "Huntsman Holdings" refers to Huntsman Holdings, LLC, "Huntsman Corporation" refers to Huntsman Corporation and its predecessors, and, unless the context otherwise requires, their subsidiaries, "AdMat" refers to Huntsman Advanced Materials LLC and, unless the context otherwise requires, its subsidiaries, "MatlinPatterson" refers to MatlinPatterson Global Opportunities Partners L.P. and its affiliates and "ICI" refers to Imperial Chemical Industries PLC and, unless the context otherwise requires, its subsidiaries.
Company
We are a Delaware limited liability company and all of our membership interests are owned by HIH. All of the membership interests of HIH are owned directly and indirectly by Huntsman Corporation.
On February 16, 2005, Huntsman Corporation, our parent corporation, completed initial public offerings of (i) 55,681,819 shares of its common stock sold by Huntsman Corporation and 13,579,546 shares of its common stock sold by a selling stockholder, in each case at a price to the public of $23 per share, and (ii) 5,750,000 shares of its 5% Mandatory Convertible Preferred Stock sold by Huntsman Corporation at a price to the public of $50 per share. Net proceeds to Huntsman Corporation from the offering were approximately $1,500 million, substantially all of which has been used to repay outstanding indebtedness of certain of Huntsman Corporation's subsidiaries, including HMP, Huntsman LLC and HIH. In connection with the offering, Huntsman Corporation and certain affiliates engaged in a series of reorganization transactions. In connection with these reorganization transactions, Huntsman LLC's ownership of HIH was reduced to 42% effective February 16, 2005 from 60% as of December 31, 2004. For financial reporting purposes, this was considered a reorganization of entities under common control; and, beginning in March 2005, Huntsman LLC no longer consolidated our results of operations and has reclassified its financial statements to reflect its membership interest in HIH using the equity method for all periods presented.
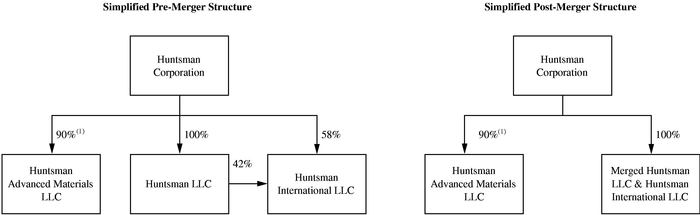
Proposed Merger with Huntsman LLC and Proposed New Credit Facility
In July 2005, Huntsman LLC obtained the required consents from the holders of its senior secured notes and its senior notes to amend certain provisions in the indentures governing its notes. The amendments will facilitate the proposed merger of Huntsman LLC with and into our Company. The proposed merger of Huntsman LLC with and into our Company will help simplify the financing and reporting structure of Huntsman Corporation and is expected to facilitate other organizational efficiencies. We have recently completed the syndication of the proposed new secured credit facility for the merged company. The proposed secured credit facility is expected to be comprised of a $1.85 billion term loan due 2012 and a $650 million revolving loan facility due 2011. Initial interest rate margins under the proposed secured credit facility are contemplated to be at LIBOR plus 1.75%. In addition, we have received a commitment to temporarily expand the commercial paper facility that is part of our accounts receivable securitization program by $50 million from $125 million to $175 million. Proceeds from the new credit facility, together with the expected increase in borrowings under the
7
accounts receivable securitization program, will be used to repay outstanding borrowings under our existing senior secured credit facilities, Huntsman LLC's senior secured credit facilities and certain other debt. We expect to complete the merger and related financing in the third quarter of 2005. However, there can be no assurances that the new facility will be obtained. If the credit facility is not obtained, the proposed merger will not occur.
The following tables provide a summary of our structure before and after the proposed merger:
Business
We are a global manufacturer and marketer of differentiated and commodity chemicals. We manage our business through four operating segments: Polyurethanes, Performance Products, Pigments and Base Chemicals. We manufacture our products at facilities located in North America, Europe, Asia and Africa and sell our products throughout the world.
Principles of Consolidation
Our consolidated financial statements include the accounts of our wholly-owned and majority-owned subsidiaries and any variable interest entities for which we are the primary beneficiary.
Interim Financial Statements
Our unaudited interim condensed consolidated financial statements were prepared in accordance with accounting principles generally accepted in the United States of America ("US GAAP") and in management's opinion, reflect all adjustments, consisting only of normal recurring adjustments necessary for a fair presentation of results of operations, financial position and cash flows for the periods presented. Results for interim periods are not necessarily indicative of those to be expected for the full year. These condensed consolidated financial statements should be read in conjunction with the audited consolidated financial statements and notes to consolidated financial statements included in our Annual Report on Form 10-K for the year ended December 31, 2004.
Use of Estimates
The preparation of financial statements in conformity with US GAAP requires management to make estimates and assumptions that affect the reported amounts of assets and liabilities and disclosure of contingent assets and liabilities at the date of the financial statements and the reported amounts of revenues and expenses during the reporting period. Actual results could differ from those estimates.
8
Reclassifications
Certain amounts in the condensed consolidated financial statements for prior periods have been reclassified to conform with the current presentation.
2. Recently Issued Accounting Pronouncements
In January 2003, the Financial Accounting Standards Board ("FASB") issued Financial Interpretation No. ("FIN") 46, "Consolidation of Variable Interest Entities." FIN 46 addresses the requirements for business enterprises to consolidate related entities, for which they do not have controlling interests through voting or other rights, if they are determined to be the primary beneficiary as a result of variable economic interests. Transfers to a qualifying special purpose entity are not subject to this interpretation. In December 2003, the FASB issued a replacement of FIN 46 (FIN 46R) to clarify certain complexities. We were required to adopt this financial interpretation on January 1, 2005. The adoption of the standard required us to consolidate our Rubicon Inc. joint venture. See "Note 5—Investment in Unconsolidated Affiliates."
In November 2004, the FASB issued Statement of Financial Accounting Standards ("SFAS") No. 151, "Inventory Costs—an amendment of ARB No. 43." SFAS No. 151 requires abnormal amounts of idle facility expense, freight, handling costs, and wasted material to be recognized as current-period charges. It also requires that allocation of fixed production overhead to the costs of conversion be based on the normal capacity of the production facilities. The requirements of the standard will be effective for inventory costs incurred during fiscal years beginning after June 15, 2005. We are reviewing SFAS No. 151 to determine the statement's impact on our consolidated financial statements.
In December 2004, the FASB issued SFAS No. 153, "Exchanges of Nonmonetary Assets—an amendment of APB Opinion No. 29." SFAS No. 153 addresses the measurement of exchanges of nonmonetary assets and eliminates the exception from fair value measurement for nonmonetary exchanges of similar productive assets in APB Opinion No. 29 and replaces it with an exception for exchanges that do not have commercial substance. SFAS No. 153 specifies that a nonmonetary exchange has commercial substance if the future cash flows of the entity are expected to change significantly as a result of the exchange. The provisions of this standard are effective for nonmonetary exchanges occurring in fiscal periods beginning after June 15, 2005. We will apply this standard prospectively.
In December 2004, the FASB issued SFAS No. 123R, "Share Based Payment." SFAS No. 123R requires entities to measure the cost of employee services received in exchange for an award of equity instruments based on the grant-date fair value of the award. That cost will be recognized over the period during which the employee is required to provide services in exchange for the award. This standard eliminates the alternative to use the intrinsic value method of accounting for share-based payments as previously provided in APB Opinion No. 25, "Accounting for Stock Issued to Employees." We adopted SFAS No. 123R effective January 1, 2005, and have applied this standard prospectively to share-based awards issued to our employees in connection with Huntsman Corporation's initial public offering. In connection with Huntsman Corporation's initial public offering of common stock on February 16, 2005, certain of our employees received Huntsman Corporation stock options and restricted stock. Accordingly, we were allocated share-based compensation expense of $0.5 million and $0.7 million during the three and six months ended June 30, 2005, respectively. We did not have share-based awards prior to the awards issued in connection with Huntsman Corporation's initial public offering.
In March 2005, the FASB issued FIN 47, "Accounting for Conditional Asset Retirement Obligations." FIN 47 clarifies the term conditional asset retirement obligation used in SFAS No. 143, "Accounting for Asset Retirement Obligations," and clarifies when an entity would have sufficient information to reasonably estimate the fair value of an asset retirement obligation. FIN 47 is effective no later than
9
the end of December 2005. We are reviewing FIN 47 to determine its impact on our financial statements.
In March 2005, the Emerging Issues Task Force issued a preliminary consensus on issue 04-13, "Accounting for Purchase and Sales of Inventory with the Same Counterparty," that, if ratified by the FASB, would require companies to recognize an exchange of finished goods for raw materials or work-in-process within the same line of business at fair value. All other exchanges of inventory would be reflected at the recorded amount. We are evaluating the impact of this preliminary consensus to determine its impact on our results of operations.
In May 2005, the FASB issued SFAS No. 154, "Accounting Changes and Error Corrections—a replacement of APB Opinion No. 20 and FASB Statement No. 3" SFAS No. 154 requires retrospective application to prior periods' financial statements of changes in accounting principle, unless it is impracticable to determine either the period-specific effects or the cumulative effect of the change or unless specific transition provisions are proscribed in the accounting pronouncements. SFAS No. 154 does not change the accounting guidance for reporting a correction of an error in previously issued financial statements or a change in accounting estimate. SFAS No. 154 is effective for accounting changes and error corrections made after December 31, 2005. We will apply this standard prospectively.
3. Inventories
Inventories consisted of the following (dollars in millions):
| |
June 30, 2005 |
December 31, 2004 |
||||
|---|---|---|---|---|---|---|
| Raw materials and supplies | $ | 153.3 | $ | 191.4 | ||
| Work in progress | 37.6 | 45.4 | ||||
| Finished goods | 568.2 | 498.8 | ||||
| Total | $ | 759.1 | $ | 735.6 | ||
In the normal course of operations, we exchange raw materials with other companies. No gains or losses are recognized on these exchanges, and the net open exchange positions are valued at our cost. The amount included in inventory under open exchange agreements receivable by us at June 30, 2005 was $1.9 million (6.6 million pounds of feedstock and products), which represented the amount to be received by us under open exchange agreements. The amount included in inventory under open exchange agreements receivable by us at December 31, 2004 was $1.1 million (2.1 million pounds of feedstock and products).
4. Property, Plant and Equipment
The cost and accumulated depreciation of property, plant and equipment were as follows (dollars in millions):
| |
June 30, 2005 |
December 31, 2004 |
|||||
|---|---|---|---|---|---|---|---|
| Land | $ | 52.0 | $ | 56.7 | |||
| Buildings | 237.9 | 230.9 | |||||
| Plant and equipment | 3,872.8 | 4,095.9 | |||||
| Construction in progress | 213.4 | 173.2 | |||||
| Total | 4,376.1 | 4,556.7 | |||||
| Less accumulated depreciation | (1,454.7 | ) | (1,373.0 | ) | |||
| Net | $ | 2,921.4 | $ | 3,183.7 | |||
10
Depreciation expense for the three and six months ended June 30, 2005 and 2004 was $66.7 million and $72.0 million, respectively, and $135.6 million and $141.3 million, respectively.
Property, plant and equipment includes gross assets acquired under capital leases of $16.0 million and $16.6 million at June 30, 2005 and December 31, 2004, respectively; related amounts included in accumulated depreciation were $4.6 million and $5.4 million at June 30, 2005 and December 31, 2004, respectively.
5. Investment in Unconsolidated Affiliates
Our ownership percentage and investment in unconsolidated affiliates, primarily manufacturing joint ventures, were as follows (dollars in millions):
| |
June 30, 2005 |
December 31, 2004 |
||||
|---|---|---|---|---|---|---|
| Louisiana Pigment Company, L.P. (50%) | $ | 120.9 | $ | 121.6 | ||
| BASF Huntsman Shanghai Isocyanate Investment BV (50%)(a) | 25.9 | 17.9 | ||||
| Rubicon, Inc. (50%)(b) | — | 5.7 | ||||
| Others | 4.7 | 1.0 | ||||
| Total | $ | 151.5 | $ | 146.2 | ||
6. Intangible Assets
The gross carrying amount and accumulated amortization of intangible assets were as follows (dollars in millions):
| |
June 30, 2005 |
December 31, 2004 |
||||||||||||||||
|---|---|---|---|---|---|---|---|---|---|---|---|---|---|---|---|---|---|---|
| |
Carrying Amount |
Accumulated Amortization |
Net |
Carrying Amount |
Accumulated Amortization |
Net |
||||||||||||
| Patents, trademarks, and technology | $ | 386.5 | $ | 155.8 | $ | 230.7 | $ | 389.9 | $ | 142.7 | $ | 247.2 | ||||||
| Non-compete agreements | 49.4 | 44.0 | 5.4 | 49.9 | 43.1 | 6.8 | ||||||||||||
| Total | $ | 435.9 | $ | 199.8 | $ | 236.1 | $ | 439.8 | $ | 185.8 | $ | 254.0 | ||||||
Amortization expense for intangible assets for the three months ended June 30, 2005 and 2004 was $6.7 million and $7.2 million, respectively, and for the six months ended June 30, 2005 and 2004 was $13.6 million and $15.5 million, respectively.
11
7. Other Noncurrent Assets
Other noncurrent assets consisted of the following (dollars in millions):
| |
June 30, 2005 |
December 31, 2004 |
||||
|---|---|---|---|---|---|---|
| Prepaid pension costs | $ | 250.4 | $ | 266.0 | ||
| Debt issuance costs, net | 43.9 | 52.5 | ||||
| Capitalized turnaround costs, net | 57.2 | 72.7 | ||||
| Spare parts inventory, net | 63.1 | 56.7 | ||||
| Other noncurrent assets | 62.4 | 35.2 | ||||
| Total | $ | 477.0 | $ | 483.1 | ||
8. Accrued Liabilities
Accrued liabilities consisted of the following (dollars in millions):
| |
June 30, 2005 |
December 31, 2004 |
||||
|---|---|---|---|---|---|---|
| Payroll and related costs | $ | 81.3 | $ | 112.1 | ||
| Interest | 70.6 | 62.8 | ||||
| Volume rebate accruals | 41.2 | 64.1 | ||||
| Income tax payable | 33.4 | 26.7 | ||||
| Taxes (other than income tax) | 24.2 | 36.5 | ||||
| Restructuring and plant closing costs | 51.0 | 87.6 | ||||
| Environmental accruals | 6.6 | 5.7 | ||||
| Other accrued liabilites | 16.6 | 24.2 | ||||
| Total | $ | 324.9 | $ | 419.7 | ||
9. Other Noncurrent Liabilities
Other noncurrent liabilities consisted of the following (dollars in millions):
| |
June 30, 2005 |
December 31, 2004 |
||||
|---|---|---|---|---|---|---|
| Pension liabilities | $ | 241.1 | $ | 168.6 | ||
| Restructuring and plant closing costs | 24.3 | 19.0 | ||||
| Other postretirement benefits | 11.8 | 12.2 | ||||
| Environmental accruals | 12.0 | 15.5 | ||||
| Other noncurrent liabilities | 66.2 | 54.2 | ||||
| Total | $ | 355.4 | $ | 269.5 | ||
12
10. Restructuring and Plant Closing Costs
As of June 30, 2005 and December 31, 2004, accrued restructuring and plant closing costs by type of cost and activity consisted of the following (dollars in millions):
| |
Workforce reductions |
Demolition and decommissioning |
Non-cancelable lease costs |
Other restructuring costs |
Total(1) |
|||||||||||
|---|---|---|---|---|---|---|---|---|---|---|---|---|---|---|---|---|
| Accrued liabilities as of December 31, 2004 | $ | 82.9 | $ | 4.8 | $ | 5.1 | $ | 13.8 | $ | 106.6 | ||||||
| 2005 charges for 2003 activities | 13.2 | — | — | 1.7 | 14.9 | |||||||||||
| 2005 charges for 2004 activities | 10.0 | 0.2 | 0.1 | 0.6 | 10.9 | |||||||||||
| Reversal of reserves no longer required | — | — | — | (0.4 | ) | (0.4 | ) | |||||||||
| 2005 payments for 2003 activities | (12.6 | ) | — | — | (1.3 | ) | (13.9 | ) | ||||||||
| 2005 payments for 2004 activities | (35.1 | ) | — | — | (0.7 | ) | (35.8 | ) | ||||||||
| Foreign currency effect on reserve balance | (7.0 | ) | — | — | — | (7.0 | ) | |||||||||
| Accrued liabilities as of June 30, 2005 | $ | 51.4 | $ | 5.0 | $ | 5.2 | $ | 13.7 | $ | 75.3 | ||||||
| |
June 30, 2005 |
December 31, 2004 |
||||
|---|---|---|---|---|---|---|
| Accrued liabilities by activities were as follows: | ||||||
| 2003 activities | $ | 23.6 | $ | 22.6 | ||
| 2004 activities | 55.0 | 80.3 | ||||
| Foreign currency effect on reserve balance | (3.3 | ) | 3.7 | |||
| Total | $ | 75.3 | $ | 106.6 | ||
Details with respect to our reserves for restructuring and plant closing costs are provided below by segments and activity (dollars in millions):
| |
Polyurethanes |
Performance Products |
Pigments |
Base Chemicals |
Total |
|||||||||||||
|---|---|---|---|---|---|---|---|---|---|---|---|---|---|---|---|---|---|---|
| Accrued liabilities as of December 31, 2004 | $ | 19.0 | $ | 50.5 | $ | 22.0 | $ | 15.1 | $ | 106.6 | ||||||||
| 2005 charges for 2003 activities | 3.3 | — | 11.6 | — | 14.9 | |||||||||||||
| 2005 charges for 2004 activities | 1.1 | — | 5.7 | 4.1 | 10.9 | |||||||||||||
| Reversal of reserves no longer required | — | (0.4 | ) | — | — | (0.4 | ) | |||||||||||
| 2005 payments for 2003 activities | (3.8 | ) | (0.8 | ) | (9.3 | ) | — | (13.9 | ) | |||||||||
| 2005 payments for 2004 activities | (3.6 | ) | (12.5 | ) | (8.9 | ) | (10.8 | ) | (35.8 | ) | ||||||||
| Foreign currency effect on reserve balance | (1.4 | ) | (3.1 | ) | (2.0 | ) | (0.5 | ) | (7.0 | ) | ||||||||
| Accrued liabilities as of June 30, 2005 | $ | 14.6 | $ | 33.7 | $ | 19.1 | $ | 7.9 | $ | 75.3 | ||||||||
| Current portion of restructuring reserve | $ | 6.2 | $ | 23.8 | $ | 13.1 | $ | 7.9 | $ | 51.0 | ||||||||
| Long-term portion of restructuring reserve | 8.4 | 9.9 | 6.0 | — | 24.3 | |||||||||||||
| Estimated additional future charges for current restructuring projects: | ||||||||||||||||||
| Estimated additional charges within one year | ||||||||||||||||||
| Cash charges | $ | 3.0 | $ | — | $ | 7.8 | $ | 1.9 | $ | 12.7 | ||||||||
| Estimated additional charges beyond one year | ||||||||||||||||||
| Cash charges | $ | — | $ | — | $ | 13.1 | $ | 4.6 | $ | 17.7 | ||||||||
As of June 30, 2005 and December 31, 2004, we had reserves for restructuring and plant closing costs of $75.3 million and $106.6 million, respectively. During the six months ended June 30, 2005, we
13
recorded additional net charges of $25.5 million consisting of $25.4 million payable in cash and $0.1 million of non-cash charges, for workforce reductions, demolition and decommissioning and other restructuring costs associated with closure or curtailment of activities at our smaller, less efficient manufacturing facilities. During the first six months of 2005, we made cash payments against these reserves of $49.7 million.
As of December 31, 2004, our Polyurethanes segment reserve consisted of $19.0 million related to various restructuring programs, including the closure of our West Deptford, New Jersey site (as announced in 2004), restructuring activities at the Rozenburg, Netherlands site (as announced in 2003), workforce reductions throughout our Polyurethanes segment (as announced in 2003), and the closure of our Shepton Mallet, U.K. site (as announced in 2002). During the six months ended June 30, 2005, our Polyurethanes segment recorded restructuring charges of $4.4 million related to these activities which was payable in cash, recorded a non-cash credit of $0.3 million to reverse reserves no longer required and made cash payments of $7.4 million. These restructuring activities are expected to result in additional restructuring charges of approximately $3 million. During the six months ended June 30, 2004 our Polyurethanes segment recorded restructuring charges of $22.9 million.
As of December 31, 2004, our Performance Products segment reserve consisted of $50.5 million related to various restructuring programs across our European surfactants business, including the closure of substantially all of our Whitehaven, U.K. surfactants facility. These restructuring activities are not expected to result in additional restructuring charges. During the six months ended June 30, 2005, our Performance Products segment recorded a non-cash restructuring charge of $0.4 million, a credit of $0.4 million to reverse reserves no longer required and made cash payments of $13.3 million. During the six months ended June 30, 2004, our Performance products segment recorded restructuring charges of $0.4 million.
As of December 31, 2004, our Pigments segment reserve consisted of $22.0 million related to its global workforce reductions announced in 2003 and the reduction of its titanium dioxide ("TiO2") production capacity announced in 2004. During the six months ended June 30, 2005, our Pigments segment recorded restructuring charges of $17.3 million related to these restructuring activities, all of which was payable in cash, and made cash payments of $18.2 million. These restructuring activities are expected to result in additional restructuring charges of approximately $17 million through 2006. During July 2005, our Pigments and Base Chemicals segments announced that they would establish a single U.K. headquarters in Teesside, U.K. This will result in the closure of our Pigment segment's Billingham, U.K. headquarters and the creation of a new support center for both businesses. This restructuring activity is expected to result in additional restructuring charges of approximately $8 million, approximately $4 million of which will be incurred by our Pigments segment and approximately $4 million by the Base Chemicals segment. During the six months ended June 30, 2004, the Pigments segment recorded restructuring charges of $108.1 million.
As of December 31, 2004, our Base Chemicals segment reserve consisted of $15.1 million related primarily to workforce reductions arising from the announced change in work shift schedules and in the engineering and support functions at our Wilton and North Tees, U.K. facilities. During the six months ended June 30, 2005, our Base Chemicals segment recorded restructuring charges of $4.1 million, all of which was payable in cash, and made cash payments of $10.8 million. These restructuring activities are expected to result in additional restructuring charges of approximately $2 million through 2006.
14
Outstanding debt consisted of the following (dollars in millions):
| |
June 30, 2005 |
December 31, 2004 |
||||||
|---|---|---|---|---|---|---|---|---|
| HI Credit Facilities: | ||||||||
| Term B loan | $ | 1,132.7 | $ | 1,314.1 | ||||
| HI Senior Notes | 455.4 | 456.0 | ||||||
| HI Subordinated Notes | 1,158.1 | 1,242.0 | ||||||
| Other debt | 49.6 | 42.7 | ||||||
| Total Debt | 2,795.8 | 3,054.8 | ||||||
| Less current portion | (20.7 | ) | (10.5 | ) | ||||
| Long Term Debt | $ | 2,775.1 | $ | 3,044.3 | ||||
HI Credit Facilities
As of June 30, 2005, we had senior secured credit facilities (the "HI Credit Facilities") which consisted of a revolving loan facility of up to $375 million maturing in September 2008 (the "HI Revolving Facility"), which includes a $50 million multicurrency revolving loan facility available in euros, GBP Sterling and U.S. dollars, and a term loan B facility consisting of a $1,082.5 million term portion and a €41.6 million (approximately $50.2 million) term portion (the "HI Term Facility"). On March 24, 2005 and June 6, 2005, we made voluntary payments of $75.0 million and $100 million dollar equivalents, respectively, on the HI Term Facility. The maturity of the HI Term Facility is December 31, 2010; provided that the maturity will be accelerated to December 31, 2008 if we have not refinanced all of the outstanding HI Senior Notes and the HI Subordinated Notes (as defined below) on or before December 31, 2008 on terms satisfactory to the administrative agent under the HI Credit Facilities. Scheduled amortization of the HI Term Facility is approximately $11.4 million per annum commencing June 30, 2006, with the remaining unpaid balance due at maturity. The HI Credit Facilities allow us to borrow up to $100 million secured by letters of credit; however, the $375 million revolving credit facility is reduced dollar-for-dollar by any letters of credit outstanding. As of June 30, 2005, there were no loans outstanding on the HI Revolving Facility, and there were $6.9 million in letters of credit outstanding.
Interest rates for the amended and restated HI Credit Facilities are based upon, at our option, either a eurocurrency rate (LIBOR) or a base rate (prime) plus the applicable spread. The applicable spreads vary based on a pricing grid, depending on the loan facility and whether specified conditions have been satisfied, in the case of eurocurrency-based term loans, from 2.25% to 2.50% per annum for term B dollar loans and from 3.00% to 3.25% per annum for term B euro loans, and, in the case of base rate term loans, from 1.00% to 1.25% per annum for term B dollar loans. The applicable spread for eurocurrency-based revolving loans ranges from 2.25% to 3.25% and for base rate revolving loans from 1.00% to 2.00%. As of June 30, 2005, the weighted average interest rate on the HI Credit Facilities was approximately 5.5%, excluding the impact of interest rate hedges.
The HI Credit Facilities are secured by a first priority lien on substantially all our assets and all the assets of our domestic subsidiaries and certain of our foreign subsidiaries. The HI Credit Facilities are also guaranteed by HIH, our domestic subsidiaries and certain of our foreign subsidiaries (the "HI Guarantors").
The agreements governing the HI Credit Facilities contain customary financial covenants; covenants relating to the incurrence of debt, the purchase and sale of assets, limitations on investments and affiliate transactions; change in control provisions; events of default provisions; and acceleration
15
provisions. Management believes that we are in compliance with the covenants of the HI Credit Facilities.
HI Senior Notes and HI Subordinated Notes
In March 2002, we sold $300 million aggregate principal amount of HI Senior Notes that are due in 2009. On April 11, 2003, we sold an additional $150 million aggregate principal amount of the HI Senior Notes at an issue price of 105.25%. Net proceeds from the sale of these notes were used to repay amounts outstanding under the HI Credit Facilities. The HI Senior Notes are unsecured obligations. Interest on the HI Senior Notes is payable semiannually in March and September. The HI Senior Notes are redeemable after March 1, 2006 at 104.937% of the original aggregate principal amount thereof, declining ratably to par on and after March 1, 2008.
On December 17, 2004, we completed an offering of $175 million of our 7.375% senior subordinated notes due 2015 and €135 million of our 7.5% senior subordinated notes due 2015 (the "HI Senior Subordinated Notes due 2015"). We used all of the net proceeds to redeem part of our outstanding 10.125% senior subordinated notes due 2009 (the "HI Senior Subordinated Notes due 2009" and, together with the HI Senior Subordinated Notes due 2015, the "HI Senior Subordinated Notes"). Prior to the partial redemptions discussed below, we had outstanding $600 million and € 450 million of the HI Senior Subordinated Notes due 2009. The HI Senior Subordinated Notes due 2009 became redeemable on July 1, 2004 at 105.063% of the principal amount thereof, which declines ratably to par on and after July 1, 2007. We redeemed $231 million and €77 million of Senior Subordinated Notes due 2009 on December 31, 2004 and $2.9 million and €1.0 million of Senior Subordinated Notes due 2009 on January 3, 2005. In connection with these redemptions, we paid approximately $17.0 million and $0.2 million in U.S. dollar equivalents in redemption premiums on December 31, 2004 and January 3, 2005, respectively.
As of December 31, 2004, following the December 31, 2004 partial redemption of the HI Senior Subordinated Notes due 2009, we had outstanding $369 million and €373 million of Senior Subordinated Notes due 2009 and $175 million and €135 million of HI Senior Subordinated Notes due 2015, for a combined total of $544 million and €508 million of HI Senior Subordinated Notes plus $5.3 million of unamortized premium. As of June 30, 2005, we had outstanding $366.1 million and €372.0 million of HI Senior Subordinated Notes due 2009 and $175 million and €135 million of HI Senior Subordinated Notes due 2015, for a combined total of $541.1 million and €507.0 million of HI Senior Subordinated Notes plus $4.3 million of unamortized premium. The $175 million and €135 million HI Senior Subordinated Notes due 2015 are redeemable on or after January 1, 2010 at 103.688% and 103.750%, respectively, of the principal amount thereof, which declines ratably to par on and after January 1, 2013. In addition, at any time prior to January 1, 2008, we may redeem up to 40% of the original aggregate principal amount of the $175 million and €135 million Senior Subordinated Notes due 2015 at redemption prices of 107.375% and 107.5% plus accrued and unpaid interest, respectively. The HI Senior Subordinated Notes are unsecured and interest is payable semiannually in January and July of each year.
The HI Senior Notes and the HI Senior Subordinated Notes contain covenants relating to the incurrence of debt, limitations on distributions, asset sales and affiliate transactions, among other things. They also contain a change of control provision requiring us to offer to repurchase the HI Senior Notes and the HI Subordinated Notes upon a change of control. Management believes that we are in compliance with the covenants of the HI Senior Notes and the HI Senior Subordinated Notes.
16
Other Debt
We maintain a $25 million multicurrency overdraft facility used for the working capital needs for our European subsidiaries (the "HI European Overdraft Facility"). As of June 30, 2005 and December 31, 2004, there were no borrowings outstanding under the HI European Overdraft Facility.
Included within Other Debt is debt associated with one of our Chinese MDI joint ventures. In January 2003, we entered into a joint venture agreement with Shanghai Chlor-Alkali Chemical Company, Ltd. to build MDI production facilities near Shanghai, China. We own 70% of Huntsman Polyurethanes Shanghai Ltd. ("Consolidated Chinese Splitting JV"), which is a consolidated affiliate. On September 19, 2003, the Consolidated Chinese Splitting JV obtained secured financing for the construction of the production facilities, consisting of various committed loans in the aggregate amount of approximately $119 million in U.S. dollar equivalents. As of June 30, 2005, there were $12.0 million outstanding in U.S. dollar borrowings and 80.0 million in RMB borrowings ($9.7 million) under these facilities. The interest rate on these facilities is LIBOR plus 0.48% for U.S. dollar borrowings and 90% of the Peoples Bank of China rate for RMB borrowings. As of June 30, 2005, the interest rate for U.S. dollar borrowings was approximately 4.0% and was 5.5% for RMB borrowings. The loans are secured by substantially all the assets of the Consolidated Chinese Splitting JV and will be repaid in 16 semiannual installments beginning no later than June 30, 2007. The financing is non-recourse to us, but is guaranteed during the construction phase by affiliates of the Consolidated Chinese Splitting JV, including Huntsman Corporation, as the successor to Huntsman Holdings. Huntsman Corporation has unconditionally guaranteed 70% of any amounts due and unpaid by the Consolidated Chinese Splitting JV under the loans described above (except for the VAT facility, which is not guaranteed). Huntsman Corporation's guarantees remain in effect until the Consolidated Chinese Splitting JV has (i) commenced production at at least 70% of capacity for at least 30 days, and (ii) achieved a debt service coverage ratio of at least 1.5:1. Our Chinese MDI joint ventures are unrestricted subsidiaries under the HI Credit Facilities and under the indentures governing the HI Senior Notes and the HI Subordinated Notes.
Maturities
The scheduled maturities of our debt are as follows (dollars in millions):
| Year ending December 31: |
|
|||
|---|---|---|---|---|
| 2005 | $ | 8.4 | ||
| 2006 | 13.6 | |||
| 2007 | 13.2 | |||
| 2008 | 13.4 | |||
| 2009 | 1,289.0 | |||
| Later Years | 1,458.2 | |||
| Total | $ | 2,795.8 | ||
12. Derivative Instruments and Hedging Activities
We are exposed to market risks, such as changes in interest rates, foreign exchange rates, and commodity pricing risks. From time to time we enter into transactions, including transactions involving derivative instruments, to manage exposures. We manage interest rate exposure through a program designed to reduce the impact of fluctuations in variable interest rates and to meet the requirements of certain financing agreements.
17
Interest Rate Hedging
Through our borrowing activities, we are exposed to interest rate risk. Such risk arises due to the structure of our debt portfolio, including the duration of the portfolio and the mix of fixed and floating interest rates. Prior to the amendment and restatement of the HI Credit Facilities on July 13, 2004, the HI Credit Facilities required that a certain portion of debt be at fixed rates through either interest rate hedges or through other means that provided a similar effect. Effective July 13, 2004, the HI Credit Facilities no longer require interest rate hedging. In recent years, we have issued fixed rate debt in the form of the HI Senior Notes and HI Subordinated Notes that serves to reduce overall risk to interest fluctuations.
As of June 30, 2005 and December 31, 2004, there were no swap agreement liabilities. The change in the liability resulted in interest income for the six months ended June 30, 2004 of $1.6 million.
Commodity Price Hedging
During the three months ended June 30, 2005 and the three months ended June 30, 2004, the Company recorded an increase of $8.6 million and an increase of $0.7 million, respectively, in cost of goods sold related to net gains and losses from settled contracts, net gains and losses in fair value price hedges, and the change in fair value on commodity price hedges not designated as hedges as defined in SFAS No. 133.
During the six months ended June 30, 2005 and the six months ended June 30, 2004, the Company recorded an increase of $11.3 million and of $3.3 million, respectively, in cost of goods sold related to net gains and losses from settled contracts, net gains and losses in fair value price hedges, and the change in fair value on commodity price hedges not designated as hedges as defined in SFAS No. 133.
Foreign Currency Rate Hedging
We may enter into foreign currency derivative instruments to minimize the short-term impact of movements in foreign currency rates. These contracts are not designated as hedges for financial reporting purposes and are recorded at fair value. As of June 30, 2005 and December 31, 2004 and for the six months ended June 30, 2005 and 2004, the fair value, change in fair value, and realized gains (losses) of outstanding foreign currency rate hedging contracts were insignificant.
Net Investment Hedging
As of June 30, 2005, we have designated €176.6 million of our euro-denominated debt as a hedge of our net investment in foreign operations. Currency effects on net investment hedges for the three months ended June 30, 2005 and 2004 produced a gain of $15.7 million and a gain of $3.8 million, respectively, and for the six months ended June 30, 2005 and 2004, respectively, a gain of $45.7 million and a gain of $19.0 million in other comprehensive loss (foreign currency translation adjustments). As of June 30, 2005 and December 31, 2004, there was a cumulative net loss recorded in other comprehensive income (loss) of approximately $142.8 million and $188.5 million, respectively. During the first quarter of 2005, we dedesignated €275 million of euro-denominated debt as a net investment hedge and on April 1, 2005, we dedesignated an additional €97 million of euro-denominated debt as a net investment hedge. These actions resulted in approximately $40.4 million less foreign currency losses during the six months ended June 30, 2005.
On December 10, 2004, we entered into a cross-currency interest rate swap. The cross-currency swap requires us to pay euros and receive U.S. dollars at the maturity date of January 1, 2010. The U.S. dollar notional amount is $175 million and bears interest at a fixed rate of approximately 7.4%, payable semiannually on January 1 and July 1. The euro notional amount is approximately €132 million and bears interest at a blended fixed rate of approximately 6.6%, payable semiannually on January 1
18
and July 1. We have designated this cross-currency swap as a hedge of our net investment in euro-denominated operations.
13. Securitization of Accounts Receivable
On December 21, 2000, we initiated an accounts receivable securitization program under which we grant an undivided interest in certain of our trade receivables to a qualified off-balance sheet entity (the "Receivables Trust") at a discount. This undivided interest serves as security for the issuance of commercial paper and medium-term notes by the Receivables Trust.
At June 30, 2005 and December 31, 2004, the Receivables Trust had approximately $194.4 million and $208.4 million, respectively in U.S. dollar equivalents in medium-term notes outstanding and approximately $18.1 million in U.S. dollar equivalents and nil, respectively in commercial paper outstanding. The medium-term notes have a scheduled maturity date of September 15, 2006. Our commercial paper facility has a maturity date of June 30, 2007 and provides for the issuance of both Euro- and U.S. dollar-denominated commercial paper up to a U.S. dollar equivalent of $125 million. We recently received a commitment to temporarily expand the commercial paper facility by $50 million to $175 million upon completion of the proposed merger of Huntsman LLC with and into our Company. The $50 million expansion would be available through March 31, 2006. Under the terms of the agreements, we and our subsidiaries continue to service the receivables in exchange for a fee of 1% of the outstanding receivables, and we are subject to recourse provisions.
Our retained interest in receivables (including servicing assets) subject to the program was approximately $336.7 million and $327.6 million as of June 30, 2005 and December 31, 2004, respectively. The value of the retained interest is subject to credit and interest rate risk. For the six months ended June 30, 2005 and 2004, new sales of accounts receivable sold into the program totaled approximately $2,890.8 million and $2,379.6 million, respectively, and cash collections from receivables sold into the program that were reinvested totaled $2,834.9 million and $2,335.1 million, respectively. Servicing fees received during the six months ended June 30, 2005 and 2004 were approximately $3.1 million and $2.6 million, respectively.
We incur losses on the accounts receivable securitization program for the discount on receivables sold into the program and fees and expenses associated with the program. We also retain responsibility for the economic gains and losses on forward contracts mandated by the terms of the program to hedge the currency exposures on the collateral supporting the off-balance sheet debt issued. Gains and losses on forward contracts included as a component of the loss on accounts receivable securitization program were nil and a loss of $1.2 million for the six months ended June 30, 2005 and 2004, respectively. As of each of June 30, 2005 and December 31, 2004, the fair value of the open forward currency contracts was nil.
The key economic assumptions used in valuing the residual interest are presented below:
| |
June 30, 2005 |
|
|---|---|---|
| Weighted average life (in months) | Approx. 1.5 | |
| Credit losses (annual rate) | Less than 1% | |
| Discount rate (annual rate) | Approx. 1% |
A 10% and 20% adverse change in any of the key economic assumptions would not have a material impact on the fair value of the retained interest. Total receivables over 60 days past due as of June 30, 2005 and December 31, 2004 were $15.5 million and $12.1 million, respectively.
19
14. Employee Benefit Plans
Components of the net periodic benefit costs for the three and six months ended June 30, 2005 and 2004 were as follows (dollars in millions):
| |
Defined Benefit Plans |
Other Postretirement Benefit Plans |
||||||||||||
|---|---|---|---|---|---|---|---|---|---|---|---|---|---|---|
| Components of net periodic benefit cost |
Three Months Ended June 30, 2005 |
Three Months Ended June 30, 2004 |
Three Months Ended June 30, 2005 |
Three Months Ended June 30, 2004 |
||||||||||
| Service cost | $ | 10.4 | $ | 9.7 | $ | — | $ | 0.1 | ||||||
| Interest cost | 20.8 | 18.2 | 0.1 | 0.2 | ||||||||||
| Expected return on assets | (24.6 | ) | (20.2 | ) | — | — | ||||||||
| Amortization of prior service cost | 0.1 | 0.1 | — | — | ||||||||||
| Amortization of actuarial loss | 6.2 | 5.0 | — | (0.1 | ) | |||||||||
| Net periodic benefit cost | $ | 12.9 | $ | 12.8 | $ | 0.1 | $ | 0.2 | ||||||
| |
Defined Benefit Plans |
Other Postretirement Benefit Plans |
||||||||||||
|---|---|---|---|---|---|---|---|---|---|---|---|---|---|---|
| Components of net periodic benefit cost |
Six Months Ended June 30, 2005 |
Six Months Ended June 30, 2004 |
Six Months Ended June 30, 2005 |
Six Months Ended June 30, 2004 |
||||||||||
| Service cost | $ | 20.8 | $ | 19.4 | $ | — | $ | 0.2 | ||||||
| Interest cost | 41.6 | 36.3 | 0.2 | 0.4 | ||||||||||
| Expected return on assets | (49.2 | ) | (40.3 | ) | — | — | ||||||||
| Amortization of prior service cost | 0.2 | 0.2 | — | (0.1 | ) | |||||||||
| Amortization of actuarial loss | 12.4 | 10.0 | — | 0.1 | ||||||||||
| Net periodic benefit cost | $ | 25.8 | $ | 25.6 | $ | 0.2 | $ | 0.6 | ||||||
15. Other Comprehensive Loss
The components of other comprehensive loss were as follows (dollars in millions):
| |
Accumulated Other Comprehensive Income (Loss) |
Other Comprehensive Income (Loss) |
Other Comprehensive Income (Loss) |
||||||||||||||||
|---|---|---|---|---|---|---|---|---|---|---|---|---|---|---|---|---|---|---|---|
| |
June 30, 2005 |
December 31, 2004 |
Three Months Ended June 30, 2005 |
Three Months Ended June 30, 2004 |
Six Months Ended June 30, 2005 |
Six Months Ended June 30, 2004 |
|||||||||||||
| Foreign currency translation adjustments | $ | 111.2 | $ | 270.3 | $ | (106.2 | ) | $ | (16.1 | ) | $ | (159.1 | ) | $ | (19.5 | ) | |||
| Additional minimum pension liability, net of tax benefit of $6.8 million as of June 30, 2005 and $29.3 million as of December 31, 2004 | (98.2 | ) | (93.2 | ) | — | (2.7 | ) | (5.0 | ) | — | |||||||||
| Additional minimum pension liability—unconsolidated affiliate | (0.8 | ) | (5.8 | ) | — | — | 5.0 | — | |||||||||||
| Unrealized gain (loss) on securities | 0.3 | 0.9 | (0.1 | ) | 0.9 | (0.6 | ) | 0.8 | |||||||||||
| Net unrealized gain (loss) on derivative instruments | 14.2 | (5.7 | ) | 11.7 | 2.4 | 19.9 | 5.0 | ||||||||||||
| Total | $ | 26.7 | $ | 166.5 | $ | (94.6 | ) | $ | (15.5 | ) | $ | (139.8 | ) | $ | (13.7 | ) | |||
20
Items of other comprehensive loss of our Company and our consolidated affiliates have been recorded net of tax, with the exception of the foreign currency translation adjustments related to subsidiaries with earnings permanently reinvested. The tax effect is determined based upon the jurisdiction where the income or loss was recognized and is net of valuation allowances that have been recorded.
16. Commitments and Contingencies
Purchase Commitments
We have various purchase commitments extending through 2023 for materials, supplies and services entered into in the ordinary course of business. The purchase commitments are contracts that require minimum volume purchases. Certain contracts allow for changes in minimum required purchase volumes in the event of a temporary or permanent shutdown of a facility. The contractual purchase price for substantially all of these contracts is variable based upon market prices, subject to annual negotiations. We have also entered into a limited number of contracts which require minimum payments, even if no volume is purchased. These contracts approximate $143 million in 2005, declining to approximately $17 million after 2009. Historically, we have not made any minimum payments under our take or pay contracts without taking product.
Legal Matters
Certain claims have been filed against us relating to discoloration of unplasticized polyvinyl chloride products allegedly caused by our titanium dioxide ("Discoloration Claims"). Substantially all of the titanium dioxide that is the subject of these claims was manufactured prior to our acquisition of our titanium dioxide business from ICI in 1999. Net of amounts we have received from insurers and pursuant to contracts of indemnity, we have paid approximately $15.8 million in costs and settlement amounts for Discoloration Claims as of June 30, 2005.
The following table presents information about the number of Discoloration Claims for the period indicated. Claims include all claims for which service has been received by us, and each such claim represents a plaintiff who is pursuing a claim against us.
| |
Six months ended June 30, 2005 |
|
|---|---|---|
| Claims filed during period | 0 | |
| Claims resolved during period | 1 | |
| Claims unresolved at end of period | 2 |
In March 2005, one of the Discoloration Claims that was unresolved as of December 31, 2004 was amended to assert additional damages of approximately $52.2 million. During the six months ended June 30, 2005, we settled a claim for approximately $0.9 million, all of which is indemnified and for which we are currently seeking reimbursement. The two Discoloration Claims unresolved as of June 30, 2005 asserted aggregate damages of approximately $52.2 million. A liability has been accrued for these claims. Based on our understanding of the merits of these claims and our rights under contracts of indemnity and insurance, we do not believe that the net impact on our financial condition, results of operations or liquidity will be material.
While additional Discoloration Claims may be made in the future, we cannot reasonably estimate the amount of loss related to such claims. Although we may incur additional costs as a result of future claims (including settlement costs), based on our history with Discoloration Claims to date, the fact that substantially all of the titanium dioxide that has been the subject of these Discoloration Claims was manufactured and sold more than five years ago, and the fact that we have rights under contract to indemnity, including from ICI, we do not believe that any unasserted possible Discoloration Claims, if
21
any, will have a material impact on our financial condition, results of operations, or liquidity. Based on this conclusion and our inability to reasonably estimate our expected costs with respect to these unasserted possible claims, we have made no accruals in our financial statements as of June 30, 2005 for costs associated with unasserted possible Discoloration Claims, if any.
Certain insurers have denied coverage with respect to certain Discoloration Claims. We brought suit against these insurers to recover the amounts we believe are due to us. The court found in favor of the insurers. That decision was appealed to the Court of Appeal, which also found in favor of the insurers. We intend to apply for leave to appeal to the House of Lords.
We are a party to various other proceedings instituted by private plaintiffs, governmental authorities, and others arising under provisions of applicable laws, including various environmental, products liability, and other laws. Except as otherwise disclosed in this report, we do not believe that the outcome of any of these matters will have a material adverse effect on our financial condition, results of operations or liquidity. See "Note 17—Environmental, Health and Safety Matters."
17. Environmental, Health and Safety Matters
General
We are subject to extensive federal, state, local and foreign laws, regulations, rules and ordinances relating to pollution, protection of the environment, and the generation, storage, handling, transportation, treatment, disposal, and remediation of hazardous substances and waste materials. In the ordinary course of business, we are subject to frequent environmental inspections and monitoring and occasional investigations by governmental enforcement authorities. In addition, our production facilities require operating permits that are subject to renewal, modification and, in certain circumstances, revocation. Actual or alleged violations of environmental laws or permit requirements could result in restrictions or prohibitions on plant operations, substantial civil or criminal sanctions, as well as, under some environmental laws, the assessment of strict liability and/or joint and several liability. Moreover, changes in environmental regulations could inhibit or interrupt our operations, or require us to modify our facilities or operations. Accordingly, environmental or regulatory matters may cause us to incur significant unanticipated losses, costs or liabilities.
Environmental, Health and Safety Systems
We are committed to achieving and maintaining compliance with all applicable environmental, health, and safety ("EHS") legal requirements, and we have developed policies and management systems that are intended to identify the multitude of EHS legal requirements applicable to our operations, enhance compliance with applicable legal requirements, ensure the safety of our employees, contractors, community neighbors, and customers and minimize the production and emission of wastes and other pollutants. Although EHS legal requirements are constantly changing and are frequently difficult to comply with, these EHS management systems are designed to assist us in our compliance goals while also fostering efficiency and improvement and minimizing overall risk to us.
EHS Capital Expenditures
We may incur future costs for capital improvements and general compliance under EHS laws, including costs to acquire, maintain and repair pollution control equipment. For the six months ended June 30, 2005 and 2004, our capital expenditures for EHS matters totaled $8.8 million and $9.8 million, respectively. Since capital expenditures for these matters are subject to evolving regulatory requirements and depend, in part, on the timing, promulgation and enforcement of specific requirements, we cannot provide assurance that our recent expenditures will be indicative of future amounts required under EHS laws.
22
Governmental Enforcement Proceedings
On occasion, we receive notices of violation, enforcement and other complaints from regulatory agencies alleging non-compliance with applicable EHS law. By way of example, we are aware of the individual matters set out below, which we believe to be the most significant presently pending matters and unasserted claims. Although we may incur costs or penalties in connection with the governmental proceedings discussed below, based on currently available information and our past experience, we believe that the ultimate resolution of these matters will not have a material impact on our results of operations, financial position, or liquidity.
In the third quarter of 2004, our Jefferson County, Texas facilities received notification from the Texas Commission on Environmental Quality ("TCEQ") of potential air emission violations relating to the operation of cooling towers at three of our plants and alleged upset air emissions. TCEQ proposed penalties of $0.2 million for the alleged upset violations and $0.1 million for the alleged cooling tower violations. Negotiations are anticipated between us and TCEQ with respect to the resolution of these alleged violations. We do not believe that the resolution of these matters will have a material adverse impact on our results of operations, financial position or liquidity.
Remediation Liabilities
We have incurred, and we may in the future incur, liability to investigate and clean up waste or contamination at our current or former facilities, or facilities operated by third parties at which we may have disposed of waste or other materials. Similarly, we may incur costs for the cleanup of wastes that were disposed of prior to the purchase of our businesses. Under some circumstances, the scope of our liability may extend to damages to natural resources. Specifically, under the U.S. Comprehensive Environmental Response, Compensation and Liability Act of 1980, as amended ("CERCLA"), and similar state laws, a current or former owner or operator of real property may be liable for remediation costs regardless of whether the release or disposal of hazardous substances was in compliance with law at the time it occurred, and a current owner or operator may be liable regardless of whether it owned or operated the facility at the time of the release. In addition, under the U.S. Resource Conservation and Recovery Act of 1976, as amended ("RCRA"), and similar state laws, we may be required to remediate contamination originating from our properties as a condition to our hazardous waste permit. In many cases, our potential liability arising from historical contamination is based on operations and other events occurring prior to our ownership of the relevant facility. In these situations, we frequently obtained an indemnity agreement from the prior owner addressing remediation liabilities arising from pre-closing conditions. We have successfully exercised our rights under these contractual covenants for a number of sites, and where applicable, mitigated our ultimate remediation liability. We cannot assure you, however, that all of such matters will be subject to indemnity or that our existing indemnities will be sufficient to cover our liabilities for such matters.
Environmental Reserves
We have established financial reserves relating to anticipated environmental cleanup obligations, site reclamation and closure costs and known penalties. Liabilities are recorded when potential liabilities are either known or considered probable and can be reasonably estimated. Our liability estimates are based upon available facts, existing technology, and past experience. On a consolidated basis, we have accrued approximately $18.6 million and $21.2 million for environmental liabilities as of June 30, 2005 and December 31, 2004, respectively. Of these amounts, approximately $6.6 million and $5.7 million are classified as accrued liabilities on our condensed consolidated balance sheets as of June 30, 2005 and December 31, 2004, respectively, and approximately $12.0 million and $15.5 million are classified as other noncurrent liabilities on our condensed consolidated balance sheets as of June 30, 2005 and December 31, 2004, respectively. In certain cases, our remediation liabilities are
23
payable over periods of up to 30 years. We may incur losses for environmental remediation in excess of the amounts accrued; however, we are not able to estimate the maximum amount of such losses.
Regulatory Developments
Under the European Union ("EU") Integrated Pollution Prevention and Control Directive ("IPPC"), EU member governments are to adopt rules and implement a cross-media (air, water and waste) environmental permitting program for individual facilities. While the EU countries are at varying stages in their respective implementation of the IPPC permit program, we have submitted all necessary IPPC permit applications required to date, and in some cases received completed permits from the applicable government agency. We expect to submit all other IPPC applications and related documents on a timely basis as the various countries implement the IPPC permit program. Although we do not know with certainty what each IPPC permit will require, we believe, based upon our experience with the permits received to date, that the costs of compliance with the IPPC permit program will not be material to our results of operations, financial position or liquidity.
In October 2003, the European Commission adopted a proposal for a new EU regulatory framework for chemicals. Under this proposed new system called "REACH" (Registration, Evaluation and Authorization of Chemicals), companies that manufacture or import more than one ton of a chemical substance per year would be required to register such manufacture or import in a central database. The REACH initiative, as proposed, would require risk assessment of chemicals, preparations (e.g., soaps and paints) and articles (e.g., consumer products) before those materials could be manufactured or imported into EU countries. Where warranted by a risk assessment, hazardous substances would require authorizations for their use. This regulation could impose risk control strategies that would require capital expenditures by us. As proposed, REACH would take effect in three primary stages over the eleven years following the final effective date (assuming final approval). The impacts of REACH on the chemical industry and on us are unclear at this time because the parameters of the program are still being actively debated.
MTBE Developments
We currently market approximately 95% of our MTBE to customers located in the U.S. for use as a gasoline additive. The presence of MTBE in some groundwater supplies in California and other U.S. states (primarily due to gasoline leaking from underground storage tanks) and in surface water (primarily from recreational watercraft) has led to public concern about MTBE's potential to contaminate drinking water supplies. Heightened public awareness regarding this issue has resulted in state, federal and foreign initiatives to rescind the federal oxygenate requirements for reformulated gasoline or restrict or prohibit the use of MTBE in particular. For example, California, New York and Connecticut have adopted rules that prohibit the use of MTBE in gasoline sold in those states. Overall, states that have taken some action to prohibit or restrict the use of MTBE in gasoline account for a substantial portion of the "pre-ban" U.S. MTBE market. Thus far, attempts by others to challenge these state bans in federal court under the reformulated gasoline provisions of the federal Clean Air Act have been unsuccessful.
In August 2005, the Energy Policy Act of 2005 was signed into law. The new law will likely have an adverse impact on our MTBE business in the U.S., although a full evaluation of the law's provisions is underway and the extent of potential impacts, if any, is unclear. The new legislation mandates increased use of renewable fuels and eliminates the oxygenate requirement for reformulated gasoline established by the 1990 Clean Air Act Amendments, and the combination of these two provisions could substantially reduce the market for MTBE in the U.S. However, unlike previously proposed federal legislation, the new law does not purport to ban the use of MTBE as a motor vehicle fuel additive. Thus, we do not believe it will prevent us from either manufacturing MTBE in our plants or offering MTBE for sale in the U.S. A significant reduction in demand for our MTBE could result in a material
24
loss in revenues or material costs or expenditures. As an alternative to selling our MTBE in the U.S., we believe we will be able to export MTBE to Europe, Asia or Latin America, although this may produce a lower level of cash flow than the sale of MTBE in the U.S. We may also elect to use all or a portion of our precursor TBA to produce saleable products other than MTBE. If we opt to produce products other than MTBE, necessary modifications to our facilities may require significant capital expenditures and the sale of the other products may produce a materially lower level of cash flow than the sale of MTBE.
In September 2002, the EU issued a final risk assessment report on MTBE. No ban of MTBE was recommended for Europe, although several risk reduction measures relating to storage and handling of MTBE-containing fuel were recommended.
A number of lawsuits have been filed, primarily against gasoline manufacturers, marketers and distributors, by persons seeking to recover damages allegedly arising from the presence of MTBE in groundwater. We have not been named as a defendant in any litigation concerning the environmental effects of MTBE. However, we cannot provide assurances that we will not be involved in any such litigation or that such litigation will not have a material adverse effect on our results of operations, financial position or liquidity.
18. Other Operating (Income) Expense
Other operating (income) expense consisted of the following (dollars in millions):
| |
Three Months Ended June 30, |
Six Months Ended June 30, |
|||||||||||
|---|---|---|---|---|---|---|---|---|---|---|---|---|---|
| |
2005 |
2004 |
2005 |
2004 |
|||||||||
| Foreign exchange (gains) losses, net | $ | (9.5 | ) | $ | (3.2 | ) | $ | 14.4 | $ | (9.3 | ) | ||
| Legal settlements, net of recoveries | — | 14.9 | — | 14.9 | |||||||||
| Information systems implementation costs | — | 5.4 | — | 5.4 | |||||||||
| Other | 6.1 | 7.7 | 15.8 | 8.6 | |||||||||
| Total other operating (income) expense | $ | (3.4 | ) | $ | 24.8 | $ | 30.2 | $ | 19.6 | ||||
19. Income Taxes
Income tax expense was $33.2 million and $56.7 million for the three and six months ended June 30, 2005, respectively, and $4.7 million and $8.3 million for the three and six months ended June 30, 2004, respectively. Our company and its U.S. subsidiaries are organized as limited liability companies. These entities are treated as a partnership for U.S. income tax purposes, and therefore are not subject to U.S. federal tax on their income. Subsidiaries outside the U.S. are generally taxed on the income generated in the local country. In addition, our tax obligations are affected by the mix of income and losses in the tax jurisdictions in which we operate.
We use the asset and liability method of accounting for income taxes. Deferred income taxes reflect the net tax effects of temporary differences between the carrying amounts of assets and liabilities for financial and tax reporting purposes. We evaluate the resulting deferred tax assets to determine whether it is more likely than not that they will be realized. Valuation allowances have been established against certain of the non-U.S. net deferred tax assets due to the uncertainty of realization. Valuation allowances are reviewed each period on a tax jurisdiction by jurisdiction basis to analyze whether there is sufficient positive or negative evidence to support a change in judgment about the realizability of the related deferred tax asset in future years.
25
During the second quarter of 2005, we concluded negotiations to sell our toluene di-isocyanate ("TDI") business to BASF, effective July 6, 2005. The sale involves the transfer of our TDI customer list and sales contracts. We further agreed to discontinue the use of our remaining TDI assets, including our Geismar, Louisiana TDI manufacturing equipment. TDI has been accounted for as a discontinued operation under SFAS No. 144, "Accounting for the Impairment or Disposal of Long-Lived Assets." Accordingly, the following results of TDI have been presented as discontinued operations in the accompanying condensed consolidated statement of operations (dollars in millions):
| |
Three Months Ended June 30, 2005 |
Three Months Ended June 30, 2004 |
Six Months Ended June 30, 2005 |
Six Months Ended June 30, 2004 |
|||||||||
|---|---|---|---|---|---|---|---|---|---|---|---|---|---|
| Revenues | $ | 9.8 | $ | 18.2 | $ | 23.4 | $ | 36.2 | |||||
| Costs and expenses | (13.8 | ) | (19.1 | ) | (30.0 | ) | (37.9 | ) | |||||
| Loss on pending disposal | (36.4 | ) | — | (36.4 | ) | — | |||||||
| Operating loss | (40.4 | ) | (0.9 | ) | (43.0 | ) | (1.7 | ) | |||||
| Income tax expense | — | — | — | — | |||||||||
| Loss from discontinued operations, net of tax | $ | (40.4 | ) | $ | (0.9 | ) | $ | (43.0 | ) | $ | (1.7 | ) | |
The loss on pending disposal of $36.4 million includes an impairment of long-lived assets. The remaining net book value of the TDI assets is not significant. We expect to incur approximately $2 million of additional costs related to the TDI transaction by the end of the second quarter of 2006. The TDI business is reported in our Polyurethanes operating segment in the accompanying condensed consolidated financial statements.
21. Operating Segment Information
We derive our revenues, earnings and cash flows from the manufacture and sale of a wide variety of differentiated and commodity chemical products. We have four reportable operating segments: Polyurethanes, Performance Products, Pigments and Base Chemicals. Sales between segments are generally recognized at external market prices and are eliminated in consolidation.
The major products of each reportable operating segment are as follows:
| Segment |
Products |
|
|---|---|---|
| Polyurethanes | MDI, TPU, polyols, aniline, PO and MTBE | |
| Performance Products | Surfactants, ethyleneamines and other performance chemicals | |
| Pigments | Titanium dioxide | |
| Base Chemicals | Ethylene, propylene, benzene, cyclohexane and paraxylene |
We use EBITDA to measure the financial performance of our global business units and for reporting the results of our operating segments. This measure includes all operating items relating to the businesses. The EBITDA of operating segments excludes items that principally apply to our company as a whole. We believe that EBITDA is useful in helping investors assess the results of our
26
business operations. The revenues and EBITDA for each of our reportable operating segments are as follows (dollars in millions):
| |
Three Months Ended June 30, 2005 |
Three Months Ended June 30, 2004 |
Six Months Ended June 30, 2005 |
Six Months Ended June 30, 2004 |
|||||||||||
|---|---|---|---|---|---|---|---|---|---|---|---|---|---|---|---|
| Revenues | |||||||||||||||
| Polyurethanes | $ | 908.7 | $ | 715.7 | $ | 1,802.0 | $ | 1,337.2 | |||||||
| Performance Products | 218.9 | 190.9 | 429.4 | 375.0 | |||||||||||
| Pigments | 267.7 | 278.1 | 530.9 | 533.1 | |||||||||||
| Base Chemicals | 599.2 | 481.0 | 1,277.8 | 954.9 | |||||||||||
| Eliminations | (64.3 | ) | (60.2 | ) | (161.6 | ) | (114.6 | ) | |||||||
| Total | $ | 1,930.2 | $ | 1,605.5 | $ | 3,878.5 | $ | 3,085.6 | |||||||
| Segment EBITDA(1) | |||||||||||||||
| Polyurethanes | $ | 155.6 | $ | 100.0 | $ | 341.3 | $ | 172.8 | |||||||
| Performance Products | 5.3 | 2.5 | 5.5 | 4.3 | |||||||||||
| Pigments | 24.6 | (83.5 | ) | 63.9 | (75.8 | ) | |||||||||
| Base Chemicals | 60.6 | 57.8 | 162.8 | 89.2 | |||||||||||
| Corporate and other(2) | (9.4 | ) | (19.9 | ) | (46.9 | ) | (20.9 | ) | |||||||
| Total EBITDA | $ | 236.7 | $ | 56.9 | $ | 526.6 | $ | 169.6 | |||||||
| Interest expense, net | (53.3 | ) | (62.9 | ) | (117.1 | ) | (131.9 | ) | |||||||
| Income tax expense | (33.2 | ) | (4.7 | ) | (56.7 | ) | (8.3 | ) | |||||||
| Depreciation and amortization | (73.4 | ) | (79.8 | ) | (149.2 | ) | (156.8 | ) | |||||||
| Net income (loss) | $ | 76.8 | $ | (90.5 | ) | $ | 203.6 | $ | (127.4 | ) | |||||
22. Condensed Consolidating Financial Statements
The following condensed consolidating financial statements present, in separate columns, financial information for the following: Huntsman International LLC (on a parent only basis), with our investment in subsidiaries recorded under the equity method; the HI Guarantors on a combined, and where appropriate, consolidated basis; and the non-guarantors on a combined, and where appropriate, consolidated basis. Additional columns present eliminating adjustments and consolidated totals as of June 30, 2005 and December 31, 2004 and for the three and six months ended June 30, 2005 and 2004. There are no contractual restrictions limiting transfers of cash from guarantor subsidiaries to us. Each of the HI Guarantors is 100% owned by us and has fully and unconditionally guaranteed the HI Senior Notes and the HI Subordinated Notes on a joint and several basis. We have not presented separate financial statements and other disclosures for each of the HI Guarantors because management believes that such information is not material to investors.
27
HUNTSMAN INTERNATIONAL LLC AND SUBSIDIARIES
CONDENSED CONSOLIDATING BALANCE SHEETS (UNAUDITED)
AS OF JUNE 30, 2005
(Dollars in Millions)
| |
Parent Only Huntsman International |
Guarantors |
Non- Guarantors |
Eliminations |
Consolidated Huntsman International |
||||||||||||
|---|---|---|---|---|---|---|---|---|---|---|---|---|---|---|---|---|---|
| ASSETS | |||||||||||||||||
| Current Assets: | |||||||||||||||||
| Cash and cash equivalents | $ | 6.7 | $ | (0.4 | ) | $ | 105.9 | $ | — | $ | 112.2 | ||||||
| Accounts and notes receivables, net | 57.8 | 99.2 | 811.6 | (158.4 | ) | 810.2 | |||||||||||
| Inventories | 90.5 | 93.0 | 575.6 | — | 759.1 | ||||||||||||
| Prepaid expenses | 0.5 | 0.2 | 15.3 | — | 16.0 | ||||||||||||
| Deferred tax asset | — | — | 10.2 | — | 10.2 | ||||||||||||
| Other current assets | 124.0 | 518.4 | 268.6 | (855.2 | ) | 55.8 | |||||||||||
| Total current assets | 279.5 | 710.4 | 1,787.2 | (1,013.6 | ) | 1,763.5 | |||||||||||
| Property, plant and equipment, net | 461.7 | 304.8 | 2,154.9 | — | 2,921.4 | ||||||||||||
| Investment in unconsolidated affiliates | 3,838.4 | 902.0 | 30.6 | (4,619.5 | ) | 151.5 | |||||||||||
| Intangible assets, net | 218.4 | 2.0 | 15.7 | — | 236.1 | ||||||||||||
| Other noncurrent assets | 64.2 | 1,709.7 | 387.2 | (1,684.1 | ) | 477.0 | |||||||||||
| Total assets | $ | 4,862.2 | $ | 3,628.9 | $ | 4,375.6 | $ | (7,317.2 | ) | $ | 5,549.5 | ||||||
| LIABILITIES AND EQUITY | |||||||||||||||||
| Current liabilities: | |||||||||||||||||
| Accounts payable | $ | 99.2 | $ | 85.2 | $ | 637.0 | $ | (158.2 | ) | $ | 663.2 | ||||||
| Accrued liabilities | 724.2 | 23.3 | 432.8 | (855.4 | ) | 324.9 | |||||||||||
| Current portion of long-term debt | 0.3 | — | 20.4 | — | 20.7 | ||||||||||||
| Total current liabilities | 823.7 | 108.5 | 1,090.2 | (1,013.6 | ) | 1,008.8 | |||||||||||
| Long-term debt | 2,772.3 | — | 1,686.9 | (1,684.1 | ) | 2,775.1 | |||||||||||
| Deferred income taxes | — | — | 164.5 | — | 164.5 | ||||||||||||
| Other noncurrent liabilities | 38.7 | 6.9 | 309.8 | — | 355.4 | ||||||||||||
| Total liabilities | 3,634.7 | 115.4 | 3,251.4 | (2,697.7 | ) | 4,303.8 | |||||||||||
| Minority interests | — | — | 18.2 | — | 18.2 | ||||||||||||
| Equity: | |||||||||||||||||
| Member's equity | 1,026.1 | — | — | — | 1,026.1 | ||||||||||||
| Subsidiary equity | — | 2,145.7 | 1,131.1 | (3,276.8 | ) | — | |||||||||||
| Retained earnings | 174.7 | 1,022.5 | 14.2 | (1,036.7 | ) | 174.7 | |||||||||||
| Accumulated other comprehensive income | 26.7 | 345.3 | (39.3 | ) | (306.0 | ) | 26.7 | ||||||||||
| Total equity | 1,227.5 | 3,513.5 | 1,106.0 | (4,619.5 | ) | 1,227.5 | |||||||||||
| Total liabilities and equity | $ | 4,862.2 | $ | 3,628.9 | $ | 4,375.6 | $ | (7,317.2 | ) | $ | 5,549.5 | ||||||
28
HUNTSMAN INTERNATIONAL LLC AND SUBSIDIARIES
CONDENSED CONSOLIDATING BALANCE SHEETS (UNAUDITED)
AS OF DECEMBER 31, 2004
(Dollars in Millions)
| |
Parent Only Huntsman International |
Guarantors |
Non- Guarantors |
Eliminations |
Consolidated Huntsman International |
||||||||||||
|---|---|---|---|---|---|---|---|---|---|---|---|---|---|---|---|---|---|
| ASSETS | |||||||||||||||||
| Current Assets: | |||||||||||||||||
| Cash and cash equivalents | $ | 7.4 | $ | (0.4 | ) | $ | 131.0 | $ | — | $ | 138.0 | ||||||
| Accounts and notes receivables, net | 72.2 | 102.8 | 731.2 | (100.2 | ) | 806.0 | |||||||||||
| Inventories | 81.3 | 85.0 | 569.3 | — | 735.6 | ||||||||||||
| Prepaid expenses | 2.4 | 1.8 | 26.6 | — | 30.8 | ||||||||||||
| Deferred tax asset | — | — | 10.2 | — | 10.2 | ||||||||||||
| Other current assets | 59.5 | 401.6 | 71.5 | (482.1 | ) | 50.5 | |||||||||||
| Total current assets | 222.8 | 590.8 | 1,539.8 | (582.3 | ) | 1,771.1 | |||||||||||
| Property, plant and equipment, net | 494.0 | 313.9 | 2,375.8 | — | 3,183.7 | ||||||||||||
| Investment in unconsolidated affiliates | 3,814.7 | 788.2 | 18.9 | (4,475.6 | ) | 146.2 | |||||||||||
| Intangible assets, net | 230.6 | 2.9 | 20.5 | — | 254.0 | ||||||||||||
| Notes receivable from affiliates | 10.8 | 1,889.9 | — | (1,889.9 | ) | 10.8 | |||||||||||
| Other noncurrent assets | 65.2 | 28.0 | 389.9 | — | 483.1 | ||||||||||||
| Total assets | $ | 4,838.1 | $ | 3,613.7 | $ | 4,344.9 | $ | (6,947.8 | ) | $ | 5,848.9 | ||||||
| LIABILITIES AND EQUITY | |||||||||||||||||
| Current liabilities: | |||||||||||||||||
| Accounts payable | $ | 70.2 | $ | 105.4 | $ | 612.9 | $ | (100.2 | ) | $ | 688.3 | ||||||
| Accrued liabilities | 456.4 | 32.9 | 412.5 | (482.1 | ) | 419.7 | |||||||||||
| Current portion of long-term debt | 1.6 | — | 8.9 | — | 10.5 | ||||||||||||
| Total current liabilities | 528.2 | 138.3 | 1,034.3 | (582.3 | ) | 1,118.5 | |||||||||||
| Long-term debt | 3,046.5 | — | 1,887.7 | (1,889.9 | ) | 3,044.3 | |||||||||||
| Deferred income taxes | — | — | 179.2 | — | 179.2 | ||||||||||||
| Notes payable to affiliates | 29.9 | — | — | — | 29.9 | ||||||||||||
| Other noncurrent liabilities | 34.8 | 0.2 | 234.5 | — | 269.5 | ||||||||||||
| Total liabilities | 3,639.4 | 138.5 | 3,335.7 | (2,472.2 | ) | 4,641.4 | |||||||||||
| Minority interests | — | — | 8.8 | — | 8.8 | ||||||||||||
| Equity: | |||||||||||||||||
| Member's equity | 1,026.1 | — | — | — | 1,026.1 | ||||||||||||
| Subsidiary equity | — | 2,198.3 | 1,128.0 | (3,326.3 | ) | — | |||||||||||
| Retained earnings | 6.1 | 736.0 | (146.6 | ) | (589.4 | ) | 6.1 | ||||||||||
| Accumulated other comprehensive income | 166.5 | 540.9 | 19.0 | (559.9 | ) | 166.5 | |||||||||||
| Total equity | 1,198.7 | 3,475.2 | 1,000.4 | (4,475.6 | ) | 1,198.7 | |||||||||||
| Total liabilities and equity | $ | 4,838.1 | $ | 3,613.7 | $ | 4,344.9 | $ | (6,947.8 | ) | $ | 5,848.9 | ||||||
29
HUNTSMAN INTERNATIONAL LLC AND SUBSIDIARIES
CONDENSED CONSOLIDATING STATEMENTS OF OPERATIONS AND COMPREHENSIVE INCOME (LOSS) (UNAUDITED)
THREE MONTHS ENDED JUNE 30, 2005
(Dollars in Millions)
| |
Parent Only Huntsman International |
Guarantors |
Non- Guarantors |
Eliminations |
Consolidated Huntsman International |
|||||||||||||
|---|---|---|---|---|---|---|---|---|---|---|---|---|---|---|---|---|---|---|
| Revenues: | ||||||||||||||||||
| Trade sales, services, and fees | $ | 236.6 | $ | 251.4 | $ | 1,380.4 | $ | — | $ | 1,868.4 | ||||||||
| Related party sales | 74.7 | 46.8 | 257.2 | (316.9 | ) | 61.8 | ||||||||||||
| Total revenues | 311.3 | 298.2 | 1,637.6 | (316.9 | ) | 1,930.2 | ||||||||||||
| Cost of goods sold | 244.6 | 240.2 | 1,431.9 | (316.9 | ) | 1,599.8 | ||||||||||||
| Gross profit | 66.7 | 58.0 | 205.7 | — | 330.4 | |||||||||||||
| Expenses: | ||||||||||||||||||
| Selling, general and administrative | 35.9 | 3.7 | 55.9 | — | 95.5 | |||||||||||||
| Research and development | 9.5 | 0.3 | 2.1 | — | 11.9 | |||||||||||||
| Other operating expense (income) | 14.6 | 21.2 | (39.2 | ) | — | (3.4 | ) | |||||||||||
| Restructuring and plant closing costs | — | — | 18.5 | — | 18.5 | |||||||||||||
| Total expenses | 60.0 | 25.2 | 37.3 | — | 122.5 | |||||||||||||
| Operating income | 6.7 | 32.8 | 168.4 | — | 207.9 | |||||||||||||
| Interest (expense) income, net | (57.9 | ) | 36.0 | (31.4 | ) | — | (53.3 | ) | ||||||||||
| Gain (loss) on accounts receivable securitization program | 6.4 | (0.9 | ) | (7.9 | ) | — | (2.4 | ) | ||||||||||
| Equity in income of unconsolidated affiliates | 123.4 | 57.6 | — | (181.0 | ) | — | ||||||||||||
| Other expense | (1.8 | ) | — | — | — | (1.8 | ) | |||||||||||
| Income from continuing operations before income taxes | 76.8 | 125.5 | 129.1 | (181.0 | ) | 150.4 | ||||||||||||
| Income tax expense | — | — | (33.2 | ) | — | (33.2 | ) | |||||||||||
| Income from continuing operations | 76.8 | 125.5 | 95.9 | (181.0 | ) | 117.2 | ||||||||||||
| Loss from discontinued operations, net of tax | — | — | (40.4 | ) | — | (40.4 | ) | |||||||||||
| Net income | 76.8 | 125.5 | 55.5 | (181.0 | ) | 76.8 | ||||||||||||
| Other comprehensive loss | (94.6 | ) | (122.7 | ) | (34.3 | ) | 157.0 | (94.6 | ) | |||||||||
| Comprehensive (loss) income | $ | (17.8 | ) | $ | 2.8 | $ | 21.2 | $ | (24.0 | ) | $ | (17.8 | ) | |||||
30
HUNTSMAN INTERNATIONAL LLC AND SUBSIDIARIES
CONDENSED CONSOLIDATING STATEMENTS OF OPERATIONS AND COMPREHENSIVE INCOME (LOSS) (UNAUDITED)
THREE MONTHS ENDED JUNE 30, 2004
(Dollars in Millions)
| |
Parent Only Huntsman International |
Guarantors |
Non- Guarantors |
Eliminations |
Consolidated Huntsman International |
|||||||||||||
|---|---|---|---|---|---|---|---|---|---|---|---|---|---|---|---|---|---|---|
| Revenues: | ||||||||||||||||||
| Trade sales, services, and fees | $ | 200.8 | $ | 205.1 | $ | 1,132.2 | $ | — | $ | 1,538.1 | ||||||||
| Related party sales | 50.1 | 75.0 | 18.9 | (76.6 | ) | 67.4 | ||||||||||||
| Total revenues | 250.9 | 280.1 | 1,151.1 | (76.6 | ) | 1,605.5 | ||||||||||||
| Cost of goods sold | 200.1 | 245.5 | 1,004.2 | (76.6 | ) | 1,373.2 | ||||||||||||
| Gross profit | 50.8 | 34.6 | 146.9 | — | 232.3 | |||||||||||||
| Expenses: | ||||||||||||||||||
| Selling, general and administrative | 34.4 | 3.5 | 54.9 | — | 92.8 | |||||||||||||
| Research and development | 8.4 | 0.3 | 0.1 | — | 8.8 | |||||||||||||
| Other operating expense | 8.4 | 1.9 | 14.5 | — | 24.8 | |||||||||||||
| Restructuring and plant closing costs | — | — | 124.9 | — | 124.9 | |||||||||||||
| Total expenses | 51.2 | 5.7 | 194.4 | — | 251.3 | |||||||||||||
| Operating (loss) income | (0.4 | ) | 28.9 | (47.5 | ) | — | (19.0 | ) | ||||||||||
| Interest (expense) income, net | (64.2 | ) | 37.8 | (36.5 | ) | — | (62.9 | ) | ||||||||||
| Gain (loss) on accounts receivable securitization program | 2.2 | (0.7 | ) | (4.5 | ) | — | (3.0 | ) | ||||||||||
| Equity in losses of unconsolidated affiliates | (28.1 | ) | (94.0 | ) | — | 122.1 | — | |||||||||||
| Loss from continuing operations before income taxes | (90.5 | ) | (28.0 | ) | (88.5 | ) | 122.1 | (84.9 | ) | |||||||||
| Income tax expense | — | — | (4.7 | ) | — | (4.7 | ) | |||||||||||
| Loss from continuing operations | (90.5 | ) | (28.0 | ) | (93.2 | ) | 122.1 | (89.6 | ) | |||||||||
| Loss from discontinued operations, net of tax | — | — | (0.9 | ) | — | (0.9 | ) | |||||||||||
| Net loss | (90.5 | ) | (28.0 | ) | (94.1 | ) | 122.1 | (90.5 | ) | |||||||||
| Other comprehensive loss | (15.5 | ) | (33.6 | ) | (18.8 | ) | 52.4 | (15.5 | ) | |||||||||
| Comprehensive loss | $ | (106.0 | ) | $ | (61.6 | ) | $ | (112.9 | ) | $ | 174.5 | $ | (106.0 | ) | ||||
31
HUNTSMAN INTERNATIONAL LLC AND SUBSIDIARIES
CONDENSED CONSOLIDATING STATEMENTS OF OPERATIONS AND COMPREHENSIVE INCOME (LOSS) (UNAUDITED)
SIX MONTHS ENDED JUNE 30, 2005
(Dollars in Millions)
| |
Parent Only Huntsman International |
Guarantors |
Non- Guarantors |
Eliminations |
Consolidated Huntsman International |
|||||||||||||
|---|---|---|---|---|---|---|---|---|---|---|---|---|---|---|---|---|---|---|
| Revenues: | ||||||||||||||||||
| Trade sales, services and fees | $ | 465.5 | $ | 472.0 | $ | 2,813.0 | $ | — | $ | 3,750.5 | ||||||||
| Related party sales | 159.9 | 107.4 | 507.0 | (646.3 | ) | 128.0 | ||||||||||||
| Total revenues | 625.4 | 579.4 | 3,320.0 | (646.3 | ) | 3,878.5 | ||||||||||||
| Cost of goods sold | 482.7 | 489.2 | 2,863.5 | (646.3 | ) | 3,189.1 | ||||||||||||
| Gross profit | 142.7 | 90.2 | 456.5 | — | 689.4 | |||||||||||||
| Expenses: | ||||||||||||||||||
| Selling, general and administrative | 65.2 | 8.0 | 108.9 | — | 182.1 | |||||||||||||
| Research and development | 18.4 | 0.7 | 3.3 | — | 22.4 | |||||||||||||
| Other operating expense (income) | 24.3 | 28.7 | (22.8 | ) | — | 30.2 | ||||||||||||
| Restructuring and plant closing costs | — | — | 25.5 | — | 25.5 | |||||||||||||
| Total expenses | 107.9 | 37.4 | 114.9 | — | 260.2 | |||||||||||||
| Operating income | 34.8 | 52.8 | 341.6 | — | 429.2 | |||||||||||||
| Interest (expense) income, net | (122.4 | ) | 72.7 | (67.4 | ) | — | (117.1 | ) | ||||||||||
| Gain (loss) on accounts receivable securitization program | 9.7 | (1.6 | ) | (13.7 | ) | — | (5.6 | ) | ||||||||||
| Equity in income of unconsolidated affiliates | 284.7 | 162.6 | — | (447.3 | ) | — | ||||||||||||
| Other expense | (3.1 | ) | — | — | — | (3.1 | ) | |||||||||||
| Income from continuing operations before income taxes and minority interest | 203.7 | 286.5 | 260.5 | (447.3 | ) | 303.4 | ||||||||||||
| Income tax expense | — | — | (56.7 | ) | — | (56.7 | ) | |||||||||||
| Minority interest | (0.1 | ) | — | — | — | (0.1 | ) | |||||||||||
| Income from continuing operations | 203.6 | 286.5 | 203.8 | (447.3 | ) | 246.6 | ||||||||||||
| Loss from discontinued operations, net of tax | — | — | (43.0 | ) | — | (43.0 | ) | |||||||||||
| Net income | 203.6 | 286.5 | 160.8 | (447.3 | ) | 203.6 | ||||||||||||
| Other comprehensive loss | (139.8 | ) | (195.6 | ) | (58.3 | ) | 253.9 | (139.8 | ) | |||||||||
| Comprehensive income | $ | 63.8 | $ | 90.9 | $ | 102.5 | $ | (193.4 | ) | $ | 63.8 | |||||||
32
HUNTSMAN INTERNATIONAL LLC AND SUBSIDIARIES
CONDENSED CONSOLIDATING STATEMENTS OF OPERATIONS AND COMPREHENSIVE INCOME (LOSS) (UNAUDITED)
SIX MONTHS ENDED JUNE 30, 2004
(Dollars in Millions)
| |
Parent Only Huntsman International |
Guarantors |
Non- Guarantors |
Eliminations |
Consolidated Huntsman International |
|||||||||||||
|---|---|---|---|---|---|---|---|---|---|---|---|---|---|---|---|---|---|---|
| Revenues: | ||||||||||||||||||
| Trade sales, services and fees | $ | 386.8 | $ | 346.5 | $ | 2,248.4 | $ | — | $ | 2,981.7 | ||||||||
| Related party sales | 96.6 | 124.3 | 44.6 | (161.6 | ) | 103.9 | ||||||||||||
| Total revenues | 483.4 | 470.8 | 2,293.0 | (161.6 | ) | 3,085.6 | ||||||||||||
| Cost of goods sold | 384.9 | 435.8 | 2,045.3 | (161.6 | ) | 2,704.4 | ||||||||||||
| Gross profit | 98.5 | 35.0 | 247.7 | — | 381.2 | |||||||||||||
| Expenses: | ||||||||||||||||||
| Selling, general and administrative | 66.3 | 7.1 | 112.4 | — | 185.8 | |||||||||||||
| Research and development | 15.4 | 0.8 | 4.8 | — | 21.0 | |||||||||||||
| Other operating expense | 8.3 | 2.8 | 8.5 | — | 19.6 | |||||||||||||
| Restructuring and plant closing costs | — | — | 133.6 | — | 133.6 | |||||||||||||
| Total expenses | 90.0 | 10.7 | 259.3 | — | 360.0 | |||||||||||||
| Operating income (loss) | 8.5 | 24.3 | (11.6 | ) | — | 21.2 | ||||||||||||
| Interest (expense) income, net | (133.2 | ) | 76.1 | (74.8 | ) | — | (131.9 | ) | ||||||||||
| Gain (loss) on accounts receivable securitization program | 2.0 | (1.0 | ) | (7.5 | ) | — | (6.5 | ) | ||||||||||
| Equity in losses of unconsolidated affiliates | (4.5 | ) | (104.1 | ) | — | 108.6 | — | |||||||||||
| Other expense | (0.2 | ) | — | — | — | (0.2 | ) | |||||||||||
| Loss from continuing operations before income taxes | (127.4 | ) | (4.7 | ) | (93.9 | ) | 108.6 | (117.4 | ) | |||||||||
| Income tax expense | — | — | (8.3 | ) | — | (8.3 | ) | |||||||||||
| Loss from continuing operations | (127.4 | ) | (4.7 | ) | (102.2 | ) | 108.6 | (125.7 | ) | |||||||||
| Loss from discontinued operations, net of tax | — | — | (1.7 | ) | — | (1.7 | ) | |||||||||||
| Net loss | (127.4 | ) | (4.7 | ) | (103.9 | ) | 108.6 | (127.4 | ) | |||||||||
| Other comprehensive loss | (13.7 | ) | (39.2 | ) | (50.5 | ) | 89.7 | (13.7 | ) | |||||||||
| Comprehensive loss | $ | (141.1 | ) | $ | (43.9 | ) | $ | (154.4 | ) | $ | 198.3 | $ | (141.1 | ) | ||||
33
HUNTSMAN INTERNATIONAL LLC AND SUBSIDIARIES
CONDENSED CONSOLIDATING STATEMENTS OF CASH FLOWS (UNAUDITED)
SIX MONTHS ENDED JUNE 30, 2005
(Dollars in Millions)
| |
Parent Only Huntsman International |
Guarantors |
Non- Guarantors |
Eliminations |
Consolidated Huntsman International |
|||||||||||
|---|---|---|---|---|---|---|---|---|---|---|---|---|---|---|---|---|
| Net cash (used in) provided by operating activities | $ | (35.5 | ) | $ | 56.6 | $ | 251.1 | $ | — | $ | 272.2 | |||||
| Investing activities: | ||||||||||||||||
| Capital expenditures | (6.6 | ) | (1.2 | ) | (75.3 | ) | — | (83.1 | ) | |||||||
| Investments in unconsolidated affiliate | — | — | (11.2 | ) | — | (11.2 | ) | |||||||||
| Net cash received from unconsolidated affiliate | — | 0.7 | — | — | 0.7 | |||||||||||
| Proceeds from sale of assets | 4.6 | — | — | — | 4.6 | |||||||||||
| Net cash used in investing activities | (2.0 | ) | (0.5 | ) | (86.5 | ) | — | (89.0 | ) | |||||||
| Financing activities: | ||||||||||||||||
| Dividend paid to parent | (35.0 | ) | (35.0 | ) | ||||||||||||
| Repayment of credit facilities | (174.9 | ) | — | — | — | (174.9 | ) | |||||||||
| Repayment of senior notes | (4.3 | ) | — | — | — | (4.3 | ) | |||||||||
| Cash contributions from parent | — | — | 976.7 | (976.7 | ) | — | ||||||||||
| Cash contributions from subsidiaries | 1,032.1 | — | 11.9 | (1,044.0 | ) | — | ||||||||||
| Cash distributions to parent | — | (52.6 | ) | (979.5 | ) | 1,032.1 | — | |||||||||
| Cash distributions to subsidiaries | (976.7 | ) | — | (11.9 | ) | 988.6 | — | |||||||||
| Capital contributions received from minority shareholders | — | — | 3.6 | — | 3.6 | |||||||||||
| Other | 6.2 | — | — | — | 6.2 | |||||||||||
| Intercompany advances—net of repayments | 189.4 | (3.2 | ) | (186.2 | ) | — | — | |||||||||
| Net cash provided by (used in) financing activities | 36.8 | (55.8 | ) | (185.4 | ) | — | (204.4 | ) | ||||||||
| Effect of exchange rate changes on cash | — | — | (4.6 | ) | — | (4.6 | ) | |||||||||
| Decrease in cash and cash equivalents | (0.7 | ) | 0.3 | (25.4 | ) | — | (25.8 | ) | ||||||||
| Cash and cash equivalents at beginning of period | 7.4 | (0.4 | ) | 131.0 | — | 138.0 | ||||||||||
| Cash and cash equivalents at end of period | $ | 6.7 | $ | (0.1 | ) | $ | 105.6 | $ | — | $ | 112.2 | |||||
34
HUNTSMAN INTERNATIONAL LLC AND SUBSIDIARIES
CONDENSED CONSOLIDATING STATEMENTS OF CASH FLOWS (UNAUDITED)
SIX MONTHS ENDED JUNE 30, 2004
(Dollars in Millions)
| |
Parent Only Huntsman International |
Guarantors |
Non- Guarantors |
Eliminations |
Consolidated Huntsman International |
|||||||||||
|---|---|---|---|---|---|---|---|---|---|---|---|---|---|---|---|---|
| Net cash (used in) provided by operating activities | $ | (82.4 | ) | $ | 98.1 | $ | 27.3 | $ | — | $ | 43.0 | |||||
| Investing activities: | ||||||||||||||||
| Capital expenditures | (2.5 | ) | (4.5 | ) | (53.4 | ) | — | (60.4 | ) | |||||||
| Investments in unconsolidated affiliate | — | — | (11.8 | ) | — | (11.8 | ) | |||||||||
| Net cash received from unconsolidated affiliate | — | 8.3 | — | — | 8.3 | |||||||||||
| Advances to unconsolidated affiliate | (1.2 | ) | — | — | — | (1.2 | ) | |||||||||
| Net cash (used in) provided by investing activities | (3.7 | ) | 3.8 | (65.2 | ) | — | (65.1 | ) | ||||||||
| Financing activities: | ||||||||||||||||
| Net borrowings under revolving loan facilities | 15.0 | — | — | — | 15.0 | |||||||||||
| Net repayments of overdraft facility | (7.5 | ) | — | — | — | (7.5 | ) | |||||||||
| Cash contributions from parent | — | 129.1 | 2,408.8 | (2,537.9 | ) | — | ||||||||||
| Cash contributions from subsidiaries | 2,557.7 | — | — | (2,557.7 | ) | — | ||||||||||
| Cash distributions to parent | — | (178.3 | ) | (2,379.4 | ) | 2,557.7 | — | |||||||||
| Cash distributions to subsidiaries | (2,537.9 | ) | — | — | 2,537.9 | — | ||||||||||
| Capital contributions received from minority shareholders | — | — | 2.7 | — | 2.7 | |||||||||||
| Intercompany advances—net of repayments | 46.3 | (52.8 | ) | 6.5 | — | — | ||||||||||
| Net cash provided by (used in) financing activities | 73.6 | (102.0 | ) | 38.6 | — | 10.2 | ||||||||||
| Effect of exchange rate changes on cash | — | — | (0.7 | ) | — | (0.7 | ) | |||||||||
| Decrease in cash and cash equivalents | (12.5 | ) | (0.1 | ) | — | — | (12.6 | ) | ||||||||
| Cash and cash equivalents at beginning of period | 16.6 | (0.3 | ) | 81.5 | — | 97.8 | ||||||||||
| Cash and cash equivalents at end of period | $ | 4.1 | $ | (0.4 | ) | $ | 81.5 | $ | — | $ | 85.2 | |||||
35
ITEM 2. MANAGEMENT'S DISCUSSION AND ANALYSIS OF FINANCIAL CONDITION AND RESULTS OF OPERATIONS
Forward-looking Statements
Some of the statements contained in this report are forward-looking in nature. In some cases, you can identify forward-looking statements by terminology such as "believes," "expects," "may," "will," "should," "anticipates" or "intends" or the negative of such terms or other comparable terminology, or by discussions of strategy. You are cautioned that our business and operations are subject to a variety of risks and uncertainties, and, consequently, our actual results may materially differ from those projected by any forward-looking statements. Some of the risks and uncertainties are discussed below in "—Cautionary Statement for Forward Looking Information" and elsewhere in this report.
Certain Defined Terms
For convenience in this report, the terms "Company," "our," "us" or "we" may be used to refer to Huntsman International LLC and, unless the context otherwise requires, its subsidiaries. In this report, "HIH" refers to Huntsman International Holdings LLC, "Huntsman LLC" or "HLLC" refers to Huntsman LLC and, unless the context otherwise requires, its subsidiaries, "HMP" refers to HMP Equity Holdings Corporation, "Huntsman Holdings" refers to Huntsman Holdings, LLC, "Huntsman Corporation" refers to Huntsman Corporation and its predecessors, and, unless the context otherwise requires, their subsidiaries, "AdMat" refers to Huntsman Advanced Materials LLC and, unless the context otherwise requires, its subsidiaries, "MatlinPatterson" refers to MatlinPatterson Global Opportunities Partners L.P. and its affiliates and "ICI" refers to Imperial Chemical Industries PLC and, unless the context otherwise requires, its subsidiaries.
Proposed Merger with Huntsman LLC and Proposed New Credit Facility
In July 2005, Huntsman LLC obtained the required consents from the holders of its senior secured notes and its senior notes to amend certain provisions in the indentures governing its notes. The amendments will facilitate the proposed merger of Huntsman LLC with and into our Company. The proposed merger of Huntsman LLC with and into our Company will help simplify the financing and reporting structure of Huntsman Corporation and is expected to facilitate other organizational efficiencies. We have recently completed the syndication of the proposed new secured credit facility for the merged company. The proposed secured credit facility is expected to be comprised of a $1.85 billion term loan due 2012 and a $650 million revolving loan facility due 2011. Initial interest rate margins under the proposed secured credit facility are contemplated to be at LIBOR plus 1.75%. In addition, we have received a commitment to temporarily expand the commercial paper facility that is part of our accounts receivable securitization program by $50 million from $125 million to $175 million. Proceeds from the new credit facility, together with the expected increase in borrowings under the accounts receivable securitization program, will be used to repay outstanding borrowings under our existing senior secured credit facilities, Huntsman LLC's senior secured credit facilities and certain other debt. We expect to complete the merger and related financing in the third quarter of 2005. However, there can be no assurances that the new facility will be obtained. If the credit facility is not obtained, the proposed merger will not occur.
36
The following tables provide a summary of our structure before and after the proposed merger:
Sale of TDI Business
On July 6, 2005, we sold our toluene di-isocyanate ("TDI") business to BASF. The sale involved the transfer of our TDI customer list and sales contracts. The TDI business has been accounted for as a discontinued operation. Please see footnote 23—"Discontinued Operations" in the Notes to Condensed Consolidated Financial Statements.
We derive our revenues, earnings and cash flow from the sale of a wide variety of differentiated and commodity chemicals. We manage our operations through our four principal operating segments: Polyurethanes, Performance Products, Pigments and Base Chemicals. We manufacture products at facilities located in North America, Europe, Asia, Australia and Africa, and our products are sold throughout the world. The major products of each reportable operating segment are as follows:
| Segment |
Products |
|
|---|---|---|
| Polyurethanes | MDI, TPU, polyols, aniline, PO and MTBE | |
| Performance Products | Surfactants, ethyleneamines and other performance chemicals | |
| Pigments | Titanium dioxide ("TiO2") | |
| Base Chemicals | Ethylene, propylene, benzene, cyclohexane and paraxylene |
Our products are divided into two broad categories—differentiated and commodity chemicals. Our Polyurethanes and Performance Products businesses mainly produce differentiated products and our Pigments and Base Chemicals businesses mainly produce commodity chemicals. Among our commodity products, our Pigments business, while cyclical, tends to follow different trends and is not influenced by the same factors as our petrochemical-based commodity products. In addition, there are a limited number of significant competitors in our Pigments business, relatively high barriers to entry and strong customer loyalty. Each of our four operating segments is impacted to varying degrees by economic conditions, prices of raw materials and global supply and demand pressures.
Growth in our Polyurethanes segment has been driven by the continued substitution of our products for other materials across a broad range of applications as well as the level of global economic activity. Historically, demand for many of these products has grown at rates in excess of gross domestic
37
product ("GDP") growth. In Polyurethanes, this growth, particularly in Asia, has recently resulted in even stronger demand and higher industry capacity utilization rates for many of our key products, including MDI. In the six months ended June 30, 2005, the profitability of our Polyurethanes segment improved on continued strong demand in many of our key industrial end markets. We have further restored value to the business through increased selling prices, which more than offset increases in the cost of our primary raw materials.
The global PO market is influenced by supply and demand imbalances. PO demand is largely driven by growth in the polyurethane industry, and, as a result, growth rates for PO have generally exceeded GDP growth rates. As a co-product of our PO manufacturing process, we also produce MTBE. MTBE is an oxygenate that is blended with gasoline to reduce harmful vehicle emissions and to enhance the octane rating of gasoline. See "—Environmental, Health and Safety Matters—MTBE Developments" for more information on the legal and regulatory developments that may curtail or eliminate the use of MTBE in gasoline in the U.S.
In our Performance Products segment, demand for our ethyleneamines has generally continued to grow at rates in excess of GDP as overall demand is significantly influenced by new product and application development. Demand for surfactants in Europe typically increases in line with GDP.
Historically, demand for titanium dioxide pigments has grown at rates approximately equal to global GDP growth. Pigment prices have historically reflected industry-wide operating rates but have typically lagged behind movements in these rates by up to twelve months due to the effects of product stocking and destocking by customers and producers, contract arrangements and seasonality. The industry experiences some seasonality in its sales because sales of paints, the largest end use for titanium dioxide, generally peak during the spring and summer months in the northern hemisphere. This results in greater sales volumes in the second and third quarters of the year.
The profitability of our Base Chemicals segment has historically been cyclical in nature. The industry has been in a down cycle resulting from significant new capacity additions, weak demand reflecting soft global economic conditions and high crude oil and natural gas-based raw material costs. Despite continued high feedstock costs, the profitability of our Base Chemicals segment improved in the six months ended June 30, 2005 as demand strengthened and average selling prices and contribution margins increased in most of our product lines.
38
The following sets forth the condensed consolidated results of operations for the three and six months ended June 30, 2005 and 2004.
| |
Three Months Ended June 30, 2005 |
Three Months Ended June 30, 2004 |
Percent Change |
Six Months Ended June 30, 2005 |
Six Months Ended June 30, 2004 |
Percent Change |
|||||||||||
|---|---|---|---|---|---|---|---|---|---|---|---|---|---|---|---|---|---|
| Revenues | $ | 1,930.2 | $ | 1,605.5 | 20 | % | $ | 3,878.5 | $ | 3,085.6 | 26 | % | |||||
| Cost of goods sold | (1,599.8 | ) | (1,373.2 | ) | 17 | % | (3,189.1 | ) | (2,704.4 | ) | 18 | % | |||||
| Gross profit | 330.4 | 232.3 | 42 | % | 689.4 | 381.2 | 81 | % | |||||||||
| Operating expenses (including expenses of selling, general, and admininstrative, research and development and other operating costs) | (104.0 | ) | (126.4 | ) | (18 | )% | (234.7 | ) | (226.4 | ) | 4 | % | |||||
| Restructuring and plant closing costs | (18.5 | ) | (124.9 | ) | (85 | )% | (25.5 | ) | (133.6 | ) | (81 | )% | |||||
| Operating income (loss) | 207.9 | (19.0 | ) | NM | 429.2 | 21.2 | NM | ||||||||||
| Interest expense, net | (53.3 | ) | (62.9 | ) | (15 | )% | (117.1 | ) | (131.9 | ) | (11 | )% | |||||
| Loss on accounts receivable securitization program | (2.4 | ) | (3.0 | ) | (20 | )% | (5.6 | ) | (6.5 | ) | (14 | )% | |||||
| Other expense | (1.8 | ) | — | NM | (3.1 | ) | (0.2 | ) | NM | ||||||||
| Income (loss) from continuing operations before income taxes and minority interest | 150.4 | (84.9 | ) | NM | 303.4 | (117.4 | ) | NM | |||||||||
| Income tax expense | (33.2 | ) | (4.7 | ) | 606 | % | (56.7 | ) | (8.3 | ) | 583 | % | |||||
| Minority interest | — | — | NM | (0.1 | ) | — | NM | ||||||||||
| Loss from discontinued operations, net(1) | (40.4 | ) | (0.9 | ) | NM | (43.0 | ) | (1.7 | ) | NM | |||||||
| Net income (loss) | $ | 76.8 | $ | (90.5 | ) | NM | $ | 203.6 | $ | (127.4 | ) | NM | |||||
| Interest expense, net | 53.3 | 62.9 | (15 | )% | 117.1 | 131.9 | (11 | )% | |||||||||
| Income tax expense | 33.2 | 4.7 | 606 | % | 56.7 | 8.3 | 583 | % | |||||||||
| Depreciation and amortization | 73.4 | 79.8 | 8% | 149.2 | 156.8 | (5 | )% | ||||||||||
| EBITDA(2) | $ | 236.7 | $ | 56.9 | 316 | % | $ | 526.6 | $ | 169.6 | 210 | % | |||||
NM—Not meaningful
39
Included in EBITDA are the following items of expense:
| |
Three Months Ended June 30, 2005 |
Three Months Ended June 30, 2004 |
Six Months Ended June 30, 2005 |
Six Months Ended June 30, 2004 |
|||||||||||
|---|---|---|---|---|---|---|---|---|---|---|---|---|---|---|---|
| Loss on accounts receivable securitization program | $ | (2.4 | ) | $ | (3.0 | ) | $ | (5.6 | ) | $ | (6.5 | ) | |||
| Loss on discontinued operations, net | (40.9 | ) | (0.9 | ) | (43.0 | ) | (1.7 | ) | |||||||
| Legal settlement, net of recoveries | — | (14.9 | ) | — | (14.9 | ) | |||||||||
| Loss early extingusihment of debt | (1.7 | ) | — | (3.0 | ) | — | |||||||||
| Restructuring and plant closing costs: | |||||||||||||||
| Polyurethanes | (2.2 | ) | (18.1 | ) | (4.1 | ) | (22.9 | ) | |||||||
| Performance Products | — | (0.4 | ) | — | (0.4 | ) | |||||||||
| Pigments | (14.4 | ) | (104.2 | ) | (17.3 | ) | (108.1 | ) | |||||||
| Base Chemicals | (1.9 | ) | (2.2 | ) | (4.1 | ) | (2.2 | ) | |||||||
| Total restructuring and plant closing costs | (18.5 | ) | (124.9 | ) | (25.5 | ) | (133.6 | ) | |||||||
| Total items of expense included in EBITDA | $ | (63.5 | ) | $ | (143.7 | ) | $ | (77.1 | ) | $ | (156.7 | ) | |||
40
costs of productive assets and the depreciation and amortization expense among companies. Our management also believes that our investors use EBITDA as a measure of our ability to service indebtedness as well as to fund capital expenditures and working capital requirements. Nevertheless, our management recognizes that there are material limitations associated with the use of EBITDA in the evaluation of our Company as compared to net income, which reflects overall financial performance, including the effects of interest, income taxes, depreciation and amortization. EBITDA excludes interest expense. Because we have borrowed money in order to finance our operations, interest expense is a necessary element of our costs and ability to generate revenue. Therefore, any measure that excludes interest expense has material limitations. EBITDA also excludes taxes. Because the payment of taxes is a necessary element of our operations, any measure that excludes tax expense has material limitations. Finally, EBITDA excludes depreciation and amortization expense. Because we use capital assets, depreciation and amortization expense is a necessary element of our costs and ability to generate revenue. Therefore, any measure that excludes depreciation and amortization expense has material limitations. Our management compensates for the limitations of using EBITDA by using it to supplement GAAP results to provide a more complete understanding of the factors and trends affecting the business than GAAP results alone. Our management also uses other metrics to evaluate capital structure, tax planning and capital investment decisions. For example, our management uses credit ratings and net debt ratios to evaluate capital structure, effective tax rate by jurisdiction to evaluate tax planning, and payback period and internal rate of return to evaluate capital investments. Our management also uses trade working capital to evaluate its investment in accounts receivable and inventory, net of accounts payable.
We believe that net income (loss) is the performance measure calculated and presented in accordance with GAAP that is most directly comparable to EBITDA and that cash provided by (used in) operating activities is the liquidity measure calculated and presented in accordance with GAAP that is most directly comparable to EBITDA. The following table reconciles EBITDA to our net income (loss) and to our cash provided by operations:
| |
Six Months Ended June 30, 2005 |
Six Months Ended June 30, 2004 |
|||||
|---|---|---|---|---|---|---|---|
| EBITDA | $ | 526.6 | $ | 169.6 | |||
| Depreciation and amortization expense | (149.2 | ) | (156.8 | ) | |||
| Interest expense, net | (117.1 | ) | (131.9 | ) | |||
| Income tax expense | (56.7 | ) | (8.3 | ) | |||
| Net income (loss) | 203.6 | (127.4 | ) | ||||
| Depreciation and amortization expense | 149.2 | 156.8 | |||||
| Loss on pending disposal of discontinued operations | 36.4 | — | |||||
| Deferred income taxes | 26.3 | 6.0 | |||||
| Unrealized gains on foreign currency transactions | (4.1 | ) | (14.8 | ) | |||
| Noncash restructuring and plant closing costs | 0.1 | 81.1 | |||||
| Other, net | 2.3 | 13.4 | |||||
| Changes in operating assets and liabilities | (141.6 | ) | (72.1 | ) | |||
| Net cash provided by operating activities | $ | 272.2 | $ | 43.0 | |||
41
Three Months Ended June 30, 2005 Compared to Three Months Ended June 30, 2004
For the three months ended June 30, 2005, we had net income of $76.8 million on revenues of $1,930.2 million as compared to a net loss of $90.5 million on revenues of $1,605.5 million for the same period in 2004. The increase of $167.3 million in net income was the result of the following items:
42
The following table sets forth the revenues and segment EBITDA for each of our operating segments.
| |
Three Months Ended June 30, 2005 |
Three Months Ended June 30, 2004 |
Percent Change |
|||||||
|---|---|---|---|---|---|---|---|---|---|---|
| Revenues | ||||||||||
| Polyurethanes | $ | 908.7 | $ | 715.7 | 27 | % | ||||
| Performance Products | 218.9 | 190.9 | 15 | % | ||||||
| Pigments | 267.7 | 278.1 | (4 | )% | ||||||
| Base Chemicals | 599.2 | 481.0 | 25 | % | ||||||
| Eliminations | (64.3 | ) | (60.2 | ) | 7 | % | ||||
| Total | $ | 1,930.2 | $ | 1,605.5 | 20 | % | ||||
| Segment EBITDA | ||||||||||
| Polyurethanes | $ | 155.6 | $ | 100.0 | 56 | % | ||||
| Performance Products | 5.3 | 2.5 | 112 | % | ||||||
| Pigments | 24.6 | (83.5 | ) | NM | ||||||
| Base Chemicals | 60.6 | 57.8 | 5 | % | ||||||
| Corporate and other | (9.4 | ) | (19.9 | ) | (53 | )% | ||||
| Total | $ | 236.7 | $ | 56.9 | 316 | % | ||||
Polyurethanes
For the three months ended June 30, 2005, Polyurethanes revenues increased by $193.0 million, or 27%, as compared to the same period in 2004, primarily as a result of increased MDI revenues. MDI revenues increased 39%, resulting from 42% higher average selling prices. The increase in MDI average selling prices was due to the combination of strong growth in higher value applications, a continued strong supply/demand position, the strength of the major European currencies versus the U.S. dollar and in response to higher raw material and energy costs. MDI sales volumes were 2% lower due to planned maintenance outages in the 2005 period. Average selling prices of propylene oxide ("PO") and the co-product, MTBE, were also higher.
For the three months ended June 30, 2005, Polyurethanes segment EBITDA increased by $55.6 million, or 56%, to $155.6 million from $100.0 million in the same period in 2004. Segment EBITDA increased primarily as a result of higher contribution margins, as average selling prices more than offset increases in raw material and energy costs. In addition, our Polyurethanes segment recorded restructuring and plant closing costs of $2.2 million in the three months ended June 30, 2005 as compared to $18.1 million in the same period in 2004, a net decrease of $15.9 million. For further discussion of restructuring activities, see "—Liquidity and Capital Resources—Restructuring and Plant Closing Costs" below. During the three months ended June 30, 2005, our Polyurethanes segment recorded a $36.4 million loss on the pending disposal of its TDI business while the operating loss relating to TDI was $4.0 million.
Performance Products
For the three months ended June 30, 2005, Performance Products revenues increased by $28.0 million, or 15%, as compared to the same period in 2004, primarily as a result of higher average selling prices, offset somewhat by lower sales volumes. Overall, average selling prices increased by 20% in response to higher raw material and energy costs and the strengthening of the major European currencies versus the U.S. dollar. Sales volumes decreased by 4% principally due to lower sales of certain surfactants.
43
For the three months ended June 30, 2005, Performance Products segment EBITDA increased by $2.8 million, or 112%, to $5.3 million as compared to $2.5 million in the same period in 2004. This increase in segment EBITDA was due primarily to higher contribution margins as average selling prices increased more than raw material and energy costs.
Pigments
For the three months ended June 30, 2005, Pigments revenues decreased by $10.4 million, or 4%, as compared to the same period in 2004, resulting principally from a 15% reduction in sales volumes, offset in part by a 12% increase in average selling prices. Sales volumes were lower due to the restructuring of our Grimsby, U.K. and Umbogintwini, South Africa facilities during 2004 and due to lower end-use demand, particularly in Europe. Average selling prices increased in all regions and benefited from the strengthening of the major European currencies versus the U.S. dollar as well as price increase initiatives implemented during the second half of 2004 and early 2005.
Pigments segment EBITDA for the three months ended June 30, 2005 increased by $108.1 million to income of $24.6 million from a loss of $83.5 million for the same period in 2004. This increase in EBITDA was primarily a result of lower restructuring charges, a $14.9 million decrease in legal costs and settlement amounts associated with Discoloration Claims and higher average selling prices, offset in part by an $8.7 million non-cash charge related to the treatment of a purchase contract. During the three months ended June 30, 2005 and 2004, our Pigments segment recorded restructuring and plant closing charges of $14.4 million and $104.2 million, respectively. For further discussion of restructuring activities, see "—Liquidity and Capital Resources—Restructuring and Plant Closing Costs" below.
Base Chemicals
For the three months ended June 30, 2005, Base Chemicals revenues increased by $118.2 million, or 25%, as compared to the same period in 2004, resulting from a 23% increase in average selling prices and a 2% increase in sales volumes. Average selling prices increased primarily in response to higher raw material and energy costs and tightening supply and demand balances.
For the three months ended June 30, 2005, Base Chemicals segment EBITDA increased by $2.8 million, or 5%, to $60.6 million as compared to $57.8 million in the same period in 2004. Segment EBITDA increased principally as a result of higher contribution margins, as higher average selling prices more than offset higher raw material and energy costs and increased foreign currency transaction losses. During the three months ended June 30, 2005 and 2004, the Base Chemicals segment recorded charges for restructuring and plant closing costs of $1.9 million and $2.2 million, respectively. For further discussion of restructuring activities, see "—Liquidity and Capital Resources—Restructuring and Plant Closing Costs" below.
Corporate and Other
Corporate and other items include unallocated corporate overhead, loss on our accounts receivable securitization program and unallocated foreign exchange gains and losses. For the three months ended June 30, 2005, EBITDA from corporate and other items improved by $10.5 million to a loss of $9.4 million from a loss of $19.9 million in the same period in 2004. The improvement in EBITDA resulted primarily from a decrease in unallocated foreign currency transaction losses.
44
Six Months Ended June 30, 2005 Compared to Six Months Ended June 30, 2004
For the six months ended June 30, 2005, we had net income of $203.6 million on revenues of $3,878.5 million as compared to a net loss of $127.4 million on revenues of $3,085.6 million for the same period in 2004. The increase of $331.0 million in net income was the result of the following items:
45
The following table sets forth the revenues and segment EBITDA for each of our operating segments.
| |
Six Months Ended June 30, 2005 |
Six Months Ended June 30, 2004 |
Percent Change |
|||||||
|---|---|---|---|---|---|---|---|---|---|---|
| Revenues | ||||||||||
| Polyurethanes | $ | 1,802.0 | $ | 1,337.2 | 35 | % | ||||
| Performance Products | 429.4 | 375.0 | 15 | % | ||||||
| Pigments | 530.9 | 533.1 | 0 | % | ||||||
| Base Chemicals | 1,277.8 | 954.9 | 34 | % | ||||||
| Eliminations | (161.6 | ) | (114.6 | ) | 21 | % | ||||
| Total | $ | 3,878.5 | $ | 3,085.6 | 26 | % | ||||
| Segment EBITDA | ||||||||||
| Polyurethanes | $ | 341.3 | $ | 172.8 | 98 | % | ||||
| Performance Products | 5.5 | 4.3 | 28 | % | ||||||
| Pigments | 63.9 | (75.8 | ) | NM | ||||||
| Base Chemicals | 162.8 | 89.2 | 83 | % | ||||||
| Corporate and other | (46.9 | ) | (20.9 | ) | 124 | % | ||||
| Total | $ | 526.6 | $ | 169.6 | 210 | % | ||||
Polyurethanes
For the six months ended June 30, 2005, Polyurethanes revenues increased by $464.8 million, or 35%, as compared to the same period in 2004, primarily due to higher average selling prices for MDI. MDI revenues increased by 42%, resulting from 43% higher average selling prices and 1% lower sales volumes, resulting from capacity constraints related to scheduled turnarounds and inspections. In addition, average selling prices and sales volumes of PO and the co-product, MTBE, were also higher. The increase in MDI average selling prices is a result of the combination of solid growth in higher value applications, a continued strong supply/demand position, the strength of the major European currencies versus the U.S. dollar and in response to higher raw material and energy costs.
For the six months ended June 30, 2005, Polyurethanes segment EBITDA increased by $168.5 million, or 98%, as compared to the same period in 2004. Segment EBITDA increased primarily as a result of higher contribution margins, as increases in average selling prices more than offset increases in raw material and energy costs. In addition, our Polyurethanes segment recorded restructuring and plant closing costs of $4.1 million in the six months ended June 30, 2005 as compared to $22.9 million in the same period in 2004, a net decrease of $18.8 million. For further discussion of restructuring activities, see "—Liquidity and Capital Resources—Restructuring and Plant Closing Costs" below. During the six months ended June 30, 2005, our Polyurethanes segment recorded a $36.4 million loss on the pending disposal of its TDI business while the operating loss relating to TDI was $6.6 million.
Performance Products
For the six months ended June 30, 2005, Performance Products revenues increased by $54.4 million, or 15%, as compared to the same period in 2004, primarily as a result of higher average selling prices, offset somewhat by lower sales volumes. Overall, average selling prices increased by 18% in response to higher raw material costs and the strengthening of the major European currencies versus the U.S. dollar. Sales volumes decreased by 3% primarily due to lower sales of certain surfactants.
46
For the six months ended June 30, 2005, Performance Products segment EBITDA increased by $1.2 million, or 28%, to $5.5 million as compared to $4.3 million in the same period in 2004. Segment EBITDA increased principally as a result of higher contribution margins, as average selling prices increased more than raw material and energy costs.
Pigments
For the six months ended June 30, 2005, Pigments revenues decreased slightly to $530.9 million as compared to $533.1 million for the same period in 2004. The reduction in revenues resulted principally from a 12% decrease in sales volumes, offset by a 12% increase in average selling prices. Sales volumes were lower due to the restructuring of our Grimsby, U.K. and Umbogintwini, South Africa facilities during 2004 and due to lower end-use demand, particularly in Europe. Average selling prices increased in all regions and benefited from the strengthening of the major European currencies versus the U.S. dollar as well as from price increase initiatives implemented during the second half of 2004 and early 2005.
Pigments segment EBITDA for the six months ended June 30, 2005 increased by $139.7 million to income of $63.9 million from a loss of $75.8 million for the same period in 2004. The increase in segment EBITDA was primarily the result of a $90.8 million decrease in restructuring and plant closing charges, a $14.9 million decrease in legal costs and settlement amounts associated with Discoloration Claims and higher average selling prices, offset in part by an $8.7 million non-cash charge related to the treatment of a purchase contract. During the six months ended June 30, 2005 and 2004, our Pigments segment recorded restructuring and plant closing charges of $17.3 million and $108.1 million, respectively. For further discussion of restructuring activities, see "—Liquidity and Capital Resources—Restructuring and Plant Closing Costs" below.
Base Chemicals
For the six months ended June 30, 2005, Base Chemicals revenues increased by $322.9 million, or 34%, as compared to the same period in 2004, resulting from a 33% increase in average selling prices and a 1% increase in sales volumes. Average selling prices increased primarily in response to higher raw material and energy costs and tightening supply and demand balances.
For the six months ended June 30, 2005, Base Chemicals segment EBITDA increased by $73.6 million, or 83%, to $162.8 million as compared to $89.2 million in the same period in 2004. Segment EBITDA increased principally as a result of higher contribution margins, as higher average selling prices more than offset higher raw material and energy costs. Segment EBITDA for the six months ended June 30, 2005 and 2004 included charges for restructuring and plant closing costs of $4.1 million and $2.2 million, respectively. For further discussion of restructuring activities, see "—Liquidity and Capital Resources—Restructuring and Plant Closing Costs" below.
Corporate and Other
Corporate and other items include unallocated corporate overhead, loss on our accounts receivable securitization program and unallocated foreign exchange gains and losses. For the six months ended June 30, 2005, EBITDA from corporate and other items decreased by $26.0 million to a loss of $46.9 million from a loss of $20.9 million in the same period in 2004. The decrease in EBITDA resulted primarily from an increase in unallocated foreign currency transaction losses.
47
Liquidity and Capital Resources
Cash
Net cash provided by operating activities for the six months ended June 30, 2005 increased by $229.2 million to $272.2 million from $43.0 million in the same period in 2004. The increase is primarily attributable to increased net income of $331.0 million and favorable variances in adjustments to reconcile net income (loss) to net cash provided by operations, including a favorable variance of $20.3 million in deferred income taxes and a favorable variance of $36.4 million in loss on the pending disposal of assets. These favorable variances were partially offset by a decrease of $69.5 million in changes in operating assets and liabilities and an unfavorable variance of $81.0 million in non-cash restructuring and plant closing costs.
Net cash used in investing activities for the six months ended June 30, 2005 increased by $23.9 million, primarily as a result of an increase in capital expenditures of $22.7 million. This increase is mainly attributed to increased capital expenditures in our Consolidated Chinese Splitting JV and in our LDPE facility being constructed at Wilton, U.K.
Net cash used in financing activities for the six months ended June 30, 2005 increased by $214.6 million to $204.4 million as compared to $10.2 million provided by financing activities in the same period in 2004. The increase in net cash used in financing activities is mainly a result of voluntary repayments of indebtedness of $174.9 million during the six months ended June 30, 2005 on our HI Credit Facilities. Our voluntary repayment resulted from improved operating cash flow during the six months ended June 30, 2005, in contrast to borrowings under our revolving credit facility during the same period of 2004 to fund negative operating cash flow. In addition, in the six months ended June 30, 2005, we paid a $35.0 million dividend to HIH.
Changes in Financial Condition
| |
June 30, 2005 |
December 31, 2004 |
Difference |
Percent Change |
||||||||||
|---|---|---|---|---|---|---|---|---|---|---|---|---|---|---|
| Current assets: | ||||||||||||||
| Cash and cash equivalents | $ | 112.2 | $ | 138.0 | $ | (25.8 | ) | (19 | )% | |||||
| Accounts receivable, net | 810.2 | 806.0 | 4.2 | 1 | % | |||||||||
| Inventories, net | 759.1 | 735.6 | 23.5 | 3 | % | |||||||||
| Prepaid expenses | 16.0 | 30.8 | (14.8 | ) | (48 | )% | ||||||||
| Deferred income taxes | 10.2 | 10.2 | — | — | ||||||||||
| Other current assets | 55.8 | 50.5 | 5.3 | 10 | % | |||||||||
| Total current assets | 1,763.5 | 1,771.1 | (7.6 | ) | — | |||||||||
| Current liabilities: | ||||||||||||||
| Accounts payable | 663.2 | 688.3 | (25.1 | ) | (4 | )% | ||||||||
| Accrued liabilities | 324.9 | 419.7 | (94.8 | ) | (23 | )% | ||||||||
| Current portion of long-term debt | 20.7 | 10.5 | 10.2 | 97 | % | |||||||||
| Total current liabilities | 1,008.8 | 1,118.5 | (109.7 | ) | (10 | )% | ||||||||
| Working capital | $ | 754.7 | $ | 652.6 | $ | 102.1 | 16 | % | ||||||
As of June 30, 2005, our working capital increased by $102.1 million as a result of the net impact of the following significant changes:
48
Debt and Liquidity
HI Credit Facilities
As of June 30, 2005, we had senior secured credit facilities (the "HI Credit Facilities") which consisted of a revolving loan facility of up to $375 million maturing in September 2008 (the "HI Revolving Facility"), which includes a $50 million multicurrency revolving loan facility available in euros, GBP Sterling and U.S. dollars, and a term loan B facility consisting of a $1,082.5 million term portion and a €41.6 million (approximately $50.2 million) term portion (the "HI Term Facility"). On March 24, 2005, and June 6, 2005, we made voluntary repayments of $75 million and $100 million dollar equivalents, respectively, on the HI Term Facility. The maturity of the HI Term Facility is December 31, 2010; provided that the maturity will be accelerated to December 31, 2008 if we have not refinanced all of the outstanding HI Senior Notes and the HI Subordinated Notes (as defined below) on or before December 31, 2008 on terms satisfactory to the administrative agent under the HI Credit Facilities. Scheduled amortization of the HI Term Facility is approximately $11.4 million per annum commencing June 30, 2006, with the remaining unpaid balance due at maturity. The HI Credit Facility allows us to borrow up to $100 million secured by letters of credit; however, the $375 million revolving credit facility is reduced dollar-for-dollar by any letters of credit outstanding. As of June 30, 2005, there were no loans outstanding on the HI Revolving Facility, and there were $6.9 million in letters of credit outstanding.
Interest rates for the amended and restated HI Credit Facilities are based upon, at our option, either a eurocurrency rate (LIBOR) or a base rate (prime) plus the applicable spread. The applicable spreads vary based on a pricing grid, depending on the loan facility and whether specified conditions have been satisfied, in the case of eurocurrency-based term loans, from 2.25% to 2.50% for term loan B dollar loans per annum and from 3.00% to 3.25% for term loan B euro loans per annum, and, in the case of base rate term loans, from 1.00% to 1.25% for term B dollar loans per annum. The applicable spread for eurocurrency-based revolving loans ranges from 2.25% to 3.25% and for base rate revolving loans from 1.00% to 2.00%. As of June 30, 2005 and December 31, 2004, the weighted average interest rates on the HI Credit Facilities was approximately 5.5%, excluding the impact of interest rate hedges.
The HI Credit Facilities are secured by a first priority lien on substantially all our assets and all the assets of our domestic subsidiaries and certain of our foreign subsidiaries. The HI Credit Facilities are also guaranteed by HIH, our domestic subsidiaries and certain of our foreign subsidiaries (the "HI Guarantors").
The agreements governing the HI Credit Facilities contain customary financial covenants; covenants relating to the incurrence of debt, the purchase and sale of assets, limitations on investments and affiliate transactions; change in control provisions; events of default provisions; and acceleration provisions. Management believes that we are in compliance with the covenants of the HI Credit Facilities.
Notes
In March 2002, we sold $300 million aggregate principal amount of HI Senior Notes due 2009. On April 11, 2003, we sold an additional $150 million aggregate principal amount of the HI Senior Notes at an issue price of 105.25%. Net proceeds from the sale of these notes were used to repay amounts
49
outstanding under the HI Credit Facilities. The HI Senior Notes are unsecured obligations. Interest on the HI Senior Notes is payable semiannually in March and September of each year. The HI Senior Notes are redeemable after March 1, 2006 at 104.937% of the original aggregate principal amount thereof, declining ratably to par on and after March 1, 2008.
On December 17, 2004, we completed an offering of $175 million of our 7.375% senior subordinated notes due 2015 and €135 million of our 7.5% senior subordinated notes due 2015 (the "HI Senior Subordinated Notes due 2015"). We used all of the net proceeds to redeem part of our outstanding 10.125% senior subordinated notes due 2009 (the "HI Senior Subordinated Notes due 2009" and, together with the HI Senior Subordinated Notes due 2015, the "HI Senior Subordinated Notes"). Prior to the partial redemptions of the HI Senior Subordinated Notes due 2009 discussed below, we had outstanding $600 million and €450 million. The HI Senior Subordinated Notes due 2009 became redeemable on July 1, 2004 at 105.063% of the principal amount thereof, which declines ratably to par on and after July 1, 2007. We redeemed $231 million and €77 million of HI Senior Subordinated Notes due 2009 on December 31, 2004 and $2.9 million and €1.0 million of HI Senior Subordinated Notes due 2009 on January 3, 2005. In connection with these redemptions, we paid approximately $17.0 million and $0.2 million in U.S. dollar equivalents in redemption premiums on December 31, 2004 and January 3, 2005, respectively.
As of December 31, 2004, following the December 31, 2004 partial redemption of the HI Senior Subordinated Notes due 2009, we had outstanding $369 million and €373 million of HI Senior Subordinated Notes due 2009 and $175 million and €135 million of HI Senior Subordinated Notes due 2015, for a combined total of $544 million and €508 million of HI Senior Subordinated Notes plus $5.3 million of unamortized premium. As of June 30, 2005, we had outstanding $366.1 million and €372.0 million of HI Senior Subordinated Notes due 2009 and $175 million and €135 million of HI Senior Subordinated Notes due 2015, for a combined total of $541.1 million and €507.0 million of HI Senior Subordinated Notes plus $4.3 million of unamortized premium. The $175 million and €135 million HI Senior Subordinated Notes due 2015 are redeemable on or after January 1, 2010 at 103.688% and 103.750%, respectively, of the principal amount thereof, which declines ratably to par on and after January 1, 2013. In addition, at any time prior to January 1, 2008, we may redeem up to 40% of the original aggregate principal amount of the $175 million and €135 million HI Senior Subordinated Notes due 2015 at redemption prices of 107.375% and 107.5% plus accrued and unpaid interest, respectively. The HI Senior Subordinated Notes are unsecured and interest is payable semiannually in January and July of each year.
The HI Senior Notes and the HI Senior Subordinated Notes contain covenants relating to the incurrence of debt, limitations on distributions, asset sales and affiliate transactions, among other things. They also contain a change of control provision requiring us to offer to repurchase the HI Senior Notes and the HI Subordinated Notes upon a change of control. Management believes that we are in compliance with the covenants of the HI Senior Notes and the HI Senior Subordinated Notes.
On December 10, 2004, we entered into a cross-currency interest rate swap. The cross-currency swap requires us to pay euros and receive U.S. dollars at the maturity date of January 1, 2010. The U.S. dollar notional amount is $175 million and bears interest at a fixed rate of 7.375%, payable semiannually on January 1 and July 1. The euro notional amount is approximately €132 million and bears interest at a blended fixed rate of approximately 6.63%, payable semiannually on January 1 and July 1.
Other Debt
We maintain a $25 million multicurrency overdraft facility used for working capital needs for our European subsidiaries (the "HI European Overdraft Facility"), all of which was available as of June 30,
50
2005. As of December 31, 2004, there were no borrowings outstanding under the HI European Overdraft Facility.
Included within other debt is debt associated with one of our Chinese MDI joint ventures. In January 2003, we entered into a joint venture agreement with Shanghai Chlor-Alkali Chemical Company, Ltd. to build MDI production facilities near Shanghai, China. We own 70% of Huntsman Polyurethanes Shanghai Ltd. ("Consolidated Chinese Splitting JV"), which is a consolidated affiliate. On September 19, 2003, the Consolidated Chinese Splitting JV obtained secured financing for the construction of the production facilities, consisting of various committed loans in the aggregate amount of approximately $119 million in U.S. dollar equivalents. As of June 30, 2005, there were $12.0 million outstanding in U.S. dollar borrowings and 80.0 million in RMB borrowings ($9.7 million) under these facilities. The interest rate on these facilities is LIBOR plus 0.48% for U.S. dollar borrowings and 90% of the Peoples Bank of China rate for RMB borrowings. As of June 30, 2005, the interest rate for U.S. dollar borrowings was approximately 4.0% and 5.5% for RMB borrowings. The loans are secured by substantially all the assets of the Consolidated Chinese Splitting JV and will be repaid in 16 semiannual installments, beginning no later than June 30, 2007. The financing is non-recourse to us, but is guaranteed during the construction phase by affiliates of the Consolidated Chinese Splitting JV, including Huntsman Corporation, as the successor to Huntsman Holdings, LLC. Huntsman Corporation has unconditionally guaranteed 70% of any amounts due and unpaid by the Consolidated Chinese Splitting JV under the loans described above (except for the VAT facility, which is not guaranteed). Huntsman Corporation's guarantees remain in effect until the Consolidated Chinese Splitting JV has (i) commenced production at at least 70% of capacity for at least 30 days, and (ii) achieved a debt service cover ratio of at least 1.5:1. Our Chinese MDI joint ventures are unrestricted subsidiaries under the HI Credit Facilities and under the indentures governing the HI Senior Notes and the HI Subordinated Notes.
Short-Term and Long-Term Liquidity; Compliance with Covenants
We depend upon the HI Revolving Facility and our off-balance sheet accounts receivable securitization facility (the "HI A/R Securitization Program") to provide liquidity for our operations and working capital needs. For further discussion of the HI A/R Securitization Program, see "—Off-Balance Sheet Arrangements" below. As of June 30, 2005, we had no outstanding borrowings and approximately $6.9 million of outstanding letters of credit under the HI Revolving Facility, and we had $112.2 million in cash. We also maintain $25.0 million of short-term overdraft facilities, of which $10.0 million was available at June 30, 2005. Furthermore, as of June 30, 2005, we had available capacity of approximately $106.9 million under the HI A/R Securitization Program without triggering a mandatory prepayment under the HI Credit Facilities. Our total cash and unused borrowing capacity as of June 30, 2005 was approximately $597.2 million.
On February 28, 2005, we paid a dividend to HIH of $35 million. The dividend was used together with proceeds from the Huntsman Corporation initial public offering to redeem the HIH senior discount notes due 2009. On March 24, 2005, and June 6, 2005, we made voluntary repayments $75 million and $100 million dollar equivalents, respectively, on the HI Term Facility.
We believe our current liquidity, together with funds generated by our businesses, is sufficient to meet the short-term and long-term needs of our businesses, including funding operations, making capital expenditures and servicing our debt obligations in the ordinary course. We believe that we are in compliance with the covenants contained in the agreements governing all of our debt obligations.
51
Off-Balance Sheet Arrangements
Receivables Securitization
On December 21, 2000, we initiated an accounts receivable securitization program under which we grant an undivided interest in certain of our trade receivables to a qualified off-balance sheet entity (the "Receivables Trust") at a discount. This undivided interest serves as security for the issuance of commercial paper and medium-term notes by the Receivables Trust.
At June 30, 2005 and December 31, 2004, the Receivables Trust had approximately $194.4 million and $208.4 million, respectively in U.S. dollar equivalents in medium-term notes outstanding and approximately $18.1 million in U.S. dollar equivalents and nil, respectively in commercial paper outstanding. The medium-term notes have a scheduled maturity date of September 15, 2006. Our commercial paper facility has a maturity date of June 30, 2007 and provides for the issuance of both euro- and U.S.-denominated commercial paper up to a U.S. dollar equivalent of $125 million. We recently received a commitment to temporarily expand the commercial paper facility by $50 million to $175 million upon completion of the proposed merger of Huntsman LLC with and into our Company. The $50 million expansion would be available through March 31, 2006. Under the terms of the agreements, we and our subsidiaries continue to service the receivables in exchange for a fee of 1% of the outstanding receivables, and we are subject to recourse provisions.
Our retained interest in receivables (including servicing assets) subject to the program was approximately $336.7 million and $327.6 million as of June 30, 2005 and December 31, 2004, respectively. The value of the retained interest is subject to credit and interest rate risk. For the six months ended June 30, 2005 and 2004, new sales of accounts receivable sold into the program totaled approximately $2,890.8 million and $2,379.6 million, respectively, and cash collections from receivables sold into the program that were reinvested totaled $2,834.9 million and $2,335.1 million, respectively. Servicing fees received during the six months ended June 30, 2005 and 2004 were approximately $3.1 million and $2.6 million, respectively.
We incur losses on the accounts receivable securitization program for the discount on receivables sold into the program and fees and expenses associated with the program. We also retain responsibility for the economic gains and losses on forward contracts mandated by the terms of the program to hedge the currency exposures on the collateral supporting the off-balance sheet debt issued. Gains and losses on forward contracts included as a component of the loss on accounts receivable securitization program were nil and a loss of $1.2 million for the six months ended June 30, 2005 and 2004, respectively. As of each of June 30, 2005 and December 31, 2004, the fair value of the open forward currency contracts was nil.
Financing of Chinese MDI Facilities
In 2003, we entered into two related joint venture agreements to build MDI production facilities near Shanghai, China. Our Unconsolidated Chinese Manufacturing JV, with BASF AG and three Chinese chemical companies, will build three plants to manufacture MNB, aniline, and crude MDI. We effectively own 35% of the Unconsolidated Chinese Manufacturing JV. Our Consolidated Chinese Splitting JV, with Shanghai Chlor-Alkali Chemical Company, Ltd., will build a plant to manufacture pure MDI, polymeric MDI and MDI variants. We own 70% of the Consolidated Chinese Splitting JV.
On September 19, 2003, the joint ventures obtained secured financing for the construction of the production facilities. The Consolidated Chinese Splitting JV is our consolidated subsidiary, and the details of its financing are described in "—Debt and Liquidity—Other Debt" above. The Unconsolidated Chinese Manufacturing JV is not our consolidated subsidiary. The Unconsolidated Chinese Manufacturing JV obtained various committed loans in the aggregate amount of approximately $224 million in U.S. dollar equivalents. As of June 30, 2005, there were $30.0 million outstanding in
52
U.S. dollar borrowings and 216 million in outstanding RMB ($26.1 million) borrowings under these facilities. The interest rate on these facilities is LIBOR plus 0.48% for U.S. dollar borrowings and 90% of the Peoples Bank of China rate for RMB borrowings. The loans are secured by substantially all the assets of the Unconsolidated Chinese Manufacturing JV and will be paid in 16 semiannual installments, beginning no later than June 30, 2007. Huntsman Corporation, as successor to Huntsman Holdings, unconditionally guarantees 35% of any amounts due and unpaid by the Unconsolidated Chinese Manufacturing JV under the loans described above (except for a VAT facility of approximately $1.5 million which is not guaranteed). Huntsman Corporation's guarantee remains in effect until the Unconsolidated Chinese Manufacturing JV has commenced production of at least 70% of capacity for at least 30 days and achieved a debt service coverage ratio of at least 1:1.
Restructuring and Plant Closing Costs
As of June 30, 2005 and December 31, 2004, accrued restructuring and plant closing costs by type of cost and activity consisted of the following (dollars in millions):
| |
Workforce reductions |
Demolition and decommissioning |
Non-cancelable lease costs |
Other restructuring costs |
Total(1) |
|||||||||||
|---|---|---|---|---|---|---|---|---|---|---|---|---|---|---|---|---|
| Accrued liabilities as of December 31, 2004 | $ | 82.9 | $ | 4.8 | $ | 5.1 | $ | 13.8 | $ | 106.6 | ||||||
| 2005 charges for 2003 activities | 13.2 | — | — | 1.7 | 14.9 | |||||||||||
| 2005 charges for 2004 activities | 10.0 | 0.2 | 0.1 | 0.6 | 10.9 | |||||||||||
| Reversal of reserves no longer required | — | — | — | (0.4 | ) | (0.4 | ) | |||||||||
| 2005 payments for 2003 activities | (12.6 | ) | — | — | (1.3 | ) | (13.9 | ) | ||||||||
| 2005 payments for 2004 activities | (35.1 | ) | — | — | (0.7 | ) | (35.8 | ) | ||||||||
| Foreign currency effect on reserve balance | (7.0 | ) | — | — | — | (7.0 | ) | |||||||||
| Accrued liabilities as of June 30, 2005 | $ | 51.4 | $ | 5.0 | $ | 5.2 | $ | 13.7 | $ | 75.3 | ||||||
| |
June 30, 2005 |
December 31, 2004 |
||||
|---|---|---|---|---|---|---|
| Accrued liabilities by activities were as follows: | ||||||
| 2003 activities | $ | 23.6 | $ | 22.6 | ||
| 2004 activities | 55.0 | 80.3 | ||||
| Foreign currency effect on reserve balance | (3.3 | ) | 3.7 | |||
| Total | $ | 75.3 | $ | 106.6 | ||
53
Details with respect to our reserves for restructuring and plant closing costs are provided below by segments and activity (dollars in millions):
| |
Polyurethanes |
Performance Products |
Pigments |
Base Chemicals |
Total |
|||||||||||||
|---|---|---|---|---|---|---|---|---|---|---|---|---|---|---|---|---|---|---|
| Accrued liabilities as of December 31, 2004 | $ | 19.0 | $ | 50.5 | $ | 22.0 | $ | 15.1 | $ | 106.6 | ||||||||
| 2005 charges for 2003 activities | 3.3 | — | 11.6 | — | 14.9 | |||||||||||||
| 2005 charges for 2004 activities | 1.1 | — | 5.7 | 4.1 | 10.9 | |||||||||||||
| Reversal of reserves no longer required | — | (0.4 | ) | — | — | (0.4 | ) | |||||||||||
| 2005 payments for 2003 activities | (3.8 | ) | (0.8 | ) | (9.3 | ) | — | (13.9 | ) | |||||||||
| 2005 payments for 2004 activities | (3.6 | ) | (12.5 | ) | (8.9 | ) | (10.8 | ) | (35.8 | ) | ||||||||
| Foreign currency effect on reserve balance | (1.4 | ) | (3.1 | ) | (2.0 | ) | (0.5 | ) | (7.0 | ) | ||||||||
| Accrued liabilities as of June 30, 2005 | $ | 14.6 | $ | 33.7 | $ | 19.1 | $ | 7.9 | $ | 75.3 | ||||||||
| Current portion of restructuring reserve | $ | 6.2 | $ | 23.8 | $ | 13.1 | $ | 7.9 | $ | 51.0 | ||||||||
| Long-term portion of restructuring reserve | 8.4 | 9.9 | 6.0 | — | 24.3 | |||||||||||||
| Estimated additional future charges for current restructuring projects: | ||||||||||||||||||
| Estimated additional charges within one year | ||||||||||||||||||
| Cash charges | $ | 3.0 | $ | — | $ | 7.8 | $ | 1.9 | $ | 12.7 | ||||||||
| Estimated additional charges beyond one year | ||||||||||||||||||
| Cash charges | $ | — | $ | — | $ | 13.1 | $ | 4.6 | $ | 17.7 | ||||||||
As of June 30, 2005 and December 31, 2004, we had reserves for restructuring and plant closing costs of $75.3 million and $106.6 million, respectively. During the six months ended June 30, 2005, we recorded additional net charges of $25.5 million consisting of $25.4 million payable in cash and $0.1 million of non-cash charges, for workforce reductions, demolition and decommissioning and other restructuring costs associated with closure or curtailment of activities at our smaller, less efficient manufacturing facilities. During the first six months of 2005, we made cash payments against these reserves of $49.7 million.
As of December 31, 2004, our Polyurethanes segment reserve consisted of $19.0 million related to various restructuring programs, including the closure of our West Deptford, New Jersey site (as announced in 2004), restructuring activities at our Rozenburg, Netherlands site (as announced in 2003), workforce reductions throughout our Polyurethanes segment (as announced in 2003), and the closure of our Shepton Mallet, U.K. site (as announced in 2002). During the six months ended June 30, 2005, our Polyurethanes segment recorded restructuring charges of $4.4 million related to these activities which was payable in cash, recorded a non-cash credit of $0.3 million to reverse reserves no longer required and made cash payments of $7.4 million. These restructuring activities are expected to result in additional restructuring charges of approximately $3 million. During the six months ended June 30, 2004 our Polyurethanes segment recorded restructuring charges of $22.9 million.
As of December 31, 2004, our Performance Products segment reserve consisted of $50.5 million related to various restructuring programs across our European surfactants business, including the closure of substantially all of our Whitehaven, U.K. surfactants facility. These restructuring activities are not expected to result in additional restructuring charges. During the six months ended June 30, 2005, our Performance Products segment recorded a non-cash restructuring charge of $0.4 million, a credit of $0.4 million to reverse reserves no longer required and made cash payments of $13.3 million. During the six months ended June 30, 2004, our Performance products segment recorded restructuring charges of $0.4 million.
As of December 31, 2004, our Pigments segment reserve consisted of $22.0 million related to its global workforce reductions announced in 2003 and the reduction of its titanium dioxide ("TiO2") production capacity announced in 2004. During the six months ended June 30, 2005, our Pigments
54
segment recorded restructuring charges of $17.3 million related to these restructuring activities, $14.3 million of which was payable in cash, and made cash payments of $18.2 million. These restructuring activities are expected to result in additional restructuring charges of approximately $17 million through 2006. During July 2005, our Pigments and Base Chemicals segments announced that they would establish a single U.K. headquarters in Teesside, U.K. This will result in the closure of our Pigment segment's Billingham, U.K. headquarters and the creation of a new support center for both businesses. This restructuring activity is expected to result in additional restructuring charges of approximately $8 million, approximately $4 million of which will be incurred by the Pigments segment and approximately $4 million by the Base Chemicals segment. During the six months ended June 30, 2004, our Pigments segment recorded restructuring charges of $108.1 million.
As of December 31, 2004, our Base Chemicals segment reserve consisted of $15.1 million related primarily to workforce reductions arising from the announced change in work shift schedules and in the engineering and support functions at our Wilton and North Tees, U.K. facilities. During the six months ended June 30, 2005, our Base Chemicals segment recorded restructuring charges of $4.1 million, all of which was payable in cash, and made cash payments of $10.8 million. These restructuring activities are expected to result in additional restructuring charges of approximately $2 million through 2006.
Capital Expenditures
During 2005, we expect to spend approximately $275 million on capital projects, including capital expenditures of approximately $50 million on our LDPE facility at Wilton, U.K., and approximately $62 million in capital expenditures associated with our Consolidated Chinese Splitting JV.
Of the $62 million of capital expenditures expected in our Consolidated Chinese Splitting JV, we have funded approximately $8.3 million as equity and the remaining funding of the Consolidated Chinese Splitting JV's capital expenditures will be financed through equity investments by the other joint venture partners and loans from local Chinese lenders. During 2005, we expect to invest, as equity, approximately $8 million in the Unconsolidated Chinese Manufacturing JV (all of which was invested in the six months ended June 30, 2005). We expect that our total equity investment in the Chinese MDI joint ventures will be approximately $85 million, of which approximately $42 million will be in the Unconsolidated Chinese Manufacturing JV and approximately $43 million in the Consolidated Chinese Splitting JV. We expect that the total project capital expenditures by the Consolidated Chinese Splitting JV will be approximately $125 million, of which approximately $43 million will be funded from our equity investment and the remainder from equity investments by joint venture partners and loans from local Chinese lenders. We expect completion of our spending on the Chinese MDI joint ventures in 2006. Our Chinese MDI joint ventures are unrestricted subsidiaries under the HI Credit Facilities and under the indentures governing the HI Senior Notes and the HI Subordinated Notes.
We believe that the cost position of our Wilton, U.K. olefins facility uniquely positions it to be the site of a polyethylene production facility. While we export approximately one-third of our ethylene production each year to continental Europe, incurring significant shipping and handling costs, the U.K. annually imports approximately 1.9 billion pounds of polyethylene. We believe this provides an opportunity to capitalize on the low-cost operating environment and extensive petrochemical infrastructure and logistics at Wilton, as supported by a feasibility study that was conducted with respect to the construction of a world-scale LDPE facility at our Wilton site. The LDPE facility will have the capacity to produce approximately 900 million pounds of LDPE annually and is estimated to cost $300 million to construct, net of any grant proceeds obtained. We have been awarded a grant of £16.5 million (approximately $30 million) from the U.K. Government's Department of Trade and Industry to finance a portion of the construction of the LDPE facility. We expect construction of the LDPE facility to be complete in late 2007. During 2005, we expect to spend approximately $50 million in capital expenditures associated with the LDPE facility at Wilton, U.K.
55
We expect to finance our capital expenditure commitments through a combination of our financing arrangements and cash flow from operations.
Capital expenditures for the six months ended June 30, 2005 were $83.1 million compared to $60.4 million for the same period in 2004. In the six months ended June 30, 2005, we spent approximately $11.2 million to fund investments in unconsolidated affiliates as compared to $11.8 million in the same period of 2004. In connection with our agreements with our Rubicon and Louisiana Pigment joint ventures, we are obligated to fund our proportionate share of capital expenditures. During the six months ended June 30, 2004 we invested $1.2 million in Rubicon.
With respect to Louisiana Pigment, during the six months ended June 30, 2005 and 2004, we received $0.7 million and $8.3 million, respectively, of distributions.
Environmental, Health and Safety Matters
General
We are subject to extensive federal, state, local and foreign laws, regulations, rules and ordinances relating to pollution, protection of the environment, and the generation, storage, handling, transportation, treatment, disposal, and remediation of hazardous substances and waste materials. In the ordinary course of business, we are subject to frequent environmental inspections and monitoring and occasional investigations by governmental enforcement authorities. In addition, our production facilities require operating permits that are subject to renewal, modification and, in certain circumstances, revocation. Actual or alleged violations of environmental laws or permit requirements could result in restrictions or prohibitions on plant operations, substantial civil or criminal sanctions, as well as, under some environmental laws, the assessment of strict liability and/or joint and several liability. Moreover, changes in environmental regulations could inhibit or interrupt our operations, or require us to modify our facilities or operations. Accordingly, environmental or regulatory matters may cause us to incur significant unanticipated losses, costs or liabilities.
Environmental, Health and Safety Systems
We are committed to achieving and maintaining compliance with all applicable environmental, health, and safety ("EHS") legal requirements, and we have developed policies and management systems that are intended to identify the multitude of EHS legal requirements applicable to our operations, enhance compliance with applicable legal requirements, ensure the safety of our employees, contractors, community neighbors, and customers and minimize the production and emission of wastes and other pollutants. Although EHS legal requirements are constantly changing and are frequently difficult to comply with, these EHS management systems are designed to assist us in our compliance goals while also fostering efficiency and improvement and minimizing overall risk to us.
EHS Capital Expenditures
We may incur future costs for capital improvements and general compliance under EHS laws, including costs to acquire, maintain and repair pollution control equipment. For the six months ended June 30, 2005 and 2004, our capital expenditures for EHS matters totaled $8.8 million and $9.8 million, respectively. Since capital expenditures for these matters are subject to evolving regulatory requirements and depend, in part, on the timing, promulgation and enforcement of specific requirements, we cannot provide assurance that our recent expenditures will be indicative of future amounts required under EHS laws.
56
Governmental Enforcement Proceedings
On occasion, we receive notices of violation, enforcement and other complaints from regulatory agencies alleging non-compliance with applicable EHS law. By way of example, we are aware of the individual matters set out below, which we believe to be the most significant presently pending matters and unasserted claims. Although we may incur costs or penalties in connection with the governmental proceedings discussed below, based on currently available information and our past experience, we believe that the ultimate resolution of these matters will not have a material impact on our results of operations, financial position, or liquidity.
In the third quarter of 2004, our Jefferson County, Texas facilities received notification from the Texas Commission on Environmental Quality ("TCEQ") of potential air emission violations relating to the operation of cooling towers at three of our plants and alleged upset air emissions. TCEQ proposed penalties of $0.2 million for the alleged upset violations and $0.1 million for the alleged cooling tower violations. Negotiations are anticipated between us and TCEQ with respect to the resolution of these alleged violations. We do not believe that the resolution of these matters will have a material adverse impact on our results of operations, financial position or liquidity.
Remediation Liabilities
We have incurred, and we may in the future incur, liability to investigate and clean up waste or contamination at our current or former facilities, or facilities operated by third parties at which we may have disposed of waste or other materials. Similarly, we may incur costs for the cleanup of wastes that were disposed of prior to the purchase of our businesses. Under some circumstances, the scope of our liability may extend to damages to natural resources. Specifically, under the U.S. Comprehensive Environmental Response, Compensation and Liability Act of 1980, as amended ("CERCLA"), and similar state laws, a current or former owner or operator of real property may be liable for remediation costs regardless of whether the release or disposal of hazardous substances was in compliance with law at the time it occurred, and a current owner or operator may be liable regardless of whether it owned or operated the facility at the time of the release. In addition, under the U.S. Resource Conservation and Recovery Act of 1976, as amended ("RCRA"), and similar state laws, we may be required to remediate contamination originating from our properties as a condition to our hazardous waste permit. In many cases, our potential liability arising from historical contamination is based on operations and other events occurring prior to our ownership of the relevant facility. In these situations, we frequently obtained an indemnity agreement from the prior owner addressing remediation liabilities arising from pre-closing conditions. We have successfully exercised our rights under these contractual covenants for a number of sites, and where applicable, mitigated our ultimate remediation liability. We cannot assure you, however, that all of such matters will be subject to indemnity or that our existing indemnities will be sufficient to cover our liabilities for such matters.
Environmental Reserves
We have established financial reserves relating to anticipated environmental cleanup obligations, site reclamation and closure costs and known penalties. Liabilities are recorded when potential liabilities are either known or considered probable and can be reasonably estimated. Our liability estimates are based upon available facts, existing technology, and past experience. On a consolidated basis, we have accrued approximately $18.6 million and $21.2 million for environmental liabilities as of June 30, 2005 and December 31, 2004, respectively. Of these amounts, approximately $6.6 million and $5.7 million are classified as accrued liabilities on our condensed consolidated balance sheets as of June 30, 2005 and December 31, 2004, respectively, and approximately $12.0 million and $15.5 million are classified as other noncurrent liabilities on our condensed consolidated balance sheets as of June 30, 2005 and December 31, 2004, respectively. In certain cases, our remediation liabilities are
57
payable over periods of up to 30 years. We may incur losses for environmental remediation in excess of the amounts accrued; however, we are not able to estimate the maximum amount of such losses.
Regulatory Developments
Under the European Union ("EU") Integrated Pollution Prevention and Control Directive ("IPPC"), EU member governments are to adopt rules and implement a cross-media (air, water and waste) environmental permitting program for individual facilities. While the EU countries are at varying stages in their respective implementation of the IPPC permit program, we have submitted all necessary IPPC permit applications required to date, and in some cases received completed permits from the applicable government agency. We expect to submit all other IPPC applications and related documents on a timely basis as the various countries implement the IPPC permit program. Although we do not know with certainty what each IPPC permit will require, we believe, based upon our experience with the permits received to date, that the costs of compliance with the IPPC permit program will not be material to our results of operations, financial position or liquidity.
In October 2003, the European Commission adopted a proposal for a new EU regulatory framework for chemicals. Under this proposed new system called "REACH" (Registration, Evaluation and Authorization of Chemicals), companies that manufacture or import more than one ton of a chemical substance per year would be required to register such manufacture or import in a central database. The REACH initiative, as proposed, would require risk assessment of chemicals, preparations (e.g., soaps and paints) and articles (e.g., consumer products) before those materials could be manufactured or imported into EU countries. Where warranted by a risk assessment, hazardous substances would require authorizations for their use. This regulation could impose risk control strategies that would require capital expenditures by us. As proposed, REACH would take effect in three primary stages over the eleven years following the final effective date (assuming final approval). The impacts of REACH on the chemical industry and on us are unclear at this time because the parameters of the program are still being actively debated.
MTBE Developments
We currently market approximately 95% of our MTBE to customers located in the U.S. for use as a gasoline additive. The presence of MTBE in some groundwater supplies in California and other U.S. states (primarily due to gasoline leaking from underground storage tanks) and in surface water (primarily from recreational watercraft) has led to public concern about MTBE's potential to contaminate drinking water supplies. Heightened public awareness regarding this issue has resulted in state, federal and foreign initiatives to rescind the federal oxygenate requirements for reformulated gasoline or restrict or prohibit the use of MTBE in particular. For example, California, New York and Connecticut have adopted rules that prohibit the use of MTBE in gasoline sold in those states. Overall, states that have taken some action to prohibit or restrict the use of MTBE in gasoline account for a substantial portion of the "pre-ban" U.S. MTBE market. Thus far, attempts by others to challenge these state bans in federal court under the reformulated gasoline provisions of the federal Clean Air Act have been unsuccessful.
In August 2005, the Energy Policy Act of 2005 was signed into law. The new law will likely have an adverse impact on our MTBE business in the U.S., although a full evaluation of the law's provisions is underway and the extent of potential impacts, if any, is unclear. The new legislation mandates increased use of renewable fuels and eliminates the oxygenate requirement for reformulated gasoline established by the 1990 Clean Air Act Amendments, and the combination of these two provisions could substantially reduce the market for MTBE in the U.S. However, unlike previously proposed federal legislation, the new law does not purport to ban the use of MTBE as a motor vehicle fuel additive. Thus, we do not believe it will prevent us from either manufacturing MTBE in our plants or offering MTBE for sale in the U.S. A significant reduction in demand for our MTBE could result in a material
58
loss in revenues or material costs or expenditures. As an alternative to selling our MTBE in the U.S., we believe we will be able to export MTBE to Europe, Asia or Latin America, although this may produce a lower level of cash flow than the sale of MTBE in the U.S. We may also elect to use all or a portion of our precursor TBA to produce saleable products other than MTBE. If we opt to produce products other than MTBE, necessary modifications to our facilities may require significant capital expenditures and the sale of the other products may produce a materially lower level of cash flow than the sale of MTBE.
In September 2002, the EU issued a final risk assessment report on MTBE. No ban of MTBE was recommended for Europe, although several risk reduction measures relating to storage and handling of MTBE-containing fuel were recommended.
A number of lawsuits have been filed, primarily against gasoline manufacturers, marketers and distributors, by persons seeking to recover damages allegedly arising from the presence of MTBE in groundwater. We have not been named as a defendant in any litigation concerning the environmental effects of MTBE. However, we cannot provide assurances that we will not be involved in any such litigation or that such litigation will not have a material adverse effect on our results of operations, financial position or liquidity.
Recently Issued Accounting Pronouncements
In January 2003, the Financial Accounting Standards Board ("FASB") issued Financial Interpretation No. ("FIN") 46, "Consolidation of Variable Interest Entities." FIN 46 addresses the requirements for business enterprises to consolidate related entities, for which they do not have controlling interests through voting or other rights, if they are determined to be the primary beneficiary as a result of variable economic interests. Transfers to a qualifying special purpose entity are not subject to this interpretation. In December 2003, the FASB issued a replacement of FIN 46 (FIN 46R) to clarify certain complexities. We were required to adopt this financial interpretation on January 1, 2005. The adoption of the standard required us to consolidate our Rubicon Inc. joint venture. See "Item 1. Notes to Condensed Consolidated Financial Statements (Unaudited)—Notes 5—Investment in Unconsolidated Affiliates."
In November 2004, the FASB issued Statement of Financial Accounting Standards ("SFAS") No. 151, "Inventory Costs—an amendment of ARB No. 43." SFAS No. 151 requires abnormal amounts of idle facility expense, freight, handling costs, and wasted material to be recognized as current-period charges. It also requires that allocation of fixed production overhead to the costs of conversion be based on the normal capacity of the production facilities. The requirements of the standard will be effective for inventory costs incurred during fiscal years beginning after June 15, 2005. We are reviewing SFAS No. 151 to determine the statement's impact on our consolidated financial statements.
In December 2004, the FASB issued SFAS No. 153, "Exchanges of Nonmonetary Assets—an amendment of APB Opinion No. 29." SFAS No. 153 addresses the measurement of exchanges of nonmonetary assets and eliminates the exception from fair value measurement for nonmonetary exchanges of similar productive assets in APB Opinion No. 29 and replaces it with an exception for exchanges that do not have commercial substance. SFAS No. 153 specifies that a nonmonetary exchange has commercial substance if the future cash flows of the entity are expected to change significantly as a result of the exchange. The provisions of this standard are effective for nonmonetary exchanges occurring in fiscal periods beginning after June 15, 2005. We will apply this standard prospectively.
In December 2004, the FASB issued SFAS No. 123R, "Share Based Payment." SFAS No. 123R requires entities to measure the cost of employee services received in exchange for an award of equity instruments based on the grant-date fair value of the award. That cost will be recognized over the period during which the employee is required to provide services in exchange for the award. This
59
standard eliminates the alternative to use the intrinsic value method of accounting for share-based payments as previously provided in APB Opinion No. 25, "Accounting for Stock Issued to Employees." We adopted SFAS No. 123R effective January 1, 2005, and have applied this standard prospectively to share-based awards issued to our employees in connection with Huntsman Corporation's initial public offering. In connection with Huntsman Corporation's initial public offering of common stock on February 16, 2005, certain of our employees received Huntsman Corporation stock options and restricted stock. Accordingly, we were allocated share-based compensation expense of $0.5 million and $0.7 million during the three and six months ended June 30, 2005, respectively. We did not have share-based awards prior to the awards issued in connection with Huntsman Corporation's initial public offering.
In March 2005, the FASB issued FIN 47, "Accounting for Conditional Asset Retirement Obligations." FIN 47 clarifies the term conditional asset retirement obligation used in SFAS No. 143, "Accounting for Asset Retirement Obligations," and clarifies when an entity would have sufficient information to reasonably estimate the fair value of an asset retirement obligation. FIN 47 is effective no later than the end of December 2005. We are reviewing FIN 47 to determine its impact on our financial statements.
In March 2005, the Emerging Issues Task Force issued a preliminary consensus on issue 04-13, "Accounting for Purchase and Sales of Inventory with the Same Counterparty," that, if ratified by the FASB, would require companies to recognize an exchange of finished goods for raw materials or work-in-process within the same line of business at fair value. All other exchanges of inventory would be reflected at the recorded amount. We are evaluating the impact of this preliminary consensus to determine its impact on our results of operations.
In May 2005, the FASB issued SFAS No. 154, "Accounting Changes and Error Corrections—a replacement of APB Opinion No. 20 and FASB Statement No. 3" SFAS No. 154 requires retrospective application to prior periods' financial statements of changes in accounting principle, unless it is impracticable to determine either the period-specific effects or the cumulative effect of the change or unless specific transition provisions are proscribed in the accounting pronouncements. SFAS No. 154 does not change the accounting guidance for reporting a correction of an error in previously issued financial statements or a change in accounting estimate. SFAS No. 154 is effective for accounting changes and error corrections made after December 31, 2005. We will apply this standard prospectively.
Critical Accounting Policies
There have been no changes in the six months ended June 30, 2005 with respect to our critical accounting policies as presented in Management's Discussion and Analysis of Financial Condition and Results of Operations for the year ended December 31, 2004 included in our 2004 Annual Report on Form 10-K.
Cautionary Statement for Forward-Looking Information
Certain information set forth in this report contains "forward-looking statements" within the meaning of the federal securities laws. Forward-looking statements include statements concerning our plans, objectives, goals, strategies, future events, future revenues or performance, capital expenditures, financing needs, plans or intentions relating to acquisitions and other information that is not historical information. In some cases, forward-looking statements can be identified by terminology such as "believes," "expects," "may," "will," "should," "anticipates," or "intends" or the negative of such terms or other comparable terminology, or by discussions of strategy. We may also make additional forward-looking statements from time to time. All such subsequent forward-looking statements, whether written or oral, by us or on our behalf, are also expressly qualified by these cautionary statements.
60
All forward-looking statements, including without limitation, management's examination of historical operating trends, are based upon our current expectations and various assumptions. Our expectations, beliefs and projections are expressed in good faith and we believe there is a reasonable basis for them, but, there can be no assurance that management's expectations, beliefs and projections will result or be achieved. All forward-looking statements apply only as of the date made. We undertake no obligation to publicly update or revise forward-looking statements which may be made to reflect events or circumstances after the date made or to reflect the occurrence of unanticipated events.
There are a number of risks and uncertainties, including those discussed elsewhere in this report, that could cause our actual results to differ materially from the forward-looking statements contained in or contemplated by this report. Any forward-looking statements should be considered in light of all such factors and the risks specified in our Annual Report on Form 10-K.
ITEM 3. QUANTITATIVE AND QUALITATIVE DISCLOSURES ABOUT MARKET RISK
We are exposed to market risk, including changes in currency exchange rates, interest rates and certain commodity prices. To manage the volatility relating to these exposures, from time to time, we enter into various derivative transactions. We hold and issue derivative financial instruments for economic hedging purposes only.
Currency Exchange Rates
Our cash flows and earnings are subject to fluctuations due to exchange rate variation. Our sales prices are typically denominated in euros or U.S. dollars. From time to time, we may enter into foreign currency derivative instruments to minimize the short-term impact of movements in foreign currency rates. Short-term exposures to changing foreign currency exchange rates at certain foreign subsidiaries are generally netted where practicable with exposures of other subsidiaries and the remaining exposures then, from time to time, may be managed through financial market transactions, principally through the purchase of spot or forward foreign exchange contracts (with maturities of nine months or less) with various financial institutions, to reflect the currency denomination of our cash flows. We do not hedge our currency exposures in a manner that would entirely eliminate the effect of changes in exchange rates on our cash flows and earnings. Our hedging activity from time to time comprises selling forward surpluses of non-dollar receivables for U.S. dollars. In addition, our accounts receivable securitization program requires in certain circumstances that we enter into certain forward foreign currency hedges intended to hedge currency exposures on the collateral supporting the off-balance sheet debt issued in the program. As of June 30, 2005, we had no outstanding forward foreign exchange contracts.
On December 10, 2004, we entered into a cross currency interest rate swap of fixed rate debt with several financial institutions in order to more effectively hedge our overall underlying euro long-term net asset and euro cash flow exposures. In this transaction, we agreed to swap $175 million of approximately 7.4% fixed rate debt for €132.4 million of approximately 6.6% fixed rate debt. As a result, we will pay fixed rate interest at an annual rate of approximately 6.6% on €132.4 million of principal and will receive fixed rate interest at an annual rate of approximately 7.4% on $175 million of principal through January 1, 2010. At maturity on January 1, 2010, we are required to pay principal of €132.4 million and will receive principal of $175 million. Interest installments are paid semiannually on January 1 and July 1 of each year beginning July 1, 2005 through maturity. The swap is classified as a net investment hedge under US GAAP.
We finance certain of our non-U.S. subsidiaries with intercompany loans. In some cases, these loans are denominated in currencies other than the subsidiaries' functional currency. Foreign currency transaction gains and losses on intercompany loans that are expected to be repaid in the foreseeable future are recorded in earnings. Foreign currency transaction gains and losses on intercompany loans that are not expected to be repaid in the foreseeable future ("Permanent Loans") are recorded in
61
other comprehensive income. As a result of our review of certain of our intercompany loans in the first quarter of 2005, we have increased the amount of our Permanent Loans. In addition, during the six months ended June 30, 2005, we dedesignated €372 million of euro-denominated debt as a net investment hedge resulting in approximately $40 million less foreign currency losses during the six months ended June 30, 2005.
Interest Rates
As of June 30, 2005, the estimated fair value of our consolidated debt was approximately $2.8 billion, and the weighted average interest rate of our combined borrowings was approximately 7.8%. As of June 30, 2005, we had combined outstanding variable rate borrowings of approximately $1.2 billion. The weighted average interest rate of these borrowings was approximately 5.5%. Assuming a 1.0% increase in interest rates, the effect on the annual interest expense would be an increase of approximately $12 million.
Commodity Prices
Our exposure to changing commodity prices is somewhat limited since the majority of our raw materials are acquired at posted or market related prices, and sales prices for finished products are generally at market related prices which are largely set on a monthly or quarterly basis in line with industry practice. In order to reduce overall raw material cost volatility, from time to time we enter into various commodity contracts to hedge our purchase of commodity products. We do not hedge our commodity exposure in a manner that would eliminate the effects of changes in commodity prices on our cash flows and earnings. At June 30, 2005, we had in place forward purchase and sales contracts for 35,000 tonnes of naphtha and other hydrocarbons, which do not qualify for hedge accounting. Assuming a 10% increase or a 10% decrease in the price per tonne of naphtha, the impact on the forward purchase contracts would result in losses or gains of approximately $0.1 million, respectively.
ITEM 4. CONTROLS AND PROCEDURES
Our management, with the participation of our chief executive officer and chief financial officer, has evaluated the effectiveness of our disclosure controls and procedures (as defined in Rules 13a-15(e) and 15d-15(e) under the Securities Exchange Act of 1934 (the "Exchange Act")) as of June 30, 2005. Based on this evaluation, our chief executive officer and chief financial officer have concluded that, as of June 30, 2005, our disclosure controls and procedures were effective, in that they ensure that information required to be disclosed by us in the reports that we file or submit under the Exchange Act is (1) recorded, processed, summarized and reported within the time periods specified in the Commission's rules and forms, and (2) accumulated and communicated to our management, including our chief executive officer and chief financial officer, as appropriate to allow timely decisions regarding required disclosure.
No changes to our internal control over financial reporting occurred during the three months ended June 30, 2005 that have materially affected, or are reasonably likely to materially affect, our internal control over financial reporting (as defined in Rules 13a-15(f) and 15d-15(f) under the Exchange Act). Huntsman Corporation and its subsidiaries, including our Company, have engaged Ernst & Young LLP to assist management in its evaluation of our internal controls in preparation for the periodic management evaluations and annual auditor attestation reports regarding the effectiveness of our "internal control over financial reporting" that will be required when the SEC's rules under Section 404 of the Sarbanes-Oxley Act of 2002 become applicable to us beginning with our Annual Report on Form 10-K for the year ending December 31, 2006 to be filed in the first quarter of 2007. We cannot give any assurance, however, that our internal controls will be effective when Section 404 becomes applicable to us. Ineffective internal controls could cause investors to lose confidence in our reported financial information and could result in a lower trading price for our securities.
62
Certain claims have been filed against us relating to discoloration of unplasticized polyvinyl chloride products allegedly caused by our titanium dioxide ("Discoloration Claims"). Substantially all of the titanium dioxide that is the subject of these claims was manufactured prior to our acquisition of our titanium dioxide business from ICI in 1999. Net of amounts we have received from insurers and pursuant to contracts of indemnity, we have paid approximately $15.8 million in costs and settlement amounts for Discoloration Claims as of June 30, 2005.
The following table presents information about the number of Discoloration Claims for the period indicated. Claims include all claims for which service has been received by us, and each such claim represents a plaintiff who is pursuing a claim against us.
| |
Six months ended June 30, 2005 |
|
|---|---|---|
| Claims filed during period | 0 | |
| Claims resolved during period | 1 | |
| Claims unresolved at end of period | 2 |
In March 2005, one of the Discoloration Claims that was unresolved as of December 31, 2004 was amended to assert additional damages of approximately $52.2 million. During the six months ended June 30, 2005, we settled a claim for approximately $0.9 million, all of which is indemnified and for which we are currently seeking reimbursement. The two Discoloration Claims unresolved as of June 30, 2005 asserted aggregate damages of approximately $52.2 million. A liability has been accrued for these claims. Based on our understanding of the merits of these claims and our rights under contracts of indemnity and insurance, we do not believe that the net impact on our financial condition, results of operations or liquidity will be material.
While additional Discoloration Claims may be made in the future, we cannot reasonably estimate the amount of loss related to such claims. Although we may incur additional costs as a result of future claims (including settlement costs), based on our history with Discoloration Claims to date, the fact that substantially all of the titanium dioxide that has been the subject of these Discoloration Claims was manufactured and sold more than five years ago, and the fact that we have rights under contract to indemnity, including from ICI, we do not believe that any unasserted possible Discoloration Claims, if any, will have a material impact on our financial condition, results of operations, or liquidity. Based on this conclusion and our inability to reasonably estimate our expected costs with respect to these unasserted possible claims, we have made no accruals in our financial statements as of June 30, 2005 for costs associated with unasserted possible Discoloration Claims, if any.
Certain insurers have denied coverage with respect to certain Discoloration Claims. We brought suit against these insurers to recover the amounts we believe are due to us. The court found in favor of the insurers. That decision was appealed to the Court of Appeal, which also found in favor of the insurers. We intend to apply for leave to appeal to the House of Lords.
We are a party to various other proceedings instituted by private plaintiffs, governmental authorities, and others arising under provisions of applicable laws, including various environmental, products liability, and other laws. Except as otherwise disclosed in this report, we do not believe that the outcome of any of these matters will have a material adverse effect on our financial condition, results of operations or liquidity. See "Part I Financial Information, Item 1. Notes to Condensed Consolidated Financial Statements (Unaudited)." Note 17—Environmental, Health and Safety Matters."
63
ITEM 4. SUBMISSION OF MATTERS TO A VOTE OF SECURITY HOLDERS
On May 9, 2005, by written consent in lieu of a special meeting, our sole member elected J. Kimo Esplin and Samuel D. Scruggs as members of our board of managers.
| 31.1 | Certification of Chief Executive Officer pursuant to Section 302 of the Sarbanes-Oxley Act of 2002 | |
31.2 |
Certification of Chief Financial Officer pursuant to Section 302 of the Sarbanes-Oxley Act of 2002 |
|
32.1 |
Certification of Chief Executive Officer pursuant to Section 906 of the Sarbanes-Oxley Act of 2002 |
|
32.2 |
Certification of Chief Financial Officer pursuant to Section 906 of the Sarbanes-Oxley Act of 2002 |
64
Pursuant to the requirements of the Securities Exchange Act of 1934, the Registrant has duly caused this report to be signed on its behalf by the undersigned thereunto duly authorized.
Dated: August 10, 2005
| HUNTSMAN INTERNATIONAL LLC | |||
By: |
/s/ J. KIMO ESPLIN J. Kimo Esplin Executive Vice President and Chief Financial Officer (Authorized Signatory and Principal Financial Officer) |
||
By: |
/s/ L. RUSSELL HEALY L. Russell Healy Vice President and Controller (Authorized Signatory and Principal Accounting Officer) |
||
65
| Number |
Description |
|
|---|---|---|
| 31.1 | Certification of Chief Executive Officer pursuant to Section 302 of the Sarbanes-Oxley Act of 2002 | |
31.2 |
Certification of Chief Financial Officer pursuant to Section 302 of the Sarbanes-Oxley Act of 2002 |
|
32.1 |
Certification of Chief Executive Officer pursuant to Section 906 of the Sarbanes-Oxley Act of 2002 |
|
32.2 |
Certification of Chief Financial Officer pursuant to Section 906 of the Sarbanes-Oxley Act of 2002 |