UNITED STATES
SECURITIES AND EXCHANGE COMMISSION
WASHINGTON, D.C. 20549
Form 10-K
| (Mark One) | ||
ý |
ANNUAL REPORT PURSUANT TO SECTION 13 OR 15(d) OF THE SECURITIES EXCHANGE ACT OF 1934 FOR THE FISCAL YEAR ENDED DECEMBER 31, 2008 |
|
OR |
||
o |
TRANSITION REPORT PURSUANT TO SECTION 13 OR 15(d) OF THE SECURITIES EXCHANGE ACT OF 1934 |
|
| Commission File Number |
Exact Name of Registrant as Specified in its Charter, Principal Office Address and Telephone Number |
State of Incorporation/Organization |
I.R.S. Employer Identification No. | |||||||
|---|---|---|---|---|---|---|---|---|---|---|
| 001-32427 | Huntsman Corporation 500 Huntsman Way Salt Lake City, Utah 84108 (801) 584-5700 |
Delaware | 42-1648585 | |||||||
333-85141 |
Huntsman International LLC 500 Huntsman Way Salt Lake City, Utah 84108 (801) 584-5700 |
Delaware |
87-0630358 |
|||||||
Securities registered pursuant to Section 12(b) of the Exchange Act:
Registrant
|
Title of each class | Name of each exchange on which registered | ||
|---|---|---|---|---|
| Huntsman Corporation | Common Stock, par value $0.01 per share | New York Stock Exchange | ||
| Huntsman International LLC | None | None |
Securities registered pursuant to Section 12(g) of the Exchange Act:
Registrant
|
Title of each class | |||
|---|---|---|---|---|
| Huntsman Corporation | None | |||
| Huntsman International LLC | None | |||
Indicate by check mark if the registrant is a well-known seasoned issuer, as defined in Rule 405 of the Securities Act.
| Huntsman Corporation | YES o | NO ý | ||
| Huntsman International LLC | YES o | NO ý |
Indicate by check mark if the registrant is not required to file reports pursuant to Section 13 or Section 15(d) of the Exchange Act.
| Huntsman Corporation | YES o | NO ý | ||
| Huntsman International LLC | YES o | NO ý |
Indicate by check mark whether the registrant: (1) has filed all reports required to be filed by Section 13 or 15(d) of the Exchange Act during the preceding 12 months (or for such shorter period that the registrant was required to file such reports) and (2) has been subject to such filing requirements for the past 90 days.
| Huntsman Corporation | YES ý | NO o | ||
| Huntsman International LLC | YES ý | NO o |
Indicate by check mark if disclosure of delinquent filers pursuant to Item 405 of Regulation S-K is not contained herein, and will not be contained, to the best of the registrants' knowledge, in definitive proxy or information statements incorporated by reference in Part III of this Form 10-K or any amendment to this Form 10-K. ý
Indicate by check mark whether the registrant is a large accelerated filer, an accelerated filer, a non-accelerated filer, or a smaller reporting company. See the definitions of "large accelerated filer," "accelerated filer," and "smaller reporting company" in Rule 12b-2 of the Exchange Act.
| Huntsman Corporation | Large accelerated filer ý | Accelerated filer o | Non-accelerated filer o | |||
| Huntsman International LLC | Large accelerated filer o | Accelerated filer o | Non-accelerated filer ý |
Indicate by check mark whether the registrant is a shell company (as defined in Rule 12b-2 of the Exchange Act).
| Huntsman Corporation | YES o | NO ý | ||
| Huntsman International LLC | YES o | NO ý |
On June 30, 2008, the last business day of the registrants' most recently completed second fiscal quarter, the aggregate market value of voting and non-voting common equity held by nonaffiliates was as follows:
Registrant
|
Common Equity | Market Value Held by Nonaffiliates | ||||
|---|---|---|---|---|---|---|
| Huntsman Corporation | Common Stock | $ | 1,857,576,135 | (1) | ||
| Huntsman International LLC | Units of Membership Interest | $ | 0 | (2) | ||
On February 13, 2009, the number of shares outstanding of each of the registrant's classes of common equity were as follows:
Registrant
|
Common Equity | Outstanding | ||||
|---|---|---|---|---|---|---|
| Huntsman Corporation | Common Stock | 234,430,334 | ||||
| Huntsman International LLC | Units of Membership Interest | 2,728 | ||||
This Annual Report on Form 10-K presents information for two registrants: Huntsman Corporation and Huntsman International LLC. Huntsman International LLC is a wholly owned subsidiary of Huntsman Corporation and is the principal operating company of Huntsman Corporation. The information reflected in this Annual Report on Form 10-K is equally applicable to both Huntsman Corporation and Huntsman International LLC, except where otherwise indicated.
Huntsman International LLC meets the conditions set forth in General Instructions (I)(1)(a) and (b) of Form 10-K and, to the extent applicable, is therefore filing this form with a reduced disclosure format.
Documents Incorporated by Reference
Part III: Proxy Statement for the 2009 Annual Meeting of Stockholders or an amendment to this report to be filed within 120 days of
Huntsman Corporation's fiscal year ended December 31, 2008.
HUNTSMAN CORPORATION AND SUBSIDIARIES
HUNTSMAN INTERNATIONAL LLC AND SUBSIDIARIES
2008 ANNUAL REPORT ON FORM 10-K
TABLE OF CONTENTS
i
HUNTSMAN CORPORATION AND SUBSIDIARIES
HUNTSMAN INTERNATIONAL LLC AND SUBSIDIARIES
2008 ANNUAL REPORT ON FORM 10-K
Certain information set forth in this report contains "forward-looking statements" within the meaning of the federal securities laws. Forward-looking statements include statements concerning our plans, objectives, goals, strategies, future events, future revenues or performance, capital expenditures, financing needs, plans or intentions relating to acquisitions or dispositions and other information that is not historical information. In some cases, forward-looking statements can be identified by terminology such as "believes," "expects," "may," "will," "should," "anticipates" or "intends" or the negative of such terms or other comparable terminology, or by discussions of strategy. We may also make additional forward-looking statements from time to time. All such subsequent forward-looking statements, whether written or oral, by us or on our behalf, are also expressly qualified by these cautionary statements.
All forward-looking statements, including without limitation management's examination of historical operating trends, are based upon our current expectations and various assumptions. Our expectations, beliefs and projections are expressed in good faith and we believe there is a reasonable basis for them, but there can be no assurance that management's expectations, beliefs and projections will result or be achieved. All forward-looking statements apply only as of the date made. We undertake no obligation to publicly update or revise forward-looking statements which may be made to reflect events or circumstances after the date made or to reflect the occurrence of unanticipated events.
There are a number of risks and uncertainties that could cause our actual results to differ materially from the forward-looking statements contained in or contemplated by this report. Any forward-looking statements should be considered in light of the risks set forth in "Part I. Item 1A. Risk Factors" and elsewhere in this report.
This report includes information with respect to market share, industry conditions and forecasts that we obtained from internal industry research, publicly available information (including industry publications and surveys), and surveys and market research provided by consultants. The publicly available information and the reports, forecasts and other research provided by consultants generally state that the information contained therein has been obtained from sources believed to be reliable, but there can be no assurance as to the accuracy and completeness of such information. We have not independently verified any of the data from third-party sources, nor have we ascertained the underlying economic assumptions relied upon therein. Similarly, our internal research and forecasts are based upon our management's understanding of industry conditions, and such information has not been verified by any independent sources.
For convenience in this report, the terms "Company," "our," "us," or "we" may be used to refer to Huntsman Corporation and, unless the context otherwise requires, its subsidiaries and predecessors. Any references to our "Company," "we," "us" or "our" as of a date prior to October 19, 2004 (the date of our formation) are to Huntsman Holdings, LLC and its subsidiaries (including their respective predecessors). In this report, "Huntsman International" refers to Huntsman International LLC (our 100% owned subsidiary) and, unless the context otherwise requires, its subsidiaries; "HPS" refers to Huntsman Polyurethanes Shanghai Ltd. (our consolidated splitting joint venture with Shanghai Chlor-Alkali Chemical Company, Ltd); "SLIC" refers to Shanghai Liengheng Isocyanate Investment BV (our unconsolidated manufacturing joint venture with BASF AG and three Chinese chemical companies); "HMP Equity Trust" refers to HMP Equity Trust (the holder of approximately 20% of our common stock); and "Hexion" refers to Hexion Specialty Chemicals, Inc., an entity owned by an affiliate of Apollo Management, L.P. ("Apollo").
In this report, we may use, without definition, the common names of competitors or other industry participants. We may also use the common names or abbreviations for certain chemicals or products. Many of these terms are defined in the Glossary of Chemical Terms found at the conclusion of "Part I, Item 1. Business" below.
ii
GENERAL
Our Company, a Delaware corporation, was formed in 2004 to hold the Huntsman businesses. Jon M. Huntsman founded the predecessor to our Company in the early 1970s as a small packaging company. Since then, we have grown through a series of significant acquisitions and now own a global portfolio of businesses. In 2005, we completed an initial public stock offering.
In 2006 and 2007, we completed a series of transactions pursuant to which we have disposed of our former commodity chemicals businesses:
We operate all of our businesses through Huntsman International, our 100% owned subsidiary. Huntsman International is a Delaware limited liability company and was formed in 1999. Other than the $250 million 7% convertible senior notes discussed in "—Recent Developments—Sale of Notes in Connection with Settlement Agreement" below, substantially all of our debt obligations are obligations of Huntsman International and/or its subsidiaries.
Our principal executive offices are located at 500 Huntsman Way, Salt Lake City, Utah 84108, and our telephone number at that location is (801) 584-5700.
TERMINATION OF MERGER AGREEMENT AND SETTLEMENT OF RELATED LITIGATION
On July 12, 2007, we entered into an Agreement and Plan of Merger (the "Merger Agreement") with Hexion pursuant to which Hexion agreed to acquire all of our outstanding common stock for $28.00 per share (plus a ticking fee) in cash (the "Merger"). On June 18, 2008, Hexion, Apollo and certain of their affiliates filed an action for declaratory judgment against us in Delaware Chancery Court (the "Delaware Litigation"). On June 23, 2008, we sued Apollo and certain of its affiliates in the District Court of Montgomery County, Texas (the "Texas Apollo Litigation") alleging tortious interference with our previously executed merger agreement with Basell (the "Basell Merger Agreement"). On July 2, 2008, we countersued Hexion and Apollo in the Delaware Litigation seeking specific performance of the Merger Agreement and, alternatively, damages.
Following a six-day trial in the Delaware Chancery Court, Vice Chancellor Stephen P. Lamb issued an Opinion and an Order and Final Partial Judgment, ruling that, among other things, we had not suffered a material adverse effect in our business and that Hexion knowingly and intentionally breached numerous of its covenants under the Merger Agreement (as a result of which Hexion's liability for damages for failing to consummate the Merger would not be limited to the $325 million termination fee (the "Termination Fee") as provided in the Merger Agreement). Vice Chancellor Lamb ordered Hexion to specifically perform its covenants under the Merger Agreement, including its covenants to (i) use reasonable best efforts to consummate the Merger and financing provided under the
1
commitment letter provided to Hexion (the "Commitment Letter") by affiliates of Credit Suisse and Deutsche Bank A.G. (the "Lenders"), (ii) refrain from taking any further action that could reasonably be expected to materially impair, delay or prevent consummation of financing, and (iii) take all actions necessary to obtain antitrust approval for the Merger by October 2, 2008. A copy of Vice Chancellor Lamb's opinion and order are attached to our current report on Form 8-K filed on September 30, 2008.
On September 30, 2008, we filed suit in the 9th Judicial District Court in Montgomery County, Texas against the Lenders alleging, among other things, that the Lenders had conspired with Apollo to tortiously interfere with the Basell Merger Agreement (the "Texas Bank Litigation").
As a result of the Delaware Litigation, Hexion and our Company agreed to schedule the closing of the Merger Agreement for October 28, 2008. The Commitment Letter required that the Lenders be provided, at closing, with either (i) a solvency opinion of a reputable valuation firm, (ii) a solvency certificate signed by the chief financial officer of Hexion or (iii) a solvency certificate signed by our chief financial officer. This closing condition could be satisfied if any one of such opinions/certificates was delivered and was in a form customary for transactions involving portfolio companies of Apollo. On September 12, 2008, we announced that we had engaged a reputable valuation firm, American Appraisal Associates, Inc. ("American Appraisal"), to provide an opinion that the combined Hexion/Huntsman entity was solvent based on traditional solvency tests. On October 23, 2008, five days prior to the anticipated closing, American Appraisal provided us with a solvency opinion that the combined entity was solvent. On October 28, 2008, American Appraisal issued an additional opinion that the combined entity was solvent, and J. Kimo Esplin executed a certificate in his capacity as our chief financial officer that the combined entity was solvent.
Notwithstanding the opinions and certificate, very late on the evening of October 27, 2008, the Lenders sent a letter to Hexion stating that they did not believe that the solvency opinion and certificate proposed to be provided met the condition of the Commitment Letter and effectively said that, as a result, the Lenders would not fund the proposed closing of the Merger scheduled for October 28, 2008. Hexion sent the Lenders a reply letter disputing the Lenders' position and noting that both the American Appraisal opinion and the certificate of our chief financial officer were in forms customary for transactions involving Apollo portfolio companies. Because the Lenders continued to refuse to fund, Hexion brought suit against the Lenders in the Supreme Court of the State of New York, New York County on October 29, 2008 seeking specific performance of the Lenders' commitment under the Commitment Letter (the "New York Bank Litigation"). Hexion also sought an order temporarily restraining the Lenders from terminating the Commitment Letter. On October 31, 2008, the Court refused to grant Hexion a preliminary injunction preventing termination of the Commitment Letter. The Lenders have taken the position that the Commitment Letter expired by its terms on November 2, 2008.
On December 13, 2008, we sent notice to Hexion and Apollo that, pursuant to the terms of the Merger Agreement, we had terminated the Merger Agreement. Following the termination of the Merger Agreement, on December 14, 2008, we, together with certain of our affiliates, including Jon M. Huntsman and Peter R. Huntsman, entered into a Settlement Agreement and Release (the "Settlement Agreement") with Hexion, Hexion's chief executive officer Craig O. Morrison, and Apollo and certain of its affiliates.
Under the Settlement Agreement, upon full and final payment of all amounts due to us as described below, the parties agreed to take all necessary and appropriate action to obtain the dismissal with prejudice of (i) the Delaware Litigation, (ii) the Texas Apollo Litigation and (iii) Apollo and Hexion's lawsuit against us in New York. In addition, we agreed to promptly move to sever and dismiss Apollo from the Texas Bank Litigation and Hexion agreed to seek leave to withdraw its claims in the New York Bank Litigation. We also agreed to cooperate with Hexion and Apollo in a stockholder
2
action brought against them in New York by certain of our stockholders, and Hexion and Apollo have agreed to cooperate with us in the Texas Bank Litigation, including by causing certain individuals to testify at trial if we so request. The parties also agreed to release each other from all claims and actions they have or may have against each other, other than claims arising out of ordinary course business commercial dealings and certain other specified matters.
Pursuant to the Settlement Agreement, Hexion and certain Apollo affiliates have paid us an aggregate of $1 billion. Of the $1 billion, Apollo affiliates paid us $425 million in cash and purchased $250 million of our 7% convertible senior notes (the "Convertible Notes") in that principal amount (as described below). In addition, Hexion paid us the $325 million Termination Fee as required under the Merger Agreement. Apollo and certain of its affiliates and Hexion and certain of its affiliates are jointly and severally liable for the payment of the aggregate $1 billion. In the event any payment by or on behalf of Hexion or any of its affiliates is rescinded or required by any court to be returned for any reason having to do with Hexion and its affiliates, the joint and several obligations of Apollo, Hexion and certain of their respective affiliates will continue in full force and effect.
Also pursuant to the Settlement Agreement, we agreed to indemnify and hold harmless Hexion, Apollo and certain of their respective affiliates, officers, directors, managers, members, employees, agents and other representatives (the "Indemnified Parties") from any claim for indemnification or contribution or any other claim asserted against the Indemnified Parties by the Lenders or their affiliates that in any way arises out of any claims made by us and our affiliates against the Lenders, including claims for contribution asserted by the Lenders against Apollo and its affiliates in the Texas Bank Litigation. Our indemnification obligation does not cover legal fees and expenses incurred by the Lenders or the attorneys' fees and expenses of the Indemnified Parties in defending the Lenders' claims. The aggregate amount we must pay pursuant to indemnification will not exceed the amount of our recovery collected, if any, in the Texas Bank Litigation net of attorney fees, costs and expenses related to the Texas Bank Litigation.
In connection with the Settlement Agreement, on December 14, 2008, we, together with certain of our affiliates, entered into a Letter Agreement (the "Letter Agreement") with Hexion and certain of its affiliates and Apollo and certain of its affiliates, pursuant to which we agreed to pay Apollo and certain of its affiliates an amount of cash equal to 20% of the value of cash and non-cash consideration that is in excess of $500 million that we may obtain or receive in settlement in connection with any claims we made against the Lenders arising from or relating to the Merger Agreement, the transactions contemplated thereby and related matters, including the Texas Bank Litigation, after we first recover our attorneys' fees, costs and expenses in making the claim. In no circumstance will the aggregate amount of payments owed by us to the Apollo parties under the Letter Agreement exceed $425 million. Moreover, in the event trial commences in the Texas Bank Litigation, any interest on the part of the Apollo parties will terminate immediately and we will not owe any portion of any subsequent recovery to the Apollo parties.
All of the aggregate $1 billion in payments due under the Settlement Agreement were paid to us before December 30, 2008. As a result, the Delaware Litigation, the Texas Apollo Litigation, and Apollo and Hexion's lawsuit against us in New York have been dismissed. Hexion has withdrawn its claims against the Lenders in the New York Bank Litigation. We used $423 million of the $1 billion in proceeds to pay down our Revolving Facility. We intend to use the remaining amount, net of fees and expenses related to the Merger, for general liquidity purposes and possible additional reductions of our indebtedness.
The Texas Bank Litigation remains ongoing, and a court ordered mediation is scheduled to begin May 11, 2009, followed by a trial which is currently set for June 8, 2009. For more information, see "Recent Developments—Texas Bank Litigation" below.
3
RECENT DEVELOPMENTS
SALE OF CONVERTIBLE NOTES IN CONNECTION WITH SETTLEMENT AGREEMENT
Pursuant to the Settlement Agreement, on December 23, 2008, we issued $250 million of our 7% Convertible Notes to Apollo affiliates under a Note Purchase Agreement (the "Note Purchase Agreement"). We recorded these Convertible Notes at a fair value of $235 million. The Convertible Notes are convertible at any time, at the holder's option, at an initial conversion rate of 127.275 shares of our common stock per $1,000 principal amount of Convertible Notes (which is equal to an initial conversion price of $7.857 per share), subject to specified anti-dilution adjustments. The Convertible Notes bear interest at the rate of 7% per year payable semi-annually on July 1 and January 1 of each year, beginning on July 1, 2009. Interest is payable either in cash or, at our option, in shares of our common stock having a market value at that time equal to the interest payment. The Convertible Notes are our senior unsecured obligations and are not guaranteed by any of our subsidiaries, including Huntsman International.
The Convertible Notes will mature on December 23, 2018. At maturity, we may, at our option, pay the principal amount of the Convertible Notes in shares of our common stock having a market value at that time equal to the principal amount of the Convertible Notes, plus an amount equal to the underwriting spread of a nationally-recognized underwriter chosen by us that would be paid by a seller of the shares at such time.
We may redeem the Convertible Notes in whole, for cash, at the principal amount of the Convertible Notes plus accrued and unpaid interest, at any time on or after December 23, 2011 if the closing price of our common stock, for at least 20 consecutive trading days prior to the notice of redemption, exceeds 135% of the conversion price in effect at that time.
Upon the occurrence of certain change of control events, the holders of the Convertible Notes may require us to redeem all or any portion of the holders' Convertible Notes at the principal amount plus accrued and unpaid interest.
In connection with the issuance of the Convertible Notes, we entered into a Registration Rights Agreement, dated as of December 23, 2008 (the "Registration Rights Agreement"), with Apollo and certain of its affiliates. Pursuant to the Registration Rights Agreement, we have agreed to use our reasonable best efforts to register the resale of our common stock issuable upon conversion of the Convertible Notes (and common stock payable as interest or principal on the Convertible Notes) under the Securities Act of 1933, as amended.
VOTING AND STANDSTILL AGREEMENT
In addition to the Note Purchase Agreement and the Registration Rights Agreement, we entered into a Voting and Standstill Agreement, dated as of December 23, 2008 (the "Voting and Standstill Agreement") with Apollo and certain other stockholders related to Apollo that prohibits such persons from owning any of our common stock, other than common stock paid to such persons pursuant to the Convertible Notes ("Underlying Securities") or shares of our common stock beneficially owned by such persons as of December 23, 2008. Without our consent, persons subject to the Voting and Standstill Agreement may not transfer the Convertible Notes or the Underlying Securities, other than (i) transfers involving Underlying Securities paid as interest, (ii) certain transfers to certain affiliates and (iii) certain bona fide pledges related to borrowings from financial institutions. The Voting and Standstill Agreement further restricts Apollo and certain related stockholders from taking certain actions, including engaging in or participating in any proxy solicitation relating to the election of our Board of Directors or our Board's publicly disclosed recommendation on certain matters. The shares of our common stock held by such persons must be voted, at our election, either (i) in the manner recommended by our Board or (ii) in the same proportion as our other stockholders. The Voting and
4
Standstill Agreement terminates upon the later to occur of (i) December 31, 2010 or (ii) the date on which none of Apollo and its related stockholders beneficially or of record own Convertible Notes or any Underlying Securities representing 3% or more of our then-outstanding common stock.
Copies of the Note Purchase Agreement, the Registration Rights Agreement and the Voting and Standstill Agreement are filed as Exhibit 10.1, Exhibit 10.2 and Exhibit 10.3, respectively, to our current report on Form 8-K filed on December 23, 2008.
TEXAS BANK LITIGATION
As noted above, on September 30, 2008, we filed suit in the 9th Judicial District Court in Montgomery County, Texas against the Lenders alleging, among other things, that the Lenders had conspired with Apollo to tortiously interfere with the Basell Merger Agreement. Our petition against the Lenders includes claims of common law fraud, civil conspiracy, tortious interference with contract and unjust enrichment. We are seeking to recover damages measured by the benefit of the bargain or the amount by which the Lenders were unjustly enriched as a result of the injuries we believe they inflicted on us. Discovery, including depositions, has commenced. A court ordered mediation is scheduled to begin May 11, 2009. Trial is currently set for June 8, 2009. Also pending before the same court is a motion for summary judgment by certain entities and persons affiliated with Apollo, which seeks entry of an order barring contribution claims that have been asserted against them by the Lenders. That motion is not currently set for hearing. We intend to prosecute our claims vigorously.
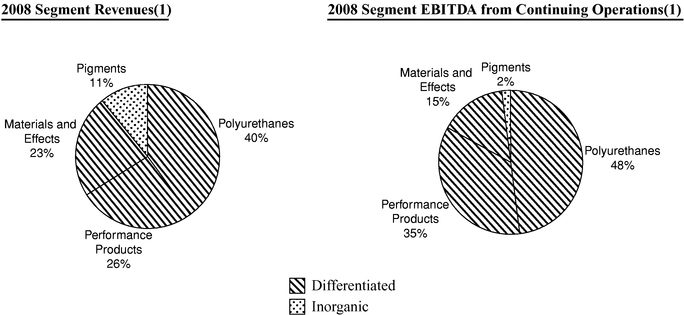
OVERVIEW
We are a global manufacturer of differentiated organic chemical products and of inorganic chemical products. As of December 31, 2008, we operated in four segments: Polyurethanes, Materials and Effects, Performance Products and Pigments. In a series of transactions completed in 2006 and 2007, we sold substantially all of our Polymers and Base Chemicals operations. We report the results from these discontinued operations in our Polymers and Base Chemicals segments. For more information, see "Note 3. Discontinued Operations" to our consolidated financial statements included elsewhere in this report.
Our products comprise a broad range of chemicals and formulations, which we market globally to a diversified group of consumer and industrial customers. Our products are used in a wide range of applications, including those in the adhesives, aerospace, automotive, construction products, durable and non-durable consumer products, electronics, medical, packaging, paints and coatings, power generation, refining, synthetic fiber, textile chemicals and dye industries. We are a leading global producer in many of our key product lines, including MDI, amines, surfactants, epoxy-based polymer formulations, textile chemicals, dyes, maleic anhydride and titanium dioxide. Our administrative, research and development and manufacturing operations are primarily conducted at the facilities listed in "—Item 2. Properties" below, which are located in 25 countries. As of December 31, 2008, we employed approximately 12,600 associates worldwide. We had revenues for the years ended December 31, 2008, 2007 and 2006 of $10,215 million, $9,651 million and $8,731 million, respectively.
Our Products
We produce differentiated organic chemical and inorganic chemical products. Our Polyurethanes, Materials and Effects and Performance Products segments produce differentiated organic chemical products and our Pigments segment produces inorganic chemical products. Our former Polymers and Base Chemicals operations, which have been sold, produced commodity organic chemical products. For more information, see "Note 3. Discontinued Operations" to our consolidated financial statements included elsewhere in this report.
5
Growth in our differentiated products has been driven by the substitution of our products for other materials and by the level of global economic activity. Accordingly, the profitability of our differentiated products has been somewhat less influenced by the cyclicality that typically impacts the petrochemical industry. Our Pigments business, while cyclical, is influenced largely by seasonal demand patterns in the coatings industry.
6
The following table identifies the key products, their principal end markets and applications and representative customers of each of our segments:
Segment
|
Products | End Markets and Applications |
Representative Customers | |||
|---|---|---|---|---|---|---|
| Polyurethanes | MDI, PO, polyols, PG, TPU, aniline and MTBE | Refrigeration and appliance insulation, construction products, adhesives, automotive, footwear, furniture, cushioning, specialized engineering applications and fuel additives | BMW, Electrolux, Firestone, GE, Haier, Lear, Louisiana Pacific, Weyerhauser | |||
Materials and Effects |
Epoxy resin compounds and formulations; cross-linking, matting and curing agents; epoxy, acrylic and polyurethane-based adhesives, tooling resin formulations, textile chemicals and dyes and APAO |
Adhesives, aerospace, electrical power transmission, consumer electronics, civil engineering, wind power generation, automotive, apparel, home and technical textiles |
ABB, Akzo, BASF, Boeing, Bosch, Cytec, Hexcel, Rohm & Haas, Russell, Sara Lee, Sherwin Williams, Wellspun, Hanesbrands, Milliken |
|||
Performance Products |
Amines, surfactants, LAB, maleic anhydride, other performance chemicals, EG, olefins and technology licenses |
Detergents, personal care products, agrochemicals, lubricant and fuel additives, adhesives, paints and coatings, construction, marine and automotive products and PET fibers and resins |
Chevron, Henkel, The Sun Products Corporation, Monsanto, Procter & Gamble, Unilever, Lubrizol, Reichhold, Dow, L'Oreal, Afton |
|||
Pigments |
Titanium dioxide |
Paints and coatings, plastics, paper, printing inks, fibers and ceramics |
Akzo, Sigma Kalon, Clariant, Jotun, PolyOne |
|||
Polymers(1) |
LDPE and LLDPE, polypropylene, EPS and styrene |
Flexible and rigid packaging, adhesives and automotive, medical and construction products |
Ashland, Berry, Kimberly Clark, Pliant, Polymer Group, PolyOne, Sealed Air |
|||
Base Chemicals(1) |
Olefins and cyclohexane |
Packaging film, polyester and nylon fibers, PVC and polymer resins |
Ineos, Dow, DuPont, Invista, Nova, Shell, Solutia |
7
Polyurethanes
General
We are a leading global manufacturer and marketer of a broad range of polyurethane chemicals, including MDI products, PO, polyols, PG and TPU. Polyurethane chemicals are used to produce rigid and flexible foams, as well as coatings, adhesives, sealants and elastomers. We focus on the higher-margin, higher-growth markets for MDI and MDI-based polyurethane systems. Growth in our Polyurethanes segment has been driven primarily by the continued substitution of MDI-based products for other materials across a broad range of applications. We operate five primary Polyurethanes manufacturing facilities in the U.S., Europe and China. We also operate 12 Polyurethanes formulation facilities, which are located in close proximity to our customers worldwide.
Our customers produce polyurethane products through the combination of an isocyanate, such as MDI or TDI, with polyols, which are derived largely from PO and EO. While the range of TDI-based products is relatively limited, we are able to produce over 2,000 distinct MDI-based polyurethane products by varying the proportion and type of polyol used and by introducing other chemical additives to our MDI formulations. As a result, polyurethane products, especially those derived from MDI, are continuing to replace traditional products in a wide range of end-use markets, including insulation in construction and appliances, cushioning for automotive and furniture, adhesives, wood binders, footwear and other specialized engineering applications.
We are a leading North American producer of PO. We and some of our customers process PO into derivative products, such as polyols for polyurethane products, PG and various other chemical products. End uses for these derivative products include applications in the home furnishings, construction, appliance, packaging, automotive and transportation, food, paints and coatings and cleaning products industries. We also produce MTBE as a co-product of our PO manufacturing process. MTBE is an oxygenate that is blended with gasoline to reduce harmful vehicle emissions and to enhance the octane rating of gasoline. See "—Environmental, Health and Safety Matters—MTBE Developments" below and "Part I. Item 1A. Risk Factors" for a discussion of legal and regulatory developments that have resulted in the curtailment and potential elimination of MTBE in gasoline in the U.S. and elsewhere. Also see, "—Manufacturing and Operations" below and "Part II. Item 7. Management's Discussion and Analysis of Financial Condition and Results of Operations" for a discussion of material changes concerning sales of MTBE. We sold our U.S. butadiene and MTBE business operated in our Base Chemicals segment in June 2006; however, the PO/MTBE operations in our Polyurethanes segment were not included in this transaction.
In 1992, we were the first global supplier of polyurethane chemicals to open a technical service center in China. We have since expanded this facility to include an integrated polyurethanes formulation facility. In January 2003, we entered into two related joint ventures to build MDI production and finishing facilities near Shanghai, China. Production at our MDI finishing plant near Shanghai, China operated by HPS, our consolidated subsidiary, was commissioned on June 30, 2006. Production at the MNB, aniline and crude MDI plants operated by SLIC, our unconsolidated joint venture, commenced on September 30, 2006. These world-scale facilities strengthen our ability to service our customers in the critical Chinese market and will support the significant demand growth that we believe this region will continue to experience.
Products and Markets
MDI is used primarily in rigid foam applications and in a wide variety of customized higher-value flexible foam and coatings, adhesives, sealants and elastomers. Polyols, including polyether and polyester polyols, are used in conjunction with MDI and TDI in rigid foam, flexible foam and other
8
non-foam applications. PO is one of the principal raw materials for producing polyether polyols. The following chart illustrates the range of product types and end uses for polyurethane chemicals.
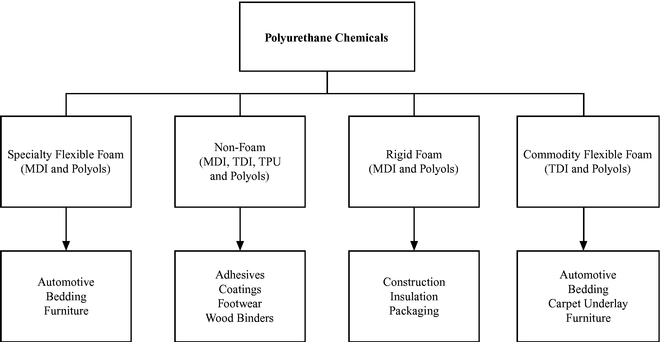
Polyurethane chemicals are sold to customers who combine the chemicals to produce polyurethane products. Depending on their needs, customers will use either commodity polyurethane chemicals produced for mass sales or polyurethane systems tailored for their specific requirements. By varying the blend, additives and specifications of the polyurethane chemicals, manufacturers are able to develop and produce a breadth and variety of polyurethane products.
MDI. MDI has a substantially larger market size and a higher growth rate than TDI. This is primarily because MDI can be used to make polyurethanes with a broader range of properties and can therefore be used in a wider range of applications than TDI. We believe that future growth of MDI is expected to be driven by the continued substitution of MDI-based polyurethane for fiberglass and other materials currently used in rigid insulation foam for construction. We expect that other markets, such as binders for reconstituted wood board products, specialty cushioning applications and coatings will further contribute to the continued growth of MDI.
The U.S. and European markets currently consume the largest quantities of MDI. With the recent rapid growth of the developing Asian economies, the Asian markets have become an important market for MDI, and we currently believe that per-capita demand for MDI in Asia will continue to increase as its less-developed economies continue to grow.
There are four major global producers of MDI: Bayer, our Company, BASF and Dow. While there are also some regional producers in Asia and Europe, we believe it is unlikely that any new global producers of MDI will emerge in the foreseeable future due to the substantial requirements for entry, such as the limited availability of licenses for MDI technology and the substantial capital commitment and integration that is required to develop both the necessary technology and the infrastructure to manufacture and market MDI.
TPU. TPU is a high-quality, fully formulated thermal plastic derived from the reaction of MDI or an aliphatic isocyanate with polyols to produce unique qualities such as durability, flexibility, strength, abrasion-resistance, shock absorbency and chemical resistance. We can tailor the performance characteristics of TPU to meet the specific requirements of our customers. TPU is used in injection
9
molding and small components for the automotive and footwear industries. It is also extruded into films, wires and cables for use in a wide variety of applications in the coatings, adhesives, sealants and elastomers markets.
Polyols. Polyols are combined with MDI, TDI and other isocyanates to create a broad spectrum of polyurethane products. Demand for specialty polyols has been growing at approximately the same rate at which MDI consumption has grown.
Aniline. Aniline is an intermediate chemical used primarily to manufacture MDI. Generally, most aniline is either consumed internally by the producers of the aniline or is sold to third parties under long-term supply contracts. We believe that the lack of a significant spot market for aniline means that in order to remain competitive, MDI manufacturers must either be integrated with an aniline manufacturing facility or have a long-term cost-competitive aniline supply contract.
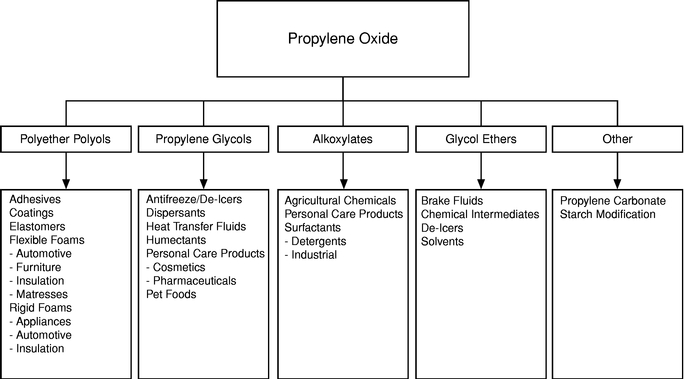
PO. PO is an intermediate chemical used mainly to produce a wide range of polyols and PG. Demand for PO depends largely on overall economic demand, especially that of consumer durables. The following chart illustrates the primary end markets and applications for PO.
MTBE. MTBE is an oxygenate that is blended with gasoline to reduce harmful vehicle emissions and to enhance the octane rating of gasoline. The use of MTBE is controversial, and it has been effectively eliminated in the U.S. market. See "—Environmental, Health and Safety Matters—MTBE Developments" below and "Part I. Item 1A. Risk Factors." We continue to sell MTBE for use as a gasoline additive, substantially all of which is sold for use outside the U.S. See "—Manufacturing and Operations" below and "Part II. Item 7. Management's Discussion and Analysis of Financial Condition and Results of Operations."
Sales and Marketing
We manage a global work force which sells our polyurethane chemicals to over 2,000 customers in more than 90 countries. Our sales and technical resources are organized to support major regional markets, as well as key end-use markets which require a more global approach. These key end-use
10
markets include the appliance, automotive, footwear, furniture and coatings, construction products, adhesives, sealants and elastomers industries.
We provide a wide variety of polyurethane solutions as components (i.e., the isocyanate or the polyol) or in the form of "systems" in which we provide the total isocyanate and polyol formulation to our customers in ready-to-use form. Our ability to deliver a range of polyurethane solutions and technical support tailored to meet our customer's needs is critical to our long term success. We have strategically located our polyurethane formulation facilities, commonly referred to in the chemicals industry as "systems houses," close to our customers, enabling us to focus on customer support and technical service. We believe this customer support and technical service system contributes to customer retention and also provides opportunities for identifying further product and service needs of customers. We manufacture polyols primarily to support our MDI customers' requirements.
We believe that the extensive market knowledge and industry experience of our sales teams and technical experts, in combination with our strong emphasis on customer relationships, have facilitated our ability to establish and maintain long-term customer supply positions. Due to the specialized nature of our markets, our sales force must possess technical knowledge of our products and their applications. Our strategy is to continue to increase sales to existing customers and to attract new customers by providing innovative solutions, quality products, reliable supply, competitive prices and superior customer service.
Manufacturing and Operations
Our MDI production facilities are located in Geismar, Louisiana, Rozenburg, Netherlands and, through our joint ventures, Shanghai, China. These facilities receive aniline, which is a primary material used in the production of MDI, from our facilities located in Geismar, Louisiana; Wilton, U.K.; and Shanghai, China. We believe that this relative scale and product integration of our large facilities provide a significant competitive advantage over other producers. In addition to reducing transportation costs for our raw materials, integration helps reduce our exposure to cyclical prices.
The following table sets forth the annual production capacity of polyurethane chemicals at each of our polyurethanes facilities:
| |
MDI(1) | Polyols | TPU | Aniline | Nitrobenzene | PO | PG | MTBE | |||||||||||||||||
|---|---|---|---|---|---|---|---|---|---|---|---|---|---|---|---|---|---|---|---|---|---|---|---|---|---|
| |
(millions of pounds) |
(millions of gallons) |
|||||||||||||||||||||||
Geismar, Louisiana |
970 | 160 | 717 | (2) | 935 | (2) | |||||||||||||||||||
Port Neches, Texas |
525 | 145 | 260 | ||||||||||||||||||||||
Ringwood, Illinois |
18 | ||||||||||||||||||||||||
Rozenburg, Netherlands |
880 | 130 | |||||||||||||||||||||||
Wilton, U.K. |
715 | 953 | |||||||||||||||||||||||
Osnabrück, Germany |
26 | 57 | |||||||||||||||||||||||
Total |
1,850 | 316 | 75 | 1,432 | 1,888 | 525 | 145 | 260 | |||||||||||||||||
At both our Geismar and Rozenburg facilities we utilize sophisticated proprietary technology to produce our MDI. This technology, which is also used in our Chinese joint venture, contributes to our position as a low cost MDI producer. In addition to MDI, we use a proprietary manufacturing process
11
to manufacture PO. We own or license all technology, know-how and patents developed and utilized at our PO facility. Our process combines isobutane and oxygen in proprietary oxidation (peroxidation) reactors, thereby forming TBHP and TBA, which are further processed into PO and MTBE, respectively. Because our PO production process is less expensive relative to other technologies and allows all of our PO co-products to be processed into saleable or useable materials, we believe that our PO production technology possesses several distinct advantages over its alternatives.
We also operate polyurethane systems houses in Deerpark, Australia; Shanghai, China; Cartagena, Colombia; Deggendorf, Germany; Thane (Maharashtra), India; Ternate, Italy; Tlalnepantla, Mexico; Mississauga, Ontario; Kuan Yin, Taiwan; Samuprakam, Thailand; Osnabrück, Germany and Dammam, Saudi Arabia.
Joint Ventures
Rubicon Joint Venture. We and Chemtura Corporation own Rubicon LLC, which owns aniline, nitrobenzene and DPA manufacturing facilities in Geismar, Louisiana. We are entitled to approximately 78% of the nitrobenzene and aniline production capacity of Rubicon LLC, and Chemtura Corporation is entitled to 100% of the DPA production. In addition to operating the joint venture's owned aniline, nitrobenzene and DPA facilities, Rubicon LLC also operates our wholly owned MDI and polyol facilities at Geismar and is responsible for providing other auxiliary services to the entire Geismar complex. As a result of this joint venture, we are able to achieve greater scale and lower costs for our products than we would otherwise have been able to obtain. Rubicon LLC is consolidated in our financial statements..
Chinese MDI Joint Ventures. In January 2003, we entered into two related joint venture agreements to build MDI production facilities near Shanghai, China. SLIC, our manufacturing joint venture with BASF AG and three Chinese chemical companies, built three plants that manufacture MNB, aniline and crude MDI. We effectively own 35% of SLIC and it is our unconsolidated affiliate. HPS, our splitting joint venture with Shanghai Chlor-Alkali Chemical Company, Ltd, has constructed a plant to manufacture pure MDI, polymeric MDI and MDI variants. We own 70% of HPS and it is our consolidated affiliate. These projects have been funded by a combination of equity invested by the joint venture partners and borrowed funds. SLIC and HPS commenced operations during 2006. The total production capacity of the SLIC facilities is 530 million pounds per year of MDI and the production capacity of the HPS facility is 270 million pounds per year of pure MDI, polymeric MDI and MDI variants.
Raw Materials
The primary raw materials for MDI-based polyurethane chemicals are benzene and PO. Benzene is a widely available commodity that is the primary feedstock for the production of MDI and aniline. Historically, benzene has been the largest component of our raw material costs. We purchase benzene from third parties to manufacture nitrobenzene and aniline, almost all of which we then use to produce MDI.
A major cost in the production of polyols is attributable to the costs of PO. The integration of our PO business with our polyurethane chemicals business gives us access to a competitively priced, strategic source of PO and the opportunity to develop polyols that enhance our range of MDI products. The primary raw materials used in our PO production process are butane/isobutane, propylene, methanol and oxygen, which accounted for 55%, 30%, 14% and 1%, respectively, of total raw material costs in 2008. We purchase our raw materials primarily under long-term contracts. While most of these feedstocks are commodity materials generally available to us from a wide variety of suppliers at competitive prices in the spot market, all the propylene used in the production of our PO is produced internally and delivered through a pipeline connected to our PO facility.
12
Competition
Our major competition in the polyurethane chemicals market includes BASF, Bayer, Dow and Basell. While these competitors and others produce various types and quantities of polyurethane chemicals, we focus on MDI and MDI-based polyurethane systems. We compete based on technological innovation, technical assistance, customer service and product reliability. Our polyurethane chemicals business competes in two basic ways: (1) where price is the dominant element of competition, our polyurethane chemicals business differentiates itself by its high level of customer support including cooperation on technical and safety matters; and (2) elsewhere, we compete on the basis of product performance and our ability to react quickly to changing customer needs and by providing customers with innovative solutions to their needs.
The market in which our Polyurethanes segment operates is highly competitive. Among our competitors in this market are some of the world's largest chemical companies and major integrated petroleum companies that have their own raw material resources. Some of these companies may be able to produce products more economically than we can. In addition, some of our competitors in this market have greater financial resources, which may enable them to invest significant capital into their businesses, including expenditures for research and development. If any of our current or future competitors in this market develops proprietary technology that enables them to produce products at a significantly lower cost, our technology could be rendered uneconomical or obsolete.
Materials and Effects
General
Our Materials and Effects segment is a leading global manufacturer and marketer of technologically advanced epoxy, acrylic and polyurethane-based polymer products and textile solutions, including dye and chemical products. We focus on formulations and systems that are used to address customer-specific needs in a wide variety of industrial and consumer applications. Our products are used either as replacements for traditional materials, such as metal, wood, clay, glass, stone, ceramics and natural fibers, or in applications where traditional materials do not meet demanding engineering specifications. For example, structural adhesives are used to replace metal rivets and advanced composites are used to replace traditional aluminum panels in the manufacture of aerospace components. Our textile solutions enhance the color of finished textiles and improve such performance characteristics as wrinkle resistance and the ability to repel water and stains. Our Materials and Effects segment is characterized by the breadth of our product offering, our expertise in complex chemistry, our long-standing relationships with our customers, our ability to develop and adapt our technology and our applications expertise for new markets and new applications.
We operate synthesis, formulating and production facilities in North America, Europe, Asia, South America and Africa. We market over 6,000 products to more than 5,000 customers in over 20 end-markets, which are grouped as follows:
Market Groups
|
End Markets | |
|---|---|---|
| Advanced Materials | civil engineering, shipbuilding and marine maintenance, consumer appliances, food and beverage packaging, industrial appliances, consumer/do it yourself ("DIY"), aerospace, DVD, LNG transport, electrical power transmission and distribution, printed circuit boards, consumer and industrial electronics, aerospace, wind power generation, automotive, recreational sports equipment, medical appliances, design studios and prototype manufacturers |
13
Market Groups
|
End Markets | |
|---|---|---|
| Textile Effects | consumer fashion apparel, sportswear, career and uniform apparel, military, automotive, home textiles and furnishings, carpet and other functional textiles |
In October 2006 and December 2008, we announced restructuring programs for our textile effects operations. These restructuring programs are necessary to allow our Materials and Effects segment to adapt to the dynamic business shifts that have occurred in the textile market. Through December 31, 2008, we have spent approximately $50 million to significantly expand resources and capacity in Asia, while refocusing and consolidating resources in Europe and North America and to transition from a regional to a global, market-focused organization. Other elements of our plan include simplifying global distribution networks, enhancing research and development activities and continuing investments in environmental, health and safety projects to ensure that all of our acquired manufacturing units are operating in accordance with our standards. We expect to spend approximately $60 million over approximately the next year to complete these projects. We have targeted approximately $100 million in annual savings when all phases of the restructuring are fully completed.
Products and Markets
Advanced Materials product range spans from basic liquid and solid resins, to specialty components like curing agents, matting agents, accelerators, cross-linkers, reactive diluents, thermoplastic polyamides and additives. In addition to these components, which we typically sell to formulators in various industries, we also produce and sell ready to use formulated polymer systems.
Base Resins and Specialty Component Markets. Our products are used for the protection of steel and concrete substrates, such as flooring, metal furniture and appliances, buildings, linings for storage tanks and food and beverage cans, and the primer coat of automobile bodies and ships. Epoxy-based surface coatings are among the most widely used industrial coatings due to their structural stability and broad application functionality combined with overall economic efficiency.
Base resins and specialty components are also used for composite applications. A structural composite is made by combining two or more different materials, such as fibers, resins and other specialty additives, to create a product with enhanced structural properties. Specifically, structural composites are lightweight, high-strength, rigid materials with high resistance to chemicals, moisture and high temperatures. Our product range comprises basic and advanced epoxy resins, curing agents and other advanced chemicals, additives and formulated polymer systems. The four key target markets for our structural composites are aerospace, windmill blades for wind power generation, other industrial and automotive applications, and recreational products (mainly sports equipment such as skis). Structural composites continue to substitute for traditional materials, such as metals and wood, in a wide variety of applications due to their light weight, strength and durability.
Formulated Systems. The structural adhesives market requires high-strength "engineering" adhesives for use in the manufacture and repair of items to bond various engineering substrates. Our business focus is on engineering adhesives based on epoxy, polyurethane, acrylic and other technologies which are used to bond materials, such as steel, aluminum, engineering plastics and composites in substitution of traditional joining techniques. Our Araldite brand name has considerable value in the industrial and consumer adhesives markets. In many countries, Araldite® branded products are known as high-performance adhesives, and we generally believe that this is the value-added segment of the market where recognition of our long-standing Araldite® brand is a key competitive advantage. Packaging is a key characteristic of our adhesives products. Our range of adhesives is sold in a variety
14
of packs and sizes, specifically targeted to three specific end-markets and sold through specifically targeted routes to market:
Our electrical materials are formulated polymer systems, which make up the insulation materials used in equipment for the generation, transmission and distribution of electrical power, such as transformers, switch gears, ignition coils, sensors, motors and magnets, and for the protection of electrical and electronic devices and components. The purpose of these products is to insulate, protect or shield either the environment from electrical current or electrical devices from the environment, such as temperature or humidity. Our electrical insulating materials target two key market segments: the heavy electrical equipment market and the light electrical equipment market.
Products for the heavy electrical equipment market segment are used in power plant components, devices for power grids and insulating parts and components. In addition, there are numerous devices, such as motors and magnetic coils used in trains and medical equipment, which are manufactured using epoxy and related technologies. Products for the light electrical equipment market segment are used in applications such as industrial automation and control, consumer electronics, car electronics and electrical components. The end customers in the electrical insulating materials market encompass the relevant original equipment manufacturer ("OEM") as well as numerous manufacturers of components used in the final products. We also develop, manufacture and market materials used in the production of printed circuit boards. Our products are ultimately used in industries ranging from telecommunications and personal computer mother board manufacture to automotive electronic systems manufacture. Soldermasks are our most important product line in printed circuit board technologies, particularly in Europe. Sales are made mainly under the Probimer®, Probimage®, and Probelec® trademarks. Our Probimer® trademark is a widely recognized brand name for soldermasks.
We produce mainly polyurethane-based and epoxy formulated polymer systems used in the production of models, prototypes, patterns, molds and a variety of related products for design, prototyping and short-run manufacture. Our products are used extensively in the automotive, aerospace and industrial markets as productivity tools to quickly and efficiently create accurate prototypes and develop experimental models, and to lower the cost of manufacturing items in limited quantities primarily using computer-aided-design techniques. We separate the overall tooling and modeling materials market into two distinct groups—standard tooling and modeling materials and stereolithography technology.
Our standard tooling and modeling materials are polymer-based materials used by craftsmen to make the traditional patterns, molds, models, jigs and fixtures required by the foundry, automotive, ceramics and other such industries. Stereolithography is a technology that is used to accurately produce physical three-dimensional models directly from computer-aided-design data without cutting, machining or tooling. The models are produced by selectively curing a light-sensitive liquid resin with a laser beam. We sell our stereolithography products to customers in the aerospace, appliance, automotive, consumer, electronics and medical markets.
15
Textile Effects. Textiles generally involve a complex matrix of fibers, effects and functionality, and the resulting products range from fashion apparel to bulletproof vests, home linens to air and water filters, and upholstery to automotive interiors. Our broad range of dyestuffs and chemicals enhance both the aesthetic appearance of these products and the functionality needed to ensure that they perform in their end-use markets. Since the requirements for these markets vary dramatically, our business strategy focuses on the two major markets—apparel and technical textiles. We work to provide the right balance of products and service to meet the technical challenges in each of these markets.
The apparel market, which also includes our home interiors products, focuses on products that provide an aesthetic effect and/or improve the processing efficiency within the textile mill. We offer a complete range of colors for cotton, polyester and nylon that cover the range of shades needed for sportswear, intimate apparel, towels, sheeting and casual wear. Our dyes have been developed to ensure that they offer the highest levels of wash fastness currently available in the market. Optical brighteners and other pretreatment products provide "bright white" effects for apparel, towels and sheeting. Pretreatment and dyeing auxiliaries ensure that these fabrics are processed efficiently and effectively—cleaning the fabrics with fewer chemicals, less energy and less water and thereby minimizing the environmental footprint and reducing the processing costs. Silicone softeners may be used to enhance the feel of products.
Technical textiles include automotive textiles, carpet, military fabrics, mattress ticking and nonwoven and other technical fabrics. Though the product groups may differ in their end-uses, the articles must provide a high-level of functionality and performance in their respective markets. High-lightfast dyes and UV absorbers are used in automotive interiors and outdoor furnishings to provide colors that don't fade when exposed to sunlight and heat. Powerful stain repellent and release technology imparts durable protection for upholstery, military and medical fabrics, without affecting the color, breathability or feel of the fabric. Specialized dyes and prints create unique camouflage patterns for military uniforms, backpacks and tarps that won't fade through wash and wear or during exposure to the elements.
Sales and Marketing
We maintain multiple routes to market to service our diverse customer base. These routes to market range from using our own direct sales force for targeted, technically-oriented distribution to mass general distribution. Our direct sales force focuses on engineering solutions decision-makers at major customers who purchase significant amounts of product from us. We use technically-oriented specialist distributors to augment our sales effort in niche markets and applications where we do not believe it is appropriate to develop direct sales resources. We use mass general distribution channels to sell our products into a wide range of general applications where technical expertise is less important to the user of the products to reduce our overall selling expenses. We believe our use of multiple routes to market enables us to reach a broader customer base at an efficient cost.
We conduct sales activities for our market groups through separate dedicated regional sales teams in the Americas, Europe, Africa and the Middle East ("EAME") and Asia. Our global customers are covered by key account managers who are familiar with the specific requirements of these clients. The management of long-standing customer relationships, some of which are 20 to 30 years old, is at the heart of the sales and marketing process. We are also supported by a strong network of distributors. We serve a highly fragmented customer base.
For our consumer adhesives, we have entered into exclusive branding and distribution arrangements with, for example, Bostik in Europe and Shelleys in Australia. Under these arrangements, our distribution partners fund advertising and sales promotions, negotiate and sell to major retail chains, own inventories and provide store deliveries (and sometimes shelf merchandising) in exchange for a reliable, high-quality supply of Araldite® branded, ready-to-sell packaged products.
16
For our textile effects products, we focus on providing effect competence and process competence to our customers. Effect competence—delivering value-added effects to our customer's products—enables us to capitalize on new and innovative technologies and to assist our customers in their efforts to differentiate themselves from competitors. Process competence—applying know-how and expertise to improve customers' processes—allows us to utilize our technical service to reduce cost and enhance efficiency.
Manufacturing and Operations
We are a global business serving customers in three principal geographic regions: EAME; the Americas; and Asia. To service our customers efficiently, we maintain manufacturing plants around with the world with a strategy of global, regional and local manufacturing employed to optimize the level of service and minimize the cost to our customers. The following table summarizes the plants that we operate:
Location
|
Description of Facility | |
|---|---|---|
| Taboão da Serra, Brazil | Formulating Facility | |
| Panyu, China(1)(3) | Production Facility | |
| Sadat City, Egypt | Formulating Facility | |
| Bad Saeckingen, Germany(1) | Formulating Facility | |
| Bergkamen, Germany | Synthesis Facility | |
| Langweid am Leich, Germany(1) | Formulating Facility | |
| Chennai, India(2) | Resins and Synthesis Facility | |
| Atotonilquillo, Mexico | Synthesis Facility | |
| Pamplona, Spain | Resins and Synthesis Facility | |
| Basel, Switzerland(1) | Synthesis Facility and Technology Center | |
| Monthey, Switzerland | Resins and Synthesis Facility | |
| Schweizerhalle, Switzerland(1) | Formulating Facility | |
| Samutsakorn (Mahachai), Thailand(1) | Synthesis Facility | |
| Istanbul, Turkey(1) | Formulating Facility | |
| Duxford, U.K. | Formulating Facility | |
| McIntosh, Alabama, U.S. | Resins and Synthesis Facility | |
| Los Angeles, California, U.S. | Formulating Facility | |
| East Lansing, Michigan, U.S. | Formulating Facility | |
| Charlotte, North Carolina, U. S.(1) | Formulating Facility |
Our facilities in Asia are well-positioned to take advantage of the market growth that is expected in this region. Furthermore, we believe that we are the largest producer of epoxy resin compounds in India.
Raw Materials
The principal raw materials we purchase for the manufacture of basic and advanced epoxy resins are epichlorohydrin, bisphenol A and BLR. We also purchase amines, polyols, isocyanates, acrylic materials, hardeners and fillers for the production of our formulated polymer systems and complex chemicals and additives. The manufacture of textile effects products requires a wide selection of raw
17
materials (approximately 3,000 different chemicals), including amines, fluorochemicals and sulfones. No one raw material represents greater than 2% of our textile effects raw material expenditures. Raw material costs constitute a sizeable percentage of sales for certain applications. We have supply contracts with a number of suppliers, including, for example, Dow. The terms of our supply contracts vary. In general, these contracts contain provisions that set forth the quantities of product to be supplied and purchased and formula-based pricing.
Additionally, we produce some of our most important raw materials, such as BLR and its basic derivatives, which are the basic building blocks of many of our products. We are the fourth largest producer of BLR in the world. Approximately 50% of the BLR we produce is consumed in the production of our formulated polymer systems. The balance of our BLR is sold as liquid or solid resin in the merchant market, allowing us to increase the utilization of our production plants and lower our overall BLR production cost. We believe that manufacturing a substantial proportion of our principal raw material gives us a competitive advantage over other epoxy-based polymer systems formulators, most of whom must buy BLR from third-party suppliers. This position helps protect us from pricing pressure from BLR suppliers and aids in providing us a stable supply of BLR in difficult market conditions.
We consume certain amines produced by our Performance Products segment and isocyanates produced by our Polyurethanes segment, which we use to formulate advanced materials products.
Competition
The market in which our Materials and Effects segment operates is highly competitive. Among our competitors in this market are some of the world's largest chemical companies and major integrated companies that have their own raw material resources. Some of these companies may be able to produce products more economically than we can. In addition, some of our competitors in this market have greater financial resources, which may enable them to invest significant capital into their businesses, including expenditures for research and development. If any of our current or future competitors in this market develops proprietary technology that enables them to produce products at a significantly lower cost, our technology could be rendered uneconomical or obsolete.
Advanced Materials. Competition in basic liquid and solid epoxy resins is primarily driven by price. There are two major manufacturers of basic epoxy resins used in industrial protective coatings, Dow and Hexion. Other participants in this market include BASF, Kukdo, Leuna and NanYa. Competition in coating systems is increasingly becoming more global, with trends toward industry consolidation and the emergence of new competitors in Asia. Our competitors are considerably more fragmented in Asia than in Europe and North America.
Competition in specialty components is primarily driven by product performance, service and customer certification. We believe that the competitive strengths of our coating systems product lines are our strong technology base, broad range of value-added products, leading market positions, diverse customer base and reputation for customer service. Our major competitors for formulated polymer systems and complex chemicals and additives used in coatings systems are Air Products, Arizona, Hexion, Cognis, Cray Valley and Evonics.
Competition in structural composites applications varies but is primarily driven by technology, applications expertise, formulations expertise, product performance, customer service and customer certification. We believe that our competitive strengths are our strong technology base, broad range of value-added products, leading market positions, diverse customer base and reputation for customer service. Pricing dynamics differ greatly among the various end-markets, largely due to their differing structures. Pricing in the aerospace market very much reflects the advanced technology and applications know-how which we provide to customers. Pricing is typically more competitive in the industrial and recreational markets due to the more standardized requirements of the end-user market and higher
18
sales volumes compared to those of the aerospace market. Competition in the electrical laminates industry is largely price-driven due to the standard nature of the products supplied, the highly price-sensitive nature of the electronics industry and the ability of customers to source globally. Our competitors in the structural composites markets include Hexion, DIC, Dow, Mitsui and Sumitomo. In the aerospace market, we compete principally with Mitsui and Sumitomo. Our competitors in the automotive, industrial and recreational markets include Dow and Hexion. Finally, our competitors in the laminates market include all of these companies as well as NanYa.
We face substantial competition for the sale of our products for adhesives applications. Competition in the industry specific market segments is based on an understanding of the relevant industry sector and the ability to provide highly reliable and tailored engineering solutions, applications expertise and ease of use with the customer's processing equipment. Competition in the consumer market segment is based on branding, packaging and making widely available, easy-to-use products on which our customers can rely. We believe that our competitive strengths and our focus on defined market needs, provision of a high level of service and recognition as a quality supplier in the chosen sectors, all of which are exemplified by our strong Araldite® brand name. The principal participants in the structural adhesives market include Henkel/Loctite, ITW, National Starch, Sika, 3M and many other regional or industry specific competitors.
Competition for electrical insulating materials applications is based on technology, know-how, applications expertise, formulations expertise, reliability, performance and price. Manufacturers of heavy electrical equipment place more importance on reliability and level of support, while manufacturers of light electrical equipment choose materials offering the lowest cost, but also the required quality and performance. As a result, epoxy products, which offer a combination of price and performance superior to competing polyurethane and silicone and conventional glass and ceramic products, are widely used in heavy electrical equipment, and both epoxy and cheaper polyurethane products are used in light electrical equipment.
We believe that our competitive strengths in the electrical materials market are our long-standing customer relationships, product reliability and technical performance. Our key products used in heavy electrical and light electrical applications, such as resins, hardeners and auxiliaries, are tested and certified according to industry standards established by Underwriters Laboratories, International Electrotechnical Commission, or Cenelec, and also to customer-specific requirements. Our main competitors in the electrical insulating materials market segment include Altana, Hexion, Schenectady, Wuxi, Dexter-Hysol, Hitachi Chemical, Nagase Chemtex and Toshiba Chemical.
Competition in the printed circuit board materials markets is based on price, technological innovation and the ability to provide process expertise and customer support. Consolidation among our customers has led to increased pricing pressure. We believe that our competitive strengths are our fully developed technology, our application technology center in Basel, Switzerland and our technology center in Panyu, China, our global presence and long-standing relationships with key customers and OEMs, and the approval of our products by global OEMs. Major competitors of our soldermask products include Coates, Goo, Peters, Taiyo Ink and Tamura.
Competition in standard tooling and modeling solutions is based on quality of service, technical solutions, range, competitive prices and prompt supply, including 24-hour delivery if required. This market segment is generally characterized by pricing pressure and intense competition. Competition in stereolithography is driven by the requirement for innovative solutions. We believe that our competitive strength is our broad range of products, which we make available on a global basis, covering all of the needs of both our standard tooling and modeling and stereolithography customers. A few large manufacturers (including Axson, DSM and Sika), as well as many small, local manufacturers provide a limited product range to local regions in the plastic tooling and modeling solutions market but none have our breadth of product offering.
19
Textile Effects. We are the leading global market share provider for textile chemicals and dyes. Competition within the textile chemicals and dyes markets is generally fragmented with few competitors who offer complete solutions for both markets. Our major competitors are Dystar, Clariant, BASF, Cognis and Lanxess. We believe that our competitive strengths include our product offering, which is characterized by its broad range; high quality; significant integration between products and service; reliable technical expertise; long-standing relationships with customers; and strong business infrastructure in Asia. We believe that we have more customer service capacity and account management capacity than any of our competitors worldwide.
Performance Products
General
Our Performance Products segment is organized around three market groups, performance specialties, performance intermediates and maleic anhydride and licensing, and serves a wide variety of consumer and industrial end markets. In performance specialties, we are a leading global producer of amines, carbonates and certain specialty surfactants. Growth in demand in our performance specialties market tends to be driven by the end-performance characteristics that our products deliver to our customers. These products are manufactured for use in a growing number of niche industrial end uses and have been characterized by growing demand, technology substitution and stable profitability. For example, we are one of two significant global producers of polyetheramines, for which our sales volumes have grown at a compound annual rate of over 10% in the last ten years due to strong demand in a number of industrial applications, such as epoxy curing agents, oil drilling, agrochemicals, fuel additives and civil construction materials. In performance intermediates, we consume internally produced and third-party-sourced base petrochemicals in the manufacture of our surfactants, LAB and ethanolamines products, which are primarily used in detergency, consumer products and industrial applications. We also produce EG, which is primarily used in the production of polyester fibers and PET packaging. We believe we are North America's largest and lowest-cost producer of maleic anhydride. Maleic anhydride is the building block for UPRs, mainly used in the production of fiberglass reinforced resins for marine, automotive and construction products. We are the leading global licensor of maleic anhydride manufacturing technology and are also the largest supplier of butane fixed bed catalyst used in the manufacture of maleic anhydride. Our licensing group also licenses technology on behalf of other Huntsman businesses. We operate 15 Performance Products manufacturing facilities in North America, Europe, Asia and Australia.
We have the annual capacity to produce approximately 1.2 billion pounds of more than 250 amines and other performance chemicals. We believe we are the largest global producer of polyetheramines, propylene carbonates, ethylene carbonates, DGA® agent and morpholine, the second-largest global producer of ethyleneamines and the third-largest North American producer of ethanolamines. We also produce substituted propylamines. Our products are manufactured at our Port Neches, Conroe and Freeport, Texas facilities and at our facilities in Llanelli, U.K. Petfurdo, Hungary and Jurong Island, Singapore. We use internally produced ethylene, EO, EG and PO in the manufacture of many of our amines. Our amines are used in a wide variety of consumer and industrial applications, including personal care products, polyurethane foam, fuel and lubricant additives, paints and coatings, composites, solvents and catalysts. Our key amines customers include Akzo, Chevron, Cognis, Hercules, Afton, Unilever, Monsanto and PPG.
We have the capacity to produce approximately 2.5 billion pounds of surfactant products annually at our eight facilities located in North America, Europe and Australia. We are a leading global manufacturer of nonionic, anionic, cationic and amphoteric surfactants products and are characterized by our breadth of product offering and market coverage. Our surfactant products are primarily used in consumer detergent and industrial cleaning applications. In addition, we manufacture and market a diversified range of mild surfactants and specialty formulations for use in baby shampoos and other
20
personal care applications. We are also a leading European producer of components for powder and liquid laundry detergents and other cleaners. We continue to strengthen and diversify our surfactant product offering into formulated specialty surfactant products, for use in various industrial applications such as leather and textile treatment, foundry and construction, agrochemicals, fuels and lubricants, polymers and coatings. We are growing our global agrochemical surfactant technology and product offerings. Our key surfactants customers include The Sun Products Corp, L'Oreal, Monsanto, Nufarm, Clorox, Henkel, Colgate, Procter & Gamble and Unilever.
We are North America's second-largest producer of LAB, with alkylation capacity of 375 million pounds per year at our plant in Chocolate Bayou, Texas. LAB is a surfactant intermediate which is converted into LAS, a major anionic surfactant used worldwide for the production of consumer, industrial and institutional laundry detergents. We also manufacture a higher-molecular-weight alkylate which is used as an additive to lubricants. Our key customers for alkylates include Colgate, Lubrizol, Henkel, Procter & Gamble, Unilever and The Sun Products Corp.
We believe we are North America's largest producer of maleic anhydride, a highly versatile chemical intermediate that is used to produce UPRs, which are mainly used in the production of fiberglass reinforced resins for marine, automotive and construction products. Maleic anhydride is also used in the production of lubricants, food additives and artificial sweeteners. We have the capacity to produce approximately 240 million pounds annually at our facility located in Pensacola, Florida. We also own a 50% interest in Sasol-Huntsman GmbH & Co. KG, which is accounted for using the equity method. This joint venture owns and operates a facility in Moers, Germany with an annual capacity of 137 million pounds. We also license our maleic anhydride technology and supply our catalysts to licensees and to worldwide merchant customers, including supplying catalyst to two of the three other U.S. maleic anhydride producers. As a result of our long-standing research and development efforts aided by our pilot and catalyst preparation plants, we have successfully introduced six generations of our maleic anhydride catalysts. Patents have been recently filed for our seventh generation catalyst which should be commercially available in late 2009. Revenue from licensing and catalyst comes from new plant commissioning, as well as current plant retrofits and catalyst change schedules. Our key maleic anhydride customers include AOC, Oronite, Cook Composites, Dixie, Lubrizol and Reichhold.
We also have the capacity to produce approximately 945 million pounds of EG annually at our facilities in Botany, Australia and Port Neches, Texas.
Products and Markets
Performance Specialties. The following table shows the end-market applications for our performance specialties products:
Product Group
|
Applications | |
|---|---|---|
Specialty Amines |
liquid soaps, personal care, lubricant and fuel additives, polyurethane foams, fabric softeners, paints and coatings, refinery processing, water treating | |
Polyetheramines |
polyurethane foams and insulation, construction and flooring, paints and coatings, lubricant and fuel additives, adhesives, epoxy composites, agrochemicals, oilfield chemicals, printing inks, pigment dispersion | |
Ethyleneamines |
lubricant and fuel additives, epoxy hardeners, wet strength resins, chelating agents, fungicides | |
Morpholine/DGA® agent and Gas Treating |
hydrocarbon processing, construction chemicals, synthetic rubber, water treating, electronics applications, gas treatment and agriculture |
21
Product Group
|
Applications | |
|---|---|---|
Carbonates |
lubricant and fuel additives, agriculture, electronics applications, textile treatment, solar panels | |
Specialty Surfactants |
agricultural herbicides, construction, paper de-inking, lubricants |
Our performance specialties products are organized around the following end markets: coatings, polymers and resins; process additives; resources, fuels and lubricants; and agrochemicals.
Amines. Amines broadly refers to the family of intermediate chemicals that are produced by reacting ammonia with various ethylene and propylene derivatives. Generally, amines are valued for their properties as a reactive, emulsifying, dispersant, detergent, solvent or corrosion inhibiting agent. Growth in demand for amines is highly correlated with GDP growth due to its strong links to general industrial and consumer products markets. However, certain segments of the amines market, such as polyetheramines, have grown at rates well in excess of GDP growth due to new product development, technical innovation, and substitution and replacement of competing products. For example, polyetheramines are used by customers who demand increasingly sophisticated performance characteristics as an additive in the manufacture of highly customized epoxy formulations, enabling the customers to penetrate new markets and substitute for traditional curing materials. As amines are generally sold based upon the performance characteristics that they provide to customer-specific end use application, pricing does not generally fluctuate with movements in underlying raw materials. On June 29, 2005, we signed a memorandum of understanding with the Zamil Group to form a joint venture to build an ethyleneamines manufacturing facility in Jubail Industrial City, Saudi Arabia. This facility is now under construction and we expect it to come on line in early 2010 with annual capacity of 60 million pounds.
Morpholine/DGA® Agent. Morpholine and DGA® agent are produced as co-products by reacting ammonia with DEG. Morpholine is used in a number of niche industrial applications including rubber curing (as an accelerator) and flocculants for water treatment. DGA® agent is primarily used in gas treating, electronics, herbicides and metalworking end-use applications.
Carbonates. Ethylene and propylene carbonates are manufactured by reacting EO and PO with carbon dioxide. Carbonates are used as solvents and as reactive diluents in polymer and coating applications. They are also increasingly being used as a photo-resist solvent in the manufacture of printed circuit boards, solar panels, LCD screens and the production of lithium batteries. Also, propylene carbonates have recently received approval by the U.S. Environmental Protection Agency for use as a solvent in certain agricultural applications. We expect these solvents to replace traditional aromatic solvents that are increasingly subject to legislative restrictions and prohibitions.
Performance Intermediates. The following table sets forth the end markets for our performance intermediates products:
Product Group
|
End Markets | ||
|---|---|---|---|
| Surfactants | |||
| Alkoxylates | household detergents, industrial cleaners, anti-fog chemicals for glass, asphalt emulsions, shampoos, polymerization additives, de-emulsifiers for petroleum production | ||
Sulfonates/Sulfates |
powdered detergents, liquid detergents, shampoos, body washes, dishwashing liquids, industrial cleaners, emulsion polymerization, concrete superplasticizers, gypsum wallboard |
||
Esters and Derivatives |
shampoo, body wash, textile and leather treatment |
||
22
Product Group
|
End Markets | ||
|---|---|---|---|
Nitrogen Derivatives |
bleach thickeners, baby shampoo, fabric conditioners, other personal care products |
||
Formulated Blends |
household detergents, textile and leather treatment, personal care products, pharmaceutical intermediates |
||
EO/PO Block Co-Polymers |
automatic dishwasher detergents |
||
Ethanolamines |
wood preservatives, herbicides, construction, gas treatment, metalworking |
||
LAB |
consumer detergents, industrial and institutional detergents, synthetic lubricants |
||
EG |
polyester fibers and PET bottle resins, antifreeze |
||
Surfactants. Surfactants or "surface active agents" are substances that combine a water-soluble component with a water insoluble component in the same molecule. While surfactants are most commonly used for their detergency in cleaning applications, they are also valued for their emulsification, foaming, dispersing, penetrating and wetting properties in a variety of industries.
Demand growth for surfactants is relatively stable and exhibits little cyclicality. The main consumer product applications for surfactants can demand new formulations with improved performance characteristics which affords considerable opportunity for innovative surfactants manufacturers like us to provide surfactants and blends with differentiated specifications and properties. For basic surfactants, pricing tends to have a strong relationship to underlying raw material prices and usually lags raw material price movements.
Ethanolamines. Ethanolamines are a range of chemicals produced by the reaction of EO with ammonia. They are used as intermediates in the production of a variety of industrial, agricultural and consumer products. There are a limited number of competitors due to the technical and cost barriers to entry. Growth in this sector has typically been higher than GDP and in the last few years has benefited in particular from the conversion to ethanolamines in the formulation of wood treatment products and higher demand for agriculture products. We believe the ethanolamines market in North America is balanced with industry operating rates currently running about of 90% of stated capacity. During 2007, we expanded the manufacturing capacity of our Port Neches, Texas facility by 70 million pounds per year. Some of our competitors have also announced their intention to debottleneck their facilities to meet the continuing growing demand for ethanolamines.
LAB. LAB is a surfactant intermediate which is produced through the reaction of benzene with either normal paraffins or linear alpha olefins. Nearly all the LAB produced globally is converted into LAS, a major anionic surfactant used worldwide for the production of consumer, industrial and institutional laundry detergents.
Four major manufacturers lead the traditional detergency market for LAB in North America: Procter & Gamble, Henkel, The Sun Products Corp and Unilever. We believe that two-thirds of the LAB global capacity lies in the hands of seven producers, with two or three major players in each of the three regional markets. Although the North American market for LAB is mature, we expect Latin America and other developing countries to grow as detergent demand grows at a faster rate than GDP.
From a competition perspective, compounds derived from alcohol can be used in certain instances as an alternative to LAB in detergent formulations. In the past several years, a significant amount of new alcohol production capacity has come on stream resulting in lower prices for these alcohol-based compounds. Despite this threat to LAB margins, the lack of investment in new LAB capacity and inability to fully substitute LAB in detergent formulations has resulted in a tightened supply position
23
which has bolstered profitability. In addition, we have developed a high molecular weight alkylate for the lubricants market. This has allowed us greater diversity in our portfolio and strengthened our competitive position.
EG. We consume our internally produced EO to produce three types of EG: MEG, DEG and TEG. MEG is consumed primarily in the polyester (fiber and bottle resin) and antifreeze end markets and is also used in a wide variety of industrial applications including synthetic lubricants, plasticizers, solvents and emulsifiers. DEG is consumed internally for the production of Morpholine/DGA® agent and polyols. TEG is used internally for the production of polyols and is sold into the market for dehydration of natural gas. We continue to optimize our EO and EG operations depending on the fundamental market demand for EG.
Maleic Anhydride and Licensing. The following table sets forth the end markets for our maleic anhydride products:
Product Group
|
End Markets | |
|---|---|---|
Maleic anhydride |
boat hulls, automotive, construction, lubricant and fuel additives, countertops, agrochemicals, paper, and food additives | |
Maleic anhydride catalyst and technology licensing |
maleic anhydride, BDO and its derivatives, and PBT manufacturers |
Maleic anhydride is a chemical intermediate that is produced by oxidizing either benzene or normal butane through the use of a catalyst. The largest use of maleic anhydride in the U.S. is in the production of UPRs, which we believe account for approximately 57% of U.S. maleic anhydride demand. UPR is the main ingredient in fiberglass reinforced resins, which are used for marine and automotive applications and commercial and residential construction products.
Our maleic anhydride technology is a proprietary fixed bed process with solvent recovery and is characterized by low butane consumption and an energy-efficient, high-percentage-recovery solvent recovery system. This process competes against two other processes, the fluid bed process and the fixed bed process with water recovery. We believe that our process is superior in the areas of feedstock and energy efficiency and solvent recovery. The maleic anhydride-based route to BDO manufacture is currently the preferred process technology and is favored over the other routes, which include PO, butadiene and acetylene as feedstocks. As a result, the growth in demand for BDO has resulted in increased demand for our maleic anhydride technology and catalyst.
Total U.S. demand for maleic anhydride in 2008 was approximately 500 million pounds. Over time, demand for maleic anhydride has generally grown at rates that slightly exceed GDP growth. However, given its dependence on the UPR market, which is heavily influenced by construction end markets, demand for this application can be cyclical. Pricing for maleic anhydride in North America over the past several years has been increasing but has recently declined with the drop in feedstock costs. Generally, changes in price have resulted from changes in industry capacity utilization as opposed to changes in underlying raw material costs; however in the second half of 2008 pricing was more driven by the latter.
We are currently constructing a new 100 million pounds-per-year maleic anhydride facility at our Geismar, Louisiana site. We expect the new facility to come on stream at the end of the first quarter of 2009. On April 1, 2008, we announced that Sasol-Huntsman GmbH KG, our 50/50 maleic anyhydride joint venture located in Moers, Germany, would be expanding its manufacturing capacity by approximately 100 million pounds per year. The new capacity is expected to be available during 2011.
24
The joint venture has received committed nonrecourse financing that together with its cash flows from operations will be used to fund the expansion.
Sales and Marketing
We sell over 2,000 products to over 4,000 customers globally through our Performance Products marketing groups, which have extensive market knowledge, considerable chemical industry experience and well established customer relationships.
Our performance specialties markets are organized around end-use market applications, such as coatings, polymers and resins and agrochemical. In these end uses, our marketing efforts are focused on how our product offerings perform in certain customer applications. We believe that this approach enhances the value of our product offerings and creates opportunities for on-going differentiation in our development activities with our customers. Our performance intermediates and maleic anhydride markets organize their marketing efforts around their products and geographic regions served. We also provide extensive pre-and post-sales technical service support to our customers where our technical service professionals work closely with our research and development functions to tailor our product offerings to meet our customers unique and changing requirements. Finally, these technical service professionals interact closely with our market managers and business leadership teams to help guide future offerings and market approach strategies.
In addition to our focused direct sales efforts, we maintain an extensive global network of distributors and agents that also sell our products. These distributors and agents typically promote our products to smaller end use customers who cannot be served cost effectively by our direct sales forces.
Manufacturing and Operations
Our Performance Products segment has the capacity to produce more than seven billion pounds annually of a wide variety of specialty, intermediate and commodity products and formulations at 15 manufacturing locations in North America, Europe, Asia and Australia.
These production capacities are as follows:
| |
Current capacity | |||||||||||||
|---|---|---|---|---|---|---|---|---|---|---|---|---|---|---|
Product Area
|
North America |
Europe | Asia Pacific | Total | ||||||||||
| |
(millions of pounds) |
|||||||||||||
Performance Specialties |
||||||||||||||
Amines |
634 | 124 | (1) | 33 | 791 | |||||||||
Specialty surfactants |
100 | 175 | 70 | 345 | ||||||||||
Carbonates |
69 | 69 | ||||||||||||
Performance Intermediates |
||||||||||||||
Ethylene |
400 | 400 | ||||||||||||
Propylene |
300 | 300 | ||||||||||||
EO |
1,000 | 100 | 1,100 | |||||||||||
EG |
890 | 55 | 945 | |||||||||||
Surfactants |
470 | 1,675 | 30 | 2,175 | ||||||||||
Ethanolamines |
400 | 400 | ||||||||||||
LAB |
375 | 375 | ||||||||||||
Maleic anhydride |
240 | 137 | (2) | 377 | ||||||||||
25
Our surfactants and amines facilities are located globally, with broad capabilities in amination, sulfonation and ethoxylation. These facilities have a competitive cost base and use modern manufacturing units that allow for flexibility in production capabilities and technical innovation. Through the major restructuring of our surfactant operations, we have significantly improved the competitiveness of our surfactants business.
Our primary ethylene, propylene, EO, EG and ethanolamines facilities are located in Port Neches, Texas. The Port Neches, Texas facility benefits from extensive logistics infrastructure, which allows for efficient sourcing of other raw materials and distribution of finished products.
Our LAB facility in Chocolate Bayou, Texas and our maleic anhydride facility in Pensacola, Florida are both located within large, integrated petrochemical manufacturing complexes operated by Solutia. We believe this results in greater scale and lower costs for our products than we would be able to obtain if these facilities were stand-alone operations.
Our unconsolidated ethyleneamine joint venture is currently constructing a plant in Jubail, Saudi Arabia. The plant will have approximate capacity of 30,000 MT/yr with production expected in the first quarter of 2010.
Raw Materials
We have the capacity to use approximately 850 million pounds of ethylene each year produced in part at our Port Neches, Texas facility in the production of EO and ethyleneamines. We consume all of our EO in the manufacture of our EG, surfactants and amines products. We also use internally produced PO and DEG in the manufacture of these products. We have the capacity to produce 400 million pounds of ethylene and 300 million pounds of propylene at our Port Neches, Texas facility. All of the ethylene is used in the production of EO and substantially all of the propylene is consumed by the PO unit at Port Neches operated by our Polyurethanes business. We purchase or toll the remainder of our ethylene and propylene requirements from third parties.
In addition to internally produced raw materials, our performance specialties market purchases over 250 compounds in varying quantities, the largest of which includes ethylene dichloride, caustic soda, synthetic alcohols, paraffin, nonyl phenol, ammonia, hydrogen, methylamines and acrylonitrile. The majority of these raw materials are available from multiple sources in the merchant market at competitive prices.
In our performance intermediates market, our primary raw materials, in addition to internally produced and third-party sourced EO and ethylene, are synthetic and natural alcohols, paraffin, alpha olefins, benzene and nonyl phenol. All of these raw materials are widely available in the merchant market at competitive prices.
Maleic anhydride is produced by the reaction of n-butane with oxygen using our proprietary catalyst. The principal raw material is n-butane which is purchased pursuant to long-term contracts and delivered to our Pensacola, Florida site by barge. Our new facility in Geismar, Louisiana will receive n-butane via pipeline. Our maleic anhydride catalyst is toll-manufactured by BASF under a long-term contract according to our proprietary methods. These raw materials are available from multiple sources at competitive prices.
Competition
In our performance specialties market, there are few competitors for many of our products due to the considerable customization of product formulations, the proprietary nature of many of our product
26
applications and manufacturing processes and the relatively high research and development and technical costs involved. Some of our global competitors include BASF, Air Products, Dow, Tosoh, and Akzo. We compete primarily on the basis of product performance, new product innovation and, to a lesser extent, on the basis of price.
There are numerous global producers of many of our performance intermediates products. Our main competitors include global companies such as Dow, Sasol, BASF, Petresa, Lyondell, Clariant, Shell, Cognis, Stepan and Kao, as well as various smaller or more local competitors. We compete on the basis of price with respect to the majority of our product offerings and, to a lesser degree, on the basis of product availability, performance and service with respect to certain of our more value-added products.
In our maleic anhydride market, we compete primarily on the basis of price, customer service and plant location. Our competitors include Lanxess, Flint Hills Resources, Marathon, Polynt and BASF. We are the leading global producer of maleic anhydride catalyst. Competitors in our maleic anhydride catalyst market include Scientific Design and Polynt. In our maleic anhydride technology licensing market, our primary competitor is Scientific Design. We compete primarily on the basis of technological performance and service.
The market in which our Performance Products segment operates is highly competitive. Among our competitors in this market are some of the world's largest chemical companies and major integrated petroleum companies that have their own raw material resources. Some of these companies may be able to produce products more economically than we can. In addition, some of our competitors in this market have greater financial resources, which may enable them to invest significant capital into their businesses, including expenditures for research and development. If any of our current or future competitors in this market develops proprietary technology that enables them to produce products at a significantly lower cost, our technology could be rendered uneconomical or obsolete.
Pigments
General
We are a leading global manufacturer and marketer of titanium dioxide, which is a white pigment used to impart whiteness, brightness and opacity to products such as paints, plastics, paper, printing inks, fibers and ceramics. We operate eight chloride-based and sulfate-based titanium dioxide manufacturing facilities located in North America, Europe, Asia and Africa. The global titanium dioxide market is characterized by a small number of large, global producers and a growing compliment of smaller regional producers.
We offer an extensive range of products that are sold worldwide to approximately 1,500 customers in all major titanium dioxide end markets and geographic regions. The geographic diversity of our manufacturing facilities allows our Pigments segment to service local customers, as well as global customers that require delivery to more than one location. Our diverse customer base includes Ampacet, A. Schulman, Akzo Nobel, BASF, Cabot, Clariant, Jotun, PolyOne and Sigma Kalon. Our pigments business has an aggregate annual nameplate capacity of approximately 600,000 tonnes at our eight production facilities. Five of our titanium dioxide manufacturing plants are located in Europe, one is in North America, one is in Asia, and one is in South Africa. Our North American operation consists of a 50% interest in a manufacturing joint venture with Kronos Worldwide, Inc.
Our Pigments segment is focused on improving our competitive position. We expanded our Greatham, U.K. chloride-based facility by 50% to 150,000 tonnes per annum capacity and on January 22, 2009, we announced our intention to cease pigment production at our Grimsby, U.K. sulphate-based facility during the first quarter of 2009. We are also introducing a number of innovative
27
new products to the market and carrying out a number of projects to further improve manufacturing costs at each of our facilities.
Products and Markets
Historically, global titanium dioxide demand growth rates tend to closely track global GDP growth rates. However, the demand growth rate and its relationship with the GDP growth rate varies by region. Developed markets such as the U.S. and Western Europe exhibit higher absolute consumption but lower demand growth rates, while emerging markets such as Asia exhibit much higher demand growth rates. The titanium dioxide industry experiences some seasonality in its sales reflecting the high exposure to seasonal coatings end use markets. Coating sales generally peak during the spring and summer months in the northern hemisphere, resulting in greater sales volumes during the second and third quarters of the year.
There are two manufacturing processes for the production of titanium dioxide, the sulfate process and the chloride process. Most recent capacity additions by the five major producers have employed the chloride process technology while those by smaller producers have generally used the sulphate process technology. We currently believe that the chloride process accounts for approximately 60% of global production capacity. However, the global distribution of sulfate- and chloride-based titanium dioxide capacity varies by region, with the sulfate process being predominant in Europe, our primary market. The chloride process is the predominant process used in North America, and both processes are used in Asia. While most end-use applications can use pigments produced by either process, regional market preferences typically favor products that are locally available. We believe the chloride and sulfate manufacturing processes compete effectively in the marketplace.
The titanium dioxide industry currently has five major producers and a large number of small regional or local producers. Titanium dioxide supply has historically kept pace with increases in demand as producers increased capacity through low cost incremental debottlenecks and efficiency improvements. During periods of low titanium dioxide demand, the industry experiences high stock levels and consequently reduces production to manage working capital. Pricing in the industry is driven primarily by supply/demand balance. Based upon current price levels and the long lead times for planning, governmental approvals and construction, we do not expect significant additional greenfield capacity in the near future.
Sales and Marketing
Approximately 85% of our titanium dioxide sales are made through our direct sales and technical services network, enabling us to cooperate more closely with our customers and to respond to our increasingly global customer base. Our concentrated sales effort and local manufacturing presence have allowed us to achieve our leading market shares in a number of the countries where we manufacture titanium dioxide.
In addition, we have focused on marketing products to higher growth industries. For example, we believe that our pigments business is well-positioned to benefit from the projected growth in the plastics sector which we expect to grow faster than the overall titanium dioxide market over the next several years.
28
Manufacturing and Operations
Our pigments business has eight manufacturing sites in seven countries with a total capacity of approximately 600,000 tonnes per year. Approximately 74% of our titanium dioxide capacity is located in Western Europe. The following table presents information regarding our titanium dioxide facilities:
Region
|
Site | Annual Capacity (tonnes) |
Process | ||||
|---|---|---|---|---|---|---|---|
Western Europe |
Greatham, U.K. | 150,000 | Chloride | ||||
|
Calais, France | 95,000 | Sulfate | ||||
|
Huelva, Spain | 80,000 | Sulfate | ||||
|
Scarlino, Italy | 80,000 | Sulfate | ||||
|
Grimsby, U.K.(1) | 40,000 | Sulfate | ||||
North America |
Lake Charles, Louisiana(2) | 70,000 | Chloride | ||||
Asia |
Teluk Kalung, Malaysia | 60,000 | Sulfate | ||||
Southern Africa |
Umbogintwini, South Africa | 25,000 | Sulfate | ||||
Total |
600,000 | ||||||
We recently completed the expansion of our Greatham, U.K. facility by 50,000 tonnes. We are also well positioned to selectively invest in new plant capacity based upon our ICON chloride technology. ICON technology allows for the construction of new capacity with world-scale economics at a minimum nameplate size of 65,000 tonnes. We believe competing chloride technologies typically require a minimum capacity of 100,000 tonnes to achieve comparable economics. Our chloride additions can be more easily absorbed into the market, which provides higher investment returns than larger capacity additions.
Joint Venture
We own a 50% interest in Louisiana Pigment Company L.P., a manufacturing joint venture located in Lake Charles, Louisiana. The remaining 50% interest is held by our joint venture partner, Kronos Worldwide. We share production offtake and operating costs of the plant equally with Kronos Worldwide, though we market our share of the production independently. The operations of the joint venture are under the direction of a supervisory committee on which each partner has equal representation. Our investment in Louisiana Pigment Company L.P. is accounted for using the equity method.
Raw Materials
The primary raw materials used to produce titanium dioxide are titanium-bearing ores. We purchase the majority of our ore under long-term supply contracts with a number of ore suppliers. The majority of titanium-bearing ores are sourced from Australia, South Africa and Canada. Ore accounts for approximately 40% of pigment variable manufacturing costs, while utilities (electricity, gas and steam), sulfuric acid and chlorine collectively account for approximately 35% of our variable manufacturing costs.
29
The world market for titanium bearing ores is dominated by Rio Tinto and Iluka, which account for approximately 40% of global supply. Both companies produce a range of ores for use in chloride and sulphate processes. We purchase approximately 50% of our ore from these two producers. The choice of producers has increased in recent years with the entry into the market of new producers based in India and Africa. We have broadened our supply base by purchasing increasing amounts of our ores from the new suppliers. Over 80% of our ore purchases are made under agreements with terms of three or more years.
Titanium dioxide producers extract titanium from ores and process it into pigmentary titanium dioxide using either the chloride or sulfate process. Once an intermediate titanium dioxide pigment has been produced, it is "finished" into a product with specific performance characteristics for particular end-use applications. The finishing process is common to both the sulfate and chloride processes and is a major determinant of the final product's performance characteristics.
The sulfate process generally uses less-refined ores that are cheaper to purchase but produce more co-product than the chloride process. Co-products from both processes require treatment prior to disposal in order to comply with environmental regulations. In order to reduce our disposal costs and to increase our cost competitiveness, we have developed and marketed the co-products of our pigments business. We sell over 50% of the co-products generated by our business.
Competition
The global markets in which our pigments business operates are highly competitive. Competition is based primarily on price. In addition, we also compete on the basis of product quality and service. The major global producers against whom we compete are DuPont, Tronox, Kronos and Cristal, each of which has a global presence and the ability to service all global markets Some of our competitors may be able to produce products more economically than we can. In addition, some of our competitors in this market have greater financial resources, which may enable them to invest significant capital into their businesses, including expenditures for research and development. If any of our current or future competitors in this market develops proprietary technology that enables them to produce products at a significantly lower cost, our technology could be rendered uneconomical or obsolete. Moreover, the sulphate-based titanium dioxide technology used by our Pigments business is widely available. Accordingly, barriers to entry, apart from capital availability, may be low and the entrance of new competitors into the industry may reduce our ability to capture improving profit margins in circumstances where capacity utilization in the industry is increasing.
Polymers and Base Chemicals
On February 15, 2007, we entered into an Asset Purchase Agreement pursuant to which Flint Hills Resources, a wholly owned subsidiary of Koch, agreed to acquire our North American base chemicals and polymers business assets for $456 million in cash, plus the value of inventory on the date of closing. The original agreement provided that we would retain other elements of working capital, including accounts receivable, accounts payable and certain accrued liabilities, which would then be liquidated for cash in the ordinary course of business. On June 22, 2007, we entered into the Amended and Restated Agreement with Flint Hills Resources amending certain terms of the original agreement to provide for, among other things, the closing of the North American Polymers Disposition on August 1, 2007 for $150 million plus the value of associated inventory on an average actual cost basis and for the subsequent closing of the U.S. Base Chemicals Disposition for the remaining $306 million plus the value of associated inventory on an average actual cost basis, following the re-start of our Port Arthur, Texas olefins manufacturing facility. On August 1, 2007, we closed the North American Polymers Disposition, and, on November 5, 2007, we closed on the U.S. Base Chemicals Disposition following the successful restart of our Port Arthur, Texas facility.
30
We received total consideration for the U.S. Petrochemicals Disposition of $769 million in 2007. The net proceeds from the U.S. Petrochemicals Disposition were used to repay borrowings under our revolving credit facility, repay other debt and reduce amounts under our accounts receivable securitization program ("A/R Securitization Program").
Prior to the U.S. Petrochemicals Disposition, our Polymers segment produced LDPE and LLDPE, polypropylene, EPS, styrene and APAO and our Base Chemicals segment produced olefins and cyclohexane.
RESEARCH AND DEVELOPMENT
For the years ended December 31, 2008, 2007 and 2006, we spent $154 million, $145 million and $115 million, respectively, on research and development.
We support our business with a major commitment to research and development, technical services and process engineering improvement. Our research and development centers are located in The Woodlands, Texas, Everberg, Belgium, and Shanghia, China. Other regional development/technical service centers are located in Billingham, England (pigments); Auburn Hills, Michigan (polyurethanes for the automotive industry); Derry, New Hampshire, Shanghai, China, Deggendorf, Germany and Ternate, Italy (polyurethanes); Melbourne, Australia (surfactants); Port Neches, Texas (process engineering support); and Basel, Switzerland (textile effects).
INTELLECTUAL PROPERTY RIGHTS
Proprietary protection of our processes, apparatuses, and other technology and inventions is important to our businesses. We own approximately 650 unexpired U.S. patents, approximately 185 patent applications (including provisionals) currently pending at the U.S. Patent and Trademark Office, and approximately 4,800 foreign counterparts, including both issued patents and pending patent applications. While a presumption of validity exists with respect to issued U.S. patents, we cannot assure that any of our patents will not be challenged, invalidated, circumvented or rendered unenforceable. Furthermore, we cannot assure the issuance of any pending patent application, or that if patents do issue, that these patents will provide meaningful protection against competitors or against competitive technologies. Additionally, our competitors or other third parties may obtain patents that restrict or preclude our ability to lawfully produce or sell our products in a competitive manner.
We also rely upon unpatented proprietary know-how and continuing technological innovation and other trade secrets to develop and maintain our competitive position. There can be no assurance, however, that confidentiality agreements into which we enter and have entered will not be breached, that they will provide meaningful protection for our trade secrets or proprietary know-how, or that adequate remedies will be available in the event of an unauthorized use or disclosure of such trade secrets and know-how. In addition, there can be no assurance that others will not obtain knowledge of these trade secrets through independent development or other access by legal means.
In addition to our own patents and patent applications and proprietary trade secrets and know-how, we are a party to certain licensing arrangements and other agreements authorizing us to use trade secrets, know-how and related technology and/or operate within the scope of certain patents owned by other entities. We also have licensed or sub-licensed intellectual property rights to third parties.
We have associated brand names with a number of our products, and we have approximately 175 U.S. trademark registrations (including applications for registration currently pending at the U.S. Patent and Trademark Office), and approximately 5,350 foreign counterparts, including both registrations and applications for registration. However, there can be no assurance that the trademark registrations will
31
provide meaningful protection against the use of similar trademarks by competitors, or that the value of our trademarks will not be diluted.
Because of the breadth and nature of our intellectual property rights and our business, we do not believe that any single intellectual property right (other than certain trademarks for which we intend to maintain the applicable registrations) is material to our business. Moreover, we do not believe that the termination of intellectual property rights expected to occur over the next several years, either individually or in the aggregate, will materially adversely affect our business, financial condition or results of operations.
EMPLOYEES
As of December 31, 2008, we employed approximately 12,600 people in our operations around the world. Approximately 2,200 of these employees are located in the U.S., while approximately 10,400 are located in other countries. We believe our relations with our employees are good. See "Item 7. Management's Discussion and Analysis of Financial Condition and Results of Operations—Recent Developments—2009 Cost Reduction Intiativies" for a discussion of our plan to reduce 1,250 positions.
ENVIRONMENTAL, HEALTH AND SAFETY MATTERS
General
We are subject to extensive federal, state, local and foreign laws, regulations, rules and ordinances relating to safety, pollution, protection of the environment and the generation, storage, handling, transportation, treatment, disposal and remediation of hazardous substances and waste materials. In the ordinary course of business, we are subject to frequent environmental inspections and monitoring and occasional investigations by governmental enforcement authorities. In addition, our production facilities require operating permits that are subject to renewal, modification and, in certain circumstances, revocation. Actual or alleged violations of safety laws, environmental laws or permit requirements could result in restrictions or prohibitions on plant operations, substantial civil or criminal sanctions, as well as, under some environmental laws, the assessment of strict liability and/or joint and several liability. Moreover, changes in environmental regulations could inhibit or interrupt our operations, or require us to modify our facilities or operations. Accordingly, environmental or regulatory matters may cause us to incur significant unanticipated losses, costs or liabilities.
Environmental, Health and Safety Systems
We are committed to achieving and maintaining compliance with all applicable environmental, health and safety ("EHS") legal requirements, and we have developed policies and management systems that are intended to identify the multitude of EHS legal requirements applicable to our operations, enhance compliance with applicable legal requirements, ensure the safety of our employees, contractors, community neighbors and customers and minimize the production and emission of wastes and other pollutants. Although EHS legal requirements are constantly changing and are frequently difficult to comply with, these EHS management systems are designed to assist us in our compliance goals while also fostering efficiency and improvement and minimizing overall risk to us.
EHS Capital Expenditures
We may incur future costs for capital improvements and general compliance under EHS laws, including costs to acquire, maintain and repair pollution control equipment. For the years ended December 31, 2008 , 2007 and 2006, our capital expenditures for EHS matters totaled $58 million, $69 million and $53 million, respectively. Since capital expenditures for these matters are subject to evolving regulatory requirements and depend, in part, on the timing, promulgation and enforcement of
32
specific requirements, we cannot provide assurance that our recent expenditures will be indicative of future amounts required under EHS laws.
Remediation Liabilities
We have incurred, and we may in the future incur, liability to investigate and clean up waste or contamination at our current or former facilities or facilities operated by third parties at which we may have disposed of waste or other materials. Similarly, we may incur costs for the cleanup of wastes that were disposed of prior to the purchase of our businesses. Under some circumstances, the scope of our liability may extend to damages to natural resources.
Under the U.S. Comprehensive Environmental Response, Compensation and Liability Act of 1980, as amended ("CERCLA"), and similar state laws, a current or former owner or operator of real property may be liable for remediation costs regardless of whether the release or disposal of hazardous substances was in compliance with law at the time it occurred, and a current owner or operator may be liable regardless of whether it owned or operated the facility at the time of the release. We have been notified by third parties of claims against us for cleanup liabilities at approximately 10 former facilities or third party sites, including, but not limited to, sites listed under CERCLA. Based on current information and past experiences at other CERCLA sites, we do not expect any of these third party claims to result in material liability to us.
In addition, under the U.S. Resource Conservation and Recovery Act of 1976, as amended ("RCRA"), and similar state laws, we may be required to remediate contamination originating from our properties as a condition to our hazardous waste permit. Some of our manufacturing sites have an extended history of industrial chemical manufacturing and use, including on-site waste disposal. We are aware of soil, groundwater or surface contamination from past operations at some of our sites, and we may find contamination at other sites in the future. For example, our Port Neches, Texas, and Geismar, Louisiana, facilities are the subject of ongoing remediation requirements under RCRA authority.
In June of 2006, an agreement was reached between the local regulatory authorities and our advanced materials site in Pamplona, Spain to relocate our manufacturing operations in order to facilitate new urban development desired by the city. Subsequently, as required by the authorities, soil and groundwater sampling was performed and followed by a quantitative risk assessment. Although unresolved at this time, some level of remediation of site contamination may be required in the future, but the estimated cost is unknown because the remediation approach and timing has not been determined.
By letter dated March 7, 2006, our Base Chemicals and Polymers facility in West Footscray, Australia, was issued a clean-up notice by the Australian (Victorian) EPA. The agency was concerned about soil and groundwater contamination emanating from the site. Although we fulfilled all initial requirements under the clean-up notice, the agency revoked the original clean-up notice on September 4, 2007 and issued a revised clean-up notice granting an extension due to "the complexity of contamination issues" at the site. The revised clean-up notice reflects the requirement for a more detailed program, with a deadline for the submission of a detailed site remediation action plan by March 31, 2009. We expect to respond to the EPA addressing their revised concerns. We can provide no assurance that the EPA will agree with our proposed plan or will not seek to institute additional requirements for the site. However, we do not believe the costs to us associated with this issue will be material.
In many cases, our potential liability arising from historical contamination is based on operations and other events occurring prior to our ownership of a business or specific facility. In these situations, we frequently obtained an indemnity agreement from the prior owner addressing remediation liabilities arising from pre-closing conditions. We have successfully exercised our rights under these contractual covenants for a number of sites and, where applicable, mitigated our ultimate remediation liability. We
33
cannot assure you, however, that all of such matters will be subject to indemnity, that the prior owner will honor its indemnity or that our existing indemnities will be sufficient to cover our liabilities for such matters.
Based on available information and the indemnification rights we believe are likely to be available, we believe that the costs to investigate and remediate known contamination will not have a material adverse effect on our financial condition, results of operations or cash flows. However, if such indemnities are unavailable or do not fully cover the costs of investigation and remediation or we are required to contribute to such costs, and if such costs are material, then such expenditures may have a material adverse effect on our financial condition, results of operations or cash flows. At the current time, we are unable to estimate the full cost, exclusive of indemnification benefits, to remediate any of the known contamination sites.
Environmental Reserves
We have accrued liabilities relating to anticipated environmental cleanup obligations, site reclamation and closure costs and known penalties. Liabilities are recorded when potential liabilities are either known or considered probable and can be reasonably estimated. Our liability estimates are based upon requirements placed upon the company by regulators, available facts, existing technology and past experience. The environmental liabilities do not include amounts recorded as asset retirement obligations. We had accrued $7 million and $8 million for environmental liabilities as of December 31, 2008 and 2007, respectively. Of these amounts, $4 million and $5 million were classified as accrued liabilities in our consolidated balance sheets as of December 31, 2008 and 2007, respectively, and $3 million and $3 million were classified as other noncurrent liabilities in our consolidated balance sheets as of December 31, 2008 and December 31, 2007, respectively. In certain cases, our remediation liabilities may be payable over periods of up to 30 years. We may incur losses for environmental remediation in excess of the amounts accrued; however, we are not able to estimate the amount or range of such potential excess.
Regulatory Developments
Under the EU's integrated pollution prevention and control directive ("IPPC"), EU member governments adopted rules and implemented a cross media (air, water and waste) environmental permitting program for individual facilities. Although the EU countries varied in their respective implementation of the IPPC permit program, we submitted on a timely basis all necessary IPPC permit applications required and received completed permits from the applicable government agencies. Based upon a review of those permits, the costs of compliance with the IPPC permit program are not material to our financial condition, results of operations or cash flows.
In December 2006, the EU parliament and EU council approved a new EU regulatory framework for chemicals called "REACH" (Registration, Evaluation and Authorization of Chemicals). REACH took effect on June 1, 2007, and the program it establishes will be phased in over 11 years. Under the regulation, companies that manufacture or import more than one ton of a chemical substance per year will be required to register such chemical substances and isolated intermediates in a central database. Use authorizations will be granted for a specific chemical if the applicants can show that any risk in using the chemical can be adequately controlled or, where there are no suitable alternatives available, if the applicant can demonstrate that the social and economic benefits of using the chemical outweigh the risks. In addition, specified uses of some hazardous substances may be restricted. Furthermore, all applicants will have to study the availability of alternative chemicals. If an alternative is available, an applicant will have to submit a "substitution" plan to the regulatory agency. The regulatory agency will only authorize persistent bio-accumulative and toxic substances if an alternative chemical is not available. The registration, evaluation and authorization phases of the program will require expenditures and resource commitments in order to, for example, develop information technology tools,
34
generate data, prepare and submit dossiers for substance registration, participate in consortia, obtain legal advice and reformulate products, if necessary. We have established a cross-business European REACH team that is working closely with our businesses to identify and list all substances purchased, manufactured or imported by or for us into the EU. Our pre-registration REACH compliance began on June 1, 2008, utilizing internal resources at nominal expense, and we met all chemical pre-registration requirements by the November 30, 2008 statutory deadline. We are currently proceeding with the registration of the high-volume and high-priority chemicals under the program. Although the total long-term cost for REACH compliance is not estimable at this time, we spent approximately $2 million and $3 million during the years ended December 31, 2008 and 2007, respectively, on REACH compliance.
Greenhouse Gas Regulation
In the EU and other jurisdictions committed to compliance with the Kyoto Protocol to the United Nations Framework Convention on Climate Change (the "Convention"), there is an increasing likelihood that our manufacturing sites will be affected in some way over the next few years by regulation or taxation of greenhouse gas ("GHG") emissions. In addition, although the U.S. is not a signatory to the Convention, several states, including California, are implementing their own GHG regulatory programs and a federal program in the U.S. is likely for the future. Several of our sites are subject to existing GHG legislation, but few have experienced or anticipate significant cost increases as a result, although it is likely that GHG emission restrictions will increase over time. Potential consequences of such restrictions include capital requirements to modify assets used to meet GHG restriction and/or increases in energy costs above the level of general inflation, as well as direct compliance costs. Currently, however, it is not possible to estimate the likely financial impact of potential future regulation on any of our sites.
Chemical Facility Anti-terrorism Rulemaking
The Department of Homeland Security ("DHS") issued the final rule of their "Chemical Facility Anti-Terrorism Standard" in 2007. The initial phase of the rule required all chemical facilities in the U.S. to evaluate their facilities against the DHS Appendix A list of "Chemicals of Interest." Facilities which have specified chemicals in designated quantities on the Appendix A list were required to submit a "Top Screen" to DHS in 2008. A Top Screen is a questionnaire completed by a facility having Chemicals of Interest in designated threshold quantities. In early 2008, we submitted Top Screens from several of our facilities. After reviewing the Top Screens, DHS determined that some of our sites were "High Risk" facilities. As a result, we were required to perform Security Vulnerability Assessments ("SVAs") at the High Risk sites. The SVAs were completed and sent to DHS during the fourth quarter of 2008. We are currently awaiting the final risk ranking from the DHS, based on their assessment of the SVAs. Any of the sites which are still considered High Risk after the DHS assessment will be required to develop site security plans based on a list of DHS risk-based performance standards. We are unable to determine the cost of security enhancements at our High Risk sites until the site security plans are developed. We anticipate this phase of the rule to be completed by mid-2009.
MTBE Developments
We produce MTBE, an oxygenate that is blended with gasoline to reduce vehicle air emissions and to enhance the octane rating of gasoline. Litigation or legislative initiatives restricting the use of MTBE in gasoline may subject us or our products to environmental liability or materially adversely affect our sales and costs. Because MTBE has contaminated some water supplies, its use has become controversial in the U.S. and elsewhere, and its use has been effectively eliminated in the U.S. market. Since 2007, we have marketed MTBE, either directly or through third parties, only to gasoline additive customers located outside the U.S., although there are additional costs associated with such
35
outside-U.S. sales which may result in decreased profitability compared to historical sales in the U.S. We may also elect to use all or a portion of our precursor tertiary butyl alcohol to produce saleable products other than MTBE. If we opt to produce products other than MTBE, necessary modifications to our facilities will require significant capital expenditures and the sale of such other products may produce a lower level of cash flow than that historically produced from the sale of MTBE.
Numerous companies, including refiners, manufacturers and sellers of gasoline, as well as manufacturers of MTBE, have been named as defendants in more than 150 cases in U.S. courts that allege MTBE contamination in groundwater. Many of these cases were settled after the parties engaged in mediation supervised by a court-appointed special settlement master. Beginning in March 2007 and continuing through December 2008, we have been named as a defendant in fourteen of these lawsuits, all of which are still pending. For more information, see "Item 3 Legal Proceedings—MTBE Litigation." The plaintiffs in the MTBE groundwater contamination cases generally seek compensatory damages, punitive damages, injunctive relief, such as monitoring and abatement, and attorney fees. We currently have insufficient information to meaningfully assess our potential exposure in these cases. We believe that some of our liability in these cases, if any, is likely covered by insurance and/or indemnity agreements with prior owners. It is possible that we could be named as a defendant in additional existing or future MTBE contamination cases. We cannot provide assurances that adverse results against us in existing or future MTBE contamination cases will not have a material adverse effect on our business, results of operations and financial position.
AVAILABLE INFORMATION
We maintain an internet website at http://www.huntsman.com. Our annual reports on Form 10-K, quarterly reports on Form 10-Q, current reports on Form 8-K and amendments to these reports are available free of charge through our website as soon as reasonably practicable after we file this material with the SEC. We also provide electronic or paper copies of our SEC filings free of charge upon request.
GLOSSARY OF CHEMICAL TERMS
APAO—amorphous polyalpha olefins
DEG—di-ethylene glycol
BDO—butane diol
DGA® Agent—DIGLYCOLAMINE® agent
EG—ethylene glycol
EO—ethylene oxide
EPS—expanded polystyrene
LAB—linear alkyl benzene
LAS—linear alkylbenzene sulfonate
LDPE—low density polyethylene
LER—liquid epoxy resins
LLDPE—linear low density polyethylene
LNG—liquefied natural gas
MEG—mono-ethylene glycol
36
MDI—methyl diphenyl diisocyanate
MTBE—methyl tertiary-butyl ether
PG—propylene glycol
PO—propylene oxide
Polyols—a substance containing several hydroxyl groups. A diol, triol and tetrol contain two, three and four hydroxyl groups respectively
TBA—tertiary-butyl alcohol
TBHP—tert-butyl hydroperoxide
TDI—toluene diisocyanate
TEG—tri-ethylene glycol
TiO2—titanium dioxide pigment
TPU—thermoplastic polyurethane
UPR—unsaturated polyester resin
Any of the following risks could materially and adversely affect our business, results of operations and financial condition.
RISKS RELATED TO OUR BUSINESS
We have a history of losses and may incur losses in the future.
We have incurred net losses in three of the last five fiscal years. Our history of losses may have a negative impact on our business, including our ability to fund operations, make capital expenditures and service debt obligations. Persistent continued losses likely would negatively affect our ability to meet such obligations over the long-term. Our history of losses may also increase our cost of borrowing and make it more difficult and/or expensive to take advantage of opportunities for growth.
Our industry is affected by global economic factors including risks associated with a recession and our customers' access to credit.
Our financial results are substantially dependent upon the overall economic conditions in the United States, the European Union and Asia. A recession in any of these locations or globally—or public perceptions that result in declining economic conditions—could substantially decrease the demand for our products and adversely affect our business. Indeed, as a result of the current economic downturn, we have experienced decreased demand for many of our products. Moreover, many of our customers rely on access to credit to adequately fund their operations. The inability of our customers to access credit facilities will adversely affect our business by reducing our sales, increasing our exposure to accounts receivable bad debts and reducing our profitability.
The current negative worldwide economic conditions and market instability also makes it increasingly difficult for us, our customers and our suppliers to forecast demand trends. A continued decline in demand could place further pressure on our results of operations. The timing and extent of any changes to currently prevailing market conditions is uncertain and supply and demand may be unbalanced at any time. As a consequence, we are unable to accurately predict the extent or duration of business cycles or their effect on our financial condition or results of operations, and can give no assurances as to the timing, extent or duration of the current or future business cycles.
37
Significant price volatility or interruptions in supply of our raw materials may result in increased costs that we may be unable to pass on to our customers, which could reduce our profitability.
The prices of the raw materials that we purchase from third parties are cyclical and volatile. We purchase a substantial portion of these raw materials from third party suppliers, and, following the dispositions of our base chemicals and polymers businesses in 2007 and 2006, respectively, our purchases from third party suppliers have significantly increased. The cost of these raw materials represents a substantial portion of our operating expenses. The prices for a number of these raw materials generally follow price trends of, and vary with market conditions for, crude oil and natural gas feedstocks, which are highly volatile and cyclical.
The feedstocks and other raw materials we consume are generally commodity products that are readily available at market prices. We frequently enter into supply agreements with particular suppliers, but disruptions of existing supply arrangements could substantially impact our profitability. If certain of our suppliers are unable to meet their obligations under present supply agreements, we may be forced to pay higher prices to obtain the necessary raw materials from other sources and we may not be able to increase prices for our finished products to recoup the higher raw materials costs. In addition, if any of the raw materials that we use become unavailable within the geographic area from which they are now sourced, then we may not be able to obtain suitable or cost effective substitutes. Any interruption in the supply of raw materials could increase our costs or decrease our revenues, which could reduce our cash flow.
Our supply agreements typically provide for market-based pricing and provide us only limited protection against price volatility. While we attempt to match cost increases with corresponding product price increases, we are not always able to raise product prices immediately or at all. Timing differences between raw material prices, which may change daily, and contract product prices, which in many cases are negotiated only monthly or less often, have had and may continue to have a negative effect on our cash flow. Any cost increase that we are not able to pass on to our customers could have a material adverse effect on our business, results of operations, financial condition and liquidity.
We are subject to the risk of loss resulting from nonpayment or nonperformance by our customers.
As a result of the current economic downturn, some of our customers have initiated or are contemplating initiating bankruptcy proceedings. Our credit procedures and policies may not be adequate to eliminate customer credit risk. Our customers may experience financial difficulties, including bankruptcies, restructurings and liquidations. These and other financial problems that may be experienced by our customers, as well as potential financial weakness in our industry, may increase our risk in extending trade credit to customers. A significant adverse change in a customer relationship or in a customer's financial position could cause us to limit or discontinue business with that customer, require us to assume more credit risk relating to that customer's receivables or limit our ability to collect accounts receivable from that customer, all of which could have a material adverse effect on our business, results of operations, financial condition and liquidity.
Our available cash and access to additional capital may be limited by our significant leverage, which could restrict our ability to grow our businesses.
We have a significant amount of indebtedness outstanding. As of December 31, 2008, we had total consolidated outstanding indebtedness of approximately $3,882 million (including the current portion of long-term debt) and a debt to total capitalization ratio of approximately 71%. This balance does not reflect approximately $446 million under our off-balance sheet A/R Securitization Program at
38
December 31, 2008. Our outstanding debt could have important consequences for our businesses, including the following:
We require substantial capital to finance our operations and continued growth, and we may incur substantial additional debt from time to time for a variety of purposes, including acquiring additional businesses. However, our existing debt instruments contain restrictive covenants. Among other things, these covenants limit or prohibit our ability to incur more debt; make prepayments of other debt; pay dividends, redeem stock or make other distributions; issue capital stock; make investments; create liens; enter into transactions with affiliates; enter into sale and leaseback transactions; merge or consolidate; and transfer or sell assets.
Our debt instruments also require us to comply with certain financial covenants under certain circumstances. For example, the leverage covenant applicable to our $650 million revolving facility (the "Revolving Facility") under our senior secured credit facilities (the "Senior Credit Facilities") requires us to maintain a debt to EBITDA ratio of 3.75 to 1 when loans or letters of credit are outstanding under the Revolving Facility. As of December 31, 2008, we were in compliance with the covenant. However, if we violate this covenant, it could lead to an event of default under the Senior Credit Facilities, which could require us to pay off the balance of the Senior Credit Facilities in full and result in a loss of such facilities. Given the current credit environment, it may not be possible for us to replace the Senior Credit Facilities with a substitute facility on terms acceptable to us, or at all.
We also must comply with certain financial covenants under our $575 million A/R Securitization Program. Failure to meet such covenants could lead to an event of default and could require us to cease use of such facility and collect our trade receivables until our obligations are paid in full. A default under the accounts receivable securitization program would also constitute an event of default under our Senior Credit Facilities, which could require us to pay off the balance of the Senior Credit Facilities in full and result in a loss of such facilities. In the event the debt under one or more of the facilities is accelerated, cross-default provisions in other debt instruments of our Company would likely be triggered, which would likely have a material and adverse impact on our Company's financial condition.
Also, if we undergo a change of control, our debt instruments may require us to make an offer to purchase certain of our notes. Under these circumstances, we may also be required to repay indebtedness under our Senior Credit Facilities prior to our notes. In this event, we may not have the financial resources necessary to purchase such notes, which would result in an event of default under the indentures governing such notes.
As of December 31, 2008, the current portion of our long term debt totaled approximately $205 million. As of December 31, 2008, we had combined outstanding variable rate borrowings of
39
approximately $2 billion. Assuming a 1% increase in interest rates, without giving effect to any interest rate hedges, our annual interest rate expense would increase by approximately $18 million. If we are unable to generate sufficient cash flow or are otherwise unable to obtain the funds required to meet payments of principal and interest on our indebtedness, or if we otherwise fail to comply with the various covenants in the instruments governing our indebtedness, we could be in default under the terms of those instruments. In the event of a default, a holder of the indebtedness could elect to declare all the funds borrowed under those instruments to be due and payable together with accrued and unpaid interest, the creditors under our Senior Credit Facilities could elect to terminate their commitments thereunder and we or one or more of our subsidiaries, could be forced into bankruptcy or liquidation. Any of the foregoing consequences could have a material adverse effect on our business, results of operations and financial condition.
We may not be able to obtain funding because of the deterioration of the credit and capital markets. This may hinder or prevent us from meeting our future capital needs and from refinancing our existing indebtedness.
Global financial markets and economic conditions have been, and continue to be, disrupted and volatile, which has caused a substantial deterioration in the credit and capital markets. These conditions, along with significant write-offs in the financial services sector and the re-pricing of credit risk, will likely continue and may make it difficult to obtain funding for our ongoing capital needs.
In particular, the cost of raising money in the debt and equity capital markets has increased substantially while the availability of funds from those markets generally has diminished significantly. Also, as a result of concerns about the stability of financial markets generally and the solvency of counterparties specifically, the cost of obtaining money from the credit markets generally has increased as many lenders and institutional investors have increased interest rates, enacted tighter lending standards, refused to refinance existing debt at maturity on terms that are similar to existing debt, and reduced, or in some cases ceased, to provide funding to borrowers.
Due to these factors, we cannot be certain that funding for our capital needs from credit and capital markets will be available if needed and, to the extent required, on acceptable terms. In addition, we may be unable to refinance our existing indebtedness on terms that are acceptable to us or at all. If we cannot meet our capital needs or refinance our existing indebtedness, it could have a material adverse effect on our financial position and results of operations.
A downgrade in the ratings of the securities of our Company or our subsidiaries could result in increased interest and other financial expenses related to future borrowings of our Company or our subsidiaries and could restrict our access to additional capital or trade credit.
Standard and Poor's Ratings Services and Moody's Investors Service maintain credit ratings for us. Each of these ratings is currently below investment grade. Any decision by these or other ratings agencies to downgrade such ratings in the future could result in increased interest and other financial expenses relating to our future borrowings and could restrict our ability to obtain additional financing on satisfactory terms. In addition, any downgrade could restrict our access to, and negatively impact the terms of, trade credit extended by our suppliers of raw materials.
Loss of key members of our management could disrupt our business.
We depend on the continued employment and performance of our senior executives and other key members of management. If any of these individuals resigns or becomes unable to continue in his present role and is not adequately replaced, our business operations and our ability to implement our growth strategies could be materially disrupted. We generally do not have employment agreements with, and we do not maintain any "key man" life insurance for, any of our executive officers.
40
Uncertainties following the termination of the Merger may result in a loss of employees and may otherwise materially adversely affect our business and operations.
Our future results of operations will depend in part upon our ability to retain existing highly skilled and qualified employees and to attract new employees. A number of our employees are highly skilled scientists and highly trained technicians, and failure to continue to attract and retain such individuals could materially adversely affect our ability to compete. In addition, current and prospective employees may experience uncertainty about their roles following the termination of the Merger. This uncertainty may materially adversely affect our ability to attract and retain key management, sales, marketing, technical and other personnel. Any inability to retain key personnel could have an adverse effect on our ability to operate the business as a stand-alone enterprise.
Natural or other disasters could disrupt our business and result in loss of revenue or in higher expenses.
Any serious disruption at any of our facilities due to hurricane, fire, earthquake, flood, terrorist attack or any other natural or man-made disaster could impair our ability to use our facilities and have a material adverse impact on our revenues and increase our costs and expenses. If there is a natural disaster or other serious disruption at any of these facilities, it could impair our ability to adequately supply our customers and negatively impact our operating results. In addition, many of our current and potential customers are concentrated in specific geographic areas. A disaster in one of these regions could have a material adverse impact on our operations, operating results and financial condition.
Our results of operations may be adversely affected by fluctuations in currency exchange rates and international business risks.
We conduct a majority of our business operations outside the U.S., and these operations are subject to risks normally associated with international operations. These risks include the need to convert currencies that may be received for our products into currencies in which we purchase raw materials or pay for services, which could result in a gain or loss depending on fluctuations in exchange rates. In addition, we translate our local currency financial results into U.S. dollars based on average exchange rates prevailing during the reporting period or the exchange rate at the end of that period. During times of a strengthening U.S. dollar, our reported international sales and earnings may be reduced because the local currency may translate into fewer U.S. dollars. Because we currently have significant operations located outside the United States, we are exposed to fluctuations in global currency rates which may result in gains or losses on our financial statements.
Other risks of international operations include trade barriers, tariffs, exchange controls, national and regional labor strikes, social and political risks, general economic risks and required compliance with a variety of foreign laws, including tax laws. Furthermore, in foreign jurisdictions where process of law may vary from country to country, we may experience difficulty in enforcing agreements. In jurisdictions where bankruptcy laws and practices may vary, we may experience difficulty collecting foreign receivables through foreign legal systems. The occurrence of these risks, among others, could disrupt the businesses of our international subsidiaries, which could significantly affect their ability to make distributions to us.
Demand for many of our products is cyclical, and we may experience depressed market conditions for such products.
Historically, the markets for many of our products have experienced alternating periods of tight supply, causing prices and profit margins to increase, followed by periods of capacity additions, resulting in oversupply and declining prices and profit margins. The volatility these markets experience occurs as a result of changes in the supply and demand for products, changes in energy prices and
41
changes in various other economic conditions around the world. This cyclicality and volatility of our industry results in significant fluctuations in profits and cash flow from period to period and over the business cycle. Currently, we are confronted by depressed market conditions and such conditions could exist for a prolonged period.
The industries in which we compete are highly competitive, and we may not be able to compete effectively with our competitors that have greater financial resources, which could have a material adverse effect on our business, results of operations and financial condition.
The industries in which we operate are highly competitive. Among our competitors are some of the world's largest chemical companies and major integrated petroleum companies that have their own raw material resources. Some of these companies may be able to produce products more economically than we can. In addition, some of our competitors have greater financial resources, which may enable them to invest significant capital into their businesses, including expenditures for research and development. If any of our current or future competitors develops proprietary technology that enables them to produce products at a significantly lower cost, our technology could be rendered uneconomical or obsolete. Moreover, certain of our businesses use technology that is widely available. Accordingly, barriers to entry, apart from capital availability, may be low in certain product segments of our business, and the entrance of new competitors into the industry may reduce our ability to capture improving profit margins in circumstances where capacity utilization in the industry is increasing. Further, petroleum-rich countries have become more significant participants in the petrochemical industry and may expand this role significantly in the future. Increased competition in any of our businesses could compel us to reduce the prices of our products, which could result in reduced profit margins and loss of market share and have a material adverse effect on our business, results of operations, financial condition and liquidity.
Our operations involve risks that may increase our operating costs, which could reduce our profitability.
Although we take precautions to enhance the safety of our operations and minimize the risk of disruptions, our operations are subject to hazards inherent in the manufacturing and marketing of differentiated and commodity chemical products. These hazards include: chemical spills, pipeline leaks and ruptures, storage tank leaks, discharges or releases of toxic or hazardous substances or gases and other hazards incident to the manufacturing, processing, handling, transportation and storage of dangerous chemicals. We are also potentially subject to other hazards, including natural disasters and severe weather; explosions and fires; transportation problems, including interruptions, spills and leaks; mechanical failures; unscheduled downtimes; labor difficulties; remediation complications; and other risks. Many potential hazards can cause bodily injury and loss of life, severe damage to or destruction of property and equipment and environmental damage, and may result in suspension of operations and the imposition of civil or criminal penalties and liabilities. Furthermore, we are subject to present and future claims with respect to workplace exposure, exposure of contractors on our premises as well as other persons located nearby, workers' compensation and other matters.
We maintain property, business interruption and casualty insurance policies which we believe are in accordance with customary industry practices, but we are not fully insured against all potential hazards and risks incident to our business. We maintain property damage and business interruption insurance policies and products liability and sudden and accidental insurance policies, as well as insurance policies covering other types of risks, including pollution legal liability insurance. Each of these insurance policies is subject to customary exclusions, deductibles and coverage limits, in accordance with industry standards and practices. As a result of market conditions, premiums and deductibles for certain insurance policies can increase substantially and, in some instances, certain insurance may become unavailable or available only for reduced amounts of coverage. If we were to incur a significant liability
42
for which we were not fully insured, it could have a material adverse effect on our business, results of operations, financial condition and liquidity.
In addition, we are subject to various claims and litigation in the ordinary course of business. We are a party to various pending lawsuits and proceedings. It is possible that judgments could be rendered against us in these cases or others in which we could be uninsured or not covered by indemnity and beyond the amounts that we currently have reserved or anticipate incurring for such matters.
Financial difficulties and related problems at our vendors, suppliers and other business partners could result in a disruption in our operations and have a material adverse effect on our business.
We rely on numerous vendors and suppliers and collaborations with other industry participants to provide us with chemicals, feedstocks and other raw materials, along with energy sources and, in certain cases, facilities, that we need to operate our business. Recently, the chemical industry, including potentially certain companies on which we rely, has experienced severe financial difficulties, including issues with solvency. We believe that certain of our business partners may be experiencing or may experience cash flow problems, which could be further aggravated by recessionary industry conditions. Some of these companies may be forced to reduce their output, shut down their operations or file for bankruptcy protection. Financial difficulties or solvency problems at companies on which we rely could materially adversely affect their ability to provide us with the raw materials, energy sources or facilities that we need, which could disrupt our operations, including the production of certain of our products. In addition, it could be difficult to find replacements for certain of our business partners without incurring significant delays or cost increases.
We are subject to many environmental and safety regulations that may result in unanticipated costs or liabilities, which could reduce our profitability.
We are subject to extensive federal, state, local and foreign laws, regulations, rules and ordinances relating to pollution, protection of the environment and human health, and the generation, storage, handling, transportation, treatment, disposal and remediation of hazardous substances and waste materials. Actual or alleged violations of environmental laws or permit requirements could result in restrictions or prohibitions on plant operations, substantial civil or criminal sanctions, as well as, under some environmental laws, the assessment of strict liability and/or joint and several liability. Moreover, changes in environmental regulations could inhibit or interrupt our operations, or require us to modify our facilities or operations. Accordingly, environmental or regulatory matters may cause us to incur significant unanticipated losses, costs or liabilities, which could reduce our profitability. See "Item 1. Business—Environmental, Health and Safety Matters" and "Item 3. Legal Proceedings" included elsewhere in this Annual Report on Form 10-K for the year ended December 31, 2008.
In addition, we could incur significant expenditures in order to comply with existing or future environmental or safety laws. Capital expenditures and costs relating to environmental or safety matters will be subject to evolving regulatory requirements and will depend on the timing of the promulgation and enforcement of specific standards which impose requirements on our operations. Capital expenditures and costs beyond those currently anticipated may therefore be required under existing or future environmental or safety laws.
Furthermore, we may be liable for the costs of investigating and cleaning up environmental contamination on or from our properties or at off-site locations where we disposed of or arranged for the disposal or treatment of hazardous materials or from disposal activities that pre-dated our purchase of our businesses. We may therefore incur additional costs and expenditures beyond those currently anticipated to address all such known and unknown situations under existing and future environmental laws. See "Item 1. Business—Environmental, Health and Safety Matters" and "Item 3. Legal
43
Proceedings" included elsewhere in this Annual Report on Form 10-K for the year ended December 31, 2008.
Existing or future litigation or legislative initiatives restricting the use of MTBE in gasoline may subject us or our products to environmental liability, materially reduce our sales and/or materially increase our costs.
We produce MTBE, an oxygenate that is blended with gasoline to reduce vehicle air emissions and to enhance the octane rating of gasoline. Litigation or legislative initiatives restricting the use of MTBE in gasoline may subject us or our products to environmental liability or materially adversely affect our sales and costs. Because MTBE has contaminated some water supplies, its use has become controversial in the U.S. and elsewhere, and its use has been effectively eliminated in the U.S. market. We currently market MTBE, either directly or through third parties, to gasoline additive customers located outside the U.S., although there are additional costs associated with such outside-U.S. sales which may result in decreased profitability compared to historical sales in the U.S. We may also elect to use all or a portion of our precursor tertiary butyl alcohol to produce saleable products other than MTBE. If we opt to produce products other than MTBE, necessary modifications to our facilities will require significant capital expenditures and the sale of such other products may produce a lower level of cash flow than that historically produced from the sale of MTBE.
Numerous companies, including refiners, manufacturers and sellers of gasoline, as well as manufacturers of MTBE, have been named as defendants in more than 150 cases in U.S. courts that allege MTBE contamination in groundwater. Many of these cases were settled after the parties engaged in mediation supervised by a court-appointed special settlement master. Beginning in March 2007 and continuing through December 2008, we have been named as a defendant in fourteen of these lawsuits, all of which are still pending. For more information, see "Item 3 Legal Proceedings—MTBE Litigation." The plaintiffs in the MTBE groundwater contamination cases generally seek compensatory damages, punitive damages, injunctive relief, such as monitoring and abatement, and attorney fees. We currently have insufficient information to meaningfully assess our potential exposure in these cases. We believe that some of our liability in these cases, if any, is likely covered by insurance and/or indemnity agreements with prior owners. It is possible that we could be named as a defendant in additional existing or future MTBE contamination cases. We cannot provide assurances that adverse results against us in existing or future MTBE contamination cases will not have a material adverse effect on our business, results of operations and financial position.
Our business is dependent on our intellectual property. If our patents are declared invalid or our trade secrets become known to our competitors, our ability to compete may be adversely affected.
Proprietary protection of our processes, apparatuses and other technology is important to our business. Consequently, we may have to rely on judicial enforcement of our patents and other proprietary rights. While a presumption of validity exists with respect to patents issued to us in the U.S., there can be no assurance that any of our patents will not be challenged, invalidated, circumvented or rendered unenforceable. Furthermore, if any pending patent application filed by us does not result in an issued patent, or if patents are issued to us, but such patents do not provide meaningful protection of our intellectual property, then our ability to compete may be adversely affected. Additionally, our competitors or other third parties may obtain patents that restrict or preclude our ability to lawfully produce or sell our products in a competitive manner, which could have a material adverse effect on our business, results of operations, financial condition and liquidity.
We also rely upon unpatented proprietary know-how and continuing technological innovation and other trade secrets to develop and maintain our competitive position. While it is our policy to enter into confidentiality agreements with our employees and third parties to protect our intellectual property, these confidentiality agreements may be breached, may not provide meaningful protection for
44
our trade secrets or proprietary know-how, or adequate remedies may not be available in the event of an unauthorized use or disclosure of our trade secrets and know-how. In addition, others could obtain knowledge of our trade secrets through independent development or other access by legal means. The failure of our patents or confidentiality agreements to protect our processes, apparatuses, technology, trade secrets or proprietary know-how could have a material adverse effect on our business, results of operations, financial condition and liquidity.
Future acquisitions, partnerships and joint ventures may require significant resources and/or result in unanticipated adverse consequences that could have a material adverse effect on our business, results of operations and financial condition.
In the future we may seek to grow our Company and businesses by making acquisitions or entering into partnerships and joint ventures. Any future acquisition, partnership or joint venture may require that we make a significant cash investment, issue stock or incur substantial debt. In addition, acquisitions, partnerships or investments may require significant managerial attention, which may be diverted from our other operations. These capital, equity and managerial commitments may impair the operation of our businesses. Any future acquisitions of businesses or facilities, could entail a number of additional risks, including:
We have incurred indebtedness to finance past acquisitions. We may finance future acquisitions with additional indebtedness. We could face the financial risks associated with incurring additional indebtedness such as reducing our liquidity and access to financing markets and increasing the amount of cash flow required to service such indebtedness, which could have a material adverse effect on our business, results of operations and financial condition.
If our subsidiaries do not make sufficient distributions to us, then we will not be able to make payment on our debts.
With the exception of our Convertible Notes, our debt is generally the exclusive obligation of Huntsman International and the guarantors of such debt and not of any of our other subsidiaries. Because a significant portion of our operations are conducted by these other subsidiaries, our cash flow and our ability to service indebtedness, including our ability to pay the interest on our debt when due and principal of such debt at maturity, are dependent to a large extent upon cash dividends and distributions or other transfers from non-guarantor subsidiaries. Any payment of dividends, distributions, loans or advances by our non-guarantor subsidiaries to us could be subject to restrictions on dividends or repatriation of earnings under applicable local law, monetary transfer restrictions and foreign currency exchange regulations in the jurisdictions in which our subsidiaries operate, and any restrictions imposed by the current and future debt instruments of our non-guarantor subsidiaries. In addition, payments to us by our subsidiaries are contingent upon our non-guarantor subsidiaries' earnings.
Our subsidiaries are separate and distinct legal entities and, except for our guarantor subsidiaries, have no obligation, contingent or otherwise, to pay any amounts due on our debt or to make any funds available therefor, whether by dividends, loans, distributions or other payments, and do not guarantee the payment of interest on, or principal of, our debt. Any right that we have to receive any assets of
45
any of our subsidiaries that are not guarantors upon the liquidation or reorganization of any such subsidiary, and the consequent right of holders of notes to realize proceeds from the sale of their assets, will be structurally subordinated to the claims of that subsidiary's creditors, including trade creditors and holders of debt issued by that subsidiary.
Terrorist attacks, such as the attacks that occurred on September 11, 2001, the continuing military action in Iraq, general instability in various OPEC member and other energy-producing nations, the threat of other attacks or acts of war in the U.S. and abroad and increased security regulations related to our industry could adversely affect our business.
The attacks of September 11, 2001, and subsequent events, including the continuing military action in Iraq, have caused instability in the U.S. and other financial markets and have led, and may continue to lead, to further armed hostilities, prolonged military action in Iraq, or further acts of terrorism in the U.S. or abroad, which could cause further instability in financial markets. Current regional tensions and conflicts in various OPEC member and other energy-producing nations, including the continuing military action in Iraq, have caused, and may cause further, increases in raw material costs, particularly natural gas and crude oil based feedstocks, which are used in our operations. The uncertainty surrounding the threat of further armed hostilities, military action or acts of terrorism may impact any or all of our physical facilities and operations, which are located in North America, Europe, Australia, Asia, Africa, South America and the Middle East, or those of our customers. Furthermore, the terrorist attacks, subsequent events and future developments in any of these areas may result in reduced demand from our customers for our products. A terrorist attack on any of our significant facilities could have a material adverse effect on our business. In addition, local, state and federal governments have begun a regulatory process that could lead to new regulations impacting the security of chemical plant locations and the transportation of hazardous chemicals, which could result in higher operating costs. These developments will subject our worldwide operations to increased risks and, depending on their magnitude, could have a material adverse effect on our business, results of operations, financial condition and liquidity.
RISKS RELATED TO OUR COMMON STOCK
Our stock price has been and may continue to be subject to large fluctuations.
We have experienced significant fluctuations in our stock price and share trading volume in the past and may continue to do so. The trading price of our common stock has been and may continue to be subject to wide fluctuations in response to a variety of issues, including broad market factors that may have a material adverse impact on our stock price, regardless of actual performance. The following factors could affect our stock price:
46
Shares available for future sale may cause our common stock price to decline, which may negatively impact the trading price of our common stock.
Sales of substantial numbers of additional shares of our common stock, or the perception that such sales could occur, may cause prevailing market prices for shares of our common stock to decline. In connection with the Settlement Agreement, we issued $250 million of our Convertible Notes to certain Apollo affiliates. These notes are convertible into our common stock at any time, at the holder's option, and interest is payable either in cash or, at our option, in shares of our common stock. At maturity, we may, at our option, pay the principal amount of the notes in shares of our common stock. We agreed to use our reasonable best efforts to register the resale of our common stock issuable upon conversion of the notes or as payment of interest or principal thereon under the Securities Act. Any sales of our shares of common stock issued in connection with the notes may negatively impact the trading price of our common stock.
We have the ability to issue additional equity securities, which would lead to further dilution of our issued and outstanding common stock.
The issuance of additional equity securities would result in dilution of then-existing stockholders' equity interests in us. Our certificate of incorporation authorizes our Board of Directors, without stockholder approval, to establish one or more series of preferred stock and to determine, with respect to any series of preferred stock, the number of shares in that series and the terms, rights and limitations of that series. If we issue additional convertible notes or convertible preferred stock, a subsequent conversion may dilute the current common stockholders' interest. Our Board of Directors has no present intention of issuing any such convertible instruments, but reserves the right to do so in the future. In addition, we may issue additional shares of common stock under our equity incentive plans.
Certain provisions contained in our certificate of incorporation and bylaws could discourage a takeover attempt, which may reduce or eliminate the likelihood of a change of control transaction and, therefore, limit your ability to sell our common stock at a price higher than the current market value.
Certain provisions contained in our certificate of incorporation and bylaws, such as a classified Board of Directors, limitations on stockholder proposals at meetings of stockholders and the inability of stockholders to call special meetings and certain provisions of Delaware law, could make it more difficult for a third party to acquire control of our company, even if some of our stockholders considered such a change of control to be beneficial. Our certificate of incorporation also authorizes our Board of Directors to issue preferred stock without stockholder approval. Therefore, our Board of Directors could elect to issue preferred stock that has special voting or other rights that could make it even more difficult for a third party to acquire us, which may reduce or eliminate your ability to sell our common stock at a price higher than the current market value.
The declaration of dividends by our Company is subject to the discretion of our Board of Directors and there can be no assurance that we will continue to pay dividends.
Over the past two years we have paid quarterly dividends on our common stock. The declaration of dividends by our Company is subject to the discretion of our Board of Directors. Our Board of Directors takes into account such matters as general business conditions, our financial results, expected liquidity and capital expenditure requirements, contractual, legal or regulatory restrictions on the payment of dividends, the effect on our debt ratings and such other factors as our Board of Directors may deem relevant, and we can provide no assurance that we will continue to pay dividends on our common stock.
47
Jon M. Huntsman, Peter R. Huntsman and the Huntsman family, through HMP Equity Trust and other of their affiliates, may be deemed to control approximately 30% of our outstanding common stock, and their interests may conflict with those of other stockholders or our Company.
Jon M. Huntsman, Peter R. Huntsman and other members of the Huntsman family, through HMP Equity Trust and other of their affiliates, may be deemed to control approximately 30% of our outstanding common stock. Through their interests, they may have the ability to substantially impact:
The interests and objectives of the Huntsman family may be different from those of our Company or our other stockholders, and the Huntsman family may vote their common stock in a manner that may adversely affect our other stockholders.
Jon M. Huntsman and Peter R. Huntsman are directors of our Company and they control HMP Equity Trust. This may create conflicts of interest because these directors have responsibilities to HMP Equity Trust and its beneficial owners. Their duties to HMP Equity Trust and its beneficial owners may conflict with their duties as directors of our Company regarding business dealings between HMP Equity Trust and us and other matters. The resolution of these conflicts may not always be in our or our stockholders' best interest.
ITEM 1B. UNRESOLVED STAFF COMMENTS
As of December 31, 2008, we did not have any unresolved comments from the staff of the SEC.
We own or lease chemical manufacturing and research facilities in the locations indicated in the list below which we believe are adequate for our short-term and anticipated long-term needs. We own or lease office space and storage facilities throughout the U.S. and in many foreign countries. Our principal executive offices are located at 500 Huntsman Way, Salt Lake City, Utah 84108. The following is a list of our material owned or leased properties where manufacturing, research and main office facilities are located.
Location
|
Business Segment | Description of Facility | ||
|---|---|---|---|---|
Salt Lake City, Utah |
Corporate and Other | Executive Offices | ||
The Woodlands, Texas(1) |
Various | Operating Headquarters, Global Technology Center | ||
Geismar, Louisiana(2)(7) |
Polyurethanes | MDI, Nitrobenzene(3), Aniline(3) and Polyols Manufacturing Facilities and Polyurethanes Systems House | ||
Rozenburg, Netherlands(1) |
Polyurethanes | MDI Manufacturing Facility, Polyols Manufacturing Facilities and Polyurethanes Systems House | ||
Shanghai, China |
Polyurethanes | MDI Finishing Facilities,Global Technology Center | ||
Deerpark, Australia |
Polyurethanes | Polyurethane Systems House | ||
Cartagena, Colombia |
Polyurethanes | Polyurethane Systems House | ||
Deggendorf, Germany |
Polyurethanes | Polyurethane Systems House |
48
Location
|
Business Segment | Description of Facility | ||
|---|---|---|---|---|
Ternate, Italy |
Polyurethanes | Polyurethane Systems House | ||
Shanghai, China(1) |
Polyurethanes | Polyurethane Systems House, Global Technology Center | ||
Thane (Maharashtra), India(1) |
Polyurethanes | Polyurethane Systems House | ||
Samuprakam, Thailand(1) |
Polyurethanes | Polyurethane Systems House | ||
Kuan Yin, Taiwan(1) |
Polyurethanes | Polyurethane Systems House | ||
Tlalnepantla, Mexico |
Polyurethanes | Polyurethane Systems House | ||
Mississauga, Ontario(1) |
Polyurethanes | Polyurethane Systems House | ||
Dammam, Saudi Arabia(3) |
Polyurethanes | Polyurethane Systems House | ||
Auburn Hills, Michigan(1) |
Polyurethanes | Polyurethane Research Facility | ||
Everberg, Belgium |
Polyurethanes and Performance Products | Polyurethane and Performance Products Regional Headquarters/Global Technology Center | ||
Gateway West, Singapore(1) |
Polyurethanes, Performance Products and Materials and Effects | Commercial/Administration Center | ||
Derry, New Hampshire(1) |
Polyurethanes | TPU Research Facility | ||
Ringwood, Illinois(1) |
Polyurethanes | TPU Manufacturing Facility | ||
Osnabrück, Germany |
Polyurethanes | TPU Manufacturing Facility/ Polyurethane Systems House | ||
Wilton, U.K. |
Polyurethanes | Aniline and Nitrobenzene Manufacturing Facilities | ||
Port Neches, Texas |
Polyurethanes and Performance Products | Olefins, EO, EG, Surfactants, Amines and PO Manufacturing Facilities | ||
Bergkamen, Germany |
Materials and Effects | Synthesis Facility | ||
Monthey, Switzerland |
Materials and Effects | Resins and Synthesis Facility | ||
Pamplona, Spain |
Materials and Effects | Resins and Synthesis Facility | ||
McIntosh, Alabama |
Materials and Effects | Resins and Synthesis Facility | ||
Chennai, India(4) |
Materials and Effects | Resins and Synthesis Facility | ||
Bad Saeckingen, Germany(1) |
Materials and Effects | Formulating Facility | ||
Duxford, U.K. |
Materials and Effects | Formulating Facility | ||
Sadat City, Egypt |
Materials and Effects | Formulating Facility | ||
Taboão da Serra, Brazil |
Materials and Effects | Formulating Facility | ||
Panyu, China(1)(5) |
Materials and Effects | Formulating Facility | ||
East Lansing, Michigan |
Materials and Effects | Formulating Facility | ||
Istanbul, Turkey(1) |
Materials and Effects | Formulating Facility | ||
Los Angeles, California |
Materials and Effects | Formulating Facility | ||
Langweid am Leich, Germany(1) |
Materials and Effects | Formulating Facility | ||
Schweizerhalle, Switzerland(1) |
Materials and Effects | Formulating Facility | ||
Charlotte, North Carolina(1) |
Materials and Effects | Formulating Facility | ||
Basel, Switzerland(1) |
Materials and Effects | Synthesis Facility | ||
Samutsakorn (Mahachai), Thailand(1) |
Materials and Effects | Synthesis Facility | ||
Atotonilquillo, Mexico |
Materials and Effects | Synthesis Facility | ||
Panyu, China(1) |
Materials and Effects | Production Facility | ||
High Point, North Carolina(1) |
Materials and Effects | Research Facility | ||
Conroe, Texas |
Performance Products | Amines Manufacturing Facility | ||
Petfurdo, Hungary(1) |
Performance Products | Amines Manufacturing Facility | ||
Llanelli, U.K. |
Performance Products | Amines Manufacturing Facility |
49
Location
|
Business Segment | Description of Facility | ||
|---|---|---|---|---|
Freeport, Texas(1) |
Performance Products | Amines Manufacturing Facility | ||
Jurong Island, Singapore(1) |
Performance Products | Amines Manufacturing Facility | ||
Chocolate Bayou, Texas(1) |
Performance Products | LAB Manufacturing Facility | ||
Pensacola, Florida(1) |
Performance Products | Maleic Anhydride Manufacturing Facility | ||
Dayton, Texas |
Performance Products | Surfactant Manufacturing Facility | ||
Botany, Australia |
Performance Products | Surfactant/EG Manufacturing Facility | ||
St. Mihiel, France |
Performance Products | Surfactant Manufacturing Facility | ||
Lavera, France(1) |
Performance Products | Surfactant Manufacturing Facility | ||
Castiglione, Italy |
Performance Products | Surfactant Manufacturing Facility | ||
Patrica/Frosinone, Italy |
Performance Products | Surfactant Manufacturing Facility | ||
Barcelona, Spain(1) |
Performance Products | Surfactant Manufacturing Facility | ||
Melbourne, Australia |
Performance Products | Research Facility | ||
Greatham, U.K. |
Pigments | Titanium Dioxide Manufacturing Facility | ||
Grimsby, U.K(6) |
Pigments | Titanium Dioxide Manufacturing Facility | ||
Calais, France |
Pigments | Titanium Dioxide Manufacturing Facility | ||
Huelva, Spain |
Pigments | Titanium Dioxide Manufacturing Facility | ||
Scarlino, Italy |
Pigments | Titanium Dioxide Manufacturing Facility | ||
Teluk Kalung, Malaysia |
Pigments | Titanium Dioxide Manufacturing Facility | ||
Umbogintwini, South Africa |
Pigments | Titanium Dioxide Manufacturing Facility | ||
Billingham, U.K. |
Pigments | Titanium Dioxide Research and Technical Facility | ||
West Footscray, Australia |
Corporate and Other | Styrenics Manufacturing Facility |
50
Litigation Relating to our Merger with Hexion
For information regarding the termination of the Merger and settlement of the related litigation, see "Item 1. Business—Termination of Merger Agreement and Settlement of Related Litigation" above.
Texas Bank Litigation
For information with respect to the Texas Bank Litigation, see "Item 1. Business—Recent Developments—Texas Bank Litigation" above.
Discoloration Claims
Certain claims have been filed against us relating to discoloration of unplasticized polyvinyl chloride products allegedly caused by our titanium dioxide ("Discoloration Claims"). Substantially all of the titanium dioxide that is the subject of these claims was manufactured prior to our acquisition of the titanium dioxide business from ICI in 1999. Net of amounts we have received from insurers and pursuant to contracts of indemnity, we have paid an aggregate of approximately $16 million in costs and settlement amounts for Discoloration Claims through December 31, 2008.
During the year ended December 31, 2008, we did not settle any Discoloration Claims. During the year ended December 31, 2007, we paid an insignificant amount in partial settlement of a claim. The two Discoloration Claims unresolved as of December 31, 2008 asserted aggregate damages of €36 million (approximately $51 million). An appropriate liability has been accrued for these claims. Based on our understanding of the merits of these claims and our rights under contracts of indemnity and insurance, we do not believe that the net impact on our financial condition, results of operations or liquidity will be material.
While additional Discoloration Claims may be made in the future, we cannot reasonably estimate the amount of loss related to such claims. Although we may incur additional costs as a result of future claims (including settlement costs), based on our history with Discoloration Claims to date, the fact that substantially all of the titanium dioxide that has been the subject of these Discoloration Claims was manufactured and sold more than nine years ago, and the fact that we have rights under contract to indemnity, including from ICI, we do not believe that any unasserted Discoloration Claims will have a material impact on our financial condition, results of operations or liquidity. Based on this conclusion and our inability to reasonably estimate our expected costs with respect to these unasserted claims, we have made no accruals in our financial statements as of December 31, 2008 for costs associated with unasserted Discoloration Claims.
ENVIRONMENTAL ENFORCEMENT PROCEEDINGS
On occasion, we receive notices of violation, enforcement or other complaints from regulatory agencies alleging non-compliance with applicable EHS laws. Based on currently available information and our past experience, we do not believe that the resolution of any pending or threatened environmental enforcement proceedings will have a material impact on our financial condition, results of operations or cash flows.
In May 2007, our operation in Wilton, U.K., allegedly caused a discharge of wastewater effluent to be made to Northumbrian Water's Bran Sands treatment facility that contained elevated levels of nitrobenzene. Northumbrian Water alleges that this discharge caused a disruption of its treatment facility which, in turn, exceeded its discharge consent from the U.K. Environmental Agency. The Environmental Agency is investigating a possible prosecution against Northumbrian Water and/or us for the breach. Northumbrian Water has threatened to prosecute our subsidiary in the U.K. To date, however, no charges have been filed.
51
By letter dated November 26, 2008, the Texas Commission on Environmental Quality combined the alleged air emission-related violations and proposed penalties associated with two previously issued draft orders for our Port Neches, Texas facility. The proposed penalty for the combined order is $120,000. However, we entered into an expedited penalty settlement of $100,000, half of which will be paid through a Supplemental Environmental Project agreed to with the agency.
Asbestos Litigation
We have been named as a "premises defendant" in a number of asbestos exposure cases, typically claims by non-employees of exposure to asbestos while at a facility. In the past, these cases typically have involved multiple plaintiffs bringing actions against multiple defendants, and the complaints have not indicated which plaintiffs were making claims against which defendants, where or how the alleged injuries occurred or what injuries each plaintiff claimed. These facts, which would be central to any estimate of probable loss, generally have been learned only through discovery.
Where a claimant's alleged exposure occurred prior to our ownership of the relevant "premises," the prior owners generally have contractually agreed to retain liability for, and to indemnify us against, asbestos exposure claims. This indemnification is not subject to any time or dollar amount limitations. Upon service of a complaint in one of these cases, we tender it to the prior owner. None of the complaints in these cases state the amount of damages being sought. The prior owner accepts responsibility for the conduct of the defense of the cases and payment of any amounts due to the claimants. In our fourteen-year experience with tendering these cases, we have not made any payment with respect to any tendered asbestos cases. We believe that the prior owners have the intention and ability to continue to honor their indemnity obligations, although we cannot assure you that they will continue to do so or that we will not be liable for these cases if they do not.
The following table presents for the periods indicated certain information about cases for which service has been received that we have tendered to the prior owner, all of which have been accepted.
| |
Year ended December 31, 2008 |
Year ended December 31, 2007 |
Year ended December 31, 2006 |
|||||||
|---|---|---|---|---|---|---|---|---|---|---|
Unresolved at beginning of period |
1,192 | 1,367 | 576 | |||||||
Tendered during period |
21 | 21 | 998 | |||||||
Resolved during period(1) |
73 | 196 | 207 | |||||||
Unresolved at end of period |
1,140 | 1,192 | 1,367 | |||||||
We have never made any payments with respect to these cases. As of December 31, 2008, we had an accrued liability of $16 million relating to these cases and a corresponding receivable of $16 million relating to our indemnity protection with respect to these cases. We cannot assure you that our liability will not exceed our accruals or that our liability associated with these cases would not be material to our financial condition, results of operations or liquidity; however, we are not able to estimate the amount or range of loss in excess of our accruals. Additional asbestos exposure claims may be made against us in the future, and such claims could be material. However, because we are not able to
52
estimate the amount or range of losses associated with such claims, we have made no accruals with respect to unasserted asbestos exposure claims as of December 31, 2008.
Certain cases in which we are a "premises defendant" are not subject to indemnification by prior owners or operators. The following table presents for the periods indicated certain information about these cases. Cases include all cases for which service has been received by us, other than a number of cases that were erroneously filed against us due to a clerical error. The cases filed in error have been dismissed.
| |
Year ended December 31, 2008 |
Year ended December 31, 2007 |
Year ended December 31, 2006 |
|||||||
|---|---|---|---|---|---|---|---|---|---|---|
Unresolved at beginning of period |
39 | 42 | 34 | |||||||
Filed during period |
8 | 52 | 19 | |||||||
Resolved during period |
4 | 55 | 11 | |||||||
Unresolved at end of period |
43 | 39 | 42 | |||||||
We paid gross settlement costs for asbestos exposure cases that are not subject to indemnification of nil, $3 million and nil during the years ended December 31, 2008, 2007 and 2006, respectively. We cannot assure you that our liability will not exceed our accruals or that our liability associated with these cases would not be material to our financial condition, results of operations or liquidity; however, we are not able to estimate the amount or range of loss in excess of our accruals. Additional asbestos exposure claims may be made against us in the future, and such claims could be material. However, because we are not able to estimate the amount or range of losses associated with such claims, we have made no accruals with respect to unasserted asbestos exposure claims as of December 31, 2008.
Antitrust Matters
We have been named as a defendant in civil antitrust suits alleging that between 1999 and 2004 we conspired with Bayer, BASF, Dow, and Lyondell to fix the prices of MDI, TDI, polyether polyols, and related systems ("polyether polyol products") sold in the United States in violation of the federal Sherman Act. These cases are consolidated as the "Polyether Polyols" cases in multidistrict litigation known as In re Urethane Antitrust Litigation, MDL No. 1616, Civil No. 2:04-md-01616-JWL-DJW, pending in the United States District Court, District of Kansas. The Kansas court has ruled that plaintiffs may prosecute the Polyether Polyols cases on behalf of a class of all direct purchasers of polyether polyol products in the United States. Bayer has entered into a settlement with the plaintiffs' class and has been dismissed as a defendant. Merits discovery is underway, and trial has been set for May 3, 2011.
We and the other Polyether Polyol defendants (excluding Bayer) have also been named as defendants in two civil antitrust suits brought by certain direct purchasers of polyether polyol products that opted out of the class certified in MDL No. 1616. These cases have been brought by 12 groups of affiliated companies, 73 plaintiffs in all, who allege that between 1994 and 2006 the Polyether Polyol defendants conspired to fix the prices of polyether polyol products sold in the United States and abroad in violation of the Sherman Act, similar laws of several U.S. states, and the laws of the European Union and certain of its member states. We and the other defendants have moved to dismiss the opt-out complaints.
We, along with the other Polyether Polyols defendants and Rhodia, have also been named as a defendant in civil antitrust suits alleging a conspiracy to fix the prices of polyether polyol products sold in Canada in violation of Canadian competition law. These cases, filed in the Superior Court of Justice, Ontario, Canada on May 5, 2006 and in Superior Court, Quebec, Canada on May 17, 2006, purport to be brought on behalf of various classes of Canadian direct purchasers of polyether polyol products. There has been little activity in these cases since they were filed.
53
Along with Flexsys, Crompton (now Chemtura), Uniroyal, Rhein Chemie Rheinau, and the other Polyether Polyol defendants, we also have been named as a defendant in a civil antitrust suit pending in the Superior Court of California, County of San Francisco, filed on February 15, 2005, that alleges that between 1994 and 2004 the defendants conspired to fix the prices of certain rubber and urethane products sold in California in violation of antitrust and unfair competition laws of California. This case purports to be brought on behalf of a class of all California purchasers of products containing rubber and urethanes products. By agreement of the parties this case has been stayed pending the resolution of MDL No. 1616.
Along with Dow, BASF, and Lyondell, we have also been named as a defendant in a third amended complaint proposed for filing in an existing civil antitrust suit pending against Bayer and Chemtura in federal district court in Massachusetts. The proposed amended complaint alleges that beginning around 1990 we and the other defendants conspired to fix the prices of MDI, TDI, polyether polyols, and polyester polyols sold throughout the United States in violation of the federal Sherman Act and the laws of various states. The proposed amended complaint seeks to sue on behalf of all indirect purchasers of such products in the United States. The Massachusetts action has been stayed pending plaintiffs' settlement of the previously asserted claims against Bayer and Chemtura. We have filed papers opposing the motion for leave to file the proposed amended complaint adding us as a defendant in that action.
The plaintiffs' pleadings in these various antitrust suits provide few specifics about any alleged illegal conduct on our part, and we are not aware of any illegal conduct by us or any of our employees. For these reasons, we cannot estimate the possibility of loss or range of loss relating to these claims, and therefore we have not accrued a liability for these claims. Nevertheless, we could incur losses due to these claims in the future and those losses could be material.
In addition, on February 16, 2006, the Antitrust Division of the U.S. Department of Justice served us with a grand jury subpoena requesting production of documents relating to our sale of polyether polyol products. The other defendants in the Polyether Polyols cases have confirmed that they were also served with subpoenas in this matter. We cooperated fully with the investigation, and by letter dated December 16, 2007, the U.S. Department of Justice notified us that its investigation of possible antitrust violations by manufacturers of polyether polyol products has been closed.
MTBE Litigation
We have been named as a defendant in 14 lawsuits pending in multidistrict litigation in the U.S. District Court for the Southern District of New York alleging liability related to MTBE contamination in groundwater. Four of these cases were filed on March 23, 2007, one was filed on March 28, 2007, three were filed on April 5, 2007, one was filed on January 11, 2008, two were filed on September 4, 2008, one was filed November 7, 2008, one was filed November 18, 2008, and one was filed on December 19, 2008. Numerous other companies, including refiners, manufacturers and sellers of gasoline, as well as manufacturers of MTBE, have been named as defendants in these and many other cases currently pending in U.S. courts. The plaintiffs in the fourteen cases in which we have been named are municipal water districts, a regional water supply authority, and municipal corporations that claim that defendants' conduct has caused MTBE contamination of their groundwater. The plaintiffs seek injunctive relief, such as monitoring and abatement, compensatory damages, punitive damages and attorney fees. At this time, we have insufficient information to meaningfully assess our potential exposure in these cases and therefore we have not accrued a liability for these claims. We believe that our liability in these cases, if any, would likely be covered, at least in part, by insurance and/or by indemnity agreements with prior owners.
54
Shareholder Litigation
From July 5 to July 13, 2007, four putative shareholder class action complaints were filed against our Company and our directors alleging breaches of fiduciary duty in connection with our then-proposed sale to Basell and the receipt of a superior proposal from Hexion. Three actions were filed in Delaware: Cohen v. Archibald, et al., No. 3070, in the Court of Chancery for the State of Delaware (filed July 5, 2007); Augenstein v. Archibald, et al., No. 3076, in the Court of Chancery for the State of Delaware (filed July 9, 2007); and Murphy v. Huntsman, et al., No. 3094, in the Court of Chancery for the State of Delaware (filed July 13, 2007). Another action was filed in Texas: Schwoegler v. Huntsman Corporation, et al., Cause No. 07-07-06993-CV, in the 9th Judicial District Court of Montgomery County, Texas (filed July 6, 2007). As subsequently amended, these lawsuits together allege that we and our directors breached fiduciary duties to the stockholders by, among other things, engaging in an unfair sales process, approving an unfair price per share for the Merger with Hexion, and making inadequate disclosures to stockholders, and that Basell, Hexion and MatlinPatterson entities aided and abetted these breaches of fiduciary duty. The lawsuits sought to enjoin the stockholder vote on the Merger.
On September 20, 2007, the parties entered into a Memorandum of Understanding with plaintiffs' counsel in the Delaware and Texas actions to settle these four lawsuits. As part of the proposed settlement, the defendants deny all allegations of wrongdoing, but we agreed to make certain additional disclosures in the final proxy statement that was mailed to our stockholders on or about September 14, 2007. In connection with the settlement, the parties also reached an agreement with respect to any application that the plaintiffs' counsel will make for an award of customary attorneys' fees and expenses to be paid following the completion of the Merger.
The Memorandum of Understanding is now null and void and of no force and effect because the Merger was not consummated. The Texas action has been voluntarily dismissed, but there has been no further developments in the Delaware actions at this time.
A fifth putative shareholder class action was filed against the Company and three of its officers on August 12, 2008 in the United States District Court for the District of Utah alleging, among other things, that the defendants failed to disclose material adverse facts about the Company's financial well-being, business relationships and prospects during the period from June 26, 2007 to June 18, 2008 in violation of Section 10(b) of the Securities and Exchange Act of 1934 and Rule 10b-5. Prior to any further activity in the case, the action was voluntarily dismissed October 3, 2008.
Port Arthur Plant Fire Insurance Litigation
On August 31, 2007, an action was brought against our Company and International Risk Insurance Company ("IRIC"), our captive insurer, in the United States District Court for the Southern District of Texas, by seventeen reinsurance companies (the"Reinsurers") that reinsure risks under the property insurance policy issued by IRIC to our Company (the"Policy") for the period covering the April 29, 2006 fire at our manufacturing facility in Port Arthur, Texas. The action seeks to compel our Company and IRIC to arbitrate with the Reinsurers to resolve disputes related to the claim for losses caused by the fire or, in the alternative, to declare judgment in favor of the Reinsurers. On September 26, 2008, the court denied motions to dismiss filed by our Company and IRIC, ordering the parties to engage in a short period of discovery on the issue of arbitrability. In a second and related action filed by our Company against IRIC in state court in Jefferson County, Texas, IRIC filed a third party petition against the Reinsurers, who then removed that action to the United States District Court for the Eastern District of Texas. Some of the Reinsurers filed answers and motions to compel arbitration, to stay these proceedings, and to change venue to the United States District Court for the Southern District of Texas in order to consolidate the two actions. Our Company filed a motion to remand that action to the state court and opposition to the Reinsurers' motions in that action. On April 23, 2008,
55
the United States District Court for the Eastern District of Texas transferred the case to the United States District Court for the Southern District of Texas. On September 26, 2008, the court denied our Company's motion to remand that suit to the state court in which it was filed. Pursuant to a December 29, 2008 agreement among the parties to the actions referenced above: (1) a mediation is scheduled for February 24-25, 2009, (2) if the disputes are not fully resolved in mediation, the parties will submit all coverage and quantum issues to a three-arbitrator panel in August of 2009, with a binding award to be entered by September 30, 2009, (3) the Reinsurers paid an additional $40 million on the claim of the Company on December 29, 2008 and agreed that all monies paid by the participating Reinsurers on the claim to date are nonrefundable, (4) the Company waived its noncontractual claims against the Reinsurers, (5) the first action referenced above will be stayed pending final resolution and entry of judgment, and (6) the second action reference above will be dismissed. Reinsurers responsible for a small percentage of our remaining claim were not parties to the two lawsuits and are not parties to the agreement, thus we may need to pursue them separately for their pro rata shares of the unpaid claim. Our Company has paid its deductible on the claim of $60 million and has been paid $365 million to date by the Reinsurers. As of December 31, 2008, our Company has claimed an additional approximately $235 million as presently due and owing and unpaid under the Policy for losses caused by the fire, and anticipates filing additional claims. For more information, see "Note 24. Casualty Losses and Insurance Recoveries—Port Arthur, Texas Plant Fire."
Other Proceedings
We are a party to various other proceedings instituted by private plaintiffs, governmental authorities and others arising under provisions of applicable laws, including various environmental, products liability and other laws. Except as otherwise disclosed in this report, we do not believe that the outcome of any of these matters will have a material adverse effect on our financial condition, results of operations or liquidity.
ITEM 4. SUBMISSION OF MATTERS TO A VOTE OF SECURITY HOLDERS
Our annual meeting of stockholders was held on November 19, 2008. At that meeting, Jon M. Huntsman and Marsha J. Evans were re-elected to serve as Class I directors on our Board of Directors for three-year terms to expire at our annual meeting in 2011 and the appointment of Deloitte & Touche LLP as independent registered public accounting firm for 2008 was ratified.
The following table gives a brief description of each matter voted upon at our 2008 annual meeting and, as applicable, the number of votes cast for, against or withheld, as well as the number of abstentions.
Description of Matter
|
For | Against | Withheld | Abstentions | |||||||
|---|---|---|---|---|---|---|---|---|---|---|---|
1. Election of Class I Directors: |
|||||||||||
Jon M. Huntsman |
204,492,458 | N/A | 1,335,414 | N/A | |||||||
Marsha J. Evans |
205,244,876 | N/A | 582,996 | N/A | |||||||
2. Ratification of the appointment of Deloitte & Touche LLP as independent registered public accounting firm for 2008 |
205,395,924 |
301,536 |
N/A |
130,412 |
|||||||
N/A—Not applicable
56
EXECUTIVE OFFICERS OF THE REGISTRANT
The following is information concerning our executive officers and significant employees as of the date of this report.
Jon M. Huntsman is the Executive Chairman of the Board of Directors of our Company. Prior to appointment as Executive Chairman effective February 2008, Mr. Huntsman served as Chairman of the Board of Directors of our Company, a position he had held since our Company was formed. Mr. Huntsman also serves on our Litigation Committee. He has been Chairman of the Board of all Huntsman companies since he founded his first plastics company in 1970. Mr. Huntsman served as Chief Executive Officer of our Company and our affiliated companies from 1970 to 2000. Mr. Huntsman is a director or manager, as applicable, of Huntsman International and certain of our other subsidiaries. In addition, Mr. Huntsman serves or has served as Chairman or as a member of numerous corporate, philanthropic and industry boards, including the American Red Cross, The Wharton School, University of Pennsylvania, Primary Children's Medical Center Foundation, the Chemical Manufacturers Association and the American Plastics Council. Mr. Huntsman was selected in 1994 as the chemical industry's top CEO for all businesses in Europe and North America. Mr. Huntsman formerly served as Special Assistant to the President of the United States and as Vice Chairman of the U.S. Chamber of Commerce. He is the Chairman and Founder of the Huntsman Cancer Institute.
Peter R. Huntsman is President, Chief Executive Officer and a Director of our Company. Mr. Huntsman also serves on our Litigation Committee. Prior to his appointment in July 2000 as Chief Executive Officer, Mr. Huntsman had served as President and Chief Operating Officer since 1994. In 1987, Mr. Huntsman joined Huntsman Polypropylene Corporation as Vice President before serving as Senior Vice President and General Manager. Mr. Huntsman has also served as President of Olympus Oil, as Senior Vice President of Huntsman Chemical Corporation and as a Senior Vice President of Huntsman Packaging Corporation, a former subsidiary of our Company. Mr. Huntsman is a director or manager, as applicable, of Huntsman International and certain of our other subsidiaries.
J. Kimo Esplin is Executive Vice President and Chief Financial Officer. Mr. Esplin has served as Chief Financial Officer of all of the Huntsman companies since 1999. From 1994 to 1999, Mr. Esplin served as our Treasurer. Prior to joining Huntsman in 1994, Mr. Esplin was a Vice President in the Investment Banking Division of Bankers Trust Company, where he worked for seven years. Mr. Esplin also serves as a director of Nutraceutical International Corporation, a publicly traded nutrition supplements company.
Samuel D. Scruggs is Executive Vice President, General Counsel and Secretary. Mr. Scruggs served as Vice President and Treasurer from 2000 to 2002 and as Vice President and Associate General Counsel from 1999 to 2000. Prior to joining Huntsman in 1995, Mr. Scruggs was an associate with the law firm of Skadden, Arps, Slate, Meagher & Flom LLP.
Andre Genton is Division President, Advanced Materials. Prior to his appointment to this position in February 2009, Mr. Genton served as Vice President & Global Operating Officer for our Advanced Materials business since November 2006. From January 2005 to November 2006, he served as Vice President Design & Composites Engineering for our Advanced Materials business. From June 2003 to January 2005 he served as Vice President Global Structural Composites for our Advanced Materials business. Prior to joining Huntsman in 2003, Mr. Genton held a variety of positions with Vantico (formerly a part of Ciba).
Anthony P. Hankins is Division President, Polyurethanes. Mr. Hankins was appointed to this position in March 2004. From May 2003 to February 2004, Mr. Hankins served as President, Performance Products, from January 2002 to April 2003, he served as Global Vice President, Rigids Division for our Polyurethanes business, from October 2000 to December 2001, he served as Vice
57
President—Americas for our Polyurethanes business, and from March 1998 to September 2000, he served as Vice President—Asia Pacific for our Polyurethanes business. Mr. Hankins worked for ICI from 1980 to February 1998, when he joined our Company. At ICI, Mr. Hankins held numerous management positions in the plastics, fibers and polyurethanes businesses. He has extensive international experience, having held senior management positions in Europe, Asia and the U.S.
Paul G. Hulme is Division President, Textile Effects. Mr. Hulme was appointed to this position in February 2009. From June 2003 to February 2009, Mr. Hulme served as Division President, Materials and Effects. From February 2000 to May 2003, Mr. Hulme served as Vice President, Performance Chemicals, and from December 1999 to February 2000 he served as Operations Director, Polyurethanes. Prior to joining Huntsman in 1999, Mr. Hulme held various positions with ICI in finance, accounting and information systems roles. Mr. Hulme is a Chartered Accountant.
Donald J. Stanutz is Division President, Performance Products. Mr. Stanutz was appointed to this position in March 2004. Mr. Stanutz served as Executive Vice President and Chief Operating Officer of Huntsman LLC from December 2001 to February 2004, as Executive Vice President, Global Sales and Marketing from July 2000 to November 2001 and as Executive Vice President, Polyurethanes, PO and Performance Chemicals from July 1999 to June 2000. Prior to joining Huntsman in 1994, Mr. Stanutz served in a variety of senior positions with Texaco Chemical Company.
Simon Turner is Division President, Pigments. Prior to his appointment to this position in November 2008, Mr. Turner served as Senior Vice President, Pigments since April 2008. From September 2004 to April 2008 Mr. Turner served as Vice President of Global Sales and from July 1999 to September 2004, he held positions including General Manager Co-Products and Director Supply Chain and Shared Services. Prior to joining Huntsman in July 1999, Mr. Turner held various positions with ICI.
Michael J. Kern is Senior Vice President—Environmental, Health & Safety. Mr. Kern has held this position since July 2001. Mr. Kern has served in several senior management positions of our Company, including Senior Vice President, Environmental, Health & Safety from July 2001 to December 2003 and Senior Vice President, Manufacturing from December 1995 to July 2001. Prior to joining Huntsman, Mr. Kern held a variety of positions within Texaco Chemical Company, including Area Manager—Jefferson County Operations from April 1993 until joining our Company, Plant Manager of the Port Neches facility from August 1992 to March 1993, Manager of the PO/MTBE project from October 1989 to July 1992, and Manager of Oxides and Olefins from April 1988 to September 1989.
Brian V. Ridd is Senior Vice President, Purchasing. Mr. Ridd has held this position since July 2000. Mr. Ridd served as Vice President, Purchasing from December 1995 until he was appointed to his current position. Mr. Ridd joined Huntsman in 1984.
Russ R. Stolle is Senior Vice President, Global Public Affairs and Communications. Mr. Stolle was appointed to this position in October 2006. From November 2002 to October 2006, Mr. Stolle served as Vice President and Deputy General Counsel, from October 2000 to November 2002 he served as Vice President and Chief Technology Counsel, and from April 1994 to October 2000 he served as Chief Patent and Licensing Counsel. Prior to joining Huntsman in 1994, Mr. Stolle had been an attorney with Texaco Inc. and an associate with the law firm of Baker & Botts.
L. Russell Healy is Vice President and Controller. Mr. Healy is also Vice President and Controller of Huntsman International and certain of our other subsidiaries and has served in these capacities since April 2004. From August 2001 to April 2004, Mr. Healy served as Vice President, Finance, from July 1999 to July 2001, he served as Vice President and Finance Director for Huntsman International, and from October 1995 to June 1999, he served as Vice President, Tax. Prior to joining Huntsman in 1995, Mr. Healy was a partner with the accounting firm of Deloitte & Touche, LLP. Mr. Healy is a Certified Public Accountant and holds a master's degree in accounting.
58
Martin Casey is Vice President, Strategic Planning. Dr. Casey has held this position since August 2004. From 1999 until he was appointed to his current position, Dr. Casey was responsible for planning and business development in Huntsman's Polyurethanes Business, which was acquired from ICI in 1999. From 1995 to 1999 he was New Business Development Manager for ICI's polyurethanes business, before which he was Business Manager for ICI's acrylic sheet business and held a variety of earlier positions in technical and business management roles.
Sean Douglas is Vice President and Treasurer. Mr. Douglas served as Vice President, Finance from July 2001 until he was appointed to his current position in 2002 and as Vice President, Administration from January 1997 to July 2001. Mr. Douglas is a Certified Public Accountant and, prior to joining Huntsman in 1990, worked for the accounting firm of Price Waterhouse.
Kevin C. Hardman is Vice President, Tax. Mr. Hardman served as Chief Tax Officer from 1999 until he was appointed to his current position in 2002. Mr. Hardman is also Vice President, Tax of Huntsman International. Prior to joining Huntsman in 1999, Mr. Hardman was a tax Senior Manager with the accounting firm of Deloitte & Touche, LLP, where he worked for 10 years. Mr. Hardman is a Certified Public Accountant and holds a master's degree in tax accounting.
Steven C. Jorgensen is Vice President of Internal Audit and Controls. Mr. Jorgensen was appointed to this position effective May 2007. Mr. Jorgensen joined Huntsman in May 2004 as Director of Internal Controls and in May 2005 was appointed as Director of Internal Audit and Controls. Prior to joining Huntsman, Mr. Jorgensen was Vice President and Audit Manager with General Electric Consumer Finance, and prior to that he was an audit Senior Manager with the accounting firm of Deloitte & Touche LLP. Mr. Jorgensen is a Certified Public Accountant and holds a masters degree in accounting.
James R. Moore is Vice President and Deputy General Counsel. Mr. Moore served as Vice President and Chief Environmental Counsel from 2002 until he was appointed to his current position in 2003. Mr. Moore served as Senior Environmental Counsel from 1998 to 2002. From 1989 until joining Huntsman in 1998, Mr. Moore was a partner at the Seattle law firm of Perkins Coie. Mr. Moore also previously served as a trial attorney with the U.S. Department of Justice, an assistant U.S. Attorney and Regional Counsel, Region 10, of the U.S. Environmental Protection Agency.
Kurt D. Ogden is Vice President, Investor Relations. Prior to his appointment to this position in February 2009, Mr. Ogden served as Director, Corporate Finance since October 2004. Prior to joining Huntsman in 2004, Mr. Ogden held various positions with Hillenbrand Industries, Pliant Corporation and Huntsman Chemical Corporation. Mr. Ogden is a Certified Public Accountant and holds a master's degree in business administration.
R. Wade Rogers is Vice President, Global Human Resources. Mr. Rogers has held this position since May 2004. From October 2003 to May 2004, Mr. Rogers served as Director, Human Resources—Americas and from August 2000 to October 2003, he served as Director, Human Resources for our Polymers and Base Chemicals businesses. From the time he joined Huntsman in 1994 to August 2000, Mr. Rogers served as Area Manager, Human Resources—Jefferson County Operations. Prior to joining Huntsman, Mr. Rogers held a variety of positions with Texaco Chemical Company.
Maria Csiba-Womersley is Vice President and Chief Information Officer. Ms. Csiba-Womersley was appointed to this position effective September 1, 2006. Ms. Csiba-Womersley served as Global eBusiness Director from 2004 to 2006 and also served as our Director of Global IT Planning and Security. Previously, Ms. Csiba-Womersley was a Regional Polymer Sales Manager, a Business Director for Polypropylene and Director of Polymer Logistics. Ms. Csiba-Womersley joined Huntsman in 1997.
59
ITEM 5. MARKET FOR REGISTRANT'S COMMON EQUITY, RELATED STOCKHOLDER MATTERS AND ISSUER PURCHASES OF EQUITY SECURITIES
MARKET INFORMATION AND HOLDERS
Our common stock is listed on the New York Stock Exchange under the symbol "HUN." As of February 13, 2009, there were approximately 136 stockholders of record and the closing price of our common stock on the New York Stock Exchange was $2.91 per share.
The reported high and low sale prices of our common stock on the New York Stock Exchange for each of the periods set forth below are as follows:
Period
|
High | Low | ||||||
|---|---|---|---|---|---|---|---|---|
2008 |
||||||||
First Quarter |
$ | 25.71 | $ | 22.35 | ||||
Second Quarter |
23.95 | 9.81 | ||||||
Third Quarter |
14.48 | 7.01 | ||||||
Fourth Quarter |
14.50 | 2.82 | ||||||
Period
|
High | Low | ||||||
|---|---|---|---|---|---|---|---|---|
2007 |
||||||||
First Quarter |
$ | 21.92 | $ | 18.74 | ||||
Second Quarter |
24.39 | 18.40 | ||||||
Third Quarter |
28.40 | 22.24 | ||||||
Fourth Quarter |
27.00 | 23.60 | ||||||
DIVIDENDS
On March 31, 2008, June 30, 2008, September 30, 2008 and December 31, 2008 we paid dividends of approximately $23 million each, for a total of $93 million, or $0.10 per share each, to common stockholders of record as of March 14, 2008, June 16, 2008, September 15, 2008 and December 15, 2008, respectively. On March 30, 2007, June 29, 2007, September 28, 2007 and December 31, 2007, we paid cash dividends of approximately $22 million each for a total of $88 million, or $0.10 per share each, to common stockholders of record as of March 15, 2007, June 15, 2007, September 15, 2007 and December 15, 2007, respectively.
PURCHASES OF EQUITY SECURITIES BY THE COMPANY
Neither we nor any "affiliated issuer" (as such term is defined in Rule 10b-18(a)(3) promulgated under the Securities Exchange Act of 1934, as amended) made any purchase of our equity securities during the fourth quarter of the fiscal year ended December 31, 2008.
STOCK PERFORMANCE GRAPH
Information relating to our stock performance graph will be contained in the definitive proxy statement for the annual meeting of our stockholders and is incorporated herein by reference.
ITEM 6. SELECTED FINANCIAL DATA
The selected historical financial data set forth below presents our historical financial data and the historical financial data of our predecessor Huntsman Holdings, LLC as of and for the dates and periods indicated. You should read the selected financial data in conjunction with "Management's
60
Discussion and Analysis of Financial Condition and Results of Operations," and our consolidated financial statements and accompanying notes included elsewhere in this report.
Huntsman Corporation
(in millions of dollars, except per share amounts)
| |
Year ended December 31, | |||||||||||||||
|---|---|---|---|---|---|---|---|---|---|---|---|---|---|---|---|---|
| |
2008 | 2007 | 2006 | 2005 | 2004 | |||||||||||
Statements of Operations Data: |
||||||||||||||||
Revenues |
$ | 10,215 | $ | 9,651 | $ | 8,731 | $ | 8,446 | $ | 7,632 | ||||||
Gross profit |
1,264 | 1,540 | 1,422 | 1,413 | 1,123 | |||||||||||
Restructuring, impairment and plant closing costs |
36 | 42 | 15 | 107 | 274 | |||||||||||
Operating income |
165 | 537 | 645 | 554 | 228 | |||||||||||
Income (loss) from continuing operations(a) |
478 |
52 |
307 |
(131 |
) |
(342 |
) |
|||||||||
Income (loss) from discontinued operations, net of tax(b) |
117 | (217 | ) | (133 | ) | 124 | 114 | |||||||||
Extraordinary gain (loss) on the acquisition of a business, net of tax of nil(c) |
14 | (7 | ) | 56 | — | — | ||||||||||
Cumulative effect of changes in accounting principle, net of tax(d) |
— | — | — | (28 | ) | — | ||||||||||
Net income (loss) |
609 | (172 | ) | 230 | (35 | ) | (228 | ) | ||||||||
Basic income (loss) per common share(e): |
||||||||||||||||
Income (loss) from continuing operations |
$ | 2.06 | $ | 0.23 | $ | 1.39 | $ | (0.79 | ) | $ | (1.95 | ) | ||||
Income (loss) from discontinued operations, net of tax |
0.50 | (0.98 | ) | (0.60 | ) | 0.57 | 0.52 | |||||||||
Extraordinary gain (loss) on the acquisition of a business |
0.06 | (0.03 | ) | 0.25 | — | — | ||||||||||
Cumulative effect of changes in accounting principle, net of tax(d) |
— | — | — | (0.13 | ) | — | ||||||||||
Net income (loss) |
$ | 2.62 | $ | (0.78 | ) | $ | 1.04 | $ | (0.35 | ) | $ | (1.43 | ) | |||
Diluted income (loss) per common share(e): |
||||||||||||||||
Income (loss) from continuing operations |
$ | 2.04 | $ | 0.22 | $ | 1.32 | $ | (0.79 | ) | $ | (1.95 | ) | ||||
Income (loss) from discontinued operations, net of tax |
0.50 | (0.93 | ) | (0.57 | ) | 0.57 | 0.52 | |||||||||
Extraordinary gain (loss) on the acquisition of a business |
0.06 | (0.03 | ) | 0.24 | — | — | ||||||||||
Cumulative effect of changes in accounting principle, net of tax(d) |
— | — | — | (0.13 | ) | — | ||||||||||
Net income (loss) |
$ | 2.60 | $ | (0.74 | ) | $ | 0.99 | $ | (0.35 | ) | $ | (1.43 | ) | |||
Other Data: |
||||||||||||||||
Depreciation and amortization |
$ | 398 | $ | 413 | $ | 465 | $ | 501 | $ | 537 | ||||||
Capital expenditures |
418 | 665 | 550 | 339 | 227 | |||||||||||
Dividends per share |
0.40 | 0.40 | — | — | — | |||||||||||
Balance Sheet Data (at period end): |
||||||||||||||||
Total assets |
$ | 8,058 | $ | 8,166 | $ | 8,445 | $ | 8,871 | $ | 9,424 | ||||||
Total debt |
3,882 | 3,569 | 3,645 | 4,458 | 6,300 | |||||||||||
Total liabilities |
6,426 | 6,313 | 6,679 | 7,330 | 9,065 | |||||||||||
61
62
ITEM 7. MANAGEMENT'S DISCUSSION AND ANALYSIS OF FINANCIAL CONDITION AND RESULTS OF OPERATIONS
OVERVIEW
We are a global manufacturer of differentiated organic chemical products and of inorganic chemical products. Our products comprise a broad range of chemicals and formulations, which we market globally to a diversified group of consumer and industrial customers. Our products are used in a wide range of applications, including those in the adhesives, aerospace, automotive, construction products, durable and non-durable consumer products, electronics, medical, packaging, paints and coatings, power generation, refining, synthetic fiber, textile chemicals and dye industries. We are a leading global producer in many of our key product lines, including MDI, amines, surfactants, epoxy-based polymer formulations, textile chemicals, dyes, maleic anhydride and titanium dioxide. Our administrative, research and development and manufacturing operations are primarily conducted at the facilities listed in "—Item 2. Properties" above, which are located in 25 countries. We employed approximately 12,600 associates worldwide at December 31, 2008.
As of December 31, 2008, we operated in four segments: Polyurethanes, Materials and Effects, Performance Products and Pigments. Our Polyurethanes, Materials and Effects and Performance Products segments produce differentiated organic chemical products and our Pigments segment produces inorganic chemical products. In a series of transactions completed in 2006 and 2007, we sold substantially all of our Polymers and Base Chemicals operations. We report the results from these discontinued operations in our Polymers and Base Chemicals segments. For more information, see "Note 3. Discontinued Operations" to our consolidated financial statements included elsewhere in this report.
Growth in our Polyurethanes and Materials and Effects segments has been driven by the continued substitution of our products for other materials across a broad range of applications, as well as by the level of global economic activity. Historically, demand for many of these products has grown at rates in excess of GDP growth. In Polyurethanes, this growth, particularly in Asia, has in recent years resulted in improved demand and higher industry capacity utilization rates for many of our key products, including MDI. However, new capacity combined with slower global demand has reduced capacity utilization in 2008.
In our Performance Products segment, demand for our performance specialties has generally continued to grow at rates in excess of GDP as overall demand is significantly influenced by new product and application development. Demand for most of our performance intermediates has grown in line with GDP growth. Over time, demand for maleic anhydride has generally grown at rates that slightly exceed GDP growth. However, given its dependence on the UPR market, which is heavily influenced by construction end markets, maleic anhydride demand can be cyclical.
Historically, demand for titanium dioxide pigments has grown at rates approximately equal to global GDP growth. Pigment prices have historically reflected industry-wide operating rates but have typically lagged behind movements in these rates by up to twelve months due to the effects of product stocking and destocking by customers and producers, contract arrangements and seasonality. The industry experiences some seasonality in its sales because sales of paints, the largest end use for titanium dioxide, generally peak during the spring and summer months in the northern hemisphere. This results in greater sales volumes in the second and third quarters of the year.
We are currently operating in a difficult worldwide economic environment in all of our businesses. As we enter 2009, chemical industry conditions remain challenging as a result of the global economic and financial turmoil. During the fourth quarter of 2008, we experienced significant declines in selling prices and sales volumes for many of our products, and we expect these difficult economic conditions to continue in the short-term. As a result of the recent decline in selling prices, we recognized a charge
63
of $34 million in the fourth quarter of 2008 to write our inventory down to the lower of cost or market values.
RECENT DEVELOPMENTS
2009 COST REDUCTION INITIATIVES
On January 22, 2009, we announced a company-wide initiative to reduce costs across all of our divisions and functions. Including steps taken during the fourth quarter of 2008, we expect to reduce our full-time employees by approximately 1,250 positions, or 10%, by year-end 2009. The number of full-time contractors working in our businesses are expected to be reduced by an additional 490 positions. Together, we expect these reductions to result in operating cost savings of approximately $150 million.
As part of this initiative, the Board of Directors approved and we announced plans on January 22, 2009 to close our titanium dioxide plant located in Grimsby, U.K. The Grimsby plant is our Pigment segment's oldest and least efficient manufacturing plant and has an annual production capacity of 40,000 tons of titanium dioxide. Pigment production at the plant, which had a net book value of approximately $32 million at December 31, 2008, is expected to cease during the first quarter of 2009. Approximately 200 full-time employees and contractors work at the site. Annual operating cost savings resulting from the plant's closure is expected to be approximately $28 million.
TERMINATION OF MERGER AGREEMENT AND SETTLEMENT OF RELATED LITIGATION
For information with respect to the termination of the Merger Agreement and the settlement of related litigation, see "Item 1. Business—Termination of Merger Agreement and Settlement of Related Litigation" above.
SALE OF NOTES IN CONNECTION WITH SETTLEMENT AGREEMENT
For information with respect to our sale of $250 million of Convertible Notes, see "Item 1. Business—Recent Developments—Sale of Notes in Connection with Settlement Agreement" above.
VOTING AND STANDSTILL AGREEMENT
For information with respect to the Voting and Standstill Agreement, see "Item 1. Business—Recent Developments—Voting and Standstill Agreement" above.
TEXAS BANK LITIGATION
For information with respect to the Texas Bank Litigation, see "Item 1. Business—Recent Developments—Texas Bank Litigation" above.
64
RESULTS OF OPERATIONS
For each of our Company and Huntsman International, the following tables set forth the condensed consolidated results of operations for the years ended December 31, 2008, 2007 and 2006 (dollars in millions):
Huntsman Corporation
| |
|
|
|
Percent Change | ||||||||||||
|---|---|---|---|---|---|---|---|---|---|---|---|---|---|---|---|---|
| |
Year Ended December 31, | |||||||||||||||
| |
2008 vs 2007 | 2007 vs 2006 | ||||||||||||||
| |
2008 | 2007 | 2006 | |||||||||||||
Revenues |
$ | 10,215 | $ | 9,651 | $ | 8,731 | 6 | % | 11 | % | ||||||
Cost of goods sold |
8,951 | 8,111 | 7,309 | 10 | % | 11 | % | |||||||||
Gross profit |
1,264 | 1,540 | 1,422 | (18 | )% | 8 | % | |||||||||
Operating expense |
1,063 | 961 | 762 | 11 | % | 26 | % | |||||||||
Restructuring, impairment and plant closing costs |
36 | 42 | 15 | (14 | )% | 180 | % | |||||||||
Operating income |
165 | 537 | 645 | (69 | )% | (17 | )% | |||||||||
Interest expense, net |
(263 |
) |
(286 |
) |
(351 |
) |
(8 |
)% |
(19 |
)% |
||||||
Loss on accounts receivable securitization program |
(27 | ) | (21 | ) | (13 | ) | 29 | % | 62 | % | ||||||
Equity in income of investment in unconsolidated affiliates |
14 | 13 | 4 | 8 | % | 225 | % | |||||||||
Loss on early extinguishment of debt |
(1 | ) | (2 | ) | (27 | ) | (50 | )% | (93 | )% | ||||||
Income (expenses) associated with the Merger |
780 | (210 | ) | — | NM | NM | ||||||||||
Other income |
1 | — | 2 | NM | NM | |||||||||||
Income from continuing operations before income taxes and minority interest |
669 | 31 | 260 | NM | (88 | )% | ||||||||||
Income tax (expense) benefit |
(190 |
) |
12 |
50 |
NM |
(76 |
)% |
|||||||||
Minority interests in subsidiaries' (income) loss |
(1 | ) | 9 | (3 | ) | NM | NM | |||||||||
Income from continuing operations |
478 | 52 | 307 | 819 | % | (83 | )% | |||||||||
Income (loss) from discontinued operations (including gain (loss) on disposal of $11 in 2008, ($340) in 2007 and ($302) in 2006), net of tax |
117 |
(217 |
) |
(133 |
) |
NM |
63 |
% |
||||||||
Extraordinary gain (loss) on the acquisition of a business, net tax of nil |
14 | (7 | ) | 56 | NM | NM | ||||||||||
Net income (loss) |
609 | (172 | ) | 230 | NM | NM | ||||||||||
Interest expense, net |
263 |
286 |
351 |
(8 |
)% |
(19 |
)% |
|||||||||
Income tax expense (benefit) from continuing operations |
190 | (12 | ) | (50 | ) | NM | (76 | )% | ||||||||
Income tax expense (benefit) from discontinued operations |
69 | (140 | ) | 35 | NM | NM | ||||||||||
Depreciation and amortization |
398 | 413 | 465 | (4 | )% | (11 | )% | |||||||||
EBITDA(1) |
$ | 1,529 | $ | 375 | $ | 1,031 | 308 | % | (64 | )% | ||||||
Net cash provided by (used in) operating activities |
$ |
767 |
$ |
(52 |
) |
$ |
892 |
NM |
NM |
|||||||
Net cash (used in) provided by investing activities |
(489 | ) | 200 | 174 | NM | 15 | % | |||||||||
Net cash provided by (used in) financing activities |
230 | (269 | ) | (961 | ) | NM | (72 | )% | ||||||||
65
Huntsman International
| |
|
|
|
Percent Change | ||||||||||||
|---|---|---|---|---|---|---|---|---|---|---|---|---|---|---|---|---|
| |
Year Ended December 31, | |||||||||||||||
| |
2008 vs 2007 | 2007 vs 2006 | ||||||||||||||
| |
2008 | 2007 | 2006 | |||||||||||||
Revenues |
$ | 10,215 | $ | 9,651 | $ | 8,731 | 6 | % | 11 | % | ||||||
Cost of goods sold |
8,934 | 8,095 | 7,292 | 10 | % | 11 | % | |||||||||
Gross profit |
1,281 | 1,556 | 1,439 | (18 | )% | 8 | % | |||||||||
Operating expense |
1,062 | 961 | 762 | 11 | % | 26 | % | |||||||||
Restructuring, impairment and plant closing costs |
36 | 42 | 15 | (14 | )% | 180 | % | |||||||||
Operating income |
183 | 553 | 662 | (67 | )% | (16 | )% | |||||||||
Interest expense, net |
(264 |
) |
(287 |
) |
(355 |
) |
(8 |
)% |
(19 |
)% |
||||||
Loss on accounts receivable securitization program |
(27 | ) | (21 | ) | (13 | ) | 29 | % | 62 | % | ||||||
Equity in income of investment in unconsolidated affiliates |
14 | 13 | 4 | 8 | % | 225 | % | |||||||||
Loss on early extinguishment of debt |
(1 | ) | (3 | ) | (39 | ) | (67 | )% | (92 | )% | ||||||
Other income |
1 | — | 2 | NM | NM | |||||||||||
(Loss) income from continuing operations before income taxes and minority interest |
(94 | ) | 255 | 261 | NM | (2 | )% | |||||||||
Income tax benefit (expense) |
2 |
(41 |
) |
31 |
NM |
NM |
||||||||||
Minority interests in subsidiaries' (income) loss |
(1 | ) | 9 | (3 | ) | NM | NM | |||||||||
(Loss) income from continuing operations |
(93 | ) | 223 | 289 | NM | (23 | )% | |||||||||
Income (loss) from discontinued operations (including gain (loss) on disposal of $11 in 2008, ($351) in 2007 and ($280) in 2006), net of tax |
117 |
(228 |
) |
(111 |
) |
NM |
105 |
% |
||||||||
Extraordinary gain (loss) on the acquisition of a business, net of tax of nil |
14 | (7 | ) | 56 | NM | NM | ||||||||||
Net income (loss) |
38 | (12 | ) | 234 | NM | NM | ||||||||||
Interest expense, net |
264 |
287 |
355 |
(8 |
)% |
(19 |
)% |
|||||||||
Income tax (benefit) expense from continuing operations |
(2 | ) | 41 | (31 | ) | NM | NM | |||||||||
Income tax expense (benefit) from discontinued operations |
69 | (140 | ) | 35 | NM | NM | ||||||||||
Depreciation and amortization |
374 | 391 | 439 | (4 | )% | (11 | )% | |||||||||
EBITDA(1) |
$ | 743 | $ | 567 | $ | 1,032 | 31 | % | (45 | )% | ||||||
Net cash provided by operating activities |
$ |
39 |
$ |
57 |
$ |
883 |
(32 |
)% |
(94 |
)% |
||||||
Net cash (used in) provided by investing activities |
(314 | ) | 8 | 159 | NM | (95 | )% | |||||||||
Net cash provided by (used in) financing activities |
213 | (169 | ) | (944 | ) | NM | (82 | )% | ||||||||
66
For each of our Company and Huntsman International, the following tables set forth certain items of (expense) income included in EBITDA (dollars in millions):
Huntsman Corporation
| |
Year ended December 31, | ||||||||||||
|---|---|---|---|---|---|---|---|---|---|---|---|---|---|
| |
2008 | 2007 | 2006 | ||||||||||
Foreign exchange (losses) gains—unallocated |
$ | (31 | ) | $ | (12 | ) | $ | 10 | |||||
Loss on early extinguishment of debt |
(1 | ) | (2 | ) | (27 | ) | |||||||
Loss on accounts receivable securitization program |
(27 | ) | (21 | ) | (13 | ) | |||||||
Legal and contract settlement expense, net |
— | (6 | ) | — | |||||||||
Amounts included in discontinued operations |
186 | (324 | ) | 5 | |||||||||
Gain on sale of businesses/assets, net |
1 | 73 | 92 | ||||||||||
Recovery of property losses |
— | — | 9 | ||||||||||
Income (expenses) associated with the Merger |
780 | (210 | ) | — | |||||||||
Extraordinary gain (loss) on the acquisition of a business |
14 | (7 | ) | 56 | |||||||||
Restructuring, impairment and plant closing (costs) credits: |
|||||||||||||
Polyurethanes |
— | — | 3 | ||||||||||
Materials and Effects |
(25 | ) | (25 | ) | (4 | ) | |||||||
Performance Products |
(1 | ) | (1 | ) | (2 | ) | |||||||
Pigments |
(4 | ) | (3 | ) | (4 | ) | |||||||
Corporate and Other |
(6 | ) | (13 | ) | (8 | ) | |||||||
Total restructuring, impairment and plant closing costs |
(36 | ) | (42 | ) | (15 | ) | |||||||
Total |
$ | 886 | $ | (551 | ) | $ | 117 | ||||||
Huntsman International
| |
Year ended December 31, | ||||||||||||
|---|---|---|---|---|---|---|---|---|---|---|---|---|---|
| |
2008 | 2007 | 2006 | ||||||||||
Foreign exchange (losses) gains—unallocated |
$ | (31 | ) | $ | (12 | ) | $ | 10 | |||||
Loss on early extinguishment of debt |
(1 | ) | (3 | ) | (39 | ) | |||||||
Loss on accounts receivable securitization program |
(27 | ) | (21 | ) | (13 | ) | |||||||
Legal and contract settlement expense, net |
— | (6 | ) | — | |||||||||
Amounts included in discontinued operations |
186 | (335 | ) | 27 | |||||||||
Gain on sale of businesses/assets, net |
1 | 73 | 92 | ||||||||||
Recovery of property losses |
— | — | 9 | ||||||||||
Extraordinary gain (loss) on the acquisition of a business |
14 | (7 | ) | 56 | |||||||||
Restructuring, impairment and plant closing (costs) credits: |
|||||||||||||
Polyurethanes |
— | — | 3 | ||||||||||
Materials and Effects |
(25 | ) | (25 | ) | (4 | ) | |||||||
Performance Products |
(1 | ) | (1 | ) | (2 | ) | |||||||
Pigments |
(4 | ) | (3 | ) | (4 | ) | |||||||
Corporate and Other |
(6 | ) | (13 | ) | (8 | ) | |||||||
Total restructuring, impairment and plant closing costs |
(36 | ) | (42 | ) | (15 | ) | |||||||
Total |
$ | 106 | $ | (353 | ) | $ | 127 | ||||||
NM—Not meaningful
67
We believe that net income (loss) is the performance measure calculated and presented in accordance with GAAP that is most directly comparable to EBITDA and that cash provided by operating activities is the liquidity measure calculated and presented in accordance with GAAP that is
68
most directly comparable to EBITDA. For each of our Company and Huntsman International, the following tables reconcile EBITDA to net income (loss) and to net cash provided by (used in) operations (dollars in millions):
Huntsman Corporation
| |
|
|
|
Percent Change | ||||||||||||
|---|---|---|---|---|---|---|---|---|---|---|---|---|---|---|---|---|
| |
Year Ended December 31, | |||||||||||||||
| |
2008 vs 2007 | 2007 vs 2006 | ||||||||||||||
| |
2008 | 2007 | 2006 | |||||||||||||
EBITDA(1) |
$ | 1,529 | $ | 375 | $ | 1,031 | 308 | % | (64 | )% | ||||||
Depreciation and amortization |
(398 | ) | (413 | ) | (465 | ) | (4 | )% | (11 | )% | ||||||
Interest expense, net |
(263 | ) | (286 | ) | (351 | ) | (8 | )% | (19 | )% | ||||||
Income tax (expense) benefit from continuing operations |
(190 | ) | 12 | 50 | NM | (76 | )% | |||||||||
Income tax (expense) benefit from discontinued operations |
(69 | ) | 140 | (35 | ) | NM | NM | |||||||||
Net income (loss) |
609 | (172 | ) | 230 | NM | NM | ||||||||||
Extraordinary (gain) loss on the acquisition of a business, net of tax |
(14 | ) | 7 | (56 | ) | NM | NM | |||||||||
Equity in income of investment in unconsolidated affiliates |
(14 | ) | (13 | ) | (4 | ) | 8 | % | 225 | % | ||||||
Depreciation and amortization |
398 | 413 | 465 | (4 | )% | (11 | )% | |||||||||
Loss on disposal of businesses/assets, net |
6 | 269 | 209 | (98 | )% | 29 | % | |||||||||
Noncash restructuring, impairment and plant closing costs |
7 | 15 | 18 | (53 | )% | (17 | )% | |||||||||
Loss on early extinguishment of debt |
1 | 2 | 27 | (50 | )% | (93 | )% | |||||||||
Noncash interest expense |
2 | 5 | 5 | (60 | )% | — | ||||||||||
Deferred income taxes |
202 | (203 | ) | (82 | ) | NM | 148 | % | ||||||||
Net unrealized loss (gain) on foreign currency transactions |
4 | (9 | ) | (42 | ) | NM | (79 | )% | ||||||||
Noncash gain on partial fire insurance settlement |
(135 | ) | — | — | NM | NM | ||||||||||
Other, net |
41 | 19 | 32 | 116 | % | (41 | )% | |||||||||
Changes in operating assets and liabilities |
(340 | ) | (385 | ) | 90 | (12 | )% | NM | ||||||||
Net cash provided by (used in) operating activities |
$ | 767 | $ | (52 | ) | $ | 892 | NM | NM | |||||||
69
Huntsman International
| |
|
|
|
Percent Change | ||||||||||||
|---|---|---|---|---|---|---|---|---|---|---|---|---|---|---|---|---|
| |
Year Ended December 31, | |||||||||||||||
| |
2008 vs 2007 | 2007 vs 2006 | ||||||||||||||
| |
2008 | 2007 | 2006 | |||||||||||||
EBITDA(1) |
$ | 743 | $ | 567 | $ | 1,032 | 31 | % | (45 | )% | ||||||
Depreciation and amortization |
(374 | ) | (391 | ) | (439 | ) | (4 | )% | (11 | )% | ||||||
Interest expense, net |
(264 | ) | (287 | ) | (355 | ) | (8 | )% | (19 | )% | ||||||
Income tax benefit (expense) from continuing operations |
2 | (41 | ) | 31 | NM | NM | ||||||||||
Income tax (expense) benefit from discontinued operations |
(69 | ) | 140 | (35 | ) | NM | NM | |||||||||
Net income (loss) |
38 | (12 | ) | 234 | NM | NM | ||||||||||
Extraordinary (gain) loss on the acquisition of a business, net of tax |
(14 | ) | 7 | (56 | ) | NM | NM | |||||||||
Equity in income of investment in unconsolidated affiliates |
(14 | ) | (13 | ) | (4 | ) | 8 | % | 225 | % | ||||||
Depreciation and amortization |
374 | 391 | 439 | (4 | )% | (11 | )% | |||||||||
Loss on disposal of businesses/assets, net |
6 | 269 | 188 | (98 | )% | 43 | % | |||||||||
Noncash restructuring, impairment and plant closing costs |
7 | 15 | 18 | (53 | )% | (17 | )% | |||||||||
Loss on early extinguishment of debt |
1 | 3 | 39 | (67 | )% | (92 | )% | |||||||||
Noncash interest expense |
2 | 5 | 9 | (60 | )% | (44 | )% | |||||||||
Deferred income taxes |
26 | (150 | ) | (63 | ) | NM | 138 | % | ||||||||
Net unrealized loss (gain) on foreign currency transactions |
4 | (9 | ) | (42 | ) | NM | (79 | )% | ||||||||
Noncash gain on partial fire insurance settlement |
(135 | ) | — | — | NM | NM | ||||||||||
Other, net |
42 | 19 | 26 | 121 | % | (27 | )% | |||||||||
Changes in operating assets and liabilities |
(298 | ) | (468 | ) | 95 | (36 | )% | NM | ||||||||
Net cash provided by operating activities |
$ | 39 | $ | 57 | $ | 883 | (32 | )% | (94 | )% | ||||||
NM—Not meaningful
Year Ended December 31, 2008 Compared to Year Ended December 31, 2007
For the year ended December 31, 2008, we had net income of $609 million on revenues of $10,215 million, compared with a net loss of $172 million on revenues of $9,651 million for 2007. For the year ended December 31, 2008 Huntsman International had net income of $38 million on revenues of $10,215 million compared with a net loss of $12 million on revenues of $9,651 million for 2007. The increase of $781 million in our net income and the increase of $50 million in Huntsman International's net income was the result of the following:
70
71
Acquisition that were no longer deemed necessary and a reimbursement by Ciba of certain restructuring costs associated with the acquisition. During the year ended December 31, 2007, we adjusted the preliminary purchase price allocation and finalized post-closing working capital adjustments, resulting in our recording an extraordinary loss on the acquisition of $7 million. For more information, see "Note 4. Business Dispositions and Combinations—Textile Effects Acquisition" to our consolidated financial statements included elsewhere in this report.
Segment Analysis
Year Ended December 31, 2008 Compared to Year Ended December 31, 2007
The following table sets forth the revenues and EBITDA for each of our operating segments (dollars in millions):
| |
Year ended December 31, |
|
||||||||
|---|---|---|---|---|---|---|---|---|---|---|
| |
Percent Change |
|||||||||
| |
2008 | 2007 | ||||||||
Revenues |
||||||||||
Polyurethanes |
$ | 4,055 | $ | 3,813 | 6 | % | ||||
Materials and Effects |
2,395 | 2,419 | (1 | )% | ||||||
Performance Products |
2,703 | 2,310 | 17 | % | ||||||
Pigments |
1,072 | 1,109 | (3 | )% | ||||||
Corporate and Other |
159 | 155 | 3 | % | ||||||
Eliminations |
(169 | ) | (155 | ) | 9 | % | ||||
Total |
$ | 10,215 | $ | 9,651 | 6 | % | ||||
Huntsman Corporation |
||||||||||
Segment EBITDA |
||||||||||
Polyurethanes |
$ | 382 | $ | 592 | (35 | )% | ||||
Materials and Effects |
116 | 199 | (42 | )% | ||||||
Performance Products |
278 | 202 | 38 | % | ||||||
Pigments |
17 | 51 | (67 | )% | ||||||
Corporate and Other |
550 | (342 | ) | NM | ||||||
Subtotal |
1,343 | 702 | 91 | % | ||||||
Polymers |
3 |
(197 |
) |
NM |
||||||
Base Chemicals |
183 | (130 | ) | NM | ||||||
Total |
$ | 1,529 | $ | 375 | 308 | % | ||||
72
Huntsman International
| |
Year ended December 31, |
|
||||||||
|---|---|---|---|---|---|---|---|---|---|---|
| |
Percent Change |
|||||||||
| |
2008 | 2007 | ||||||||
Segment EBITDA |
||||||||||
Polyurethanes |
$ | 382 | $ | 592 | (35 | )% | ||||
Materials and Effects |
116 | 199 | (42 | )% | ||||||
Performance Products |
278 | 202 | 38 | % | ||||||
Pigments |
17 | 51 | (67 | )% | ||||||
Corporate and Other |
(236 | ) | (150 | ) | 57 | % | ||||
Subtotal |
557 | 894 | (38 | )% | ||||||
Polymers |
3 |
(197 |
) |
NM |
||||||
Base Chemicals |
183 | (130 | ) | NM | ||||||
Total |
$ | 743 | $ | 567 | 31 | % | ||||
| |
Average Selling Price |
Sales Volumes |
|||||
|---|---|---|---|---|---|---|---|
Period-Over-Period Increase (Decrease) |
|||||||
Polyurethanes(1) |
8 | % | (1 | )% | |||
Materials and Effects |
9 | % | (9 | )% | |||
Performance Products(1) |
29 | % | (11 | )% | |||
Pigments |
10 | % | (12 | )% | |||
NM—Not Meaningful
Polyurethanes
For the year ended December 31, 2008, Polyurethanes segment revenues increased as a result of higher average selling prices, offset in part by reduced sales volumes. Average MDI selling prices increased by 4%, despite a significant decline in average selling prices in Asia during the fourth quarter of 2008, primarily due to global price increase initiatives early in the year in response to higher raw materials costs. Prices also benefited from foreign exchange movements as the U.S dollar weakened against other relevant currencies. Average selling prices for MTBE increased by 20% due to improved market demand as well as in response to higher raw materials costs, again despite a significant decline in average selling prices during the fourth quarter of 2008. The decrease in Polyurethanes segment sales volumes was primarily driven by slower growth in the U.S. related to slower construction-related demand and production outages caused by the recent U.S. Gulf Coast storms. Lower sales volumes were also due to lower than expected sales volumes in Asia with Olympic-related production restrictions and a sharp drop in global demand in the fourth quarter of 2008 related to the overall economic slowdown. Segment EBITDA decreased principally on lower margins related to sharply higher raw material and energy costs and the overall effects of the recent U.S. Gulf Coast storms and also on a significant write-down of certain inventories to the lower of cost or market values, all of which more than offset improved average selling prices.
73
Materials and Effects
For the year ended December 31, 2008, Materials and Effects segment revenues decreased primarily as a result of lower sales volumes, offset in part by higher average selling prices. Sales volumes for our textile effects products decreased by 19% primarily as a result of lower demand for dyes and chemicals in all regions related to the worldwide economic slowdown. Sales volumes for our advanced materials products decreased by 3%, primarily as a result of lower demand, mainly in Europe and the U.S. as a consequence of the worldwide economic slowdown. Average selling prices in our Materials and Effects segment increased mainly as a result of price increase initiatives in certain markets and regions in response to higher raw materials costs and from foreign exchange movements as the U.S. dollar weakened against other relevant currencies. Segment EBITDA decreased primarily from lower contribution margins as lower sales volumes and higher raw materials, energy and manufacturing costs more than offset higher average selling prices. EBITDA from our advanced materials products decreased by $9 million principally as a result of lower contribution margins as lower sales volumes and higher raw materials, energy and manufacturing costs more than offset higher average selling prices, offset in part by lower general and administrative expenses. EBITDA from our textile effects products decreased by $74 million due principally to lower sales volumes and lower margins, as raw material and energy costs increased by more than average selling prices. During each of the years ended December 31, 2008 and 2007, our Materials and Effects segment recorded restructuring and plant closing charges of $25 million. For more information concerning restructuring activities, see "Note 11. Restructuring, Impairment and Plant Closing Costs" to our consolidated financial statements included elsewhere in this report.
Performance Products
For the year ended December 31, 2008, Performance Products segment revenues increased primarily due to an increase in average selling prices and higher toll manufacturing revenues, offset by lower sales volumes. Average selling prices rose in response to higher raw material costs and as a result of foreign exchange movements as the U.S. dollar weakened against other relevant currencies. The reduction in sales volumes was primarily due to the conversion of most of our ethylene glycol business to a toll manufacturing operation in 2008 and lower olefin by-product sales. Segment EBITDA increased principally due to expanded margins, as higher average selling prices more than offset increases in raw material and energy costs. The higher margins more than offset increases in plant fixed costs resulting from additional planned maintenance and hurricane repairs.
Pigments
For the year ended December 31, 2008, Pigments segment revenues decreased primarily as a result of lower sales volumes, offset in part by higher average selling prices in local currencies in all markets and foreign exchange movements as the U.S. dollar weakened against other relevant currencies. Sales volumes were lower primarily due to lower worldwide demand related to the global economic downturn. The positive effect on revenues of the U.S. dollar weakness was substantially offset by its effect on our costs. Segment EBITDA decreased principally due to lower sales volumes and reduced margins resulting from higher raw material and energy costs. During the years ended December 31, 2008 and 2007, our Pigments segment recorded restructuring and plant closing charges of $4 million and $3 million, respectively. For more information concerning restructuring activities, see "Note 11. Restructuring, Impairment and Plant Closing Costs" to our consolidated financial statements included elsewhere in this report.
Corporate and Other—Huntsman Corporation
Corporate and Other includes unallocated corporate overhead, foreign exchange gains and losses, loss on accounts receivable securitization program, loss on the early extinguishment of debt, other
74
non-operating income and expense, minority interest in subsidiaries' (income) loss, extraordinary gain (loss) on the acquisition of a business, gain on the sale of our former U.S. butadiene and MTBE business, Merger-related income and expenses and the operating results of our Australian styrenics business. The increase in EBITDA from Corporate and Other for the year ended December 31, 2008 resulted primarily from a $990 million increase in the income associated with the Merger ($780 million of income recorded in the 2008 period compared to $210 million of expenses in the 2007 period). For more information regarding these Merger-related income (expenses), see "Note 21. Income (Expenses) Associated with the Merger" to our consolidated financial statements included elsewhere in this report. Additionally, for the year ended December 31, 2008, EBITDA was higher by $21 million due to favorable adjustments to the extraordinary gain on acquisition of our Textile Effects business (a $14 million gain recorded in the 2008 period compared to a $7 million loss in the 2007 period). For more information regarding the extraordinary gain associated with our June 30, 2006 acquisition of Ciba's textile effects business (the "Textile Effects Acquisition"), see "Note 4. Business Dispositions and Combinations—Textile Effects Acquisition" to our consolidated financial statements included elsewhere in this report. These increases in EBITDA were offset somewhat by a $19 million increase in unallocated foreign exchange losses (a loss of $31 million in 2008 compared to a loss of $12 million in 2007), an increase of $14 million in losses from our Australian styrenics business, and a $10 million decrease in minority interests in subsidiaries' loss. In addition, the increase in Corporate and Other segment EBITDA was offset by an $11 million gain recorded in 2007 in connection with the U.K. Petrochemical Disposition and a $69 million gain recorded in 2007 in connection with the sale of our former U.S. butadiene and MTBE business. For more information, see "Note 4. Business Dispositions and Combinations—Sale of U.S. Butadiene and MTBE Business" to our consolidated financial statements included elsewhere in this report.
Corporate and Other—Huntsman International
Corporate and Other includes unallocated corporate overhead, foreign exchange gains and losses, loss on accounts receivable securitization program, loss on the early extinguishment of debt, other non-operating income and expense, minority interest in subsidiaries' (income) loss, extraordinary gain (loss) on the acquisition of a business, gain on the sale of our former U.S. butadiene and MTBE business and the operating results of our Australian styrenics business. The decrease in EBITDA from Corporate and Other for the year ended December 31, 2008 resulted primarily from a $19 million increase in unallocated foreign exchange losses (a loss of $31 million in 2008 compared to a loss of $12 million in 2007), an increase of $14 million in losses from our Australian styrenics business, and a $10 million decrease in minority interests in subsidiaries' loss. In addition, Corporate and Other segment EBITDA was lower due to an $11 million gain recorded in 2007 in connection with the U.K. Petrochemical Disposition and a $69 million gain recorded in 2007 in connection with the sale of our former U.S. butadiene and MTBE business. For more information, see "Note 4. Business Dispositions and Combinations—Sale of U.S. Butadiene and MTBE Business" to our consolidated financial statements included elsewhere in this report. These decreases in EBITDA were offset somewhat by a $21 million favorable adjustment to the extraordinary gain on acquisition of our Textile Effects business (a $14 million gain recorded in the 2008 period compared to a $7 million loss in the 2007 period). For more information regarding the extraordinary gain associated with the Textile Effects Acquisition, see "Note 4. Business Dispositions and Combinations—Textile Effects Acquisition" to our consolidated financial statements included elsewhere in this report.
Polymers
The operating results of our North American polymers business are classified as discontinued operations, and, accordingly, the revenues of this business are excluded from revenues for all periods presented. The EBITDA of our North American polymers business is included in the Polymers segment EBITDA for all periods presented.
75
For the year ended December 31, 2008, Polymers segment EBITDA increased to $3 million as compared with a loss of $197 million in the 2007 period. The EBITDA loss in the 2007 period resulted primarily from the $233 million loss recorded in connection with the North American Polymers Disposition. The EBITDA in the 2008 period resulted from property tax settlements and post-closing adjustments to the loss on disposal. For more information, see "Note 3. Discontinued Operations—North American Polymers Business" to our consolidated financial statements included elsewhere in this report.
Base Chemicals
The operating results of our base chemicals business are classified as discontinued operations, and, accordingly, the revenues of this business are excluded from revenues for all periods presented. The EBITDA of our base chemicals business is included in the Base Chemicals segment EBITDA for all periods presented.
For the year ended December 31, 2008, Base Chemicals segment EBITDA increased to $183 million as compared with a loss of $130 million in the 2007 period. This increase in Base Chemicals segment EBITDA resulted from $175 million of income related to a partial fire insurance settlement for the Port Arthur fire and adjustments to the losses recorded in connection with the U.S. Base Chemicals Disposition and the U.K. Petrochemicals Disposition. For more information, see "Note 24. Casualty Losses and Insurance Recoveries," "Note 3. Discontinued Operations—U.S. Base Chemicals Business" and "—European Base Chemicals and Polymers Business" to our consolidated financial statements included elsewhere in this report.
Year Ended December 31, 2007 Compared to Year Ended December 31, 2006
For the year ended December 31, 2007, we had a net loss of $172 million on revenues of $9,651 million, compared with net income of $230 million on revenues of $8,731 million for 2006. For the year ended December 31, 2007, Huntsman International had a net loss of $12 million on revenues of $9,651 million compared with net income of $234 million on revenues of $8,731 million for 2006. The decrease of $402 million in our net income and the decrease of $246 million in Huntsman International's net income was the result of the following:
76
with $1 million of losses in 2006), higher insurance recoveries of $24 million recorded in 2006, higher corporate information technology costs of $24 million and higher overall selling, general and administrative and research and development costs resulting in part from the negative impacts of foreign currency fluctuations as the U.S. dollar weakened against relevant currencies.
77
Segment Analysis
Year Ended December 31, 2007 Compared to Year Ended December 31, 2006
The following table sets forth the revenues and EBITDA for each of our operating segments (dollars in millions):
| |
Year ended December 31, |
|
||||||||
|---|---|---|---|---|---|---|---|---|---|---|
| |
Percent Change |
|||||||||
| |
2007 | 2006 | ||||||||
Revenues |
||||||||||
Polyurethanes |
$ | 3,813 | $ | 3,457 | 10 | % | ||||
Materials and Effects |
2,419 | 1,792 | 35 | % | ||||||
Performance Products |
2,310 | 2,037 | 13 | % | ||||||
Pigments |
1,109 | 1,058 | 5 | % | ||||||
Corporate and Other |
155 | 538 | (71 | )% | ||||||
Eliminations |
(155 | ) | (151 | ) | 3 | % | ||||
Total |
$ | 9,651 | $ | 8,731 | 11 | % | ||||
Huntsman Corporation |
||||||||||
Segment EBITDA |
||||||||||
Polyurethanes |
$ | 592 | $ | 583 | 2 | % | ||||
Materials and Effects |
199 | 154 | 29 | % | ||||||
Performance Products |
202 | 208 | (3 | )% | ||||||
Pigments |
51 | 113 | (55 | )% | ||||||
Corporate and Other |
(342 | ) | (62 | ) | 452 | % | ||||
Subtotal |
702 | 996 | (30 | )% | ||||||
Polymers |
(197 |
) |
121 |
NM |
||||||
Base Chemicals |
(130 | ) | (86 | ) | 51 | % | ||||
Total |
$ | 375 | $ | 1,031 | (64 | )% | ||||
78
Huntsman International
| |
Year ended December 31, |
|
||||||||
|---|---|---|---|---|---|---|---|---|---|---|
| |
Percent Change |
|||||||||
| |
2007 | 2006 | ||||||||
Segment EBITDA |
||||||||||
Polyurethanes |
$ | 592 | $ | 583 | 2 | % | ||||
Materials and Effects |
199 | 154 | 29 | % | ||||||
Performance Products |
202 | 208 | (3 | )% | ||||||
Pigments |
51 | 113 | (55 | )% | ||||||
Corporate and Other |
(150 | ) | (61 | ) | 146 | % | ||||
Subtotal |
894 | 997 | (10 | )% | ||||||
Polymers |
(197 |
) |
121 |
NM |
||||||
Base Chemicals |
(130 | ) | (86 | ) | 51 | % | ||||
Total |
$ | 567 | $ | 1,032 | (45 | )% | ||||
| |
Average Selling Price |
Sales Volumes |
|||||
|---|---|---|---|---|---|---|---|
Period-Over-Period Increase (Decrease) |
|||||||
Polyurethanes(1) |
9 | % | 2 | % | |||
Materials and Effects |
12 | % | 20 | % | |||
Performance Products(1) |
5 | % | 8 | % | |||
Pigments |
— | 5 | % | ||||
NM—Not Meaningful
Polyurethanes
For the year ended December 31, 2007, Polyurethanes segment revenues increased as a result of both higher average selling prices and growth in overall sales volumes. MDI average selling prices in 2007 increased by 6% as compared with 2006 due to favorable foreign exchange movements, particularly for euro-denominated sales and in response to higher raw material costs. MTBE average selling prices for 2007 increased by 20% as compared with 2006 mainly due to higher raw material costs, strong export market demand and tight supply. Overall, Polyurethanes sales volumes increased primarily by higher MDI volumes due in particular to strong demand in insulation-related applications and in global emerging markets. For the year ended December 31, 2007, Polyurethanes segment EBITDA increased primarily due to higher PO/co-product MTBE and urethanes margins, with average selling prices increasing by more than raw material and energy costs, as well as an increase in sales volumes. The improvement in margins more than offset increased costs resulting from the delayed start up of our China MDI joint venture.
Materials and Effects
Materials and Effects segment revenues for the year ended December 31, 2007 increased primarily due to the Textile Effects Acquisition on June 30, 2006. The textile effects business contributed $523 million to the increase in revenues for the year ended December 31, 2006, while advanced materials revenues for the same period increased by $104 million, or 8%, as compared to 2006. The increase in advanced materials revenues was attributable to a 12% increase in average selling prices,
79
partially offset by a 4% decrease in sales volumes. Average selling prices increased mainly due to favorable impacts of currency fluctuations as the U.S. dollar weakened against the relevant European currencies, price increase initiatives across all regions and most of our major product markets. Sales volumes decreased mainly in Europe and the Americas as a result of lower demand in the coatings, construction, sport and electronics market groups. This was partially offset with sales volume growth in the adhesives and power market groups in Asia. The textile effects business contributed $29 million to the increase in segment EBITDA for the year ended December 31, 2007 resulting from a full year of EBITDA in 2007 as compared with six months in 2006, while advanced materials EBITDA for 2007 increased by $16 million, or 11%, as compared to 2006. Advanced materials EBITDA increased as a result of higher contribution margins on increased average selling prices, partially offset by higher manufacturing and selling, general and administrative costs which were negatively impacted by exchange rates as the U.S. dollar weakened against the relevant European currencies. During the year ended December 31, 2007, our Materials and Effects segment recorded restructuring, impairment and plant closing charges of $25 million as compared to $4 million in 2006. For further information concerning restructuring activities, see "Note 11. Restructuring, Impairment and Plant Closing Costs" to our consolidated financial statements included elsewhere in this report.
Performance Products
For the year ended December 31, 2007, Performance Products segment revenues increased due to higher sales volumes and higher average selling prices. Sales volumes increased principally due to higher demand across most product groups. Volumes were lower in maleic anhydride where demand was impacted by the downturn in the U.S. housing market, and in ethanolamines where production was lower. Average selling prices increased in response to higher raw material and energy costs and favorable currency effects as the U.S. dollar weakened against European and Australian currencies. For the year ended December 31, 2007, Performance Products segment EBITDA decreased as raw materials cost increases were recovered by higher selling prices but the impact of higher sales volumes was more than offset by increased fixed costs. The increase in fixed costs was mainly due to higher maintenance expenditures, negative currency impacts from non-U.S. operations and a $6 million charge related to the settlement of a legal dispute. In addition, during 2006 we recorded gains of $2 million on the sale of real estate and insurance receipts related to property damage incurred at our Port Neches, Texas facility resulting from Hurricane Rita in September 2005. During the years ended December 31, 2007 and 2006, the Performance Product segment recorded restructuring, impairment and plant closing charges of $1 million and $2 million, respectively. For further information concerning restructuring activities, see "Note 11. Restructuring, Impairment and Plant Closing Costs" to our consolidated financial statements included elsewhere in this report.
Pigments
For the year ended December 31, 2007, Pigments segment revenues increased principally from higher sales volumes primarily due to stronger customer demand in Europe and Asia. Average selling prices decreased in local currencies in both the European and North American regions due to competitive markets, offset by favorable foreign currency exchange impacts on selling prices as the U.S. dollar weakened against the relevant European currencies. Pigments segment EBITDA for the year ended December 31, 2007 decreased due to lower local currency selling prices. The positive effect on revenues caused by the strength of the major European currencies was more than offset by the negative impact on selling prices as the U.S. dollar weakened against the major European currencies.
Corporate and Other—Huntsman Corporation
Corporate and Other includes unallocated corporate overhead, foreign exchange gains and losses, loss on accounts receivable securitization program, loss on the early extinguishment of debt, other
80
non-operating income and expense, minority interest in subsidiaries' (income) loss, extraordinary gain (loss) on the acquisition of a business, Merger-related expenses, the operating results of our Australian styrenics business and the operating results of our former U.S. butadiene and MTBE business and the impact of purchase accounting adjustments. For the year ended December 31, 2007, EBITDA from Corporate and Other items decreased by $280 million to a loss of $342 million from a loss of $62 million for 2006. The reduction in EBITDA resulted primarily from $210 million of expenses incurred during the second half of 2007 associated with the Merger. For further information regarding these Merger-related expenses, see "Note 21. Income (Expenses) Associated with the Merger" to our consolidated financial statements included elsewhere in this report. EBITDA of Corporate and Other was also impacted by gains on the sale of our former U.S. butadiene and MTBE business in 2007 and 2006 of $69 million and $90 million, respectively. For further information, see "Note 4. Business Dispositions and Combinations—Sale of U.S. Butadiene and MTBE Business" to our consolidated financial statements included elsewhere in this report. In addition, Corporate and Other EBITDA was impacted by the following: an extraordinary (loss) gain of $(7) million and $56 million recorded in 2007 and 2006, respectively, related to the Textile Effects Acquisition; a $22 million increase in unallocated foreign exchange losses in 2007 which resulted from $12 million of losses in 2007 as compared with $10 million of gains in 2006; and increased information technology costs of $24 million. The decrease in Corporate and Other segment EBITDA was partially offset by the $22 million loss on disposal recorded in 2006 in connection with the U.K. Petrochemical Disposition as compared with a gain on disposal of $11 million recognized in 2007, and a $25 million decrease in expenses in 2007 related to the early extinguishment of debt. For further information regarding the extraordinary gain associated with the Textile Effects Acquisition, see "Note 4. Business Dispositions and Combinations—Textile Effects Acquisition" to our consolidated financial statements included elsewhere in this report.
Corporate and Other—Huntsman International
Corporate and Other includes unallocated corporate overhead, foreign exchange gains and losses, loss on accounts receivable securitization program, loss on the early extinguishment of debt, other non-operating income and expense, minority interest in subsidiaries' (income) loss, extraordinary gain (loss) on the acquisition of a business, the operating results of our Australian styrenics business and the operating results of our former U.S. butadiene and MTBE business. For the year ended December 31, 2007, EBITDA from Corporate and Other items decreased by $89 million to a loss of $150 million from a loss of $61 million for 2006. The reduction in EBITDA resulted primarily from the following: an extraordinary (loss) gain of $(7) million and $56 million recorded in 2007 and 2006, respectively, related to the Textile Effects Acquisition; a $22 million increase in unallocated foreign exchange losses in 2007 which resulted from $12 million of losses in 2007 as compared with $10 million of gains in 2006; and increased information technology costs of $24 million. The decrease in Corporate and Other segment EBITDA was partially offset by a reduction of $36 million in expenses in the 2007 period related to the early extinguishment of debt. In addition, Corporate and Other segment EBITDA was impacted by gains on the sale of our former U.S. butadiene and MTBE business in 2007 and 2006 of $69 million and $90 million, respectively. For further information, see "Note 4. Business Dispositions and Combinations—Sale of U.S. Butadiene and MTBE Business" to our consolidated financial statements included elsewhere in this report. For further information regarding the extraordinary gain associated with the Textile Effects Acquisition, see "Note 4. Business Dispositions and Combinations—Textile Effects Acquisition" to our consolidated financial statements included elsewhere in this report.
Polymers
The operating results of our polymers business are classified as discontinued operations, and, accordingly, the revenues of this business are excluded from revenues for all periods presented. The EBITDA of our polymers business is included in the Polymers segment EBITDA for all periods presented.
81
The decrease in Polymers segment EBITDA resulted primarily from the North American Polymers Disposition and the resulting loss on disposal of $233 million and a decrease in EBITDA from operations prior to the dispositions. For further information, see "Note 3. Discontinued Operations—North American Polymers Business" to our consolidated financial statements included elsewhere in this report.
Base Chemicals
The operating results of our base chemicals business are classified as discontinued operations, and, accordingly, the revenues of this business are excluded from revenues for all periods presented. The EBITDA of our base chemicals business is included in the Base Chemicals segment EBITDA for all periods presented.
The reduction in Base Chemicals segment EBITDA was driven primarily by the November 5, 2007 U.S. Base Chemicals Disposition and resulting loss on disposal of $146 million in 2007 as compared to a $280 million loss on the U.K. Petrochemicals Disposition in 2006 and a related gain on disposal of $28 million in 2007 and a decrease in EBITDA from operations prior to the dispositions. For further information, see "Note 3. Discontinued Operations—U.S. Base Chemicals Business" and "Note 3. Discontinued Operations—European Base Chemicals and Polymers Business" to our consolidated financial statements included elsewhere in this report.
LIQUIDITY AND CAPITAL RESOURCES
The following is a discussion of our liquidity and capital resources and generally does not include separate information with respect to Huntsman International in accordance with General Instruction I of Form 10-K.
Cash Flows for Year Ended December 31, 2008 Compared to the Year Ended December 31, 2007
Net cash provided by (used in) operating activities for the years ended December 31, 2008 and 2007 was $767 million and $(52) million, respectively. The increase in cash provided by operations was primarily attributable to $765 million of net cash received in connection with the Settlement Agreement and to a $45 million favorable year-over-year variance in operating assets and liabilities changes, offset in part by lower operating income as described in "—Results of Operations" above.
Net cash (used in) provided by investing activities for the years ended December 31, 2008 and 2007 was $(489) million and $200 million, respectively. During the years ended December 31, 2008 and 2007, we paid $418 million and $665 million, respectively, for capital expenditures. The capital expenditures for the year ended December 31, 2007 included $157 million spent on our former Port Arthur, Texas facility that was previously damaged by fire and has been sold to Flint Hills Resources. In addition, during 2007, we spent $72 million on our Greatham, U.K. expansion for our Pigments segment as compared with $29 million in 2008. During the years ended December 31, 2008 and 2007, we received $3 million and $850 million, respectively, from the sale of assets. On August 1, 2007, we completed the North American Polymers Disposition for $354 million and on November 5, 2007 we completed the U.S. Base Chemicals Disposition for $415 million. In 2006, we sold the assets comprising our former U.S. butadiene and MTBE business and received the final payment of $70 from that sale in November 2007. During the year ended December 31, 2008, we made $29 million of payments related to certain expenditures to rebuild our former Port Arthur, Texas facility, resulting in an adjustment to the sales proceeds. See "Note 3. Discontinued Operations—U.S. Base Chemicals Business" to our consolidated financial statements included elsewhere in this report. During the year ended December 31, 2008, we contributed $44 million to our ethylenamines joint venture in Saudi Arabia. During the year ended December 31, 2007, we finalized our post-closing adjustments with respect to the Textile Effects Acquisition, resulting in a reduction to the purchase price of $27 million.
82
Net cash provided by financing activities for the year ended December 31, 2008 was $230 million as compared with a use of cash of $269 million in the 2007 period. This increase in net cash provided by financing activities was primarily due to the issuance of the Convertible Notes in connection with the Settlement Agreement and lower net repayments of debt in the 2008 period as compared to the 2007 period. For more information regarding the issuance of the Convertible Notes, see "—Convertible Notes" below.
Cash Flows for the Year Ended December 31, 2007 Compared to the Year Ended December 31, 2006
Net cash (used in) provided by operating activities for the years ended December 31, 2007 and 2006 was $(52) million and $892 million, respectively. The decrease in cash provided by operating activities was primarily attributable to $196 million of cash used in 2007 to build working capital as compared with $148 million of cash generated in 2006 from the reduction of working capital. Net cash from operating activities was also impacted by a decrease in operating income as described in "Results of Operations" above and the payment of the Basell Termination Fee as described in "Note 21. Income (Expenses) Associated with the Merger" to our consolidated financial statements included elsewhere in this report.
Net cash provided by investing activities for the years ended December 31, 2007 and 2006 was $200 million and $174 million, respectively. During the years ended December 31, 2007 and 2006, we invested $665 million and $550 million, respectively, in capital expenditures. The increase in capital expenditures was largely attributable to the $157 million of capital expenditures incurred during the year ended December 31, 2007 for the rebuild of our Port Arthur, Texas olefins facility that was damaged by fire and to $72 million of capital expenditures on our Greatham, U.K. expansion for our Pigments divisions. During the year ended December 31, 2007 we finalized our post-closing working capital adjustments with respect to the Textile Effects Acquisition, resulting in a reduction to the purchase price of $27 million, and acquired businesses for $14 million. During the year ended December 31, 2006, we acquired the Textile Effects business for $177 million, net of cash acquired. During the years ended December 31, 2007 and 2006, we sold assets and received proceeds of $850 million and $895 million, respectively. On August 1, 2007, we completed the North American Polymers Disposition to Flint Hills Resources for $354 million, and on November 5, 2007 we completed the U.S. Base Chemicals Disposition to Flint Hills Resources for $415 million. On June 27, 2006, we sold the assets comprising our former U.S. butadiene and MTBE business for $274 million, of which $204 million was paid to us during 2006. The additional $70 million was paid to us on November 9, 2007 after the successful restart of our Port Arthur, Texas olefins unit that was damaged by fire. On December 29, 2006, we sold our European base chemicals and polymers business for $685 million in cash. For further information, see "Note 4. Business Dispositions and Combinations" to our consolidated financial statements included elsewhere in this report.
Net cash used in financing activities for the year ended December 31, 2007 was $269 million as compared with $961 million in 2006. This decrease in net cash used in financing activities is partly due to lower net repayments of debt in 2007 compared to 2006 and an increase in dividends paid to common stockholders in 2007 of $88 million. During the year ended December 31, 2007, we had net repayments under our debt arrangements of $162 million and used $1 million to pay premiums associated with repayment of indebtedness. In the first quarter 2007, we repaid in full our remaining 10.125% subordinated notes due 2009 of $150 million with proceeds from our offering of 7.875% subordinated notes due 2014 of $152 million. Additionally, in the second quarter 2007, we amended our Senior Credit Facilities, increasing our U.S. dollar denominated term loan by $97 million, and we used the proceeds to repay in full our euro denominated term loan. During the year ended December 31, 2006, we had net repayments under our debt arrangements of $914 million and used $30 million to pay premiums associated with the repayment of indebtedness.
83
Changes in Financial Condition
The following information summarizes our working capital position as of December 31, 2008 and December 31, 2007 (dollars in millions):
| |
December 31, 2008 |
December 31, 2007 |
Increase (Decrease) |
Percent Change |
|||||||||
|---|---|---|---|---|---|---|---|---|---|---|---|---|---|
Cash and cash equivalents |
$ | 657 | $ | 154 | $ | 503 | 327 | % | |||||
Restricted cash |
5 | — | 5 | NM | |||||||||
Accounts receivable, net |
913 | 1,262 | (349 | ) | (28 | )% | |||||||
Inventories, net |
1,500 | 1,452 | 48 | 3 | % | ||||||||
Prepaid expenses |
45 | 37 | 8 | 22 | % | ||||||||
Deferred income taxes |
21 | 73 | (52 | ) | (71 | )% | |||||||
Other current assets |
99 | 117 | (18 | ) | (15 | )% | |||||||
Total current assets |
3,240 | 3,095 | 145 | 5 | % | ||||||||
Accounts payable |
747 |
1,018 |
(271 |
) |
(27 |
)% |
|||||||
Accrued liabilities |
617 | 885 | (268 | ) | (30 | )% | |||||||
Deferred income taxes |
36 | 3 | 33 | NM | |||||||||
Current portion of long-term debt |
205 | 69 | 136 | 197 | % | ||||||||
Total current liabilities |
1,605 | 1,975 | (370 | ) | (19 | )% | |||||||
Working capital |
$ | 1,635 | $ | 1,120 | $ | 515 | 46 | % | |||||
Our working capital increased by $515 million as a result of the net impact of the following significant changes:
Debt and Liquidity
Our direct debt and guarantee obligations consist of our Convertible Notes, guarantees of certain debt of HPS and SLIC, our Chinese MDI joint ventures, guarantees of certain debt of our Saudi Arabia joint venture and certain indebtedness incurred from time to time to finance certain insurance premiums. We have no other direct debt or guarantee obligations, and all of the additional debt discussed below has been incurred by our subsidiaries (primarily Huntsman International); such
84
subsidiary debt is nonrecourse to us and we have no contractual obligation to fund our subsidiaries' respective operations.
Senior Credit Facilities
As of December 31, 2008, our Senior Credit Facilities consisted of our (i) $650 million Revolving Facility and (ii) $1,540 million term loan B facility (the "Dollar Term Loan"). As of December 31, 2008, there were no borrowings outstanding under the Revolving Facility, and we had $32 million in U.S. dollar equivalents of letters of credit and bank guarantees issued and outstanding under the Revolving Facility. The Revolving Facility matures in August 2010 and the Dollar Term Loan matures in 2014; provided, however, that the maturities of the Revolving Facility and the Dollar Term Loan will accelerate if we do not repay or refinance all but $100 million of our outstanding debt securities on or before three months prior to the maturity dates of such debt securities (the next maturity date of such debt securities is October 2010).
At the present time, borrowings under the Revolving Facility and the Dollar Term Loan bear interest at LIBOR plus 1.75%. However, the applicable interest rate of the Dollar Term Loan is subject to a reduction to LIBOR plus 1.50% upon achieving certain secured leverage ratio thresholds. The agreements governing our Secured Credit Facilities contain one financial covenant, which is applicable only to the Revolving Facility, and this covenant is only in effect when loans or letters of credit are outstanding under the Revolving Facility. In addition, the applicable agreements provide for customary restrictions and limitations on our ability to incur liens, incur additional debt, merge or sell assets, make certain restricted payments, prepay other indebtedness, make investments or engage in transactions with affiliates, and also contain other customary default provisions.
As of December 31, 2008, the weighted average interest rate on the Senior Credit Facilities was approximately 2.3%. Our obligations under the Senior Credit Facilities are guaranteed by our guarantor subsidiaries, which consist of substantially all of our domestic subsidiaries and certain of our foreign subsidiaries (collectively, the "Guarantors"), and are secured by a first priority lien (generally shared with the holders of the 2010 Secured Notes (defined below)) on substantially all of our domestic property, plant and equipment, the stock of all of or our material domestic subsidiaries and certain foreign subsidiaries and pledges of intercompany notes between various of our subsidiaries.
On November 14, 2007, in connection with the U.S. Base Chemicals Disposition, we used a portion of the proceeds to make a repayment of $100 million on the Dollar Term Loan. Substantially all of the remaining proceeds were used to repay borrowings under the Revolving Facility and reduce amounts under the A/R Securitization Program.
On April 19, 2007, we entered into an amendment to our Senior Credit Facilities. Pursuant to this amendment, the maturity of the Dollar Term Loan was extended to April 2014 and the loan amount was increased to $1,640 million. We used the increased amount to repay, in full, our previously outstanding euro term loan facility (the "Euro Term Loan").
On January 16, 2007, we made a voluntary repayment of $75 million U.S. dollar equivalents on our term loan B facility ($71 million on the Dollar Term Loan and €3 million on the Euro Term Loan) with available liquidity.
Secured Notes
As of December 31, 2008, we had outstanding $296 million aggregate principal amount ($295 million book value and $455 million original aggregate principal amount) under our 11.625% senior secured notes due October 15, 2010 (the "2010 Secured Notes"). The 2010 Secured Notes are currently redeemable at 102.906% of the principal amount plus accrued interest, declining to par on and after October 15, 2009. Interest on the 2010 Secured Notes is payable semiannually in April and
85
October of each year. The 2010 Secured Notes are secured by a first priority lien on all collateral securing the Senior Credit Facilities as described above (other than capital stock of Huntsman International's first-tier foreign subsidiaries), shared equally with the lenders on the Senior Credit Facilities, subject to certain inter-creditor arrangements. The 2010 Secured Notes contain covenants relating to the incurrence of debt and limitations on distributions, certain restricted payments, asset sales and affiliate transactions and are guaranteed by the Guarantors. The indentures governing the 2010 Secured Notes also contain provisions requiring us to offer to repurchase the notes upon a change of control.
Senior Notes
As of December 31, 2008, we had outstanding $198 million ($300 million original aggregate principal amount) of 11.5% senior notes due 2012 (the "2012 Senior Notes"). Interest on the 2012 Senior Notes is payable semiannually in January and July of each year. The 2012 Senior Notes are currently redeemable at 105.75% of the principal amount plus accrued interest, declining ratably to par on and after July 15, 2010. The 2012 Senior Notes are unsecured obligations. The indentures governing our 2012 Senior Notes contain covenants, among other things, relating to the incurrence of debt and limitations on distributions and certain restricted payments, asset sales and affiliate transactions and are guaranteed by the Guarantors. The indentures governing the 2012 Senior Notes contain provisions requiring us to offer to repurchase the notes upon a change of control.
Subordinated Notes
As of December 31, 2008, we had outstanding $175 million 7.375% senior subordinated notes due 2015 and €135 million (approximately $191 million) 7.5% senior subordinated notes due 2015 (collectively, the "2015 Subordinated Notes"). The 2015 Subordinated Notes are redeemable on or after January 1, 2010 at 103.688% and 103.750%, respectively, of the principal amount plus accrued interest, declining ratably to par on and after January 1, 2013.
As of December 31, 2008, we had outstanding €400 million (approximately $567 million) 6.875% senior subordinated notes due 2013 (the "2013 Subordinated Notes") and $347 million aggregate principal amount ($352 million book value) under our 7.875% senior subordinated notes due 2014 (the "2014 Subordinated Notes"). The 2013 Subordinated Notes are redeemable on or after November 15, 2009 at 105.156% of the principal amount plus accrued interest, declining ratably to par on or after November 15, 2012. The 2014 Subordinated Notes are redeemable on or after November 15, 2010 at 103.938% of the principal amount plus accrued interest, declining ratably to par on or after November 15, 2012.
Interest on the 2015 Subordinated Notes is payable semiannually in January and July of each year. Interest on the 2013 Subordinated Notes and the 2014 Subordinated Notes is payable semiannually in November and May of each year. All of our subordinated notes are unsecured. The indentures governing our subordinated notes contain covenants relating, among other things, to the incurrence of debt and limitations on distributions, certain restricted payments, asset sales and affiliate transactions. Our subordinated notes are guaranteed by the Guarantors. The indentures also contain provisions requiring us to offer to repurchase the notes upon a change of control.
In February 2007, we closed on a direct private placement of $147 million (included within the total outstanding principal amount of $347 million of 2014 Subordinated Notes) in aggregate principal amount of the 2014 Subordinated Notes. These notes were issued at a premium of 104% of principal amount for a yield of 7.01%. We used the net proceeds of $152 million to redeem all (approximately €114 million) of our remaining outstanding euro denominated 10.125% senior subordinated notes due 2009, which were called for redemption on March 27, 2007 at a call price of 101.688% plus accrued interest.
86
Convertible Notes
Pursuant to the Settlement Agreement on December 23, 2008, we issued $250 million in Convertible Notes (recorded at $235 million fair value). The Convertible Notes will be convertible at any time, at the option of the holder, at an initial conversion rate of 127.275 shares of our common stock per $1,000 principal amount of Convertible Notes (which is equal to an initial conversion price of $7.857 per share), subject to specified anti-dilution adjustments. The Convertible Notes will bear interest at the rate of 7% per year payable semi-annually on January 1 and July 1 of each year, beginning on July 1, 2009. Interest is payable either in cash or, at our option, in shares of our common stock having a market value at that time equal to the interest payment. The Convertible Notes are our senior unsecured obligations and are not guaranteed by any of our subsidiaries, including Huntsman International.
The Convertible Notes will mature on December 23, 2018. At maturity, we may, at our option, pay the principal amount of the Convertible Notes in shares of our common stock having a market value at that time equal to the principal amount of the Convertible Notes, plus an amount equal to the underwriting spread of a nationally-recognized underwriter chosen by us that would be paid by a seller of the shares at such time.
We may redeem the Convertible Notes in whole, for cash, at the principal amount of the Convertible Notes plus accrued and unpaid interest, at any time on or after December 23, 2011 if the closing price of our common stock, for at least 20 consecutive trading days prior to the notice of redemption, exceeds 135% of the conversion price in effect at that time.
Upon occurrence of certain change of control events, the holders of the Convertible Notes may require us to redeem all or any portion of the holders' Convertible Notes at the principal amount plus accrued and unpaid interest.
Other Debt
We maintain a $25 million European Overdraft Facility that is a demand facility used for the working capital needs for our European subsidiaries ("European Overdraft Facility"). As of December 31, 2008 and December 31, 2007, we had $16 million and $15 million U.S. dollar equivalents, respectively, in borrowings outstanding under the European Overdraft Facility. We also maintain other foreign overdraft facilities used for working capital needs.
HPS obtained secured loans for the construction of its MDI production facility. This debt consists of various committed loans. As of December 31, 2008, HPS had $25 million outstanding in U.S. dollar borrowings and 672 million in RMB borrowings (approximately $98 million) under these facilities. The interest rate on these facilities is LIBOR plus 0.48% for U.S. dollar borrowings and 90% of the Peoples Bank of China rate for RMB borrowings. As of December 31, 2008, the interest rate was approximately 3.1% for U.S. dollar borrowings and 6.5% for RMB borrowings. The loans are secured by substantially all the assets of HPS and will be repaid in 16 semiannual installments (which began on June 30, 2007). We have guaranteed 70% of any amount due and unpaid by HPS under the loans described above (except for the VAT facility, which is not guaranteed). Our guarantees remain in effect until HPS has met certain conditions. The conditions outstanding include completion of the building and equipment mortgage registrations, which are progressing as planned, and maintaining a debt service coverage ratio of at least 1.5:1 at the time such registrations are completed. Our Chinese MDI joint ventures are unrestricted subsidiaries under the Senior Credit Facilities and under the indentures governing our outstanding notes.
87
On October 22, 2008, HPS entered into a loan facility for the purpose of discounting commercial drafts with recourse. The facility has a stated capacity discounting up to CNY500 million (approximately $73 million) and drafts are discounted using a discount rate of 3-months Shanghai Inter-Bank Offer Rate (SIBOR) plus 4.2%. As of December 31, 2008, the all-in discount rate was 6.39%. As of December 31, 2008, HPS has discounted with recourse CNY500 million (approximately $73 million) of commercial drafts. While the facility has a maturity of July 24, 2009, the lender has the right to accept or reject drafts presented for discounting.
Our Australian subsidiaries maintain credit facilities that had an aggregate outstanding balance of A$59 million (approximately $41 million) as of December 31, 2008 ($30 million of which is classified as current portion of long term debt). These facilities are nonrecourse to Huntsman International and bear interest at the Australian index rate plus a margin of 2.4%. As of December 31, 2008, the interest rate for these facilities was 7.0%. The Australian credit facilities mature in May 2010.
We finance certain insurance premiums and, as of December 31, 2008 and 2007, we had outstanding notes payable in the amount of $23 million and $27 million, respectively. Insurance premium financings are generally secured by the unearned premiums under such policies.
On June 30, 2008, our subsidiary, Huntsman (UK) Limited, entered into a $125 million short term committed revolving credit facility maturing on June 28, 2009 (the "Short Term Revolving Facility"). In connection with an amendment to the A/R Securitization Program on November 13, 2008, we terminated the short term committed revolving credit facility of our subsidiary, Huntsman (UK) Limited, of which nothing was drawn. See "Note 16. Securitization of Accounts Receivable" to our consolidated financial statements included elsewhere in this report.
Notes Payable from Huntsman International to Huntsman Corporation
Under an existing promissory note, as of December 31, 2008 we lent $423 million to our subsidiary, Huntsman International, which funds were used by Huntsman International to repay borrowings outstanding under the Revolving Facility. This demand note is unsecured and is classified as current on the consolidated balance sheets included elsewhere in this report. As of December 31, 2008, under the terms of the note, Huntsman International promises to pay us interest on the unpaid principal amount thereof in like money at a rate per annum not to exceed 25 basis points (0.25%) less than the then current revolving loan U.S. LIBOR-based borrowing as defined by the Revolving Facility. On January 6, 2009, the interest rate was amended to a rate per annum based on the previous monthly average borrowing rate obtained under our A/R Securitization Program for U.S. dollar outstandings less 10 basis points. Notwithstanding the foregoing, the rate shall not exceed an amount that is 25 basis points less than the monthly average borrowing rate obtained for the U.S. LIBOR-based borrowings under the Revolving Facility. With our consent the principal and accrued interest outstanding under this Note may also be forgiven or capitalized or satisfied with any alternate form of consideration.
Compliance with Covenants
Our management believes that we are in compliance with the covenants contained in the agreements governing our debt instruments, including our Senior Credit Facilities, our A/R Securitization Program and the indentures governing our notes.
We have only one financial covenant under our Senior Credit Facilities (the "Leverage Covenant"), which applies to our $650 million Revolving Facility. At any time loans or letters of credit are outstanding under our Revolving Facility, the Leverage Covenant requires that Huntsman International maintain a net secured debt to EBITDA ratio of 3.75 to 1 (as defined in the applicable agreement, the "Secured Leverage Ratio").
88
If in the future we were not able to meet the Secured Leverage Ratio, unless we obtained an amendment or waiver (as to which we can provide no assurance), then, for so long as we did not meet the Secured Leverage Ratio, we would not have access to the liquidity otherwise available under our Revolving Facility. If we failed to meet the Secured Leverage Ratio at a time when we had loans or letters of credit outstanding under the Revolving Facility, we would be in default under our Senior Credit Facilities, and, unless we obtained a waiver or forbearance with respect to such default (as to which we can provide no assurance), we would be required to pay off the balance of our Senior Credit Facilities in full and would not have further access to such facilities.
The agreements governing our $575 million A/R Securitization Program also contain certain financial covenants. Any material failure to meet the A/R Securitization Program covenants in the future could lead to an event of default under the A/R Securitization Program, which could require us to cease our use of such facility. Under these circumstances, unless any default was remedied or waived, we would likely lose the ability to obtain financing with respect to our trade receivables. A material default under the A/R Securitization Program would also constitute an event of default under our Senior Credit Facilities, which could require us to pay off the balance of the Senior Credit Facilities in full and could result in the loss of our Senior Credit Facilities.
Short-Term and Long-Term Liquidity
During December 2008, pursuant to the Settlement Agreement, Hexion, Apollo and their affiliates paid us $1 billion (including the proceeds from the sale of the Convertible Notes). Prior to our receipt of such proceeds under the Settlement Agreement, we were highly dependent on our credit facilities and other debt instruments to provide liquidity for our operations and working capital needs. While we remain dependent upon our credit facilities and other debt instruments to meet our liquidity needs, as of December 31, 2008, we had $662 million of cash and restricted cash. We used $423 million of the Settlement Agreement proceeds to repay the Revolving Facility in full as of December 31, 2008.
As of December 31, 2008, we had $1,291 million of combined cash and unused borrowing capacity, consisting of the following:
Our liquidity can be significantly impacted by changes in working capital. For the year ended December 31, 2008, our accounts receivable and inventory, net of accounts payable in 2008, increased by $42 million, as reflected on our consolidated statement of cash flows included elsewhere in this report. We expect volatility to continue in our working capital components in 2009. We have various restructuring programs ongoing and we expect to spend approximately $125 million related to our restructuring plans during 2009. For a discussion of restructuring, impairment and plant closing costs, see "Note 11. Restructuring, Impairment and Plant Closing Costs" to our consolidated financial statements included elsewhere in this report.
During 2009 we expect to spend approximately $230 million in capital expenditures as compared to $418 million for the year ended December 31, 2008. We expect to fund our restructuring and capital expenditures through a combination of available cash, cash flows from operations and financing arrangements.
We currently have $205 million classified as current portion of long-term debt. For more information, see "Note 14. Debt" to our consolidated financial statements included elsewhere in this report. As of December 31, 2008, our current portion of long-term debt includes various short term
89
facilities, including but not limited to our HPS draft discounting facility in China that had amounts outstanding of $73 million, our Australian credit facilities of $30 million and our insurance premium financings of $23 million. Although we can make no assurances, we currently intend to extend these debt instruments beyond their stated maturities.
On April 29, 2006, we experienced fire damage at our Port Arthur, Texas facility. This facility has been subsequently rebuilt and sold. In connection with this fire damage, we have received partial insurance proceeds to date of $365 million, of which $40 million was received in December 2008. We have claimed an additional $235 million as of December 31, 2008 as presently due and owing and unpaid under our insurance policies, and anticipate filing additional claims. The settlement of insurance claims will continue during 2009. Any anticipated additional net recoveries are expected to be used to repay secured debt. See "Note 22. Commitments and Contingencies—Port Arthur Plant Fire Insurance Litigation" and "Note 24. Casualty Losses and Insurance Recoveries—Port Arthur, Texas Plant Fire" to our consolidated financial statements included elsewhere in this report.
During the first half of 2009, we expect to complete our acquisition of the Baroda Textile Effects (India) ("Baroda") division of Metrochem Industries, Ltd, subject to certain conditions being met. We estimate the purchase price, including certain working capital positions, to be approximately $29 million (U.S. dollar equivalents), pursuant to a non-binding agreement in principle between Baroda and our Company. This purchase price excludes from working capital the receivables existing on the closing date due to Baroda from our affiliates, which will be settled in the ordinary course. We believe that the majority of the purchase price will be funded through local Indian financing.
As of December 31, 2008, the amount outstanding under our A/R Securitization Program was $446 million compared with $428 million at December 31, 2007. This program was amended in November 2008 and was extended through November 2009. This facility fluctuates in capacity depending on the program's eligible receivables base which is influenced by such factors as market demand, pricing and foreign currency rates. Although we can make no assurances, we intend to extend the A/R Securitization Program beyond its stated term. See "Note 16. Accounts Receivable Securitization Program" to our consolidated financial statements included elsewhere in this report.
Contractual Obligations and Commercial Commitments
Our obligations under long-term debt (including the current portion), lease agreements and other contractual commitments as of December 31, 2008 are summarized below (dollars in millions):
| |
2009 | 2010-2011 | 2012-2013 | After 2013 | Total | |||||||||||
|---|---|---|---|---|---|---|---|---|---|---|---|---|---|---|---|---|
Long-term debt, including current portion |
$ | 205 | $ | 413 | $ | 825 | $ | 2,439 | $ | 3,882 | ||||||
Interest(1) |
218 | 376 | 260 | 133 | 987 | |||||||||||
Operating leases |
47 | 84 | 60 | 96 | 287 | |||||||||||
Purchase commitments(2) |
157 | 183 | 113 | 75 | 528 | |||||||||||
Total(3)(4) |
$ | 627 | $ | 1,056 | $ | 1,258 | $ | 2,743 | $ | 5,684 | ||||||
90
is variable based upon market prices, subject to annual negotiations. We have estimated our contractual obligations by using the terms of our 2008 pricing for each contract. We also have a limited number of contracts which require a minimum payment even if no volume is purchased. We believe that all of our purchase obligations will be utilized in our normal operations.
| |
2009 | 2010-2011 | 2012-2013 | 5-Year Average Annual | |||||||||
|---|---|---|---|---|---|---|---|---|---|---|---|---|---|
Pension plans |
$ | 143 | $ | 318 | $ | 296 | $ | 132 | |||||
Other postretirement obligations |
13 | 27 | 26 | 12 | |||||||||
Off-Balance Sheet Arrangements
Receivables Securitization
For a discussion of our A/R Securitization Program, see "Note 16. Securitization of Accounts Receivable" to our consolidated financial statements included elsewhere in this report.
Guarantees
On September 19, 2003, SLIC obtained secured financing for the construction of production facilities. SLIC obtained various committed loans in the aggregate amount of approximately $230 million in U.S. dollar equivalents. As of December 31, 2008, there were $68 million and RMB 840 million (approximately $123 million) in outstanding borrowings under these facilities. The interest rate on these facilities is LIBOR plus 0.48% for U.S. dollar borrowings and 90% of the Peoples Bank of China rate for RMB borrowings. The loans are secured by substantially all the assets of SLIC and will be paid in 16 semiannual installments (of which 13 installments remain), which began on June 30, 2007. We unconditionally guarantee 35% of any amounts due and unpaid by SLIC under the loans described above (except for the VAT facility which is not guaranteed). Our guarantee remains in effect until SLIC has met certain conditions. The conditions outstanding include completion of the building and equipment mortgage registrations, which are progressing as planned, and maintaining a debt service coverage ratio of at least 1:1 at the time such registrations are completed. We have estimated that the fair value of this guarantee is nil as of the closing of the transaction and, accordingly, no amounts have been recorded.
Our unconsolidated Saudi Arabia joint venture with Zamil Group obtained various loan commitments in the aggregate amount of approximately $195 million in U.S. dollar equivalents, of which $45 million was drawn under a short term bridge loan facility as of December 31, 2008. We have provided certain guarantees of approximately $14 million for these commitments, and our guarantees will terminate upon completion of the project and satisfaction of certain other conditions. We have estimated that the fair value of such guarantees was nil as of the closing date of this transaction and, accordingly, no amounts have been recorded. In connection with the funding of this joint venture, in December 2008 one of our subsidiaries obtained financing from a Saudi bank of approximately $10 million U.S. dollar equivalents for a portion of our share of our equity contribution previously made.
91
Restructuring, Impairment and Plant Closing Costs
For a discussion of restructuring, impairment and plant closing costs, see "Note 11. Restructuring, Impairment and Plant Closing Costs" to our consolidated financial statements included elsewhere in this report.
Legal Proceedings
For a discussion of legal proceedings, see "Note 22. Commitments and Contingencies—Legal Matters" to our consolidated financial statements included elsewhere in this report.
Environmental, Health and Safety Matters
For a discussion of environmental, health and safety matters, see "Note 23. Environmental, Health and Safety Matters" to our consolidated financial statements included elsewhere in this report.
RECENTLY ISSUED ACCOUNTING PRONOUNCEMENTS
For a discussion of recently issued accounting pronouncements, see "Note 2. Summary of Significant Accounting Policies—Recently Issued Accounting Pronouncements" to our consolidated financial statements included elsewhere in this report.
CRITICAL ACCOUNTING POLICIES
The preparation of financial statements and related disclosures in conformity with accounting principles generally accepted in the U.S. requires management to make judgments, estimates and assumptions that affect the reported amounts in the consolidated financial statements. Our significant accounting policies are summarized in "Note 2. Summary of Significant Accounting Policies" to our consolidated financial statements included elsewhere in this report. Summarized below are our critical accounting policies:
Casualty Losses and Insurance Recoveries
PORT ARTHUR, TEXAS PLANT FIRE
On April 29, 2006, our Port Arthur, Texas olefins manufacturing plant (which we sold in November 2007) experienced a major fire. With the exception of cyclohexane operations at the site, which were restarted in June 2006, the operations at the site were shutdown until the fourth quarter of 2007. The Port Arthur manufacturing plant is covered by property damage and business interruption insurance. With respect to coverage for this outage, the deductible for property damage is $10 million and business interruption coverage does not apply for the first 60 days, subject to a combined deductible for property damage and business interruption of $60 million.
Through December 31, 2008, we received partial recovery advances on this loss totaling $365 million, including $40 million received in December 2008. We have claimed an additional approximately $235 million as of December 31, 2008, as presently due and owing and unpaid under the insurance policy for losses caused by the fire, and anticipate filing additional claims. On December 29, 2008, we reached a partial settlement with certain of the Reinsurers (the "Partial Fire Insurance Settlement") whereby we received a partial claim reimbursement of $40 million and we and the Reinsurers agreed to dismiss all legal suits arising from this insured loss and to participate in non-binding mediation scheduled to occur in February 2009 and, if the non-binding mediation is not successful, in binding arbitration targeted to occur in the later half of 2009. Also as part of the Partial Fire Insurance Settlement, the Reinsurers that are parties to such agreement agreed that none of their respective portion, or $340 million of the $365 million of partial recovery advances received to date are refundable (those insurers representing the other $25 million portion received to date were not
92
required to enter into this agreement because their coverage limits had been exhausted at much lower levels).
Through December 31, 2008, we had recorded $190 million of repair and maintenance costs and fixed costs incurred during the business interruption period and had recognized in earnings a corresponding amount of the partial recovery amounts. Prior to the Partial Fire Insurance Settlement, we had deferred recognition of the gain associated with partial recovery advances and these amounts were included in accrued liabilities on the accompanying consolidated balance sheets. As a result of the Partial Fire Insurance Settlement, we recognized a gain of $175 million in the fourth quarter of 2008 which represented all previously deferred insurance recovery gain amounts. The following table describes changes to the deferred insurance recovery gain during the years ended December 31, 2008, 2007 and 2006 (dollars in millions):
| |
2008 | 2007 | 2006 | ||||||||
|---|---|---|---|---|---|---|---|---|---|---|---|
Balance at January 1 |
$ | 137 | $ | 94 | $ | — | |||||
Insurance recovery advances |
40 | 175 | 150 | ||||||||
Incurrence of repair and maintenance costs during the period |
(2 | ) | (52 | ) | (17 | ) | |||||
Incurrence of fixed costs during the business interruption period |
— | (80 | ) | (39 | ) | ||||||
Recognition of deferred gain in connection with the Partial |
|||||||||||
Fire Insurance Settlement |
(175 | ) | — | — | |||||||
Balance as of December 31 |
$ | — | $ | 137 | $ | 94 | |||||
Future collections on this insured loss, if any, will represent additional income for us upon final settlement.
2005 U.S. GULF COAST STORMS
On September 22, 2005, we sustained property damage at our Port Neches and Port Arthur, Texas facilities as a result of a hurricane. We maintain customary insurance coverage for property damage and business interruption. With respect to coverage of these losses, the deductible for property damage was $10 million per site, while business interruption coverage does not apply for the first 60 days.
During 2007 and 2006, we received insurance recovery advances of $38 million related to the 2005 Gulf Coast storms. On December 12, 2008, the insurers agreed to pay an additional $3 million of insurance recovery advances related to the 2005 Gulf Coast storms, of which $2 million was received as of December 31, 2008. We and our insurers are working to reach a settlement on the remainder of the insurance claim, and we can provide no assurance with respect to the ultimate resolution of this matter. Any future collections will represent income for us upon final settlement.
Fair Value of Convertible Notes
Pursuant to the Settlement Agreement, on December 23, 2008, we issued $250 million of our Convertible Notes to Apollo affiliates under the Note Purchase Agreement. In accordance with Statement of Financial Accounting Standards ("SFAS") No. 157, Fair Value Measurements, and the guidance included in FASB Staff Position ("FSP") No. 157-3, Determining the Fair Value of a Financial Asset When the Market for That Asset Is Not Active, we recorded these Convertible Notes in our accounting records at a fair value of $235 million.
We primarily used the income approach to determine the fair value of the Convertible Notes. Fair value is based on the present value of estimated future cash flows, calculated using management's best estimates of key assumptions including relevant interest rates, expected share volatility, dividend yields, and the probabilities associated with certain features of the Convertible Notes. We also used the
93
market approach to assess comparables and corroborate the fair value determined using the income approach.
Management used judgment with respect to assumptions used in estimating the fair value of the Convertible Notes. The effect of the following changes in certain key assumptions is summarized as follows (dollars in millions):
Assumptions
|
Balance Sheet Impact(1) | |||
|---|---|---|---|---|
Expected volatility |
||||
—10% increase |
6 | |||
—10% decrease |
(7 | ) | ||
Effective market yield |
||||
—1% increase |
(6 | ) | ||
—1% decrease |
6 | |||
Revenue Recognition
We generate substantially all of our revenues through sales in the open market and long-term supply agreements. We recognize revenue when it is realized or realizable and earned. Revenue for product sales is recognized when a sales arrangement exists, risk and title to the product transfer to the customer, collectibility is reasonably assured and pricing is fixed or determinable. The transfer of risk and title to the product to the customer usually occurs at the time shipment is made.
Revenue arrangements that contain multiple deliverables, which relate primarily to the licensing of technology, are evaluated in accordance with Emerging Issues Task Force ("EITF") Issue No. 00-21, Revenue Arrangements with Multiple Deliverables, to determine whether the arrangements should be divided into separate units of accounting and how the arrangement consideration should be measured and allocated among the separate units of accounting.
Long-Lived Assets
The determination of useful lives of our property, plant and equipment is considered a critical accounting estimate. Such lives are estimated based upon our historical experience, engineering estimates and industry information and are reviewed when economic events indicate that we may not be able to recover the carrying value of the assets. The estimated lives of our property range from 3 to 33 years and depreciation is recorded on the straight-line method. Inherent in our estimates of useful lives is the assumption that periodic maintenance and an appropriate level of annual capital expenditures will be performed. Without on-going capital improvements and maintenance, the productivity and cost efficiency declines and the useful lives of our assets would be shorter.
Management uses judgment to estimate the useful lives of our long-lived assets. If the useful lives of our property, plant and equipment as of December 31, 2008 were to have been estimated to be one year greater or one year less, then depreciation expense for the year ended December 31, 2008 would have been approximately $24 million less or $28 million greater, respectively.
We are required to evaluate our plant assets whenever events indicate that the carrying value may not be recoverable in the future or when management's plans change regarding those assets, such as idling or closing a plant. We evaluate impairment by comparing undiscounted cash flows of the related asset groups to the carrying value. Key assumptions in determining the future cash flows include the useful life, technology, competitive pressures, raw material pricing and regulations.
94
Goodwill
We review our goodwill for impairment annually, at the beginning of the third quarter, and when events and circumstances change that would more likely than not reduce the fair value of a reporting unit below its carrying amount. Goodwill has been assigned to reporting units for purposes of impairment testing. Substantially all of our goodwill balance relates to our advanced materials business, a reporting unit within our Materials and Effects segment.
Fair value is estimated using the market approach, as well as the income approach based on discounted cash flow projections. The estimated fair values of our reporting units are dependent on several significant assumptions including, among others, market information, operating results, earnings projections and anticipated future cash flows.
We previously tested goodwill for impairment at the beginning of the third quarter of 2008 as part of the annual impairment testing procedures and determined that no goodwill impairment existed. Since our annual impairment testing procedures, our market capitalization has declined below the net book value of our company. We have evaluated the movement in our stock price as it relates to the fair values of our reporting units. Based on this evaluation, we determined that we did not have a triggering event in the fourth quarter that would require an interim goodwill impairment test.
Restructuring and Plant Closing Costs
We have recorded restructuring charges in recent periods in connection with closing certain plant locations, work force reductions and other cost savings programs. These charges are recorded when management has committed to a plan and incurred a liability related to the plan. Also in connection with the Textile Effects Acquisition, we recorded liabilities for workforce reduction, non-cancelable lease termination costs and demolition, decommissioning and other restructuring costs. Estimates for plant closing costs include the write-off of the carrying value of the plant, any necessary environmental and/or regulatory costs, contract termination and demolition costs. Estimates for work force reductions and other costs savings are recorded based upon estimates of the number of positions to be terminated, termination benefits to be provided and other information as necessary. While management evaluates the estimates on a quarterly basis and will adjust the reserve when information indicates that the estimate is above or below the initial estimate, management's estimates on a project-by-project basis have not varied to a material degree. For further discussion of our restructuring activities, see "Note 11. Restructuring, Impairment and Plant Closing Costs" to our consolidated financial statements included elsewhere in this report.
Income Taxes
We use the asset and liability method of accounting for income taxes. Deferred income taxes reflect the net tax effects of temporary differences between the carrying amounts of assets and liabilities for financial and tax reporting purposes. We evaluate deferred tax assets to determine whether it is more likely than not that they will be realized. Valuation allowances are reviewed each period on a tax jurisdiction by tax jurisdiction basis to analyze whether there is sufficient positive or negative evidence to support a change in judgment about the realizability of the related deferred tax assets.
We do not provide for income taxes or benefits on the undistributed earnings of our non-U.S. subsidiaries as earnings are reinvested and, in the opinion of management, will continue to be reinvested indefinitely.
We adopted FIN 48, Accounting for Uncertainty in Income Taxes—an interpretation of FASB Statement No. 109, on January 1, 2007. FIN 48 clarifies the accounting for uncertainty in income taxes recognized in accordance SFAS No. 109, Accounting for Income Taxes, by prescribing a recognition
95
threshold and measurement attribute for the financial statement recognition and measurement of a tax position taken or expected to be taken in a tax return. The application of income tax law is inherently complex. We are required to determine if an income tax position meets the criteria of more-likely-than-not to be realized based on the merits of the position under tax laws, in order to recognize an income tax benefit. This requires us to make many assumptions and judgments regarding merits of income tax positions and the application of income tax law. Additionally, if a tax position meets the recognition criteria of more-likely-than-not we are required to make judgments and assumptions to measure the amount of the tax benefits to recognize based on the probability of the amount of tax benefits that would be realized if the tax position was challenged by the taxing authorities. Interpretations and guidance surrounding income tax laws and regulations change over time. As a consequence, changes in assumptions and judgments can materially affect amounts recognized in the consolidated financial statements.
Employee Benefit Programs
We sponsor several contributory and non-contributory defined benefit plans, covering employees primarily in the U.S., the U.K., the Netherlands, Belgium and Switzerland, but also covering employees in a number of other countries. We fund the material plans through trust arrangements (or local equivalents) where the assets are held separately from us. We also sponsor unfunded postretirement plans which provide medical and life insurance benefits covering certain employees in the U.S. and Canada. Amounts recorded in the consolidated financial statements are recorded based upon actuarial valuations performed by various independent actuaries. Inherent in these valuations are numerous assumptions regarding expected return on assets, discount rates, compensation increases, mortality rates and health care costs trends. These assumptions are disclosed in "Note 19. Employee Benefit Plans" to our consolidated financial statements included elsewhere in this report.
Management, with the advice of its actuaries, uses judgment to make assumptions on which our employee benefit plan liabilities and expenses are based. The effect of a 1% change in three key assumptions is summarized as follows (dollars in millions):
Assumptions
|
Statement of Operations(1) |
Balance Sheet Impact(2) |
|||||
|---|---|---|---|---|---|---|---|
Discount rate |
|||||||
—1% increase |
$ | (16 | ) | $ | (364 | ) | |
—1% decrease |
23 | 422 | |||||
Expected return on assets |
|||||||
—1% increase |
(27 | ) | — | ||||
—1% decrease |
27 | — | |||||
Rate of compensation increase |
|||||||
—1% increase |
18 | 100 | |||||
—1% decrease |
(13 | ) | (93 | ) | |||
Stock-Based Compensation Plans
Management uses judgment in determining assumptions used in the Black-Scholes valuation model to estimate fair value of its stock-based compensation plans. Because we did not have stock-based compensation plans prior to our initial public offering of common stock in February 2005, our ability to use historical experience for assumptions related to stock-based compensation plans has been limited.
96
As of December 31, 2008, the effect of a 10% change in expected volatility and expected life of stock options granted would not be significant to our statements of operations or balance sheets.
Environmental Reserves
Environmental remediation costs for our facilities are accrued when it is probable that a liability has been incurred and the amount can be reasonably estimated. Estimates of environmental reserves require evaluating government regulation, available technology, site-specific information and remediation alternatives. We accrue an amount equal to our best estimate of the costs to remediate based upon the available information. Adjustments to our estimates are made periodically based upon additional information received as remediation progresses. For further information, see "Note 23. Environmental, Health and Safety Matters" to our consolidated financial statements included elsewhere in this report.
ITEM 7A. QUANTITATIVE AND QUALITATIVE DISCLOSURES ABOUT MARKET RISK
We are exposed to market risks, such as changes in interest rates, foreign exchange rates and commodity pricing risks. From time to time, we enter into transactions, including transactions involving derivative instruments, to manage certain of these exposures.
All derivatives, whether designated in hedging relationships or not, are recorded on our balance sheet at fair value. If the derivative is designated as a fair value hedge, the changes in the fair value of the derivative and the hedged items are recognized in earnings. If the derivative is designated as a cash flow hedge, changes in the fair value of the derivative are recorded in accumulated other comprehensive (loss) income, to the extent effective, and will be recognized in the income statement when the hedged item affects earnings. To the extent applicable, we perform effectiveness assessments in order to use hedge accounting at each reporting period. For a derivative that does not qualify as a hedge, changes in fair value are recognized in earnings.
We also hedge our net investment in certain European operations. Changes in the fair value of the hedge in the net investment of certain European operations are recorded in accumulated other comprehensive (loss) income.
INTEREST RATE RISKS
Through our borrowing activities, we are exposed to interest rate risk. Such risk arises due to the structure of our debt portfolio, including the duration of the portfolio and the mix of fixed and floating interest rates. Actions taken to reduce interest rate risk include managing the mix and rate characteristics of various interest bearing liabilities, as well as entering into interest rate derivative instruments.
From time to time, we may purchase interest rate swaps and/or interest rate collars to reduce the impact of changes in interest rates on our floating-rate long-term debt. Under interest rate swaps, we agree with other parties to exchange, at specified intervals, the difference between fixed-rate and floating-rate interest amounts calculated by reference to an agreed notional principal amount. The collars entitle us to receive from the counterparties (major banks) the amounts, if any, by which our interest payments on certain of our floating-rate borrowings exceed a certain rate, and require us to pay to the counterparties (major banks) the amount, if any, by which our interest payments on certain of our floating-rate borrowings are less than a certain rate.
Interest rate contracts were recorded as a component of other noncurrent liabilities as of December 31, 2008 and 2007. The effective portion of the changes in the fair value of the swaps were recorded in accumulated other comprehensive (loss) income, with any ineffectiveness recorded in interest expense. As of December 31, 2008 and 2007, the fair value of these contracts was not
97
significant. As of December 31, 2008 and 2007, the contracts had a notional amount of $13 million and $14 million, respectively, and a maturity date of 2010 each.
For the years ended December 31, 2008 and 2007, the changes in accumulated other comprehensive (loss) income associated with cash flow hedging activities were not considered significant.
On July 2, 2007, we let expire an interest rate contract of notional amount of $60 million pursuant to which we had swapped LIBOR interest for a fixed rate of 4.315%.
During 2009, interest expense of approximately nil is expected to be reclassified to earnings. The actual amount that will be reclassified to earnings over the next twelve months may vary from this amount due to changing market conditions. We are exposed to credit losses in the event of nonperformance by a counterparty to the derivative financial instruments. We anticipate, however, that the counterparties will be able to fully satisfy obligations under the contracts. Market risk arises from changes in interest rates.
FOREIGN EXCHANGE RATES RISK
Our cash flows and earnings are subject to fluctuations due to exchange rate variation. Our revenues and expenses are denominated in various currencies. From time to time, we may enter into foreign currency derivative instruments to minimize the short-term impact of movements in foreign currency rates. Where practicable, we generally net multicurrency cash balances among our subsidiaries to help reduce exposure to foreign currency exchange rates. Certain other exposures may be managed from time to time through financial market transactions, principally through the purchase of spot or forward foreign exchange contracts (generally with maturities of one year or less). We do not hedge our currency exposures in a manner that would eliminate the effect of changes in exchange rates on our cash flows and earnings. Our A/R Securitization Program in certain circumstances requires that we enter into forward foreign currency hedges intended to hedge currency exposures. As of December 31, 2008 and December 31, 2007, we had no forward currency hedges outstanding.
On January 15, 2008, we entered into a series of forward foreign currency contracts in our Pigments segment to partially hedge the impact, for up to one year, of movements in foreign currency rates associated with the purchases of raw materials and sales of pigment in non-functional currencies. As of December 31, 2008, these contracts had a notional amount of approximately $9 million and were designated as cash flow hedges. As of December 31, 2008, the fair value of these contracts was not considered significant. For the year ended December 31, 2008, the effective portion of the changes in the fair value was not significant with ineffectiveness of $1 million recorded as a decrease in sales, $1 million recorded as a reduction in cost of sales and a foreign currency loss of $1 million.
On October 24, 2008, we unwound a cross currency interest rate swap pursuant to which we had swapped $153 million of LIBOR floating rate debt payments for €116 million of EURIBOR floating rate debt payments. This swap was not designated as a hedge for financial reporting purposes. For the years ended December 31, 2008 and 2007, we recorded a foreign currency gain (loss) on this swap of $21 million and ($17) million, respectively, in the consolidated statement of operations, included elsewhere in this report.
On October 24, 2008, we unwound a cross currency interest rate swap pursuant to which we had swapped $96 million of LIBOR floating rate debt payments for €71 million of EURIBOR floating rate debt payments. This swap was designated as a hedge of a net investment for financial reporting purposes. We received a cash benefit from the unwind of $3 million in the fourth quarter of 2008. For the years ended December 31, 2008 and 2007, the effective portion of the changes in the fair value of $14 million and ($8) million, respectively, was recorded as income (loss) in other comprehensive (loss)
98
income, with ineffectiveness of $2 million and nil, respectively, recorded in interest expense in the consolidated statement of operations included elsewhere in this report.
On July 12, 2007, we unwound a cross currency interest rate swap pursuant to which we had swapped $31 million of 11.0% fixed rate debt for €25 million of 9.4% fixed rate debt. The swap was not designated as a hedge for financial reporting purposes. We recorded an unrealized foreign currency loss on this swap of $2 million and $3 million, respectively, in our consolidated statements of operations included elsewhere in this report, for the years ended December 31, 2007 and 2006.
A significant portion of our debt is denominated in euros. We also finance certain of our non-U.S. subsidiaries with intercompany loans that are, in many cases, denominated in currencies other than the entities' functional currency. We manage the net foreign currency exposure created by this debt through various means, including cross-currency swaps, the designation of certain intercompany loans as permanent loans because they are not expected to be repaid in the foreseeable future ("permanent loans") and the designation of certain debt and swaps as net investment hedges.
Foreign currency transaction gains and losses on intercompany loans that are not designated as permanent loans are recorded in earnings. Foreign currency transaction gains and losses on intercompany loans that are designated as Permanent Loans are recorded in other comprehensive income. From time to time, we review such designation of intercompany loans.
From time to time, we review our non-U.S. dollar denominated debt and swaps to determine the appropriate amounts designated as hedges. As of December 31, 2008, we have designated approximately €205 million of euro-denominated debt as a hedge of our net investments. As of December 31, 2008, we had approximately €961 million in net euro assets.
COMMODITY PRICES RISK
Our exposure to changing commodity prices is somewhat limited since the majority of our raw materials are acquired at posted or market related prices, and sales prices for many of our finished products are at market related prices which are largely set on a monthly or quarterly basis in line with industry practice. Consequently, we do not generally hedge our commodity exposures.
ITEM 8. FINANCIAL STATEMENTS AND SUPPLEMENTARY DATA
Our consolidated financial statements required by this item are included on the pages immediately following the Index to Consolidated Financial Statements appearing on page F-1.
ITEM 9. CHANGES IN AND DISAGREEMENTS WITH ACCOUNTANTS ON ACCOUNTING AND FINANCIAL DISCLOSURE
There have been no changes in our independent accountants, Deloitte & Touche LLP, or disagreements with them on matters of accounting or financial disclosure.
ITEM 9A. CONTROLS AND PROCEDURES
EVALUATION OF DISCLOSURE CONTROLS AND PROCEDURES
Our management, with the participation of our chief executive officer and chief financial officer, has evaluated the effectiveness of our disclosure controls and procedures (as defined in Rules 13a-15(e) and 15d-15(e) under the Securities Exchange Act of 1934 (the "Exchange Act")) as of December 31, 2008. Based on this evaluation, our chief executive officer and chief financial officer have concluded that, as of December 31, 2008, our disclosure controls and procedures were effective, in that they ensure that information required to be disclosed by us in the reports that we file or submit under the Exchange Act is (1) recorded, processed, summarized and reported within the time periods specified in
99
the SEC's rules and forms, and (2) accumulated and communicated to our management, including our chief executive officer and chief financial officer, as appropriate to allow timely decisions regarding required disclosure.
CHANGES IN INTERNAL CONTROL OVER FINANCIAL REPORTING
No changes to our internal control over financial reporting occurred during the quarter ended December 31, 2008 that have materially affected, or are reasonably likely to materially affect, our internal control over financial reporting (as defined in Rules 13a-15(f) and 15d-15(f) under the Exchange Act).
MANAGEMENT'S REPORT ON INTERNAL CONTROL OVER FINANCIAL REPORTING
Management is responsible for establishing and maintaining adequate internal control over financial reporting. Our internal control framework and processes for our Company and Huntsman International are designed to provide reasonable assurance to management, Huntsman International's Board of Managers and our Board of Directors regarding the reliability of financial reporting and the preparation of our consolidated financial statements in accordance with accounting principles generally accepted in the United States of America.
Our internal control over financial reporting for our Company and Huntsman International includes those policies and procedures that:
Because of its inherent limitations, a system of internal control over financial reporting can provide only reasonable assurance and may not prevent or detect misstatements. Further, because of changing conditions, effectiveness of internal control over financial reporting may vary over time.
Our management assessed the effectiveness of our internal control over financial reporting for our Company and Huntsman International and concluded that, as of December 31, 2008, such internal control is effective. In making this assessment, management used the criteria set forth by the Committee of Sponsoring Organizations of the Treadway Commission in Internal Control—Integrated Framework ("COSO").
Our independent registered public accountants, Deloitte & Touche LLP, with direct access to our Board of Directors through our Audit Committee, have audited the consolidated financial statements prepared by our Company and Huntsman International and have issued attestation reports on internal control over financial reporting for our Company and Huntsman International.
100
MANAGEMENT'S PROCESS TO ASSESS THE EFFECTIVENESS OF INTERNAL CONTROL OVER FINANCIAL REPORTING
To comply with the requirements of Section 404 of the Sarbanes-Oxley Act of 2002, we completed a comprehensive compliance process to evaluate our internal control over financial reporting for our Company and Huntsman International. We involved employees at all levels of our Company during 2008 in training, performing and evaluating our internal controls.
Our management's conclusion on the effectiveness of internal control over financial reporting is based on a comprehensive evaluation and analysis of the five elements of COSO. Our management considered information from multiple sources as the basis its conclusion—including self-assessments of the control activities within each work process, assessments of entity-level controls and internal control attestations from significant nonconsolidated joint ventures and external service providers, as well as from key management. In addition, our internal control processes contain self-monitoring mechanisms, and proactive steps are taken to correct deficiencies as they are identified. We also maintain an internal auditing program that independently assesses the effectiveness of internal control over financial reporting within each of the five COSO elements.
| /s/ PETER R. HUNTSMAN |
/s/ J. KIMO ESPLIN
|
|
| Peter R. Huntsman President and Chief Executive Officer |
J. Kimo Esplin Executive Vice President and Chief Financial Officer |
|
/s/ L. RUSSELL HEALY L. Russell Healy Vice President and Controller |
||
February 24, 2009 |
101
REPORT OF INDEPENDENT REGISTERED PUBLIC ACCOUNTING FIRM
To
the Board of Directors and Stockholders of
Huntsman Corporation and subsidiaries
We have audited the internal control over financial reporting of Huntsman Corporation and subsidiaries (the "Company") as of December 31, 2008, based on criteria established in Internal Control—Integrated Framework issued by the Committee of Sponsoring Organizations of the Treadway Commission. The Company's management is responsible for maintaining effective internal control over financial reporting and for its assessment of the effectiveness of internal control over financial reporting, included in the accompanying Management's Report on Internal Control Over Financial Reporting. Our responsibility is to express an opinion on the Company's internal control over financial reporting based on our audit.
We conducted our audit in accordance with the standards of the Public Company Accounting Oversight Board (United States). Those standards require that we plan and perform the audit to obtain reasonable assurance about whether effective internal control over financial reporting was maintained in all material respects. Our audit included obtaining an understanding of internal control over financial reporting, assessing the risk that a material weakness exists, testing and evaluating the design and operating effectiveness of internal control based on the assessed risk, and performing such other procedures as we considered necessary in the circumstances. We believe that our audit provides a reasonable basis for our opinion.
A company's internal control over financial reporting is a process designed by, or under the supervision of, the company's principal executive and principal financial officers, or persons performing similar functions, and effected by the company's board of directors, management, and other personnel to provide reasonable assurance regarding the reliability of financial reporting and the preparation of financial statements for external purposes in accordance with generally accepted accounting principles. A company's internal control over financial reporting includes those policies and procedures that (1) pertain to the maintenance of records that, in reasonable detail, accurately and fairly reflect the transactions and dispositions of the assets of the company; (2) provide reasonable assurance that transactions are recorded as necessary to permit preparation of financial statements in accordance with generally accepted accounting principles, and that receipts and expenditures of the company are being made only in accordance with authorizations of management and directors of the company; and (3) provide reasonable assurance regarding prevention or timely detection of unauthorized acquisition, use, or disposition of the company's assets that could have a material effect on the financial statements.
Because of the inherent limitations of internal control over financial reporting, including the possibility of collusion or improper management override of controls, material misstatements due to error or fraud may not be prevented or detected on a timely basis. Also, projections of any evaluation of the effectiveness of the internal control over financial reporting to future periods are subject to the risk that the controls may become inadequate because of changes in conditions, or that the degree of compliance with the policies or procedures may deteriorate.
In our opinion, the Company maintained, in all material respects, effective internal control over financial reporting as of December 31, 2008, based on the criteria established in Internal Control—Integrated Framework issued by the Committee of Sponsoring Organizations of the Treadway Commission.
We have also audited, in accordance with the standards of the Public Company Accounting Oversight Board (United States), the consolidated financial statements and financial statement schedules as of and for the year ended December 31, 2008 of the Company and our report dated February 25, 2009 expressed an unqualified opinion on those financial statements and financial statement schedules and included an explanatory paragraph regarding the Company's adoption of
102
certain provisions of FASB Statement No. 158, Employers' Accounting for Defined Benefit Pensions and Other Postretirement Plans, on January 1, 2008.
/s/ DELOITTE & TOUCHE LLP
Houston,
Texas
February 25, 2009
103
REPORT OF INDEPENDENT REGISTERED PUBLIC ACCOUNTING FIRM
To
the Board of Managers and Members of
Huntsman International LLC and subsidiaries
We have audited the internal control over financial reporting of Huntsman International LLC and subsidiaries (the "Company") as of December 31, 2008, based on criteria established in Internal Control—Integrated Framework issued by the Committee of Sponsoring Organizations of the Treadway Commission. The Company's management is responsible for maintaining effective internal control over financial reporting and for its assessment of the effectiveness of internal control over financial reporting, included in the accompanying Management's Report on Internal Control Over Financial Reporting. Our responsibility is to express an opinion on the Company's internal control over financial reporting based on our audit.
We conducted our audit in accordance with the standards of the Public Company Accounting Oversight Board (United States). Those standards require that we plan and perform the audit to obtain reasonable assurance about whether effective internal control over financial reporting was maintained in all material respects. Our audit included obtaining an understanding of internal control over financial reporting, assessing the risk that a material weakness exists, testing and evaluating the design and operating effectiveness of internal control based on the assessed risk, and performing such other procedures as we considered necessary in the circumstances. We believe that our audit provides a reasonable basis for our opinion.
A company's internal control over financial reporting is a process designed by, or under the supervision of, the company's principal executive and principal financial officers, or persons performing similar functions, and effected by the company's board of directors, management, and other personnel to provide reasonable assurance regarding the reliability of financial reporting and the preparation of financial statements for external purposes in accordance with generally accepted accounting principles. A company's internal control over financial reporting includes those policies and procedures that (1) pertain to the maintenance of records that, in reasonable detail, accurately and fairly reflect the transactions and dispositions of the assets of the company; (2) provide reasonable assurance that transactions are recorded as necessary to permit preparation of financial statements in accordance with generally accepted accounting principles, and that receipts and expenditures of the company are being made only in accordance with authorizations of management and directors of the company; and (3) provide reasonable assurance regarding prevention or timely detection of unauthorized acquisition, use, or disposition of the company's assets that could have a material effect on the financial statements.
Because of the inherent limitations of internal control over financial reporting, including the possibility of collusion or improper management override of controls, material misstatements due to error or fraud may not be prevented or detected on a timely basis. Also, projections of any evaluation of the effectiveness of the internal control over financial reporting to future periods are subject to the risk that the controls may become inadequate because of changes in conditions, or that the degree of compliance with the policies or procedures may deteriorate.
In our opinion, the Company maintained, in all material respects, effective internal control over financial reporting as of December 31, 2008, based on the criteria established in Internal Control—Integrated Framework issued by the Committee of Sponsoring Organizations of the Treadway Commission.
We have also audited, in accordance with the standards of the Public Company Accounting Oversight Board (United States), the consolidated financial statements and financial statement schedule as of and for the year ended December 31, 2008 of the Company and our report dated February 25, 2009 expressed an unqualified opinion on those financial statements and financial statement schedules and included an explanatory paragraph regarding the Company's adoption of certain provisions of
104
FASB Statement No. 158, Employers' Accounting for Defined Benefit Pensions and Other Postretirement Plans, on January 1, 2008.
/s/ DELOITTE & TOUCHE LLP
Houston,
Texas
February 25, 2009
105
None.
ITEM 10. DIRECTORS, EXECUTIVE OFFICERS AND CORPORATE GOVERNANCE
Information relating to our Directors (including identification of our Audit Committee's financial expert(s)) and executive officers is contained in the definitive Proxy Statement for our Annual Meeting of Stockholders or in an amendment to this report and is incorporated herein by reference. See also the information regarding executive officers of the registrant set forth in Part I under the caption "Executive Officers of the Registrant" in reliance on General Instruction G to Form 10-K.
Code of Ethics
Our Company has adopted a code of ethics, as defined by Item 406(b) of Regulation S-K under the Exchange Act, that applies to our principal executive officer, principal financial officer and principal accounting officer or controller. A copy of the code of ethics is posted on our website, at www.huntsman.com. We intend to disclose any amendments to, or waivers from, our code of ethics on our website.
ITEM 11. EXECUTIVE COMPENSATION
Information relating to executive compensation and our equity compensation plans is contained in the definitive Proxy Statement for our Annual Meeting of Stockholders or in an amendment to this report and is incorporated herein by reference.
ITEM 12. SECURITY OWNERSHIP OF CERTAIN BENEFICIAL OWNERS AND MANAGEMENT AND RELATED STOCKHOLDER MATTERS
Information with respect to beneficial ownership of our common stock by each Director and all Directors and officers of our Company as a group is contained in the definitive Proxy Statement for our Annual Meeting of Stockholders or in an amendment to this report and is incorporated herein by reference.
Information relating to any person who beneficially owns in excess of 5 percent of the total outstanding shares of our common stock is contained in the definitive Proxy Statement for our Annual Meeting of Stockholders or in an amendment to this report and is incorporated herein by reference.
Information with respect to compensation plans under which equity securities are authorized for issuance is contained in the definitive Proxy Statement for our Annual Meeting of Stockholders or in an amendment to this report and is incorporated herein by reference.
ITEM 13. CERTAIN RELATIONSHIPS AND RELATED TRANSACTIONS, AND DIRECTOR INDEPENDENCE
Information with respect to certain relationships and related transactions is contained in the definitive Proxy Statement for our Annual Meeting of Stockholders or in an amendment to this report and is incorporated herein by reference.
ITEM 14. PRINCIPAL ACCOUNTANT FEES AND SERVICES
Information with respect to principal accountant fees and services is contained in the definitive Proxy Statement for our Annual Meeting of Stockholders or in an amendment to this filing and is incorporated herein by reference.
106
ITEM 15. EXHIBITS AND FINANCIAL STATEMENT SCHEDULES
See Index to Consolidated Financial Statements on page F-1
Other than as stated on the Index to Consolidated Financial Statements on page F-1 with respect to Schedule I and Schedule II, financial statement schedules are omitted because they are not required or are not applicable or the required information is shown in the financial statements or notes thereto.
The exhibits to this report are listed on the Exhibit Index below.
Please see the Exhibit Index at the conclusion of this Annual Report on Form 10-K for exhibits filed with this Annual Report on Form 10-K or incorporated by reference. The following exhibits, also listed on the Exhibit Index, are filed with this Annual Report on Form 10-K:
| Number | Description | ||
|---|---|---|---|
| 21.1 | Subsidiaries of the Company | ||
23.1 |
Consent of Independent Registered Public Accounting Firm |
||
31.1 |
Certification of Chief Executive Officer pursuant to Section 302 of the Sarbanes-Oxley Act of 2002 |
||
31.2 |
Certification of Chief Financial Officer pursuant to Section 302 of the Sarbanes-Oxley Act of 2002 |
||
32.1 |
Certification of Chief Executive Officer pursuant to Section 906 of the Sarbanes-Oxley Act of 2002 |
||
32.2 |
Certification of Chief Financial Officer pursuant to Section 906 of the Sarbanes-Oxley Act of 2002 |
||
107
Pursuant to the requirements of Section 13 or 15(d) of the Securities Exchange Act of 1934, the registrants have duly caused this report to be signed on their behalf by the undersigned, thereunto duly authorized.
| Dated: February 26, 2009 | ||||
HUNTSMAN CORPORATION HUNTSMAN INTERNATIONAL LLC |
||||
By: |
/s/ J. KIMO ESPLIN J. Kimo Esplin Executive Vice President and Chief Financial Officer |
|||
Pursuant to the requirements of the Securities Exchange Act of 1934, this report has been signed below by the following persons on behalf of Huntsman Corporation in the capacities indicated on the 26 day of February 2009.
| /s/ JON M. HUNTSMAN Jon M. Huntsman Executive Chairman of the Board and Director |
/s/ PETER R. HUNTSMAN Peter R. Huntsman President, Chief Executive Officer and Director (Principal Executive Officer) |
|
/s/ J. KIMO ESPLIN J. Kimo Esplin Executive Vice President and Chief Financial Officer (Principal Financial Officer) |
/s/ L. RUSSELL HEALY L. Russell Healy Vice President and Controller (Principal Accounting Officer) |
|
/s/ H. WILLIAM LICHTENBERGER H. William Lichtenberger Chairman of the Nominating and Corporate Governance Committee and Director |
/s/ WAYNE A. REAUD Wayne A. Reaud Chairman of the Compensation Committee, Chairman of the Litigation Committee and Director |
|
/s/ RICHARD MICHAELSON Richard Michaelson Chairman of the Audit Committee and Director |
/s/ NOLAN D. ARCHIBALD Nolan D. Archibald Director |
|
/s/ MARSHA J. EVANS Marsha J. Evans Director |
/s/ ALVIN V. SHOEMAKER Alvin V. Shoemaker Director |
108
Pursuant to the requirements of the Securities Exchange Act of 1934, this report has been signed below by the following persons on behalf of Huntsman International in the capacities indicated on the 26 day of February 2009.
| /s/ JON M. HUNTSMAN Jon M. Huntsman Chairman of the Board of Managers and Manager |
/s/ PETER R. HUNTSMAN Peter R. Huntsman President, Chief Executive Officer and Manager (Principal Executive Officer) |
|
/s/ J. KIMO ESPLIN J. Kimo Esplin Executive Vice President, Chief Financial Officer and Manager (Principal Financial Officer) |
/s/ L. RUSSELL HEALY L. Russell Healy Vice President and Controller (Principal Accounting Officer) |
|
/s/ SAMUEL D. SCRUGGS Samuel D. Scruggs Executive Vice President, General Counsel, Secretary and Manager |
109
HUNTSMAN CORPORATION AND SUBSIDIARIES
HUNTSMAN INTERNATIONAL LLC AND SUBSIDIARIES
INDEX TO CONSOLIDATED FINANCIAL STATEMENTS
F-1
REPORT OF INDEPENDENT REGISTERED PUBLIC ACCOUNTING FIRM
To
the Board of Directors and Stockholders of
Huntsman Corporation and subsidiaries
We have audited the accompanying consolidated balance sheets of Huntsman Corporation and subsidiaries (the "Company") as of December 31, 2008 and 2007, and the related consolidated statements of operations and comprehensive (loss) income, stockholders' equity, and cash flows for each of the three years in the period ended December 31, 2008. Our audits also included the financial statement schedules listed in the Index on page F-1. These financial statements and financial statement schedules are the responsibility of the Company's management. Our responsibility is to express an opinion on the financial statements and financial statement schedules based on our audits.
We conducted our audits in accordance with the standards of the Public Company Accounting Oversight Board (United States). Those standards require that we plan and perform the audit to obtain reasonable assurance about whether the financial statements are free of material misstatement. An audit includes examining, on a test basis, evidence supporting the amounts and disclosures in the financial statements. An audit also includes assessing the accounting principles used and significant estimates made by management, as well as evaluating the overall financial statement presentation. We believe that our audits provide a reasonable basis for our opinion.
In our opinion, such consolidated financial statements present fairly, in all material respects, the financial position of Huntsman Corporation and subsidiaries as of December 31, 2008 and 2007, and the results of their operations and their cash flows for each of the three years in the period ended December 31, 2008, in conformity with accounting principles generally accepted in the United States of America. Also, in our opinion, such financial statement schedules, when considered in relation to the basic consolidated financial statements taken as a whole, present fairly, in all material respects, the information set forth therein.
As discussed in Note 2 and 19 to the consolidated financial statements, the Company adopted certain provisions of FASB Statement No. 158, Employers' Accounting for Defined Benefit Pensions and Other Postretirement Plans, on each of December 31, 2006 and January 1, 2008; and FASB Interpretation No. 48, Accounting for Uncertainty in Income Taxes—an interpretation of FASB Statement No. 109, on January 1, 2007.
We have also audited, in accordance with the standards of the Public Company Accounting Oversight Board (United States), the Company's internal control over financial reporting as of December 31, 2008, based on the criteria established in Internal Control—Integrated Framework issued by the Committee of Sponsoring Organizations of the Treadway Commission and our report dated February 25, 2009 expressed an unqualified opinion on the Company's internal control over financial reporting.
/s/ DELOITTE & TOUCHE LLP
Houston,
Texas
February 25, 2009
F-2
HUNTSMAN CORPORATION AND SUBSIDIARIES
CONSOLIDATED BALANCE SHEETS
(In Millions, Except Share and Per Share Amounts)
| |
December 31, | ||||||||
|---|---|---|---|---|---|---|---|---|---|
| |
2008 | 2007 | |||||||
ASSETS |
|||||||||
Current assets: |
|||||||||
Cash and cash equivalents |
$ | 657 | $ | 154 | |||||
Restricted cash |
5 | — | |||||||
Accounts and notes receivable (net of allowance for doubtful accounts of $47 and $43, respectively) |
905 | 1,253 | |||||||
Accounts receivable from affiliates |
8 | 9 | |||||||
Inventories, net |
1,500 | 1,452 | |||||||
Prepaid expenses |
45 | 37 | |||||||
Deferred income taxes |
21 | 73 | |||||||
Other current assets |
99 | 117 | |||||||
Total current assets |
3,240 | 3,095 | |||||||
Property, plant and equipment, net |
3,649 |
3,763 |
|||||||
Investment in unconsolidated affiliates |
267 | 228 | |||||||
Intangible assets, net |
153 | 173 | |||||||
Goodwill |
92 | 93 | |||||||
Deferred income taxes |
284 | 350 | |||||||
Notes receivable from affiliates |
9 | 8 | |||||||
Other noncurrent assets |
364 | 456 | |||||||
Total assets |
$ | 8,058 | $ | 8,166 | |||||
LIABILITIES AND STOCKHOLDERS' EQUITY |
|||||||||
Current liabilities: |
|||||||||
Accounts payable |
$ | 731 | $ | 1,005 | |||||
Accounts payable to affiliates |
16 | 13 | |||||||
Accrued liabilities |
617 | 885 | |||||||
Deferred income taxes |
36 | 3 | |||||||
Current portion of long-term debt |
205 | 69 | |||||||
Total current liabilities |
1,605 | 1,975 | |||||||
Long-term debt |
3,677 |
3,500 |
|||||||
Deferred income taxes |
117 | 154 | |||||||
Notes payable to affiliates |
6 | 5 | |||||||
Other noncurrent liabilities |
1,021 | 679 | |||||||
Total liabilities |
6,426 | 6,313 | |||||||
Minority interests in common stock of consolidated subsidiaries |
22 | 27 | |||||||
Commitments and contingencies (Notes 22 and 23) |
|||||||||
Stockholders' equity: |
|||||||||
Common stock $0.01 par value, 1,200,000,000 shares authorized, 234,430,334 and 222,012,474 issued and 233,553,515 and 221,036,190 outstanding in 2008 and 2007, respectively |
2 | 2 | |||||||
Mandatory convertible preferred stock $0.01 par value, 100,000,000 shares authorized, 5,750,000 issued and outstanding at December 31, 2007 |
— | 288 | |||||||
Additional paid-in capital |
3,141 | 2,831 | |||||||
Unearned stock-based compensation |
(13 | ) | (12 | ) | |||||
Accumulated deficit |
(1,031 | ) | (1,540 | ) | |||||
Accumulated other comprehensive (loss) income |
(489 | ) | 257 | ||||||
Total stockholders' equity |
1,610 | 1,826 | |||||||
Total liabilities and stockholders' equity |
$ | 8,058 | $ | 8,166 | |||||
See accompanying notes to consolidated financial statements.
F-3
HUNTSMAN CORPORATION AND SUBSIDIARIES
CONSOLIDATED STATEMENTS OF OPERATIONS AND
COMPREHENSIVE (LOSS) INCOME
(In Millions, Except Share and Per Share
Amounts)
| |
Year ended December 31, | |||||||||||
|---|---|---|---|---|---|---|---|---|---|---|---|---|
| |
2008 | 2007 | 2006 | |||||||||
Revenues: |
||||||||||||
Trade sales, services and fees |
$ | 10,117 | $ | 9,480 | $ | 8,622 | ||||||
Related party sales |
98 | 171 | 109 | |||||||||
Total revenues |
10,215 | 9,651 | 8,731 | |||||||||
Cost of goods sold |
8,951 | 8,111 | 7,309 | |||||||||
Gross profit |
1,264 | 1,540 | 1,422 | |||||||||
Operating expenses: |
||||||||||||
Selling, general and administrative |
882 | 871 | 761 | |||||||||
Research and development |
154 | 145 | 115 | |||||||||
Other operating expense (income) |
27 | (55 | ) | (114 | ) | |||||||
Restructuring, impairment and plant closing costs |
36 | 42 | 15 | |||||||||
Total expenses |
1,099 | 1,003 | 777 | |||||||||
Operating income |
165 | 537 | 645 | |||||||||
Interest expense, net |
(263 | ) | (286 | ) | (351 | ) | ||||||
Loss on accounts receivable securitization program |
(27 | ) | (21 | ) | (13 | ) | ||||||
Equity in income of investment in unconsolidated affiliates |
14 | 13 | 4 | |||||||||
Loss on early extinguishment of debt |
(1 | ) | (2 | ) | (27 | ) | ||||||
Income (expenses) associated with the Merger |
780 | (210 | ) | — | ||||||||
Other income |
1 | — | 2 | |||||||||
Income from continuing operations before income taxes and minority interest |
669 | 31 | 260 | |||||||||
Income tax (expense) benefit |
(190 | ) | 12 | 50 | ||||||||
Minority interest in subsidiaries' (income) loss |
(1 | ) | 9 | (3 | ) | |||||||
Income from continuing operations |
478 | 52 | 307 | |||||||||
Income (loss) from discontinued operations (including gain (loss) on disposal of $11 in 2008, ($340) in 2007 and ($302) in 2006), net of tax |
117 | (217 | ) | (133 | ) | |||||||
Income (loss) before extraordinary gain (loss) |
595 | (165 | ) | 174 | ||||||||
Extraordinary gain (loss) on the acquisition of a business, net of tax of nil |
14 | (7 | ) | 56 | ||||||||
Net income (loss) |
$ | 609 | $ | (172 | ) | $ | 230 | |||||
Net income (loss) |
$ |
609 |
$ |
(172 |
) |
$ |
230 |
|||||
Other comprehensive (loss) income |
(746 | ) | 318 | 149 | ||||||||
Comprehensive (loss) income |
$ | (137 | ) | $ | 146 | $ | 379 | |||||
(Continued)
F-4
HUNTSMAN CORPORATION AND SUBSIDIARIES
CONSOLIDATED STATEMENTS OF OPERATIONS AND
COMPREHENSIVE (LOSS) INCOME (Continued)
(In Millions, Except Share and Per Share Amounts)
| |
Year ended December 31, | |||||||||
|---|---|---|---|---|---|---|---|---|---|---|
| |
2008 | 2007 | 2006 | |||||||
Basic income (loss) per share: |
||||||||||
Income from continuing operations |
$ | 2.06 | $ | 0.23 | $ | 1.39 | ||||
Income (loss) from discontinued operations, net of tax |
0.50 | (0.98 | ) | (0.60 | ) | |||||
Extraordinary gain (loss) on the acquisition of a business |
0.06 | (0.03 | ) | 0.25 | ||||||
Net income (loss) |
$ | 2.62 | $ | (0.78 | ) | $ | 1.04 | |||
Weighted average shares |
231,968,936 | 220,948,495 | 220,618,478 | |||||||
Diluted income (loss) per share: |
||||||||||
Income from continuing operations |
$ | 2.04 | $ | 0.22 | $ | 1.32 | ||||
Income (loss) from discontinued operations, net of tax |
0.50 | (0.93 | ) | (0.57 | ) | |||||
Extraordinary gain (loss) on the acquisition of a business |
0.06 | (0.03 | ) | 0.24 | ||||||
Net income (loss) |
$ | 2.60 | $ | (0.74 | ) | $ | 0.99 | |||
Weighted average shares |
234,263,249 | 232,792,291 | 233,142,373 | |||||||
Dividends per share |
$ |
0.40 |
$ |
0.40 |
$ |
— |
||||
See accompanying notes to consolidated financial statements.
F-5
HUNTSMAN CORPORATION AND SUBSIDIARIES
CONSOLIDATED STATEMENTS OF STOCKHOLDERS' EQUITY
(Dollars in Millions)
| |
Shares | |
|
|
|
|
|
|
||||||||||||||||||||
|---|---|---|---|---|---|---|---|---|---|---|---|---|---|---|---|---|---|---|---|---|---|---|---|---|---|---|---|---|
| |
|
|
|
|
|
Accumulated other comprehensive (loss) income |
|
|||||||||||||||||||||
| |
Common Stock |
Mandatory convertible preferred stock |
Common stock |
Mandatory convertible preferred stock |
Additional paid-in capital |
Unearned stock-based compensation |
Accumulated deficit |
Total | ||||||||||||||||||||
Balance, January 1, 2006 |
220,451,484 | 5,750,000 | $ | 2 | $ | 288 | $ | 2,780 | $ | (12 | ) | $ | (1,506 | ) | $ | (31 | ) | $ | 1,521 | |||||||||
Net income |
— | — | — | — | — | — | 230 | — | 230 | |||||||||||||||||||
Other comprehensive income |
— | — | — | — | — | — | — | 149 | 149 | |||||||||||||||||||
Issuance of nonvested stock awards |
— | — | — | — | 9 | (9 | ) | — | — | — | ||||||||||||||||||
Vesting of stock awards |
278,531 | — | — | — | — | — | — | — | — | |||||||||||||||||||
Recognition of stock-based compensation |
— | — | — | — | 9 | 8 | — | — | 17 | |||||||||||||||||||
Cumulative effect of adoption of SFAS No. 158, net of tax |
— | — | — | — | — | — | — | (179 | ) | (179 | ) | |||||||||||||||||
Repurchase and cancellation of stock awards |
(77,586 | ) | — | — | — | — | — | (2 | ) | — | (2 | ) | ||||||||||||||||
Balance, December 31, 2006 |
220,652,429 | 5,750,000 | 2 | 288 | 2,798 | (13 | ) | (1,278 | ) | (61 | ) | 1,736 | ||||||||||||||||
Net loss |
— | — | — | — | — | — | (172 | ) | — | (172 | ) | |||||||||||||||||
Other comprehensive income |
— | — | — | — | — | — | — | 318 | 318 | |||||||||||||||||||
Issuance of nonvested stock awards |
— | — | — | — | 10 | (10 | ) | — | — | — | ||||||||||||||||||
Vesting of stock awards |
393,555 | — | — | — | — | — | — | — | — | |||||||||||||||||||
Stock options exercised |
99,332 | — | — | — | 2 | — | — | — | 2 | |||||||||||||||||||
Recognition of stock-based compensation |
— | — | — | — | 13 | 11 | — | — | 24 | |||||||||||||||||||
Repurchase and cancellation of stock awards |
(109,126 | ) | — | — | — | — | — | (2 | ) | — | (2 | ) | ||||||||||||||||
Dividends declared on common stock |
— | — | — | — | — | — | (88 | ) | — | (88 | ) | |||||||||||||||||
Reversal of valuation allowance on deferred tax assets related to previous equity transactions |
— | — | — | — | 8 | — | — | — | 8 | |||||||||||||||||||
Balance, December 31, 2007 |
221,036,190 | 5,750,000 | 2 | 288 | 2,831 | (12 | ) | (1,540 | ) | 257 | 1,826 | |||||||||||||||||
Net income |
— | — | — | — | — | — | 609 | — | 609 | |||||||||||||||||||
Other comprehensive loss |
— | — | — | — | — | — | — | (746 | ) | (746 | ) | |||||||||||||||||
Issuance of nonvested stock awards |
— | — | — | — | 12 | (12 | ) | — | — | — | ||||||||||||||||||
Vesting of stock awards |
594,908 | — | — | — | 1 | — | — | — | 1 | |||||||||||||||||||
Recognition of stock-based compensation |
— | — | — | — | 9 | 11 | — | — | 20 | |||||||||||||||||||
Repurchase and cancellation of stock awards |
(160,058 | ) | — | — | — | — | — | (4 | ) | — | (4 | ) | ||||||||||||||||
Preferred stock conversion |
12,082,475 | (5,750,000 | ) | — | (288 | ) | 288 | — | — | — | — | |||||||||||||||||
Effect of adoption of SFAS No. 158, net of tax |
— | — | — | — | — | — | (3 | ) | — | (3 | ) | |||||||||||||||||
Dividends declared on common stock |
— | — | — | — | — | — | (93 | ) | — | (93 | ) | |||||||||||||||||
Balance, December 31, 2008 |
233,553,515 | — | $ | 2 | $ | — | $ | 3,141 | $ | (13 | ) | $ | (1,031 | ) | $ | (489 | ) | $ | 1,610 | |||||||||
See accompanying notes to consolidated financial statements
F-6
HUNTSMAN CORPORATION AND SUBSIDIARIES
CONSOLIDATED STATEMENTS OF CASH FLOWS
(Dollars in Millions)
| |
Year ended December 31, | ||||||||||
|---|---|---|---|---|---|---|---|---|---|---|---|
| |
2008 | 2007 | 2006 | ||||||||
Operating Activities: |
|||||||||||
Net income (loss) |
$ | 609 | $ | (172 | ) | $ | 230 | ||||
Adjustments to reconcile net income (loss) to net cash provided by (used in) operating activities: |
|||||||||||
Extraordinary (gain) loss on the acquisition of a business, net of tax |
(14 | ) | 7 | (56 | ) | ||||||
Equity in income of investment in unconsolidated affiliates |
(14 | ) | (13 | ) | (4 | ) | |||||
Dividends received from unconsolidated affiliates |
11 | — | — | ||||||||
Depreciation and amortization |
398 | 413 | 465 | ||||||||
Provision for losses on accounts receivable |
6 | 3 | 6 | ||||||||
Loss on disposal of businesses/assets, net |
6 | 269 | 209 | ||||||||
Loss on early extinguishment of debt |
1 | 2 | 27 | ||||||||
Noncash interest expense |
2 | 5 | 5 | ||||||||
Noncash restructuring, impairment and plant closing costs |
7 | 15 | 18 | ||||||||
Deferred income taxes |
202 | (203 | ) | (82 | ) | ||||||
Net unrealized loss (gain) on foreign currency transactions |
4 | (9 | ) | (42 | ) | ||||||
Stock-based compensation |
20 | 26 | 18 | ||||||||
Minority interest in subsidiaries' income (loss) |
1 | (9 | ) | 3 | |||||||
Noncash gain on partial fire insurance settlement |
(135 | ) | — | — | |||||||
Other, net |
3 | (1 | ) | 5 | |||||||
Changes in operating assets and liabilities: |
|||||||||||
Accounts and notes receivable |
263 | 56 | 228 | ||||||||
Inventories, net |
(119 | ) | (74 | ) | (59 | ) | |||||
Prepaid expenses |
(9 | ) | 3 | (15 | ) | ||||||
Other current assets |
(1 | ) | 53 | (51 | ) | ||||||
Other noncurrent assets |
41 | (158 | ) | 163 | |||||||
Accounts payable |
(186 | ) | (148 | ) | 22 | ||||||
Accrued liabilities |
(64 | ) | (87 | ) | 22 | ||||||
Other noncurrent liabilities |
(265 | ) | (30 | ) | (220 | ) | |||||
Net cash provided by (used in) operating activities |
767 | (52 | ) | 892 | |||||||
Investing Activities: |
|||||||||||
Capital expenditures |
(418 | ) | (665 | ) | (550 | ) | |||||
Acquisition of business, net of cash acquired and post-closing adjustments |
(2 | ) | 13 | (177 | ) | ||||||
Proceeds from sale of businesses/assets, net of adjustments |
(26 | ) | 850 | 895 | |||||||
Investment in unconsolidated affiliates |
(44 | ) | (17 | ) | (14 | ) | |||||
Cash received from unconsolidated affiliates |
10 | 4 | 2 | ||||||||
Proceeds from maturity of government securities, restricted as to use |
4 | 14 | 14 | ||||||||
Change in restricted cash |
(8 | ) | — | — | |||||||
Other, net |
(5 | ) | 1 | 4 | |||||||
Net cash (used in) provided by investing activities |
(489 | ) | 200 | 174 | |||||||
(Continued)
F-7
HUNTSMAN CORPORATION AND SUBSIDIARIES
CONSOLIDATED STATEMENTS OF CASH FLOWS (Continued)
(Dollars in Millions)
| |
Year ended December 31, | ||||||||||
|---|---|---|---|---|---|---|---|---|---|---|---|
| |
2008 | 2007 | 2006 | ||||||||
Financing Activities: |
|||||||||||
Net borrowings (repayments) under revolving loan facilities |
$ | 11 | $ | (17 | ) | $ | (6 | ) | |||
Net borrowings (repayments) on overdraft facilities and other short-term debt |
8 | 15 | (7 | ) | |||||||
Repayments of long-term debt |
(11 | ) | (422 | ) | (1,784 | ) | |||||
Proceeds from issuance of long-term debt |
336 | 266 | 872 | ||||||||
Borrowings on notes payable |
48 | 56 | 74 | ||||||||
Repayments of notes payable |
(55 | ) | (60 | ) | (63 | ) | |||||
Debt issuance costs paid |
(5 | ) | (5 | ) | (13 | ) | |||||
Call premiums related to early extinguishment of debt |
— | (1 | ) | (30 | ) | ||||||
Dividends paid to common stockholders |
(93 | ) | (88 | ) | — | ||||||
Dividends paid to preferred stockholders |
(4 | ) | (14 | ) | (14 | ) | |||||
Repurchase and cancellation of stock awards |
(4 | ) | — | — | |||||||
Contribution from minority shareholder |
— | — | 6 | ||||||||
Other, net |
(1 | ) | 1 | 4 | |||||||
Net cash provided by (used in) financing activities |
230 | (269 | ) | (961 | ) | ||||||
Effect of exchange rate changes on cash |
(5 | ) | 12 | 15 | |||||||
Increase (decrease) in cash and cash equivalents |
503 | (109 | ) | 120 | |||||||
Cash and cash equivalents at beginning of period |
154 | 263 | 143 | ||||||||
Cash and cash equivalents at end of period |
$ | 657 | $ | 154 | $ | 263 | |||||
Supplemental cash flow information: |
|||||||||||
Cash paid for interest |
$ | 265 | $ | 301 | $ | 397 | |||||
Cash paid for income taxes |
34 | 73 | 40 | ||||||||
During the years ended December 31, 2008, 2007 and 2006, the amount of capital expenditures in accounts payable increased by $9 million, $72 million and nil, respectively. The value of share awards that vested during the years ended December 31, 2008, 2007 and 2006 was $13 million, $9 million and $6 million, respectively.
See accompanying notes to consolidated financial statements.
F-8
REPORT OF INDEPENDENT REGISTERED PUBLIC ACCOUNTING FIRM
To
the Board of Managers and Members of
Huntsman International LLC and subsidiaries
We have audited the accompanying consolidated balance sheets of Huntsman International LLC and subsidiaries (the "Company") as of December 31, 2008 and 2007, and the related consolidated statements of operations and comprehensive (loss) income, members' equity, and cash flows for each of the three years in the period ended December 31, 2008. Our audits also included the financial statement schedule listed in the Index on page F-1. These financial statements and financial statement schedule are the responsibility of the Company's management. Our responsibility is to express an opinion on the financial statements and financial statement schedule based on our audits.
We conducted our audits in accordance with the standards of the Public Company Accounting Oversight Board (United States). Those standards require that we plan and perform the audit to obtain reasonable assurance about whether the financial statements are free of material misstatement. An audit includes examining, on a test basis, evidence supporting the amounts and disclosures in the financial statements. An audit also includes assessing the accounting principles used and significant estimates made by management, as well as evaluating the overall financial statement presentation. We believe that our audits provide a reasonable basis for our opinion.
In our opinion, such consolidated financial statements present fairly, in all material respects, the financial position of Huntsman International LLC and subsidiaries as of December 31, 2008 and 2007, and the results of their operations and their cash flows for each of the three years in the period ended December 31, 2008, in conformity with accounting principles generally accepted in the United States of America. Also, in our opinion, such financial statement schedule, when considered in relation to the basic consolidated financial statements taken as a whole, presents fairly, in all material respects, the information set forth therein.
As discussed in Note 2 and 19 to the consolidated financial statements, the Company adopted certain provisions of FASB Statement No. 158, Employers' Accounting for Defined Benefit Pensions and Other Postretirement Plans, on each of December 31, 2006 and January 1, 2008; and FASB Interpretation No. 48, Accounting for Uncertainty in Income Taxes—an interpretation of FASB Statement No. 109, on January 1, 2007.
We have also audited, in accordance with the standards of the Public Company Accounting Oversight Board (United States), the Company's internal control over financial reporting as of December 31, 2008, based on the criteria established in Internal Control—Integrated Framework issued by the Committee of Sponsoring Organizations of the Treadway Commission and our report dated February 25, 2009 expressed an unqualified opinion on the Company's internal control over financial reporting.
/s/ DELOITTE & TOUCHE LLP
Houston,
Texas
February 25, 2009
F-9
HUNTSMAN INTERNATIONAL LLC AND SUBSIDIARIES
CONSOLIDATED BALANCE SHEETS
(Dollars in Millions)
| |
December 31, | ||||||||
|---|---|---|---|---|---|---|---|---|---|
| |
2008 | 2007 | |||||||
ASSETS |
|||||||||
Current assets: |
|||||||||
Cash and cash equivalents |
$ | 87 | $ | 154 | |||||
Restricted cash |
5 | — | |||||||
Accounts and notes receivable (net of allowance for doubtful accounts of $47 and $43, respectively) |
905 | 1,253 | |||||||
Accounts receivable from affiliates |
15 | 193 | |||||||
Inventories, net |
1,500 | 1,452 | |||||||
Prepaid expenses |
45 | 37 | |||||||
Deferred income taxes |
21 | 74 | |||||||
Other current assets |
99 | 113 | |||||||
Total current assets |
2,677 | 3,276 | |||||||
Property, plant and equipment, net |
3,466 |
3,556 |
|||||||
Investment in unconsolidated affiliates |
267 | 228 | |||||||
Intangible assets, net |
157 | 177 | |||||||
Goodwill |
92 | 93 | |||||||
Deferred income taxes |
392 | 300 | |||||||
Notes receivable from affiliates |
9 | 9 | |||||||
Other noncurrent assets |
364 | 456 | |||||||
Total assets |
$ | 7,424 | $ | 8,095 | |||||
LIABILITIES AND MEMBERS' EQUITY |
|||||||||
Current liabilities: |
|||||||||
Accounts payable |
$ | 728 | $ | 1,005 | |||||
Accounts payable to affiliates |
16 | 15 | |||||||
Accrued liabilities |
560 | 781 | |||||||
Deferred income taxes |
35 | 3 | |||||||
Note payable to affiliate |
423 | — | |||||||
Current portion of long-term debt |
205 | 69 | |||||||
Total current liabilities |
1,967 | 1,873 | |||||||
Long-term debt |
3,442 |
3,500 |
|||||||
Notes payable to affiliates |
6 | 5 | |||||||
Deferred income taxes |
69 | 124 | |||||||
Other noncurrent liabilities |
1,021 | 677 | |||||||
Total liabilities |
6,505 | 6,179 | |||||||
Minority interests in common stock of consolidated subsidiaries |
22 | 27 | |||||||
Commitments and contingencies (Notes 22 and 23) |
|||||||||
Members' equity: |
|||||||||
Members' equity, 2,728 units issued and outstanding |
2,865 | 2,845 | |||||||
Accumulated deficit |
(1,414 | ) | (1,143 | ) | |||||
Accumulated other comprehensive (loss) income |
(554 | ) | 187 | ||||||
Total members' equity |
897 | 1,889 | |||||||
Total liabilities and members' equity |
$ | 7,424 | $ | 8,095 | |||||
See accompanying notes to consolidated financial statements
F-10
HUNTSMAN INTERNATIONAL LLC AND SUBSIDIARIES
CONSOLIDATED STATEMENTS OF OPERATIONS AND
COMPREHENSIVE (LOSS) INCOME
(Dollars in Millions)
| |
Year Ended December 31, | |||||||||||
|---|---|---|---|---|---|---|---|---|---|---|---|---|
| |
2008 | 2007 | 2006 | |||||||||
Revenues: |
||||||||||||
Trade sales, services and fees |
$ | 10,117 | $ | 9,480 | $ | 8,622 | ||||||
Related party sales |
98 | 171 | 109 | |||||||||
Total revenues |
10,215 | 9,651 | 8,731 | |||||||||
Cost of goods sold |
8,934 | 8,095 | 7,292 | |||||||||
Gross profit |
1,281 | 1,556 | 1,439 | |||||||||
Operating expenses: |
||||||||||||
Selling, general and administrative |
881 | 871 | 761 | |||||||||
Research and development |
154 | 145 | 115 | |||||||||
Other operating expense (income) |
27 | (55 | ) | (114 | ) | |||||||
Restructuring, impairment and plant closing costs |
36 | 42 | 15 | |||||||||
Total expenses |
1,098 | 1,003 | 777 | |||||||||
Operating income |
183 | 553 | 662 | |||||||||
Interest expense, net |
(264 |
) |
(287 |
) |
(355 |
) |
||||||
Loss on accounts receivable securitization program |
(27 | ) | (21 | ) | (13 | ) | ||||||
Equity in income of investment in unconsolidated affiliates |
14 | 13 | 4 | |||||||||
Loss on early extinguishment of debt |
(1 | ) | (3 | ) | (39 | ) | ||||||
Other income |
1 | — | 2 | |||||||||
(Loss) income from continuing operations before income taxes and minority interest |
(94 | ) | 255 | 261 | ||||||||
Income tax benefit (expense) |
2 | (41 | ) | 31 | ||||||||
Minority interest in subsidiaries' (income) loss |
(1 | ) | 9 | (3 | ) | |||||||
(Loss) income from continuing operations |
(93 | ) | 223 | 289 | ||||||||
Income (loss) from discontinued operations (including gain (loss) on disposal of $11 in 2008, ($351) in 2007 and ($280) in 2006), net of tax |
117 | (228 | ) | (111 | ) | |||||||
Income (loss) before extraordinary gain (loss) |
24 | (5 | ) | 178 | ||||||||
Extraordinary gain (loss) on the acquisition of a business, net of tax of nil |
14 | (7 | ) | 56 | ||||||||
Net income (loss) |
$ | 38 | $ | (12 | ) | $ | 234 | |||||
Net income (loss) |
$ |
38 |
$ |
(12 |
) |
$ |
234 |
|||||
Other comprehensive (loss) income |
(741 | ) | 334 | 183 | ||||||||
Comprehensive (loss) income |
$ | (703 | ) | $ | 322 | $ | 417 | |||||
See accompanying notes to consolidated financial statements
F-11
HUNTSMAN INTERNATIONAL LLC AND SUBSIDIARIES
CONSOLIDATED STATEMENTS OF MEMBERS' EQUITY
(Dollars in Millions)
| |
Members' equity | |
|
|
||||||||||||
|---|---|---|---|---|---|---|---|---|---|---|---|---|---|---|---|---|
| |
Accumulated deficit |
Accumulated other comprehensive (loss) income |
|
|||||||||||||
| |
Units | Amount | Total | |||||||||||||
Balance, January 1, 2006 |
2,728 | $ | 2,794 | $ | (1,365 | ) | $ | (97 | ) | $ | 1,332 | |||||
Net income |
— | — | 234 | — | 234 | |||||||||||
Other comprehensive income |
— | — | — | 183 | 183 | |||||||||||
Contribution from parent, net of distributions |
— | 18 | — | — | 18 | |||||||||||
Cumulative effect of adoption of SFAS No. 158, net of tax |
— | — | — | (233 | ) | (233 | ) | |||||||||
Balance, December 31, 2006 |
2,728 | 2,812 | (1,131 | ) | (147 | ) | 1,534 | |||||||||
Net loss |
— | — | (12 | ) | — | (12 | ) | |||||||||
Other comprehensive income |
— | — | — | 334 | 334 | |||||||||||
Contribution from parent, net of distributions |
— | 26 | — | — | 26 | |||||||||||
Reversal of valuation allowance on deferred tax assets related to previous equity transactions |
— | 7 | — | — | 7 | |||||||||||
Balance, December 31, 2007 |
2,728 | 2,845 | (1,143 | ) | 187 | 1,889 | ||||||||||
Net income |
— | — | 38 | — | 38 | |||||||||||
Other comprehensive loss |
— | — | — | (741 | ) | (741 | ) | |||||||||
Effect of adoption of SFAS No. 158, net of tax |
— | — | (3 | ) | — | (3 | ) | |||||||||
Contribution from parent, net of distributions |
— | 20 | — | — | 20 | |||||||||||
Dividends paid |
— | — | (306 | ) | — | (306 | ) | |||||||||
Balance, December 31, 2008 |
2,728 | $ | 2,865 | $ | (1,414 | ) | $ | (554 | ) | $ | 897 | |||||
See accompanying notes to consolidated financial statements
F-12
HUNTSMAN INTERNATIONAL LLC AND SUBSIDIARIES
CONSOLIDATED STATEMENTS OF CASH FLOWS
(Dollars in Millions)
| |
Year Ended December 31, | ||||||||||
|---|---|---|---|---|---|---|---|---|---|---|---|
| |
2008 | 2007 | 2006 | ||||||||
Operating Activities: |
|||||||||||
Net income (loss) |
$ | 38 | $ | (12 | ) | $ | 234 | ||||
Adjustments to reconcile net income (loss) to net cash provided by operating activities: |
|||||||||||
Extraordinary (gain) loss on the acquisition of a business, net of tax |
(14 | ) | 7 | (56 | ) | ||||||
Equity in income of investment in unconsolidated affiliates |
(14 | ) | (13 | ) | (4 | ) | |||||
Dividends received from unconsolidated affiliates |
11 | — | — | ||||||||
Depreciation and amortization |
374 | 391 | 439 | ||||||||
Provision for losses on accounts receivable |
6 | 3 | 6 | ||||||||
Loss on disposal of businesses/assets, net |
6 | 269 | 188 | ||||||||
Loss on early extinguishment of debt |
1 | 3 | 39 | ||||||||
Noncash interest expense |
2 | 5 | 9 | ||||||||
Noncash restructuring, impairment and plant closing costs |
7 | 15 | 18 | ||||||||
Deferred income taxes |
26 | (150 | ) | (63 | ) | ||||||
Net unrealized loss (gain) on foreign currency transactions |
4 | (9 | ) | (42 | ) | ||||||
Noncash compensation |
20 | 26 | 18 | ||||||||
Minority interest in subsidiaries' income (loss) |
1 | (9 | ) | 3 | |||||||
Noncash gain on partial fire insurance settlement |
(135 | ) | — | — | |||||||
Other, net |
4 | (1 | ) | (1 | ) | ||||||
Changes in operating assets and liabilities: |
|||||||||||
Accounts and notes receivable |
263 | 56 | 229 | ||||||||
Inventories, net |
(119 | ) | (74 | ) | (59 | ) | |||||
Prepaid expenses |
(9 | ) | 3 | (18 | ) | ||||||
Other current assets |
(5 | ) | 43 | (51 | ) | ||||||
Other noncurrent assets |
41 | (162 | ) | 235 | |||||||
Accounts payable |
(193 | ) | (148 | ) | 22 | ||||||
Accrued liabilities |
(17 | ) | (177 | ) | 21 | ||||||
Other noncurrent liabilities |
(259 | ) | (9 | ) | (284 | ) | |||||
Net cash provided by operating activities |
39 | 57 | 883 | ||||||||
Investing Activities: |
|||||||||||
Capital expenditures |
(418 | ) | (665 | ) | (550 | ) | |||||
Acquisition of business, net of cash acquired and post-closing adjustments |
(2 | ) | 13 | (177 | ) | ||||||
Proceeds from sale of businesses/assets, net of adjustments |
(26 | ) | 850 | 895 | |||||||
Decrease (increase) in receivable from affiliate |
179 | (178 | ) | — | |||||||
Investment in unconsolidated affiliates |
(44 | ) | (17 | ) | (14 | ) | |||||
Cash received from unconsolidated affiliates |
10 | 4 | 2 | ||||||||
Change in restricted cash |
(8 | ) | — | — | |||||||
Other, net |
(5 | ) | 1 | 3 | |||||||
Net cash (used in) provided by investing activities |
(314 | ) | 8 | 159 | |||||||
(Continued) |
|||||||||||
F-13
HUNTSMAN INTERNATIONAL LLC AND SUBSIDIARIES
CONSOLIDATED STATEMENTS OF CASH FLOWS (Continued)
(Dollars in Millions)
| |
Year Ended December 31, | ||||||||||
|---|---|---|---|---|---|---|---|---|---|---|---|
| |
2008 | 2007 | 2006 | ||||||||
Financing Activities: |
|||||||||||
Net borrowings (repayments) under revolving loan facilities |
11 | (17 | ) | (6 | ) | ||||||
Net borrowings (repayments) on overdraft facilities and other short-term debt |
8 | 15 | (7 | ) | |||||||
Repayments of long-term debt |
(11 | ) | (422 | ) | (1,784 | ) | |||||
Proceeds from issuance of long-term debt |
101 | 266 | 872 | ||||||||
Issuance of note payable to affiliate |
423 | — | — | ||||||||
Borrowings on notes payable |
48 | 53 | 74 | ||||||||
Repayments of notes payable |
(55 | ) | (57 | ) | (60 | ) | |||||
Dividends paid |
(306 | ) | — | — | |||||||
Debt issuance costs paid |
(5 | ) | (5 | ) | (13 | ) | |||||
Call premiums related to early extinguishment of debt |
— | (1 | ) | (30 | ) | ||||||
Contribution from minority shareholder |
— | — | 6 | ||||||||
Other, net |
(1 | ) | (1 | ) | 4 | ||||||
Net cash provided by (used in) financing activities |
213 | (169 | ) | (944 | ) | ||||||
Effect of exchange rate changes on cash |
(5 | ) | 12 | 15 | |||||||
(Decrease) increase in cash and cash equivalents |
(67 | ) | (92 | ) | 113 | ||||||
Cash and cash equivalents at beginning of period |
154 | 246 | 133 | ||||||||
Cash and cash equivalents at end of period |
$ | 87 | $ | 154 | $ | 246 | |||||
Supplemental cash flow information: |
|||||||||||
Cash paid for interest |
$ | 265 | $ | 303 | $ | 397 | |||||
Cash paid for income taxes |
34 | 73 | 40 | ||||||||
During the years ended December 31, 2008, 2007 and 2006, the amount of capital expenditures in accounts payable increased by $9 million, $72 million and nil, respectively. During the years ended December 31, 2008, 2007 and 2006, Huntsman Corporation contributed $20 million, $26 million and $18 million respectively, related to stock based compensation.
See accompanying notes to consolidated financial statements
F-14
HUNTSMAN CORPORATION AND SUBSIDIARIES
HUNTSMAN INTERNATIONAL LLC AND SUBSIDIARIES
NOTES TO CONSOLIDATED FINANCIAL STATEMENTS
1. GENERAL
DEFINITIONS
Each capitalized term used without definition in these notes to consolidated financial statements has the meaning specified in the Annual Report on Form 10-K to which these notes to consolidated financial statements are included.
DESCRIPTION OF BUSINESS
We are a global manufacturer of differentiated organic chemical products and of inorganic chemical products. Our products comprise a broad range of chemicals and formulations, which we market globally to a diversified group of consumer and industrial customers. Our products are used in a wide range of applications, including those in the adhesives, aerospace, automotive, construction products, durable and non-durable consumer products, electronics, medical, packaging, paints and coatings, power generation, refining, synthetic fiber, textile chemicals and dye industries. We are a leading global producer in many of our key product lines, including MDI, amines, surfactants, epoxy-based polymer formulations, textile chemicals, dyes, maleic anhydride and titanium dioxide.
As of December 31, 2008, we operated in four segments: Polyurethanes, Materials and Effects, Performance Products and Pigments. Our Polyurethanes, Materials and Effects and Performance Products segments produce differentiated organic chemical products and our Pigments segment produces inorganic chemical products. In a series of transactions completed in 2006 and 2007, we sold substantially all of our former Polymers and Base Chemicals operations. We report the results of these discontinued operations in our Polymers and Base Chemicals segments. For more information, see "Note 3. Discontinued Operations."
COMPANY
Our Company, a Delaware corporation, was formed in 2004 to hold the Huntsman businesses. Jon M. Huntsman founded the predecessor to our Company in the early 1970s as a small packaging company. Since then, we have grown through a series of significant acquisitions and now own a global portfolio of businesses.
We operate all of our businesses through Huntsman International, our 100% owned subsidiary. Huntsman International is a Delaware limited liability company and was formed in 1999.
During 2007, we completed the U.S. Petrochemicals Disposition pursuant to which we sold our North American polymers business and our U.S. base chemicals business. During 2006, we completed the U.K. Petrochemicals Disposition. In 2005, we sold our former TDI business. The results of operations of these businesses are classified as discontinued operations. For further information, see "Note 3. Discontinued Operations."
TERMINATION OF MERGER AGREEMENT AND SETTLEMENT OF RELATED LITIGATION
On July 12, 2007, we entered into the Merger Agreement with Hexion pursuant to which Hexion agreed to acquire all of our outstanding common stock for $28.00 per share (plus a ticking fee) in cash. On June 18, 2008, Hexion, Apollo and certain of their affiliates filed an action for declaratory judgment against us in Delaware Chancery Court. On June 23, 2008, we sued Apollo and certain of its
F-15
HUNTSMAN CORPORATION AND SUBSIDIARIES
HUNTSMAN INTERNATIONAL LLC AND SUBSIDIARIES
NOTES TO CONSOLIDATED FINANCIAL STATEMENTS (Continued)
1. GENERAL (Continued)
affiliates in the District Court of Montgomery County alleging tortiously interfering with our previously executed merger agreement with Basell. On July 2, 2008, we countersued Hexion and Apollo in the Delaware Litigation seeking specific performance of the Merger Agreement and, alternatively, damages.
Following a six-day trial in the Delaware Chancery Court, Vice Chancellor Stephen P. Lamb issued an Opinion and an Order and Final Partial Judgment, ruling that, among other things, we had not suffered a material adverse effect in our business and that Hexion knowingly and intentionally breached numerous of its covenants under the Merger Agreement (as a result of which Hexion's liability for damages for failing to consummate the Merger would not be limited to the $325 million Termination Fee as provided in the Merger Agreement). Vice Chancellor Lamb ordered Hexion to specifically perform its covenants under the Merger Agreement, including its covenants to (i) use reasonable best efforts to consummate the Merger and financing provided under the Commitment Letter, (ii) refrain from taking any further action that could reasonably be expected to materially impair, delay or prevent consummation of financing, and (iii) take all actions necessary to obtain antitrust approval for the Merger by October 2, 2008.
On September 30, 2008, we filed suit in the 9th Judicial District Court in Montgomery County, Texas against the Lenders alleging, among other things, that the Lenders had conspired with Apollo to tortiously interfere with the Basell Merger Agreement.
As a result of the Delaware Litigation, Hexion and our Company agreed to schedule the closing of the Merger Agreement for October 28, 2008. The Commitment Letter required that the Lenders be provided, at closing, with either (i) a solvency opinion of a reputable valuation firm, (ii) a solvency certificate signed by the chief financial officer of Hexion or (iii) a solvency certificate signed by our chief financial officer. This closing condition could be satisfied if any one of the opinions/certificates described in the preceding sentence was delivered and was in a form customary for transactions involving portfolio companies of Apollo. On September 12, 2008, we announced that we had engaged a reputable valuation firm, American Appraisal, to provide an opinion that the combined Hexion/Huntsman entity was solvent based on traditional solvency tests. On October 23, 2008, five days prior to the anticipated closing, American Appraisal provided us with a solvency opinion that the combined entity was solvent. On October 28, 2008, American Appraisal issued an additional opinion that the combined entity was solvent, and J. Kimo Esplin executed a certificate in his capacity as our chief financial officer that the combined entity was solvent.
Notwithstanding the opinions and certificate, very late on the evening of October 27, 2008, the Lenders sent a letter to Hexion stating that they did not believe that the solvency opinion and certificate proposed to be provided met the condition of the Commitment Letter and effectively said that, as a result, the Lenders would not fund the proposed closing of the Merger scheduled for October 28, 2008. Hexion sent the Lenders a reply letter disputing the Lenders' position and noting that both the American Appraisal opinion and the certificate of our chief financial officer were in forms customary for transactions involving Apollo portfolio companies. Because the Lenders continued to refuse to fund, Hexion brought suit against the Lenders in the Supreme Court of the State of New York, New York County on October 29, 2008 seeking specific performance of the Lenders' commitment under the Commitment Letter. Hexion also sought an order temporarily restraining the Lenders from terminating the Commitment Letter. On October 31, 2008, the Court refused to grant Hexion a
F-16
HUNTSMAN CORPORATION AND SUBSIDIARIES
HUNTSMAN INTERNATIONAL LLC AND SUBSIDIARIES
NOTES TO CONSOLIDATED FINANCIAL STATEMENTS (Continued)
1. GENERAL (Continued)
preliminary injunction preventing termination of the Commitment Letter. The Lenders have taken the position that the Commitment Letter expired by its terms on November 2, 2008.
On December 13, 2008, we sent notice to Hexion and Apollo that, pursuant to the terms of the Merger Agreement, we had terminated the Merger Agreement. Following the termination of the Merger Agreement, on December 14, 2008, we, together with certain of our affiliates, including Jon M. Huntsman and Peter R. Huntsman, entered into the Settlement Agreement with Hexion, Hexion's chief executive officer Craig O. Morrison, and Apollo and certain of its affiliates, including Leon Black and Joshua J. Harris.
Under the Settlement Agreement, upon full and final payment of all amounts due to us as described below, the parties agreed to take all necessary and appropriate action to obtain the dismissal with prejudice of (i) the Delaware Litigation, (ii) the Texas Apollo Litigation and (iii) Apollo and Hexion's lawsuit against us in New York. In addition, we agreed to promptly move to sever and dismiss Apollo from the Texas Bank Litigation and Hexion agreed to seek leave to withdraw its claims in the New York Bank Litigation. We also agreed to cooperate with Hexion and Apollo in a stockholder action brought against them in New York by certain of our stockholders, and Hexion and Apollo have agreed to cooperate with us in the Texas Bank Litigation, including by causing certain individuals to testify at trial if we so request. The parties also agreed to release each other from all claims and actions they have or may have against each other, other than claims arising out of ordinary course business commercial dealings and certain other specified matters.
Pursuant to the Settlement Agreement, Hexion and certain Apollo affiliates have paid us an aggregate of $1 billion. Of the $1 billion, Apollo affiliates paid us $425 million in cash and purchased $250 million of our Convertible Notes (as described below). In addition, Hexion paid us the $325 million Termination Fee as required under the Merger Agreement. Apollo and certain of its affiliates and Hexion and certain of its affiliates are jointly and severally liable for the payment of the aggregate $1 billion. In the event any payment by or on behalf of Hexion or any of its affiliates is rescinded or required by any court to be returned for any reason having to do with Hexion and its affiliates, the joint and several obligations of Apollo, Hexion and certain of their respective affiliates will continue in full force and effect.
Also pursuant to the Settlement Agreement, we agreed to indemnify and hold harmless Hexion, Apollo and certain of their respective affiliates, officers, directors, managers, members, employees, agents and other representatives from any claim for indemnification or contribution or any other claim asserted against the Indemnified Parties by the Lenders or their affiliates that in any way arises out of any claims made by us and our affiliates against the Lenders, including claims for contribution asserted by the Lenders against Apollo and its affiliates in the Texas Bank Litigation. Our indemnification obligation does not cover legal fees and expenses incurred by the Lenders or the attorneys' fees and expenses of the Indemnified Parties in defending the Lenders' claims. The aggregate amount we must pay pursuant to indemnification will not exceed the amount of our recovery collected, if any, in the Texas Bank Litigation net of attorney fees, costs and expenses related to the Texas Bank Litigation.
In connection with the Settlement Agreement, on December 14, 2008, we, together with certain of our affiliates, entered into the Letter Agreement with Hexion and certain of its affiliates and Apollo and certain of its affiliates, pursuant to which we agreed to pay Apollo and certain of its affiliates an
F-17
HUNTSMAN CORPORATION AND SUBSIDIARIES
HUNTSMAN INTERNATIONAL LLC AND SUBSIDIARIES
NOTES TO CONSOLIDATED FINANCIAL STATEMENTS (Continued)
1. GENERAL (Continued)
amount of cash equal to 20% of the value of cash and non-cash consideration that is in excess of $500 million that we may obtain or receive in settlement in connection with any claims we made against the Lenders arising from or relating to the Merger Agreement, the transactions contemplated thereby and related matters, including the Texas Bank Litigation, after we first recover our attorneys' fees, costs and expenses in making the claim. In no circumstance will the aggregate amount of payments owed by us to the Apollo parties under the Letter Agreement exceed $425 million. Moreover, in the event trial commences in the Texas Bank Litigation, any interest on the part of the Apollo parties will terminate immediately and we will not owe any portion of any subsequent recovery to the Apollo parties.
All of the aggregate $1 billion in payments due under the Settlement Agreement were paid to us before December 30, 2008. As a result, the Delaware Litigation, the Texas Apollo Litigation, and Apollo and Hexion's lawsuit against us in New York have been dismissed. Hexion has withdrawn its claims against the Lenders in the New York Bank Litigation. We used $423 million of the $1 billion in proceeds to pay down our Revolving Facility. We intend to use the remaining amount, net of fees and expenses related to the Merger, for general liquidity purposes and possible additional reductions of our indebtedness.
The Texas Bank Litigation remains ongoing, and a court ordered mediation is scheduled to begin May 11, 2009, followed by a trial which is currently set for June 8, 2009. Please see "Recent Developments—Texas Bank Litigation" below.
RECENT DEVELOPMENTS
SALE OF CONVERTIBLE NOTES IN CONNECTION WITH SETTLEMENT AGREEMENT
Pursuant to the Settlement Agreement, on December 23, 2008, we issued $250 million of our Convertible Notes to Apollo affiliates under a Note Purchase Agreement. We recorded these Convertible Notes at a fair value of $235 million. The Convertible Notes are convertible at any time, at the holder's option, at an initial conversion rate of 127.275 shares of our common stock per $1,000 principal amount of Convertible Notes (which is equal to an initial conversion price of $7.857 per share), subject to specified anti-dilution adjustments. The Convertible Notes bear interest at the rate of 7% per year payable semi-annually on July 1 and January 1 of each year, beginning on July 1, 2009. Interest is payable either in cash or, at our option, in shares of our common stock having a market value at that time equal to the interest payment. The Convertible Notes are our senior unsecured obligations and are not guaranteed by any of our subsidiaries, including Huntsman International.
The Convertible Notes will mature on December 23, 2018. At maturity, we may, at our option, pay the principal amount of the Convertible Notes in shares of our common stock having a market value at that time equal to the principal amount of the Convertible Notes, plus an amount equal to the underwriting spread of a nationally-recognized underwriter chosen by us that would be paid by a seller of the shares at such time.
We may redeem the Convertible Notes in whole, for cash, at the principal amount of the Convertible Notes plus accrued and unpaid interest, at any time on or after December 23, 2011 if the closing price of our common stock, for at least 20 consecutive trading days prior to the notice of redemption, exceeds 135% of the conversion price in effect at that time.
F-18
HUNTSMAN CORPORATION AND SUBSIDIARIES
HUNTSMAN INTERNATIONAL LLC AND SUBSIDIARIES
NOTES TO CONSOLIDATED FINANCIAL STATEMENTS (Continued)
1. GENERAL (Continued)
Upon the occurrence of certain change of control events, the holders of the Convertible Notes may require us to redeem all or any portion of the holders' Convertible Notes at the principal amount plus accrued and unpaid interest.
In connection with the issuance of the Convertible Notes, we entered into a Registration Rights Agreement, dated as of December 23, 2008, with Apollo and certain of its affiliates. Pursuant to the Registration Rights Agreement, we have agreed to use our reasonable best efforts to register the resale of our common stock issuable upon conversion of the Convertible Notes (and common stock payable as interest or principal on the Convertible Notes) under the Securities Act of 1933, as amended.
VOTING AND STANDSTILL AGREEMENT
In addition to the Note Purchase Agreement and the Registration Rights Agreement, we entered into a Voting and Standstill Agreement, dated as of December 23, 2008 with Apollo and certain other stockholders related to Apollo that prohibits such persons from owning any of our common stock, other than common stock paid to such persons pursuant to the Convertible Notes or shares of our common stock beneficially owned by such persons as of December 23, 2008. Without our consent, persons subject to the Voting and Standstill Agreement may not transfer the Convertible Notes or the Underlying Securities, other than (i) transfers involving Underlying Securities paid as interest, (ii) certain transfers to certain affiliates and (iii) certain bona fide pledges related to borrowings from financial institutions. The Voting and Standstill Agreement further restricts Apollo and certain related stockholders from taking certain actions, including engaging in or participating in any proxy solicitation relating to the election of our Board of Directors or our Board's publicly disclosed recommendation on certain matters. The shares of our common stock held by such persons must be voted, at our election, either (i) in the manner recommended by our Board or (ii) in the same proportion as our other stockholders. The Voting and Standstill Agreement terminates upon the later to occur of (i) December 31, 2010 or (ii) the date on which none of Apollo and its related stockholders beneficially or of record own Convertible Notes or any Underlying Securities representing 3% or more of our then-outstanding common stock.
TEXAS BANK LITIGATION
As noted above, on September 30, 2008, we filed suit in the 9th Judicial District Court in Montgomery County, Texas against the Lenders alleging, among other things, that the Lenders had conspired with Apollo to tortiously interfere with the Basell Merger Agreement. Our petition against the Lenders includes claims of common law fraud, civil conspiracy, tortious interference with contract, and unjust enrichment. We are seeking to recover damages measured by the benefit of the bargain or the amount by which the Lenders were unjustly enriched as a result of the injuries we believe they inflicted on us. Discovery, including depositions, has commenced. A court ordered mediation is scheduled to begin May 11, 2009. Trial is currently set for June 8, 2009. Also pending before the same court is a motion for summary judgment by certain entities and persons affiliated with Apollo Management, which seeks entry of an order barring contribution claims that have been asserted against them by the Lenders. That motion is not currently set for hearing. We intend to prosecute our claims vigorously.
F-19
HUNTSMAN CORPORATION AND SUBSIDIARIES
HUNTSMAN INTERNATIONAL LLC AND SUBSIDIARIES
NOTES TO CONSOLIDATED FINANCIAL STATEMENTS (Continued)
1. GENERAL (Continued)
HUNTSMAN CORPORATION AND HUNTSMAN INTERNATIONAL FINANCIAL STATEMENTS
Except where otherwise indicated, these notes relate to the consolidated financial statements for each of our Company and Huntsman International. The differences between our financial statements and Huntsman International's financial statements relate primarily to the following:
2. SUMMARY OF SIGNIFICANT ACCOUNTING POLICIES
PRINCIPLES OF CONSOLIDATION
Our consolidated financial statements include the accounts of our wholly-owned and majority-owned subsidiaries and any variable interest entities for which we are the primary beneficiary. All intercompany accounts and transactions have been eliminated, except for intercompany sales between continuing and discontinued operations.
USE OF ESTIMATES
The preparation of financial statements in conformity with GAAP requires management to make estimates and assumptions that affect the reported amounts of assets and liabilities and disclosure of contingent assets and liabilities at the date of the financial statements and the reported amounts of revenues and expenses during the reporting period. Actual results could differ from those estimates.
RECLASSIFICATIONS
Certain amounts in the consolidated financial statements for prior periods have been reclassified to conform with the current presentation.
REVENUE RECOGNITION
We generate substantially all of our revenues through sales in the open market and long-term supply agreements. We recognize revenue when it is realized or realizable and earned. Revenue for product sales is recognized when a sales arrangement exists, risk and title to the product transfer to the customer, collectibility is reasonably assured and pricing is fixed or determinable. The transfer of risk and title to the product to the customer usually occurs at the time shipment is made.
Revenue arrangements that contain multiple deliverables, which relate primarily to licensing of technology, are evaluated in accordance with EITF Issue No. 00-21, Revenue Arrangements with Multiple Deliverables, to determine whether the arrangements should be divided into separate units of
F-20
HUNTSMAN CORPORATION AND SUBSIDIARIES
HUNTSMAN INTERNATIONAL LLC AND SUBSIDIARIES
NOTES TO CONSOLIDATED FINANCIAL STATEMENTS (Continued)
2. SUMMARY OF SIGNIFICANT ACCOUNTING POLICIES (Continued)
accounting and how the arrangement consideration should be measured and allocated among the separate units of accounting.
COST OF GOODS SOLD
We classify the costs of manufacturing and distributing our products as cost of goods sold. Manufacturing costs include variable costs, primarily raw materials and energy, and fixed expenses directly associated with production. Manufacturing costs also include, among other things, plant site operating costs and overhead (including depreciation), production planning and logistics costs, repair and maintenance costs, plant site purchasing costs, and engineering and technical support costs. Distribution, freight and warehousing costs are also included in cost of goods sold.
CASH AND CASH EQUIVALENTS
We consider cash in checking accounts and cash in short-term highly liquid investments with an original maturity of three months or less to be cash and cash equivalents. Cash flows from discontinued operations are not presented separately in the accompanying consolidated statements of cash flows.
SECURITIZATION OF ACCOUNTS RECEIVABLE
In connection with our A/R Securitization Program, we securitize certain trade receivables. The A/R Securitization Program is structured so that we grant a participating undivided interest in certain of our trade receivables to a qualified off-balance sheet entity. We retain the servicing rights and a retained interest in the securitized receivables. Losses are recorded on the sale and are based on the carrying value of the receivables as allocated between the receivables sold and the retained interests and their relative fair value at the date of the transfer. Retained interests are subsequently carried at fair value which is estimated based on the present value of expected cash flows, calculated using management's best estimates of key assumptions including credit losses and discount rates commensurate with the risks involved. For more information, see "Note 16. Securitization of Accounts Receivable."
INVENTORIES
Inventories are stated at the lower of cost or market, with cost determined using last-in first-out, first-in first-out, and average costs methods for different components of inventory.
PROPERTY, PLANT AND EQUIPMENT
Property, plant and equipment is stated at cost less accumulated depreciation. Depreciation is computed using the straight-line method over the estimated useful lives or lease term as follows:
Buildings and equipment |
10 - 33 years | |
Plant and equipment |
3 - 25 years | |
Furniture, fixtures and leasehold improvements |
5 - 20 years |
Interest expense capitalized as part of plant and equipment was $17 million, $17 million and $16 million for the years ended December 31, 2008, 2007 and 2006, respectively.
F-21
HUNTSMAN CORPORATION AND SUBSIDIARIES
HUNTSMAN INTERNATIONAL LLC AND SUBSIDIARIES
NOTES TO CONSOLIDATED FINANCIAL STATEMENTS (Continued)
2. SUMMARY OF SIGNIFICANT ACCOUNTING POLICIES (Continued)
Periodic maintenance and repairs applicable to major units of manufacturing facilities (a "turnaround") are accounted for on the deferral basis by capitalizing the costs of the turnaround and amortizing the costs over the estimated period until the next turnaround. Normal maintenance and repairs of plant and equipment are charged to expense as incurred. Renewals, betterments and major repairs that materially extend the useful life of the assets are capitalized, and the assets replaced, if any, are retired.
INVESTMENT IN UNCONSOLIDATED AFFILIATES
Investments in companies in which we exercise significant management influence, but do not control, are accounted for using the equity method. Investments in companies in which we do not exercise significant influence are accounted for using the cost method.
INTANGIBLE ASSETS AND GOODWILL
Intangible assets are stated at cost (fair value at the time of acquisition) and are amortized using the straight-line method over the estimated useful lives or the life of the related agreement as follows:
Patents and technology |
5 - 30 years | |
Trademarks |
15 - 30 years | |
Licenses and other agreements |
5 - 15 years | |
Other intangibles |
5 - 15 years |
Goodwill represents costs in excess of fair values assigned to the underlying net assets of acquired businesses. Goodwill is not subject to any method of amortization, but is tested for impairment annually (at the beginning of the third quarter) and when events and circumstances change that would more likely than not reduce the fair value of a reporting unit below its carrying amount. When the fair value is less than the carrying value of the related reporting unit, we are required to reduce the amount of goodwill through a charge to earnings. Fair value is estimated using the market approach, as well as the income approach based on discounted cash flow projections. Goodwill has been assigned to reporting units for purposes of impairment testing.
OTHER NONCURRENT ASSETS
Other noncurrent assets consist primarily of spare parts, deferred debt issuance costs, the overfunded portion related to defined benefit plans for employees and capitalized turnaround costs. Debt issuance costs are amortized using the interest method over the term of the related debt.
CARRYING VALUE OF LONG-LIVED ASSETS
We review long-lived assets and all amortizable intangible assets, other than goodwill, for impairment whenever events or changes in circumstances indicate that the carrying amount of these assets may not be recoverable. Recoverability is based upon current and anticipated undiscounted cash flows, and we recognize an impairment when such estimated cash flows are less than the carrying value of the asset. Measurement of the amount of impairment, if any, is based upon the difference between carrying value and fair value. Fair value is generally estimated by discounting estimated future cash
F-22
HUNTSMAN CORPORATION AND SUBSIDIARIES
HUNTSMAN INTERNATIONAL LLC AND SUBSIDIARIES
NOTES TO CONSOLIDATED FINANCIAL STATEMENTS (Continued)
2. SUMMARY OF SIGNIFICANT ACCOUNTING POLICIES (Continued)
flows using a discount rate commensurate with the risks involved. See "Note 3. Discontinued Operations" and "Note 11. Restructuring, Impairment and Plant Closing Costs."
FINANCIAL INSTRUMENTS
The carrying amount reported in the balance sheet for cash and cash equivalents, accounts receivable and accounts payable approximates fair value because of the immediate or short-term maturity of these financial instruments. The fair value of government securities and non-qualified employee benefit plan investments are estimated using prevailing market prices. With the exception of our Convertible Notes, which were recorded at fair value based on the present value of estimated future cash flows, our long-term debt was recorded at cost. The estimated fair values of our long-term debt other than the Convertible Notes are based on quoted market prices or on interest rates that are currently available to us for issuance of debt with similar terms and remaining maturities for debt issues not quoted on an exchange. See "Note 17. Fair Value Measurements" and "Note 18. Fair Value of Financial Instruments."
INCOME TAXES
We use the asset and liability method of accounting for income taxes. Deferred income taxes reflect the net tax effects of temporary differences between the carrying amounts of assets and liabilities for financial and tax reporting purposes. We evaluate deferred tax assets to determine whether it is more likely than not that they will be realized. Valuation allowances have been established against a material portion of the non-U.S. deferred tax assets due to an uncertainty of realization. Valuation allowances are reviewed each period on a tax jurisdiction by tax jurisdiction basis to analyze whether there is sufficient positive or negative evidence to support a change in judgment about the realizability of the related deferred tax assets.
We do not provide for income taxes or benefits on the undistributed earnings of our non-U.S. subsidiaries as earnings are reinvested and, in the opinion of management, will continue to be reinvested indefinitely.
We adopted FIN 48, Accounting for Uncertainty in Income Taxes—an interpretation of FASB Statement No. 109, on January 1, 2007. The cumulative effect of adopting FIN 48 was not significant. FIN 48 clarifies the accounting for uncertainty in income taxes recognized in accordance with SFAS No. 109, Accounting for Income Taxes, by prescribing a recognition threshold and measurement attribute for the financial statement recognition and measurement of a tax position taken or expected to be taken in a tax return. The application of income tax law is inherently complex. We are required to determine if an income tax position meets the criteria of more-likely-than-not to be realized based on the merits of the position under tax laws, in order to recognize an income tax benefit. This requires us to make many assumptions and judgments regarding merits of income tax positions and the application of income tax law. Additionally, if a tax position meets the recognition criteria of more-likely-than-not we are required to make judgments and assumptions to measure the amount of the tax benefits to recognize based on the probability of the amount of tax benefits that would be realized if the tax position was challenged by the taxing authorities. Interpretations and guidance surrounding income tax laws and regulations change over time. As a consequence, changes in assumptions and judgments can materially affect amounts recognized in the consolidated financial statements.
F-23
HUNTSMAN CORPORATION AND SUBSIDIARIES
HUNTSMAN INTERNATIONAL LLC AND SUBSIDIARIES
NOTES TO CONSOLIDATED FINANCIAL STATEMENTS (Continued)
2. SUMMARY OF SIGNIFICANT ACCOUNTING POLICIES (Continued)
DERIVATIVES AND HEDGING ACTIVITIES
All derivatives, whether designated in hedging relationships or not, are recorded on the balance sheet at fair value. If the derivative is designated as a fair value hedge, the changes in the fair value of the derivative and the hedged items are recognized in earnings. If the derivative is designated as a cash flow hedge, changes in the fair value of the derivative are recorded in accumulated other comprehensive (loss) income, to the extent effective, and will be recognized in the income statement when the hedged item affects earnings. Changes in the fair value of the hedge in the net investment of certain international operations are recorded in other comprehensive income, to the extent effective. We perform effectiveness assessments in order to use hedge accounting at each reporting period. For a derivative that does not qualify or has not been designated as a hedge, changes in fair value are recognized in earnings.
ENVIRONMENTAL EXPENDITURES
Environmental related restoration and remediation costs are recorded as liabilities when site restoration and environmental remediation and clean-up obligations are either known or considered probable and the related costs can be reasonably estimated. Other environmental expenditures that are principally maintenance or preventative in nature are recorded when expended and incurred and are expensed or capitalized as appropriate. See "Note 23. Environmental, Health and Safety Matters."
ASSET RETIREMENT OBLIGATIONS
We accrue for asset retirement obligations, which consist primarily of landfill closure costs and asbestos abatement costs, in the period in which the obligations are incurred. Asset retirement obligations are accrued at estimated fair value. When the liability is initially recorded, we capitalize the cost by increasing the carrying amount of the related long-lived asset. Over time, the liability is accreted to its settlement value and the capitalized cost is depreciated over the useful life of the related asset. Upon settlement of the liability, we will recognize a gain or loss for any difference between the settlement amount and the liability recorded. See "Note 12. Asset Retirement Obligations."
RESEARCH AND DEVELOPMENT
Research and development costs are expensed as incurred.
FOREIGN CURRENCY TRANSLATION
The accounts of our operating subsidiaries outside of the U.S., except for those operating in highly inflationary economic environments, consider the functional currency to be the currency of the economic environment in which they operate. Accordingly, assets and liabilities are translated at rates prevailing at the balance sheet date. Revenues, expenses, gains and losses are translated at a weighted average rate for the period. Cumulative translation adjustments are recorded to stockholders' equity as a component of accumulated other comprehensive income (loss).
Subsidiaries that operate in economic environments that are highly inflationary consider the U.S. dollar to be the functional currency and include gains and losses from remeasurement to the U.S.
F-24
HUNTSMAN CORPORATION AND SUBSIDIARIES
HUNTSMAN INTERNATIONAL LLC AND SUBSIDIARIES
NOTES TO CONSOLIDATED FINANCIAL STATEMENTS (Continued)
2. SUMMARY OF SIGNIFICANT ACCOUNTING POLICIES (Continued)
dollar from the local currency in the statement of operations. The accounts of certain finance subsidiaries outside of the U.S. also consider the U.S. dollar to be the functional currency.
Transaction gains and losses are recorded in the statements of operations and were net losses of $12 million, $14 million, and $1 million for the years ended December 31, 2008, 2007 and 2006, respectively.
STOCK-BASED COMPENSATION
We account for stock-based compensation according to SFAS No. 123R, Share-Based Payment. SFAS No. 123R requires entities to measure the cost of employee services received in exchange for an award of equity instruments based on the grant-date fair value of the award. That cost will be recognized over the period during which the employee is required to provide services in exchange for the award. We have applied this standard prospectively to share-based awards. See "Note 26. Stock-Based Compensation Plan."
NET INCOME (LOSS) PER SHARE
Basic income (loss) per share excludes dilution and is computed by dividing net loss available to common stockholders by the weighted average number of shares outstanding during the period. Diluted income (loss) per share reflects potential dilution and is computed by dividing net loss available to common stockholders by the weighted average number of shares outstanding during the period increased by the number of additional shares that would have been outstanding as dilutive securities.
On December 23, 2008, we issued 7% Convertible Notes in an aggregate principal amount of $250 million that are convertible into common stock at a conversion price of $7.857 per share, subject to certain anti-dilution adjustments. See "Note 14. Debt."
On February 16, 2005, we issued 5,750,000 shares of 5% mandatory convertible preferred stock. On February 16, 2008, the mandatory convertible preferred stock converted into 12,082,475 shares of common stock.
F-25
HUNTSMAN CORPORATION AND SUBSIDIARIES
HUNTSMAN INTERNATIONAL LLC AND SUBSIDIARIES
NOTES TO CONSOLIDATED FINANCIAL STATEMENTS (Continued)
2. SUMMARY OF SIGNIFICANT ACCOUNTING POLICIES (Continued)
Basic and diluted income (loss) per share is calculated as follows (in millions, except share amounts):
| |
Year Ended December 31, | |||||||||
|---|---|---|---|---|---|---|---|---|---|---|
| |
2008 | 2007 | 2006 | |||||||
Numerator: |
||||||||||
Income from continuing operations |
$ | 478 | $ | 52 | $ | 307 | ||||
Convertible notes interest expense, net of tax |
— | — | — | |||||||
Income from continuing operations available to common stockholders |
$ | 478 | $ | 52 | $ | 307 | ||||
Shares (denominator): |
||||||||||
Weighted average shares outstanding |
231,968,936 | 220,948,495 | 220,618,478 | |||||||
Dilutive securities: |
||||||||||
Stock-based awards |
74,193 | 297,221 | 23,970 | |||||||
Convertible notes conversion |
697,397 | — | — | |||||||
Preferred stock conversion |
1,522,723 | 11,546,575 | 12,499,925 | |||||||
Total dilutive shares outstanding assuming conversion |
234,263,249 | 232,792,291 | 233,142,373 | |||||||
Additional stock-based awards of 7,056,171, 5,735,503 and 4,320,784 weighted average equivalent shares of stock were outstanding during the years ended December 31, 2008, 2007 and 2006, respectively. However, these stock-based awards were not included in the computation of diluted earnings per share because the effect would be anti-dilutive.
RECENTLY ISSUED ACCOUNTING PRONOUNCEMENTS
In December 2008, the FASB issued FSP No. FAS 132(R)-1, Employers' Disclosures about Postretirement Benefit Plan Assets. This FSP provides guidance on an employers' disclosures about plan assets of a defined benefit pension or other postretirement plan. The disclosures about plan assets required by this FSP are to be provided for fiscal years ending after December 15, 2009. We are evaluating FSP No. FAS 132(R)-1 to determine its impact on our consolidated financial statements.
We adopted FSP No. FAS 140-4 and FIN 46(R)-8, Disclosures by Public Entities (Enterprises) about Transfers of Financial Assets and Interests in Variable Interest Entities, as of December 31, 2008. This FSP amends SFAS No. 140, Accounting for Transfers and Servicing of Financial Assets and Extinguishments of Liabilities, to require public entities to provide additional disclosures about transfers of financial assets. It amends FIN 46(R), Consolidation of Variable Interest Entities, to require public enterprises to provide additional disclosures about their involvement with variable interest entities. It also requires additional disclosures by a public enterprise that is a sponsor or a servicer of a qualifying special purpose entity ("QSPE") that holds a variable interest in the QSPE but was not the transferor of financial assets to the QSPE. See "Note 16. Securitization of Accounts Receivable" and "Note 17. Fair Value Measurements."
In October 2008, the FASB issued FSP No. 157-3, Determining the Fair Value of a Financial Asset When the Market for That Asset Is Not Active. FSP 157-3 clarifies the application of SFAS No. 157, Fair Value Measurements, in a market that is not active and provides examples to illustrate key
F-26
HUNTSMAN CORPORATION AND SUBSIDIARIES
HUNTSMAN INTERNATIONAL LLC AND SUBSIDIARIES
NOTES TO CONSOLIDATED FINANCIAL STATEMENTS (Continued)
2. SUMMARY OF SIGNIFICANT ACCOUNTING POLICIES (Continued)
considerations in determining the fair value of a financial asset when the market for that financial asset is not active. This FSP became effective, and we adopted it, upon issuance in October 2008.
In May 2008, the FASB issued SFAS No. 162, The Hierarchy of Generally Accepted Accounting Principles. SFAS No. 162 identifies the sources of accounting principles and the framework for selecting the principles used in the preparation of financial statements of nongovernmental entities that are presented in conformity with GAAP in the U.S. (the GAAP hierarchy). We adopted this statement upon its effective date of November 15, 2008. The effective date was stated as 60 days following the Securities and Exchange Commission's approval of the Public Company Accounting Oversight Board amendments to AU Section 411, The Meaning of Present Fairly in Conformity With Generally Accepted Accounting Principles, and that approval occurred on September 16, 2008.
In March 2008, the FASB issued SFAS No. 161, Disclosures about Derivative Instruments and Hedging Activities—an Amendment of FASB Statement 133. SFAS No. 161 requires enhanced disclosures regarding the effect of an entity's derivative instruments and related hedging activities on its financial position, financial performance and cash flows. SFAS No. 161 is effective for fiscal years and interim periods beginning after November 15, 2008. Early application is encouraged. We are evaluating SFAS No. 161 to determine the impact of this statement on our consolidated financial statements.
In December 2007, the FASB issued SFAS No. 141 (R), Business Combinations, which replaced SFAS No. 141, Business Combinations. In December 2007, the FASB also issued SFAS No. 160, Noncontrolling Interests in Consolidated Financial Statements—an amendment of ARB No. 51. These statements significantly change the accounting for business combinations and noncontrolling interests. Among other things, these statements will require more assets acquired and liabilities assumed to be measured at fair value as of the acquisition date, liabilities related to contingent consideration to be remeasured to fair value each subsequent reporting period, an acquirer in preacquisition periods to expense all acquisition-related costs, and noncontrolling interests in subsidiaries initially to be measured at fair value and classified as a separate component of equity. These statements are to be applied prospectively for fiscal years beginning after December 15, 2008, except for the presentation and disclosure requirements of SFAS No. 160 which are retrospective for all periods. We are evaluating SFAS No. 141 (R) and SFAS No. 160 to determine the impact of these statements on our consolidated financial statements.
We adopted SFAS No. 159, The Fair Value Option for Financial Assets and Financial Liabilities—Including an amendment of FASB Statement No. 115, on January 1, 2008. SFAS No. 159 permits companies to choose to measure many financial instruments and certain other items at fair value, with changes in fair value reflected in earnings. We have not elected the fair value option for any existing or any new instruments that were not previously accounted for at fair value.
In September 2006, the FASB issued SFAS No. 158, Employers' Accounting for Defined Benefit Pension and Other Postretirement Plans—an amendment of FASB Statements No. 87, 88, 106, and 132(R). Beginning with our fiscal year ended December 31, 2008, SFAS No. 158 requires that the assumptions used to measure our benefit obligations and annual expense be determined as of the balance sheet date and all plan assets be reported as of that date. Accordingly, our Company and Huntsman International recorded a charge to retained earnings, net of tax, of $3 million and $3 million, respectively, as of January 1, 2008. For more information, see "Note 19. Employee Benefit Plans."
F-27
HUNTSMAN CORPORATION AND SUBSIDIARIES
HUNTSMAN INTERNATIONAL LLC AND SUBSIDIARIES
NOTES TO CONSOLIDATED FINANCIAL STATEMENTS (Continued)
2. SUMMARY OF SIGNIFICANT ACCOUNTING POLICIES (Continued)
We adopted SFAS No. 157, Fair Value Measurements, on January 1, 2008. SFAS No. 157 defines fair value, establishes a framework for measuring fair value and expands disclosures about fair value measurements. This statement is effective for financial statements issued for fiscal years beginning after November 15, 2007, and interim periods within those fiscal years. In February 2008, the FASB issued FSP No. FAS 157-1: Application of FASB Statement No. 157 to FASB Statement No. 13 and Other Accounting Pronouncements That Address Fair Value Measurements for Purposes of Lease Classification or Measurement under Statement 13, which removes certain leasing transactions from the scope of SFAS No. 157, and No. FAS 157-2, Effective Date of FASB Statement No. 157, which delays the effective date of SFAS No. 157 for all nonfinancial assets and nonfinancial liabilities, except those that are recognized or disclosed at fair value in the financial statements on a recurring basis (at least annually), to fiscal years beginning after November 15, 2008 and interim periods within those fiscal years. See "Note 17. Fair Value Measurements."
3. DISCONTINUED OPERATIONS
U.S. BASE CHEMICALS BUSINESS
On November 5, 2007, we completed the U.S. Base Chemicals Disposition. This disposition included our former olefins manufacturing assets located at Port Arthur, Texas. The captive ethylene unit at the retained Port Neches, Texas site of our Performance Products segment operations was not included in the sale. This asset, along with a long-term post-closing arrangement for the supply of ethylene and propylene from Flint Hills Resources to us, will continue to provide feedstock for our downstream derivative units.
The following results of our former U.S base chemicals business have been presented as discontinued operations in the accompanying consolidated statements of operations (dollars in millions):
| |
Year ended December 31, | |||||||||
|---|---|---|---|---|---|---|---|---|---|---|
| |
2008 | 2007 | 2006 | |||||||
Revenues |
$ | — | $ | 181 | $ | 474 | ||||
Costs and expenses |
— | (206 | ) | (463 | ) | |||||
Loss on disposal |
— | (146 | ) | — | ||||||
Adjustment to loss on disposal |
8 | — | — | |||||||
Gain on partial fire insurance settlement |
175 | — | — | |||||||
Operating income (loss) |
183 | (171 | ) | 11 | ||||||
Income tax (expense) benefit |
(68 | ) | 62 | — | ||||||
Income (loss) from discontinued operations, net of tax |
$ | 115 | $ | (109 | ) | $ | 11 | |||
In connection with the U.S. Base Chemicals Disposition, we recognized a pretax loss on disposal of $146 million in 2007, which included a pension curtailment gain of $4 million. During 2008, we recognized an adjustment to the loss on disposal of $8 million related to a sales and use tax settlement, and post-closing adjustments. In addition, during 2008, we recognized a $175 million gain from the
F-28
HUNTSMAN CORPORATION AND SUBSIDIARIES
HUNTSMAN INTERNATIONAL LLC AND SUBSIDIARIES
NOTES TO CONSOLIDATED FINANCIAL STATEMENTS (Continued)
3. DISCONTINUED OPERATIONS (Continued)
partial settlement of insurance claims related to the fire at our former Port Arthur, Texas facility. For more information, see "Note 24. Casualty Losses and Insurance Recoveries."
The EBITDA of our former U.S. base chemicals business is reported in our Base Chemicals segment.
NORTH AMERICAN POLYMERS BUSINESS
On August 1, 2007 we completed the North American Polymers Disposition. The disposition included our former polymers manufacturing assets located at four U.S. sites: Odessa and Longview, Texas; Peru, Illinois; and Marysville, Michigan. In accordance with the amended and restated asset purchase agreement with Flint Hills Resources, we also shut down our Mansonville, Quebec expandable polystyrene manufacturing facility in June 2007.
The following results of our former North American polymers business have been presented as discontinued operations in the accompanying consolidated statements of operations (dollars in millions):
| |
Year ended December 31, | |||||||||
|---|---|---|---|---|---|---|---|---|---|---|
| |
2008 | 2007 | 2006 | |||||||
Revenues |
$ | — | $ | 882 | $ | 1,419 | ||||
Costs and expenses |
— | (873 | ) | (1,342 | ) | |||||
Loss on disposal |
— | (233 | ) | — | ||||||
Adjustment to loss on disposal |
3 | — | — | |||||||
Operating income (loss) |
3 | (224 | ) | 77 | ||||||
Income tax (expense) benefit |
(1 | ) | 78 | (1 | ) | |||||
Income (loss) from discontinued operations, net of tax |
$ | 2 | $ | (146 | ) | $ | 76 | |||
In connection with the North American Polymers Disposition, we recognized a pretax loss on disposal of $233 million in 2007. During 2008, we recorded an adjustment to the loss on disposal in connection with the North American Polymers Disposition of $3 million primarily related to property tax settlements and post-closing adjustments.
The EBITDA of our former North American polymers business is reported in our Polymers segment.
In connection with the U.S. Petrochemicals Disposition, we agreed to indemnify Flint Hills Resources with respect to any losses resulting from (i) the breach of representations and warranties contained in the amended and restated asset purchase agreement, (ii) any pre-sale liabilities related to certain assets not assumed by Flint Hills Resources, and (iii) any unknown environmental liability related to the pre-sale operations of the assets sold. We are not required to pay under these indemnification obligations until claims against us, on a cumulative basis, exceed $10 million. Upon exceeding this $10 million threshold, we generally are obligated to provide indemnification for any losses up to a limit of $150 million. We believe that the possibility that we will be required to pay any significant amounts under the indemnity provision is remote.
F-29
HUNTSMAN CORPORATION AND SUBSIDIARIES
HUNTSMAN INTERNATIONAL LLC AND SUBSIDIARIES
NOTES TO CONSOLIDATED FINANCIAL STATEMENTS (Continued)
3. DISCONTINUED OPERATIONS (Continued)
EUROPEAN BASE CHEMICALS AND POLYMERS BUSINESS
On December 29, 2006, we completed the U.K. Petrochemicals Disposition. This transaction involved the sale of the outstanding equity interests of Huntsman Petrochemicals (UK) Limited. The final sales price was subject to adjustments relating to working capital, investment in the LDPE plant in Wilton, U.K. and unfunded pension liabilities.
The following results of our European base chemicals and polymers business have been presented as discontinued operations in the accompanying consolidated statements of operations (dollars in millions):
Huntsman Corporation
| |
Year ended December 31, |
||||||
|---|---|---|---|---|---|---|---|
| |
2007 | 2006 | |||||
Revenues |
$ | — | $ | 2,524 | |||
Costs and expenses |
— | (2,406 | ) | ||||
Loss on disposal |
— | (302 | ) | ||||
Adjustment to loss on disposal |
39 | — | |||||
Operating income (loss) |
39 | (184 | ) | ||||
Income tax expense |
— | (34 | ) | ||||
Income (loss) from discontinued operations, net of tax |
$ | 39 | $ | (218 | ) | ||
Huntsman International
| |
Year ended December 31, |
||||||
|---|---|---|---|---|---|---|---|
| |
2007 | 2006 | |||||
Revenues |
$ | — | $ | 2,524 | |||
Costs and expenses |
— | (2,406 | ) | ||||
Loss on disposal |
— | (280 | ) | ||||
Adjustment to loss on disposal |
28 | — | |||||
Operating income (loss) |
28 | (162 | ) | ||||
Income tax expense |
— | (34 | ) | ||||
Income (loss) from discontinued operations, net of tax |
$ | 28 | $ | (196 | ) | ||
In connection with the U.K. Petrochemicals Disposition, we and Huntsman International recognized a pretax loss of $302 million and $280 million, respectively, in 2006. During 2007, we and Huntsman International recorded an adjustment to the loss on disposal of $39 million and $28 million, respectively, related primarily to a pension funding accrual and post-closing adjustments.
The EBITDA of our former European base chemicals business is reported in our Base Chemicals segment.
F-30
HUNTSMAN CORPORATION AND SUBSIDIARIES
HUNTSMAN INTERNATIONAL LLC AND SUBSIDIARIES
NOTES TO CONSOLIDATED FINANCIAL STATEMENTS (Continued)
3. DISCONTINUED OPERATIONS (Continued)
In connection with the sale, we agreed to indemnify the buyer with respect to any losses resulting from any environmental liability related to the pre-sale operations of the assets sold. These indemnities have various payment thresholds and time limits depending on the site and type of claim. Generally, we are not required to pay under these indemnification obligations until claims against us exceed £0.1 million (approximately $0.2 million) individually or £1 million (approximately $2 million) in the aggregate. We also agreed to indemnify the buyer with respect to certain tax liabilities. Our maximum exposure generally shall not exceed $600 million in the aggregate. We believe that the possibility that we will be required to pay any significant amounts under any of the indemnity provisions is remote.
TDI BUSINESS
On July 6, 2005, we sold our TDI business. The sale involved the transfer of our TDI customer list and sales contracts. We discontinued the use of our remaining TDI assets. Our former TDI business has been accounted for as a discontinued operation under SFAS No. 144 and is reported in our Polyurethanes segment. Accordingly, the following results of TDI have been presented as discontinued operations in the accompanying consolidated statements of operations (dollars in millions):
| |
Year ended December 31, |
||||||
|---|---|---|---|---|---|---|---|
| |
2007 | 2006 | |||||
Revenues |
$ | — | $ | — | |||
Costs and expenses |
(1 | ) | (2 | ) | |||
Operating loss |
(1 | ) | (2 | ) | |||
Income tax benefit |
— | — | |||||
Loss from discontinued operations, net of tax |
$ | (1 | ) | $ | (2 | ) | |
4. BUSINESS DISPOSITIONS AND COMBINATIONS
SALE OF U.S. BUTADIENE AND MTBE BUSINESS
On June 27, 2006, we sold the assets comprising our U.S. butadiene and MTBE business operated by our Base Chemicals segment and recognized a gain on disposal of $90 million. The total sales price was $274 million, of which $204 million was paid to us during 2006. The additional $70 million was paid to us on November 9, 2007 after the successful restart of our Port Arthur, Texas olefins unit that was damaged in a fire (see "Note 24. Casualty Losses and Insurance Recoveries—Port Arthur, Texas Plant Fire") and the related resumption of crude butadiene supply. We recognized an additional pre-tax gain on the sale of approximately $69 million during 2007, which is included in other operating expense (income) in the accompanying consolidated statement of operations.
The results of operations of this business were not classified as a discontinued operation because of the expected continuing cash flows from the MTBE business we continue to operate in our Polyurethanes segment. The results of our former U.S. butadiene and MTBE business are reported in Corporate and Other.
In connection with the sale, we indemnified the buyer with respect to any losses resulting from (i) the breach of representations and warranties contained in the asset purchase agreement, (ii) pre-sale liabilities related to the pre-sale operations of the assets sold not assumed by the buyer, and
F-31
HUNTSMAN CORPORATION AND SUBSIDIARIES
HUNTSMAN INTERNATIONAL LLC AND SUBSIDIARIES
NOTES TO CONSOLIDATED FINANCIAL STATEMENTS (Continued)
4. BUSINESS DISPOSITIONS AND COMBINATIONS (Continued)
(iii) environmental liability related to the pre-sale operations of the assets sold. We are not required to pay under these indemnification obligations until claims against us exceed $5 million. Upon exceeding this $5 million threshold, we generally are obligated to provide indemnification for any losses in excess of $5 million, up to a limit of $138 million. We believe that there is a remote likelihood that we will be required to pay any significant amounts under the indemnity provision.
TEXTILE EFFECTS ACQUISITION
On June 30, 2006, we acquired Ciba's textile effects business for $172 million (CHF 215 million) in cash in the Textile Effects Acquisition. This purchase price was subject to finalization of post-closing working capital adjustments, which resulted in a reduction to the purchase price of $27 million. The operating results of the textile effects business have been consolidated with our operating results beginning on July 1, 2006 and are reported with our advanced materials operations as part of our Materials and Effects segment.
We have accounted for the Textile Effects Acquisition using the purchase method in accordance with SFAS No. 141, Business Combinations. As such, we analyzed the fair value of tangible and intangible assets acquired and liabilities assumed, and we determined the excess of fair value of net assets acquired over cost. Because the fair value of the acquired assets and liabilities assumed exceeded the acquisition price, the valuation of the long-lived assets acquired was reduced to zero in accordance with SFAS No. 141. Accordingly, no basis was assigned to property, plant and equipment or any other noncurrent non-financial assets and the remaining excess was recorded as an extraordinary gain, net of taxes (which were not applicable because the gain was recorded in purchase accounting). The final
F-32
HUNTSMAN CORPORATION AND SUBSIDIARIES
HUNTSMAN INTERNATIONAL LLC AND SUBSIDIARIES
NOTES TO CONSOLIDATED FINANCIAL STATEMENTS (Continued)
4. BUSINESS DISPOSITIONS AND COMBINATIONS (Continued)
allocation of the purchase price to the assets and liabilities acquired is summarized as follows (dollars in millions):
Acquisition cost: |
|||||
Acquisition payment, exclusive of post-closing working capital adjustment |
$ | 172 | |||
Post-closing working capital adjustment |
(27 | ) | |||
Direct costs of acquisition |
13 | ||||
Total acquisition costs |
158 | ||||
Fair value of assets acquired and liabilities assumed: |
|||||
Cash |
8 | ||||
Accounts receivable |
255 | ||||
Inventories |
233 | ||||
Prepaid expenses and other current assets |
13 | ||||
Noncurrent assets |
2 | ||||
Deferred taxes |
2 | ||||
Accounts payable |
(94 | ) | |||
Accrued liabilities |
(35 | ) | |||
Short-term debt |
(5 | ) | |||
Noncurrent liabilities |
(172 | ) | |||
Total fair value of net assets acquired |
207 | ||||
Extraordinary gain on the acquisition of a business—excess of fair value of net assets acquired over cost |
$ | 49 | |||
During 2006, we recorded an extraordinary gain on the acquisition of $56 million based on the preliminary purchase price allocation. During 2007, we adjusted the preliminary purchase price allocation for, among other things, the finalization of restructuring plans, estimates of asset retirement obligations, the determination of related deferred taxes and finalization of the post-closing working capital adjustments, resulting in a reduction to the extraordinary gain of $7 million. During 2008, we recorded an additional extraordinary gain on the acquisition of $14 million related to the reversal of accruals for certain employee termination costs recorded in connection with the Textile Effects Acquisition and a reimbursement by CIBA of certain restructuring costs associated with the acquisition.
In connection with the Textile Effects Acquisition, we planned to exit certain activities of the textile effects business and expected to involuntarily terminate the employment of, or relocate, certain textile effects employees. We estimated that we will eliminate 700 positions and will create approximately 250 new positions, globally. These plans included the exit of various manufacturing, sales and administrative activities throughout the business through 2009. This purchase price allocation includes recorded liabilities for workforce reductions and other business exit costs of $94 million.
DUPONT FLUOROCHEMICAL ACQUISITION
On July 23, 2007, we acquired DuPont's global fluorochemical business for the nonwovens industry for $8 million in cash. The transaction with DuPont included all existing contracts and business records. All manufacturing assets, cash, accounts receivable, inventory, employees, offices, laboratories and other
F-33
HUNTSMAN CORPORATION AND SUBSIDIARIES
HUNTSMAN INTERNATIONAL LLC AND SUBSIDIARIES
NOTES TO CONSOLIDATED FINANCIAL STATEMENTS (Continued)
4. BUSINESS DISPOSITIONS AND COMBINATIONS (Continued)
assets were specifically excluded from the purchase. The entire value of this acquisition was assigned to intangible assets with useful lives of 15 years.
PENDING METROCHEM ACQUISITION
On June 29, 2007, we signed an agreement to acquire Baroda, a manufacturer of textile dyes and intermediates in India. Under the terms of the agreement, either party may terminate the agreement since the transaction was not consummated by April 30, 2008. As of December 31, 2008, this agreement had not been terminated. On February 6, 2009, we entered into a non-binding agreement in principle with Baroda under which the purchase price, including certain working capital positions, was revised to be approximately $29 million (U.S. dollar equivalents). This purchase price excludes from working capital the receivables existing on the closing date due to Baroda from our affiliates, which will be settled in the ordinary course. We believe that the majority of the purchase price will be funded through local Indian financing. We expect to complete this acquisition during the first half of 2009, subject to certain conditions being met. However, there can be no assurances that this transaction will be consummated or, if consummated, that it will be consummated on the terms set forth above.
5. INVENTORIES
Inventories consisted of the following (dollars in millions):
| |
December 31, | ||||||
|---|---|---|---|---|---|---|---|
| |
2008 | 2007 | |||||
Raw materials and supplies |
$ | 282 | $ | 261 | |||
Work in progress |
88 | 94 | |||||
Finished goods |
1,192 | 1,164 | |||||
Total |
1,562 | 1,519 | |||||
LIFO reserves |
(62 |
) |
(67 |
) |
|||
Net |
$ | 1,500 | $ | 1,452 | |||
As of December 31, 2008 and 2007, approximately 9% of inventories were recorded using the last-in, first-out cost method in each year.
For the years ended December 31, 2007 and 2006, inventory quantities were reduced, resulting in a liquidation of certain LIFO inventory layers carried at costs that were lower than the cost of current purchases, the effect of which reduced cost of sales by approximately $10 million and nil, respectively, of which $9 million and $1 million related to discontinued operations, respectively. During 2008, 2007 and 2006, we recorded charges of $38 million, nil and $4 million, respectively, to write our inventory down to the lower of cost or market.
In the normal course of operations, we at times exchange raw materials and finished goods with other companies for the purpose of reducing transportation costs. The net non-monetary open exchange positions are valued at cost. The amounts included in inventory under non-monetary open exchange agreements payable by us as of December 31, 2008 and 2007 were $19 million and $16 million, respectively. Other open exchanges are settled in cash and result in a net deferred profit
F-34
HUNTSMAN CORPORATION AND SUBSIDIARIES
HUNTSMAN INTERNATIONAL LLC AND SUBSIDIARIES
NOTES TO CONSOLIDATED FINANCIAL STATEMENTS (Continued)
5. INVENTORIES (Continued)
margin. The amounts under these open exchange agreements receivable by us at December 31, 2008 and 2007 were $5 million and $11 million, respectively.
6. PROPERTY, PLANT AND EQUIPMENT
The cost and accumulated depreciation of property, plant and equipment were as follows (dollars in millions):
Huntsman Corporation
| |
December 31, | ||||||
|---|---|---|---|---|---|---|---|
| |
2008 | 2007 | |||||
Land |
$ | 122 | $ | 121 | |||
Buildings |
549 | 524 | |||||
Plant and equipment |
4,993 | 4,926 | |||||
Construction in progress |
440 | 529 | |||||
Total |
6,104 | 6,100 | |||||
Less accumulated depreciation |
(2,455 | ) | (2,337 | ) | |||
Net |
$ | 3,649 | $ | 3,763 | |||
Depreciation expense for the years ended December 31, 2008, 2007 and 2006 was $359 million, $377 million and $430 million, respectively, of which nil, $32 million and $102 million related to discontinued operations, respectively.
Huntsman International
| |
December 31, | ||||||
|---|---|---|---|---|---|---|---|
| |
2008 | 2007 | |||||
Land |
$ | 122 | $ | 121 | |||
Buildings |
549 | 524 | |||||
Plant and equipment |
5,100 | 5,033 | |||||
Construction in progress |
440 | 529 | |||||
Total |
6,211 | 6,207 | |||||
Less accumulated depreciation |
(2,745 | ) | (2,651 | ) | |||
Net |
$ | 3,466 | $ | 3,556 | |||
Depreciation expense for the years ended December 31, 2008, 2007 and 2006 was $334 million, $354 million and $403 million, respectively, of which nil, $32 million and $100 million related to discontinued operations, respectively.
Property, plant and equipment includes gross assets acquired under capital leases of $15 million and $16 million at December 31, 2008 and 2007, respectively; related amounts included in accumulated depreciation were $11 million and $9 million at December 31, 2008 and 2007, respectively.
F-35
HUNTSMAN CORPORATION AND SUBSIDIARIES
HUNTSMAN INTERNATIONAL LLC AND SUBSIDIARIES
NOTES TO CONSOLIDATED FINANCIAL STATEMENTS (Continued)
7. INVESTMENT IN UNCONSOLIDATED AFFILIATES
Our ownership percentage and investment in unconsolidated affiliates were as follows (dollars in millions):
| |
December 31, | ||||||
|---|---|---|---|---|---|---|---|
| |
2008 | 2007 | |||||
Equity Method: |
|||||||
Sasol-Huntsman GmbH and Co. KG (50%) |
$ | 34 | $ | 39 | |||
Arabian Amines Company (50%) |
44 | — | |||||
Louisiana Pigment Company, L.P. (50%) |
110 | 120 | |||||
BASF Huntsman Shanghai Isocyanate Investment BV (50%)(1) |
58 | 52 | |||||
International Polyurethanes Investments (45%) |
15 | 13 | |||||
Others |
1 | 1 | |||||
Total equity method investments |
262 | 225 | |||||
Cost Method: |
|||||||
Gulf Advanced Chemicals Industry Corporation (4.35%) |
5 | 3 | |||||
Total investments |
$ | 267 | $ | 228 | |||
Summarized applicable financial information of our unconsolidated affiliate Sasol-Huntsman GmbH and Co. KG. as of December 31, 2008 and 2007 and for the years ended December 31, 2008, 2007 and 2006 is presented below (dollars in millions):
| |
2008 | 2007 | 2006 | |||||||
|---|---|---|---|---|---|---|---|---|---|---|
Current assets |
$ | 58 | $ | 65 | ||||||
Noncurrent assets |
46 | 43 | ||||||||
Current liabilities |
10 | 11 | ||||||||
Noncurrent liabilities |
2 | 3 | ||||||||
Revenues |
123 | 108 | $ | 91 | ||||||
Gross profit |
23 | 30 | 23 | |||||||
Net income |
13 | 13 | 7 | |||||||
Summarized applicable financial information of our unconsolidated affiliate Huntsman Shanghai Isocyanate Investment BV as of December 31, 2008 and 2007 and for the years ended December 31, 2008, 2007 and 2006 is presented below (dollars in millions):
| |
2008 | 2007 | 2006 | |||||||
|---|---|---|---|---|---|---|---|---|---|---|
Current assets |
$ | 85 | $ | 103 | ||||||
Noncurrent assets |
346 | 349 | ||||||||
Current liabilities |
110 | 48 | ||||||||
Noncurrent liabilities |
154 | 266 | ||||||||
Revenues |
411 | 266 | $ | 69 | ||||||
Gross profit |
43 | 21 | 19 | |||||||
Net income |
13 | 8 | 2 | |||||||
F-36
HUNTSMAN CORPORATION AND SUBSIDIARIES
HUNTSMAN INTERNATIONAL LLC AND SUBSIDIARIES
NOTES TO CONSOLIDATED FINANCIAL STATEMENTS (Continued)
7. INVESTMENT IN UNCONSOLIDATED AFFILIATES (Continued)
Summarized applicable financial information of our unconsolidated affiliates, Louisiana Pigment Company, Arabian Amines Company and International Polyurethanes Investments as of December 31, 2008 and 2007 and for the years ended December 31, 2008, 2007 and 2006 is presented below (dollars in millions):
| |
2008 | 2007 | 2006 | |||||||
|---|---|---|---|---|---|---|---|---|---|---|
Assets |
$ | 448 | $ | 281 | ||||||
Liabilities |
142 | 38 | ||||||||
Revenues |
307 | 273 | $ | 334 | ||||||
Net income |
2 | 1 | — | |||||||
During the year ended December 31, 2008, we contributed $44 million as our 50% equity contribution to our ethyleneamines manufacturing joint venture in Jubail Industrial City, Saudi Arabia with Zamil Group. This joint venture's funding requirements will be satisfied through a combination of debt and equity, with the equity already provided on a 50/50 basis by us and Zamil Group. The joint venture obtained various loan commitments in the aggregate amount of approximately $195 million in U.S. dollar equivalents, of which $45 million was drawn under a short-term bridge loan facility as of December 31, 2008. We have provided certain guarantees of approximately $14 million for these commitments which will terminate upon completion of the project and satisfaction of certain conditions. We have estimated that the fair value of these guarantees was nil as of the closing date of this transaction and, accordingly, no amounts have been recorded. This joint venture is accounted for under the equity method.
8. INTANGIBLE ASSETS
The gross carrying amount and accumulated amortization of intangible assets were as follows (dollars in millions):
Huntsman Corporation
| |
December 31, 2008 | December 31, 2007 | |||||||||||||||||
|---|---|---|---|---|---|---|---|---|---|---|---|---|---|---|---|---|---|---|---|
| |
Carrying Amount |
Accumulated Amortization |
Net | Carrying Amount |
Accumulated Amortization |
Net | |||||||||||||
Patents, trademarks and technology |
$ | 355 | $ | 255 | $ | 100 | $ | 351 | $ | 226 | $ | 125 | |||||||
Licenses and other agreements |
33 | 12 | 21 | 32 | 10 | 22 | |||||||||||||
Non-compete agreements |
19 | 19 | — | 19 | 19 | — | |||||||||||||
Other intangibles |
47 | 15 | 32 | 32 | 6 | 26 | |||||||||||||
Total |
$ | 454 | $ | 301 | $ | 153 | $ | 434 | $ | 261 | $ | 173 | |||||||
During 2008 and 2007, we reversed certain valuation allowances on deferred tax assets related to prior acquisitions and recorded a corresponding reduction to intangible assets of approximately $1 million and $2 million, respectively.
F-37
HUNTSMAN CORPORATION AND SUBSIDIARIES
HUNTSMAN INTERNATIONAL LLC AND SUBSIDIARIES
NOTES TO CONSOLIDATED FINANCIAL STATEMENTS (Continued)
8. INTANGIBLE ASSETS (Continued)
Amortization expense was $27 million, $27 million and $28 million for the years ended December 31, 2008, 2007 and 2006, respectively, of which nil, $1 million and $1 million related to discontinued operations, respectively.
Estimated future amortization expense for intangible assets over the next five years is as follows (dollars in millions):
Year ending December 31:
|
|
|||
|---|---|---|---|---|
2009 |
$ | 27 | ||
2010 |
26 | |||
2011 |
25 | |||
2012 |
20 | |||
2013 |
18 | |||
Huntsman International
| |
December 31, 2008 | December 31, 2007 | |||||||||||||||||
|---|---|---|---|---|---|---|---|---|---|---|---|---|---|---|---|---|---|---|---|
| |
Carrying Amount |
Accumulated Amortization |
Net | Carrying Amount |
Accumulated Amortization |
Net | |||||||||||||
Patents, trademarks and technology |
$ | 355 | $ | 255 | $ | 100 | $ | 351 | $ | 226 | $ | 125 | |||||||
Licenses and other agreements |
33 | 12 | 21 | 32 | 10 | 22 | |||||||||||||
Non-compete agreements |
19 | 19 | — | 19 | 19 | — | |||||||||||||
Other intangibles |
55 | 19 | 36 | 40 | 10 | 30 | |||||||||||||
Total |
$ | 462 | $ | 305 | $ | 157 | $ | 442 | $ | 265 | $ | 177 | |||||||
During 2008 and 2007, we reversed certain valuation allowances on deferred tax assets related to prior acquisitions and recorded a corresponding reduction to intangible assets of approximately $1 million and $2 million, respectively.
Amortization expense for Huntsman International was $28 million, $28 million and $29 million million for the years ended December 31, 2008, 2007 and 2006, respectively, of which nil, $1 million and $1 million related to discontinued operations, respectively.
Huntsman International's estimated future amortization expense for intangible assets over the next five years is as follows (dollars in millions):
Year ending December 31:
|
|
|||
|---|---|---|---|---|
2009 |
$ | 27 | ||
2010 |
27 | |||
2011 |
26 | |||
2012 |
21 | |||
2013 |
18 | |||
F-38
HUNTSMAN CORPORATION AND SUBSIDIARIES
HUNTSMAN INTERNATIONAL LLC AND SUBSIDIARIES
NOTES TO CONSOLIDATED FINANCIAL STATEMENTS (Continued)
9. OTHER NONCURRENT ASSETS
Other noncurrent assets consisted of the following (dollars in millions):
| |
December 31, | ||||||
|---|---|---|---|---|---|---|---|
| |
2008 | 2007 | |||||
Pension assets |
$ | 2 | $ | 173 | |||
Debt issuance costs |
25 | 32 | |||||
Capitalized turnaround costs |
104 | 45 | |||||
Spare parts inventory |
78 | 70 | |||||
Catalyst assets |
25 | 18 | |||||
Deposits |
15 | 16 | |||||
Other noncurrent assets |
115 | 102 | |||||
Total |
$ | 364 | $ | 456 | |||
Amortization expense of catalyst assets for the years ended December 31, 2008, 2007 and 2006 was $12 million, $9 million and $7 million, respectively.
10. ACCRUED LIABILITIES
Accrued liabilities consisted of the following (dollars in millions):
Huntsman Corporation
| |
December 31, | ||||||
|---|---|---|---|---|---|---|---|
| |
2008 | 2007 | |||||
Payroll, severance and related costs |
$ | 101 | $ | 142 | |||
Interest |
42 | 42 | |||||
Volume and rebate accruals |
82 | 89 | |||||
Income taxes |
37 | 23 | |||||
Taxes other than income taxes |
72 | 79 | |||||
Restructuring and plant closing costs |
73 | 76 | |||||
Environmental accruals |
4 | 5 | |||||
Deferred gain on insurance recovery |
— | 137 | |||||
Pension liabilities |
12 | 11 | |||||
Other postretirement benefits |
13 | 14 | |||||
Deferred reimbursement of Merger-related costs |
— | 100 | |||||
Self-insured casualty loss reserves |
21 | 19 | |||||
Other miscellaneous accruals |
160 | 148 | |||||
Total |
$ | 617 | $ | 885 | |||
F-39
HUNTSMAN CORPORATION AND SUBSIDIARIES
HUNTSMAN INTERNATIONAL LLC AND SUBSIDIARIES
NOTES TO CONSOLIDATED FINANCIAL STATEMENTS (Continued)
10. ACCRUED LIABILITIES (Continued)
Huntsman International
| |
December 31, | ||||||
|---|---|---|---|---|---|---|---|
| |
2008 | 2007 | |||||
Payroll, severance and related costs |
$ | 101 | $ | 142 | |||
Interest |
41 | 42 | |||||
Volume and rebate accruals |
82 | 89 | |||||
Income taxes |
22 | 23 | |||||
Taxes other than income taxes |
72 | 79 | |||||
Restructuring and plant closing costs |
73 | 76 | |||||
Environmental accruals |
4 | 5 | |||||
Deferred gain on insurance recovery |
— | 137 | |||||
Pension liabilities |
12 | 11 | |||||
Other postretirement benefits |
13 | 14 | |||||
Self-insured casualty loss reserves |
21 | 19 | |||||
Other miscellaneous accruals |
119 | 144 | |||||
Total |
$ | 560 | $ | 781 | |||
11. RESTRUCTURING, IMPAIRMENT AND PLANT CLOSING COSTS
As of December 31, 2008, 2007 and 2006, accrued restructuring, impairment and plant closing costs by type of cost and initiative consisted of the following (dollars in millions):
| |
Workforce reductions(1) |
Demolition and decommissioning |
Non-cancelable lease costs |
Other restructuring costs |
Total(2) | |||||||||||
|---|---|---|---|---|---|---|---|---|---|---|---|---|---|---|---|---|
Accrued liabilities as of January 1, 2006 |
$ | 54 | $ | 5 | $ | 7 | $ | 12 | $ | 78 | ||||||
Textile Effects opening balance sheet liabilities at June 30, 2006 |
65 | 2 | 3 | 5 | 75 | |||||||||||
2006 charges for 2003 initiatives |
3 | — | — | — | 3 | |||||||||||
2006 charges for 2004 initiatives |
4 | — | — | — | 4 | |||||||||||
2006 charges for 2005 initiatives |
2 | — | — | — | 2 | |||||||||||
2006 charges for 2006 initiatives |
2 | — | — | — | 2 | |||||||||||
Reversal of reserves no longer required and liability reclassifications |
(8 | ) | (2 | ) | (1 | ) | — | (11 | ) | |||||||
Partial reversal of Advanced Materials opening balance sheet liabilities |
(3 | ) | — | — | — | (3 | ) | |||||||||
2006 payments for 2003 initiatives |
(9 | ) | — | — | — | (9 | ) | |||||||||
2006 payments for 2004 initiatives |
(17 | ) | (3 | ) | (1 | ) | — | (21 | ) | |||||||
2006 payments for 2005 initiatives |
(8 | ) | — | — | (1 | ) | (9 | ) | ||||||||
2006 payments for 2006 initiatives |
(1 | ) | — | — | — | (1 | ) | |||||||||
Net activity of discontinued operations |
(12 | ) | (2 | ) | — | — | (14 | ) | ||||||||
Foreign currency effect on reserve balance |
4 | — | 1 | 1 | 6 | |||||||||||
Accrued liabilities as of December 31, 2006 |
76 | — | 9 | 17 | ||||||||||||
F-40
HUNTSMAN CORPORATION AND SUBSIDIARIES
HUNTSMAN INTERNATIONAL LLC AND SUBSIDIARIES
NOTES TO CONSOLIDATED FINANCIAL STATEMENTS (Continued)
11. RESTRUCTURING, IMPAIRMENT AND PLANT CLOSING COSTS (Continued)
| |
Workforce reductions(1) |
Demolition and decommissioning |
Non-cancelable lease costs |
Other restructuring costs |
Total(2) | |||||||||||
|---|---|---|---|---|---|---|---|---|---|---|---|---|---|---|---|---|
| 102 | ||||||||||||||||
Adjustment to Textile Effects opening balance sheet liabilities |
8 | 14 | (2 | ) | (1 | ) | 19 | |||||||||
2007 charges for 2003 initiatives |
1 | — | — | — | 1 | |||||||||||
2007 charges for 2004 initiatives |
4 | — | 1 | — | 5 | |||||||||||
2007 charges for 2007 initiatives |
1 | — | — | 25 | 26 | |||||||||||
Reversal of reserves no longer required |
(4 | ) | — | (1 | ) | — | (5 | ) | ||||||||
2007 payments for 2003 initiatives |
(3 | ) | — | (1 | ) | — | (4 | ) | ||||||||
2007 payments for 2004 initiatives |
(5 | ) | (1 | ) | (1 | ) | — | (7 | ) | |||||||
2007 payments for 2005 initiatives |
(3 | ) | — | — | — | (3 | ) | |||||||||
2007 payments for 2006 initiatives |
(17 | ) | (1 | ) | — | (2 | ) | (20 | ) | |||||||
2007 payments for 2007 initiatives |
(1 | ) | — | — | (25 | ) | (26 | ) | ||||||||
Net activity of discontinued operations |
(1 | ) | — | — | — | (1 | ) | |||||||||
Reimbursable workforce reduction cost |
1 | — | — | — | 1 | |||||||||||
Foreign currency effect on reserve balance |
8 | — | — | — | 8 | |||||||||||
Accrued liabilities as of December 31, 2007 |
65 | 12 | 5 | 14 | 96 | |||||||||||
Adjustment to Textile Effects opening balance sheet liabilities |
(13 | ) | — | (1 | ) | — | (14 | ) | ||||||||
2008 charges for 2004 initiatives |
1 | — | 1 | — | 2 | |||||||||||
2008 charges for 2008 initiatives |
27 | — | — | 1 | 28 | |||||||||||
Reversal of reserves no longer required |
(1 | ) | — | — | — | (1 | ) | |||||||||
2008 payments for 2003 initiatives |
(2 | ) | — | (1 | ) | — | (3 | ) | ||||||||
2008 payments for 2004 initiatives |
(3 | ) | — | (1 | ) | — | (4 | ) | ||||||||
2008 payments for 2006 initiatives |
(19 | ) | (11 | ) | — | (1 | ) | (31 | ) | |||||||
2008 payments for 2008 initiatives |
(3 | ) | — | — | (1 | ) | (4 | ) | ||||||||
Net activity of discontinued operations |
(1 | ) | — | — | — | (1 | ) | |||||||||
Foreign currency effect on reserve balance |
7 | — | — | — | 7 | |||||||||||
Accrued liabilities as of December 31, 2008 |
$ | 58 | $ | 1 | $ | 3 | $ | 13 | $ | 75 | ||||||
| |
December 31, 2008 |
December 31, 2007 |
|||||
|---|---|---|---|---|---|---|---|
2003 initiatives & prior |
$ | 9 | $ | 12 | |||
2004 initiatives |
6 | 10 | |||||
2006 initiatives |
26 | 71 | |||||
2008 initiatives |
24 | — | |||||
Foreign currency effect on reserve balance |
10 | 3 | |||||
Total |
$ | 75 | $ | 96 | |||
F-41
HUNTSMAN CORPORATION AND SUBSIDIARIES
HUNTSMAN INTERNATIONAL LLC AND SUBSIDIARIES
NOTES TO CONSOLIDATED FINANCIAL STATEMENTS (Continued)
11. RESTRUCTURING, IMPAIRMENT AND PLANT CLOSING COSTS (Continued)
Details with respect to our reserves for restructuring, impairment and plant closing costs are provided below by segment and initiative (dollars in millions):
| |
Polyurethanes | Materials and Effects |
Performance Products |
Pigments | Discontinued Operations |
Corporate & Other |
Total | |||||||||||||||
|---|---|---|---|---|---|---|---|---|---|---|---|---|---|---|---|---|---|---|---|---|---|---|
Accrued liabilities as of January 1, 2006 |
$ | 11 | $ | 8 | $ | 26 | $ | 16 | $ | 16 | $ | 1 | $ | 78 | ||||||||
Textile Effects opening balance sheet liabilities at June 30, 2006 |
— | 75 | — | — | — | — | 75 | |||||||||||||||
2006 charges for 2003 initiatives |
— | — | — | 3 | — | — | 3 | |||||||||||||||
2006 charges for 2004 initiatives |
— | — | 1 | 3 | — | — | 4 | |||||||||||||||
2006 charges for 2005 initiatives |
— | — | 1 | — | — | 1 | 2 | |||||||||||||||
2006 charges for 2006 initiatives |
— | 2 | — | — | — | — | 2 | |||||||||||||||
Reversal of reserves no longer required |
(1 | ) | (1 | ) | (7 | ) | (2 | ) | — | — | (11 | ) | ||||||||||
Partial reversal of Advanced Materials opening balance sheet liabilities |
— | (3 | ) | — | — | — | — | (3 | ) | |||||||||||||
2006 payments for 2003 initiatives |
(3 | ) | (2 | ) | — | (4 | ) | — | — | (9 | ) | |||||||||||
2006 payments for 2004 initiatives |
— | (1 | ) | (12 | ) | (8 | ) | — | — | (21 | ) | |||||||||||
2006 payments for 2005 initiatives |
(1 | ) | (1 | ) | (4 | ) | (1 | ) | — | (2 | ) | (9 | ) | |||||||||
2006 payments for 2006 initiatives |
— | (1 | ) | — | — | — | — | (1 | ) | |||||||||||||
Net activity of discontinued operations |
— | — | — | — | (14 | ) | — | (14 | ) | |||||||||||||
Foreign currency effect on reserve balance |
1 | 2 | 2 | 1 | — | — | 6 | |||||||||||||||
Accrued liabilities as of December 31, 2006 |
7 |
78 |
7 |
8 |
2 |
— |
102 |
|||||||||||||||
Adjustment to Textile Effects opening balance sheet liabilities |
— | 19 | — | — | — | — | 19 | |||||||||||||||
2007 charges for 2003 initiatives |
— | — | — | 1 | — | — | 1 | |||||||||||||||
2007 charges for 2004 initiatives |
— | — | — | 5 | — | — | 5 | |||||||||||||||
2007 charges for 2007 initiatives |
— | 26 | — | — | — | — | 26 | |||||||||||||||
Reversal of reserves no longer required |
— | (2 | ) | — | (3 | ) | — | — | (5 | ) | ||||||||||||
2007 payments for 2003 initiatives |
(2 | ) | — | — | (2 | ) | — | — | (4 | ) | ||||||||||||
2007 payments for 2004 initiatives |
(1 | ) | — | (4 | ) | (2 | ) | — | — | (7 | ) | |||||||||||
2007 payments for 2005 initiatives |
(1 | ) | — | (2 | ) | — | — | — | (3 | ) | ||||||||||||
2007 payments for 2006 initiatives |
— | (20 | ) | — | — | — | — | (20 | ) | |||||||||||||
2007 payments for 2007 initiatives |
— | (26 | ) | — | — | — | — | (26 | ) | |||||||||||||
Net activity of discontinued operations |
— | — | — | — | (1 | ) | — | (1 | ) | |||||||||||||
Reimburable workforce reduction cost |
— | — | — | 1 | — | — | 1 | |||||||||||||||
Foreign currency effect on reserve balance |
1 | 6 | 1 | — | — | — | 8 | |||||||||||||||
Accrued liabilities as of December 31, 2007 |
4 |
81 |
2 |
8 |
1 |
— |
96 |
|||||||||||||||
Adjustment to Textile Effects opening balance sheet liabilities |
— | (14 | ) | — | — | — | — | (14 | ) | |||||||||||||
2008 charges for 2004 initiatives |
— | — | — | 2 | — | — | 2 | |||||||||||||||
2008 charges for 2008 initiatives |
— | 24 | — | 3 | — | 1 | 28 | |||||||||||||||
Reversal of reserves no longer required |
— | — | — | (1 | ) | — | — | (1 | ) | |||||||||||||
2008 payments for 2003 initiatives |
(1 | ) | (1 | ) | — | (1 | ) | — | — | (3 | ) | |||||||||||
2008 payments for 2004 initiatives |
— | — | (1 | ) | (3 | ) | — | — | (4 | ) | ||||||||||||
2008 payments for 2006 initiatives |
— | (31 | ) | — | — | — | — | (31 | ) | |||||||||||||
2008 payments for 2008 initiatives |
— | (3 | ) | — | — | — | (1 | ) | (4 | ) | ||||||||||||
Net activity of discontinued operations |
— | — | — | — | (1 | ) | — | (1 | ) | |||||||||||||
Foreign currency effect on reserve balance |
— | 8 | — | (1 | ) | — | — | 7 | ||||||||||||||
Accrued liabilities as of December 31, 2008 |
$ | 3 | $ | 64 | $ | 1 | $ | 7 | $ | — | $ | — | $ | 75 | ||||||||
Current portion of restructuring reserve |
$ |
2 |
$ |
64 |
$ |
1 |
$ |
6 |
$ |
— |
$ |
— |
$ |
73 |
||||||||
Long-term portion of restructuring reserve |
1 | — | — | 1 | — | — | 2 | |||||||||||||||
F-42
HUNTSMAN CORPORATION AND SUBSIDIARIES
HUNTSMAN INTERNATIONAL LLC AND SUBSIDIARIES
NOTES TO CONSOLIDATED FINANCIAL STATEMENTS (Continued)
11. RESTRUCTURING, IMPAIRMENT AND PLANT CLOSING COSTS (Continued)
Details with respect to cash and non-cash restructuring charges for the years ended December 31, 2008, 2007 and 2006 by initiative are provided below (dollars in millions):
Cash charges: |
|||||
2008 charges for 2004 initiatives |
$ | 2 | |||
2008 charges for 2008 initiatives |
28 | ||||
Reversal of reserves no longer required |
(1 | ) | |||
Non-cash charges |
7 | ||||
Total 2008 Restructuring, Impairment and Plant Closing Costs |
$ | 36 | |||
Cash charges: |
|||||
2007 charges for 2003 initiatives |
$ | 1 | |||
2007 charges for 2004 initiatives |
5 | ||||
2007 charges for 2007 initiatives |
26 | ||||
Reversal of reserves no longer required |
(5 | ) | |||
Non-cash charges |
15 | ||||
Total 2007 Restructuring, Impairment and Plant Closing Costs |
$ | 42 | |||
Cash charges: |
|||||
2006 charges for 2003 initiatives |
$ | 3 | |||
2006 charges for 2004 initiatives |
4 | ||||
2006 charges for 2005 initiatives |
2 | ||||
2006 charges for 2006 initiatives |
2 | ||||
Reversal of reserves no longer required |
(5 | ) | |||
Non-cash charges |
9 | ||||
Total 2006 Restructuring, Impairment and Plant Closing Costs |
$ | 15 | |||
2008 RESTRUCTURING ACTIVITIES
As of December 31, 2008, our Polyurethanes segment restructuring reserve consisted of $3 million related to restructuring initiatives at our Rozenburg, Netherlands site (as announced in 2003).
As of December 31, 2008, our Materials and Effects segment restructuring reserve consisted of $64 million, of which $40 million related to opening balance sheet liabilities from the Textile Effects Acquisition and $23 million related to our 2008 restructuring initiatives with textile effects. During 2008, our Materials and Effects segment recorded cash charges for 2008 initiatives of $24 million primarily related to the streamlining of the textile effects business into two global strategic business units, apparel & home textiles and specialty textiles, as announced during the fourth quarter of 2008. We also reversed accruals of $14 million for certain employee termination costs recorded in connection with the Textile Effects Acquisition. During 2008, we recorded a non-cash impairment charge of $1 million related to our Deer Park, Australia and Germany fixed assets.
F-43
HUNTSMAN CORPORATION AND SUBSIDIARIES
HUNTSMAN INTERNATIONAL LLC AND SUBSIDIARIES
NOTES TO CONSOLIDATED FINANCIAL STATEMENTS (Continued)
11. RESTRUCTURING, IMPAIRMENT AND PLANT CLOSING COSTS (Continued)
As of December 31, 2008, our Performance Products segment reserve consisted of $1 million related to various restructuring programs across our European surfactants business. During 2008, we recorded a non-cash charge of $1 million related to the closure of our Guelph, Canada plant.
As of December 31, 2008, our Pigments segment reserve consisted of $7 million related to the restructuring of commercial and business support activities and workforce reductions in connection with our Huelva, Spain operations. During 2008, our Pigments segment recorded charges of $5 million related to the restructuring of commercial and business support activities.
During 2008, we recorded a non-cash impairment charge of $5 million in Corporate and Other primarily related to capital expenditures and turnaround costs associated with our Australian styrenics business that was previously impaired. The long-lived assets of our Australian styrenics business were determined to be impaired in accordance with SFAS No. 144 and an impairment charge was recorded in 2005. Capital expenditures and turnaround costs in this business, which are necessary to maintain operations, are also considered to be impaired immediately after they are incurred. Management has evaluated the strategic and operational initiatives related to this business, and based upon the renegotiation of certain raw material supply agreements, has concluded that we will continue the operations of this business.
2007 RESTRUCTURING ACTIVITIES
As of December 31, 2007, our Polyurethanes segment restructuring reserve consisted of $4 million related to restructuring initiatives at our Rozenburg, Netherlands site (as announced in 2003).
As of December 31, 2007, our Materials and Effects segment restructuring reserve consisted of $81 million primarily relating to opening balance sheet liabilities from the Textile Effects Acquisition. During 2007, our Materials and Effects segment recorded cash charges for 2007 initiatives of $20 million related to redundant service contracts and integration costs for information technology services and $4 million related to supply chain integration processes.
As of December 31, 2007, our Performance Products segment reserve consisted of $2 million related to various restructuring programs across our European surfactants business.
As of December 31, 2007, our Pigments segment reserve consisted of $8 million related to the reorganization of business support activities following the reduction of our TiO2 production capacity announced in 2004 and workforce reductions in connection with our Huelva, Spain operations.
During 2007, we recorded a non-cash impairment charge of $13 million in Corporate and Other related to capital expenditures and turnaround costs associated with our Australian styrenics business that was previously impaired.
2006 RESTRUCTURING ACTIVITIES
As of December 31, 2006, our Polyurethanes segment restructuring reserve consisted of $7 million related to restructuring initiatives at the Rozenburg, Netherlands site (as announced in 2003).
As of December 31, 2006, our Materials and Effects segment restructuring reserve consisted of $78 million related to opening balance sheet liabilities from the Textile Effects Acquisition, the
F-44
HUNTSMAN CORPORATION AND SUBSIDIARIES
HUNTSMAN INTERNATIONAL LLC AND SUBSIDIARIES
NOTES TO CONSOLIDATED FINANCIAL STATEMENTS (Continued)
11. RESTRUCTURING, IMPAIRMENT AND PLANT CLOSING COSTS (Continued)
restructuring programs implemented in association with the 2003 acquisition of our advanced materials business and the realignment and simplification of the commercial and technical organization. During 2006, we recorded $75 million of liabilities for workforce reduction, non-cancelable lease termination costs and demolition and decommissioning costs related to the Textile Effects Acquisition. In addition, our Materials and Effects segment reversed $3 million of reserves established in connection with the acquisition of our advanced materials business. This reserve reversal was recorded as a reduction to property, plant and equipment in accordance with EITF 95-3, Recognition of Liabilities in Connection with a Purchase Business Combination.
As of December 31, 2006, our Performance Products segment reserve consisted of $7 million related to various restructuring programs across our European surfactants business and the realignment of our Jefferson County, Texas operations. During 2006, $6 million was reclassified to pension liabilities.
As of December 31, 2006, our Pigments segment reserve consisted of $8 million related to the global workforce reductions announced in 2003, and the reduction of our TiO2 production capacity announced in 2004. The reversal of workforce reduction reserves recorded by our Pigments segment during 2006 relates primarily to the project announced in July 2005 that our Pigments and Base Chemicals segments would establish a single U.K. headquarters in Teesside, U.K., which was abandoned in connection with the sale of our European base chemicals and polymers business.
During 2006, we recorded non-cash impairment charges in Corporate and Other of $8 million related to capital expenditures and turnaround costs associated with our Australian styrenics business that was previously impaired.
12. ASSET RETIREMENT OBLIGATIONS
Asset retirement obligations consist primarily of landfill capping, closure and post-closure costs and asbestos abatement costs. We are legally required to perform capping and closure and post-closure care on the landfills and asbestos abatement on certain of our premises. In accordance with SFAS No. 143 and FIN 47, for each asset retirement obligation we recognized the estimated fair value of a liability and capitalized the cost as part of the cost basis of the related asset.
F-45
HUNTSMAN CORPORATION AND SUBSIDIARIES
HUNTSMAN INTERNATIONAL LLC AND SUBSIDIARIES
NOTES TO CONSOLIDATED FINANCIAL STATEMENTS (Continued)
12. ASSET RETIREMENT OBLIGATIONS (Continued)
The following table describes changes to our asset retirement obligation liability (dollars in millions):
| |
December 31, | ||||||
|---|---|---|---|---|---|---|---|
| |
2008 | 2007 | |||||
Asset retirement obligation at beginning of year |
$ | 19 | $ | 18 | |||
Accretion expense |
2 | 2 | |||||
Revisions in timing and estimated cash flows |
1 | — | |||||
Liabilities relieved(1) |
— | (2 | ) | ||||
Foreign currency effect on reserve balance |
(2 | ) | 1 | ||||
Asset retirement obligation at end of year |
$ | 20 | $ | 19 | |||
Amounts included in accrued liabilities |
$ | 1 | $ | 1 | |||
Amounts included in other noncurrent liabilities |
19 | 18 | |||||
Total asset retirement obligations |
$ | 20 | $ | 19 | |||
13. OTHER NONCURRENT LIABILITIES
Other noncurrent liabilities consisted of the following (dollars in millions):
Huntsman Corporation
| |
December 31, | ||||||
|---|---|---|---|---|---|---|---|
| |
2008 | 2007 | |||||
Pension liabilities |
$ | 713 | $ | 287 | |||
Other postretirement benefits |
136 | 134 | |||||
Environmental accruals |
3 | 3 | |||||
Restructuring and plant closing costs |
2 | 20 | |||||
Asset retirement obligations |
19 | 18 | |||||
Other noncurrent liabilities |
148 | 217 | |||||
Total |
$ | 1,021 | $ | 679 | |||
F-46
HUNTSMAN CORPORATION AND SUBSIDIARIES
HUNTSMAN INTERNATIONAL LLC AND SUBSIDIARIES
NOTES TO CONSOLIDATED FINANCIAL STATEMENTS (Continued)
13. OTHER NONCURRENT LIABILITIES (Continued)
Huntsman International
| |
December 31, | ||||||
|---|---|---|---|---|---|---|---|
| |
2008 | 2007 | |||||
Pension liabilities |
$ | 713 | $ | 287 | |||
Other postretirement benefits |
136 | 134 | |||||
Environmental accruals |
3 | 3 | |||||
Restructuring and plant closing costs |
2 | 20 | |||||
Asset retirement obligations |
19 | 18 | |||||
Other noncurrent liabilities |
148 | 215 | |||||
Total |
$ | 1,021 | $ | 677 | |||
14. DEBT
Outstanding debt consisted of the following (dollars in millions):
HUNTSMAN CORPORATION
| |
December 31, | |||||||
|---|---|---|---|---|---|---|---|---|
| |
2008 | 2007 | ||||||
Senior Credit Facilities: |
||||||||
Term Loans |
$ | 1,540 | $ | 1,540 | ||||
Secured Notes |
295 | 294 | ||||||
Senior Notes |
198 | 198 | ||||||
Subordinated Notes |
1,285 | 1,311 | ||||||
Australian Credit Facilities |
41 | 50 | ||||||
HPS (China) debt |
196 | 107 | ||||||
Other |
92 | 69 | ||||||
Convertible Notes |
235 | — | ||||||
Total debt |
$ | 3,882 | $ | 3,569 | ||||
Current portion |
$ | 205 | $ | 69 | ||||
Long-term portion |
3,677 | 3,500 | ||||||
Total debt |
$ | 3,882 | $ | 3,569 | ||||
F-47
HUNTSMAN CORPORATION AND SUBSIDIARIES
HUNTSMAN INTERNATIONAL LLC AND SUBSIDIARIES
NOTES TO CONSOLIDATED FINANCIAL STATEMENTS (Continued)
14. DEBT (Continued)
HUNTSMAN INTERNATIONAL
| |
December 31, | |||||||
|---|---|---|---|---|---|---|---|---|
| |
2008 | 2007 | ||||||
Senior Credit Facilities: |
||||||||
Term Loans |
$ | 1,540 | $ | 1,540 | ||||
Secured Notes |
295 | 294 | ||||||
Senior Notes |
198 | 198 | ||||||
Subordinated Notes |
1,285 | 1,311 | ||||||
Australian Credit Facilities |
41 | 50 | ||||||
HPS (China) debt |
196 | 107 | ||||||
Other |
92 | 69 | ||||||
Total debt—excluding affiliates |
$ | 3,647 | $ | 3,569 | ||||
Current portion |
$ | 205 | $ | 69 | ||||
Long-term portion |
3,442 | 3,500 | ||||||
Total debt—excluding affiliates |
$ | 3,647 | $ | 3,569 | ||||
Total debt—excluding affiliates |
$ | 3,647 | $ | 3,569 | ||||
Notes payable to affiliates |
429 | 5 | ||||||
Total debt |
$ | 4,076 | $ | 3,574 | ||||
SUBSIDIARY DEBT
With the exception of our Convertible Notes, our guarantees of certain debt of HPS and SLIC, our Chinese MDI joint ventures, our Saudi Arabia joint venture, and certain indebtedness incurred from time to time to finance certain insurance premiums, we have no direct debt or guarantee obligations. Substantially all of our other debt has been incurred by our subsidiaries (primarily Huntsman International); such subsidiary debt is nonrecourse to us and we have no contractual obligation to fund our subsidiaries' respective operations.
Senior Credit Facilities
As of December 31, 2008, our Senior Credit Facilities consisted of our (i) $650 million Revolving Facility and (ii) $1,540 million Dollar Term Loan. As of December 31, 2008, there were no borrowings outstanding under the Revolving Facility, and we had $32 million in U.S. dollar equivalents of letters of credit and bank guarantees issued and outstanding under the Revolving Facility. The Revolving Facility matures in August 2010 and the Dollar Term Loan matures in 2014; provided, however, that the maturities of the Revolving Facility and the Dollar Term Loan will accelerate if we do not repay or refinance all but $100 million of our outstanding debt securities on or before three months prior to the maturity dates of such debt securities (the next maturity date of such debt securities is October 15, 2010).
At the present time, borrowings under the Revolving Facility and the Dollar Term Loan bear interest at LIBOR plus 1.75%. However, the applicable interest rate of the Dollar Term Loan is subject to a reduction to LIBOR plus 1.50% upon achieving certain secured leverage ratio thresholds. The
F-48
HUNTSMAN CORPORATION AND SUBSIDIARIES
HUNTSMAN INTERNATIONAL LLC AND SUBSIDIARIES
NOTES TO CONSOLIDATED FINANCIAL STATEMENTS (Continued)
14. DEBT (Continued)
agreements governing our Secured Credit Facilities contain one financial covenant, which is applicable only to the Revolving Facility, and this covenant is only in effect when loans or letters of credit are outstanding under the Revolving Facility. In addition, the applicable agreements provide for customary restrictions and limitations on our ability to incur liens, incur additional debt, merge or sell assets, make certain restricted payments, prepay other indebtedness, make investments or engage in transactions with affiliates, and also contain other customary default provisions.
As of December 31, 2008, the weighted average interest rate on the Senior Credit Facilities was approximately 2.3%. Our obligations under the Senior Credit Facilities are guaranteed by our guarantor subsidiaries, which consist of substantially all of our domestic subsidiaries and certain of our foreign subsidiaries and are secured by a first priority lien (generally shared with the holders of the 2010 Secured Notes on substantially all of our domestic property, plant and equipment, the stock of all of or our material domestic subsidiaries and certain foreign subsidiaries and pledges of intercompany notes between various of our subsidiaries.
On November 14, 2007, in connection with the U.S. Base Chemicals Disposition, we used a portion of the proceeds to make a repayment of $100 million on the Dollar Term Loan. Substantially all of the remaining proceeds were used to repay borrowings under the Revolving Facility and reduce amounts under the A/R Securitization Program.
On April 19, 2007, we entered into an amendment to our Senior Credit Facilities. Pursuant to this amendment, the maturity of the Dollar Term Loan was extended to April 2014 and the loan amount was increased to $1,640 million. We used the increased amount to repay, in full, our previously outstanding Euro Term Loan.
On January 16, 2007, we made a voluntary repayment of $75 million U.S. dollar equivalents on our term loan B facility ($71 million on the Dollar Term Loan and €3 million on the Euro Term Loan) with available liquidity.
Secured Notes
As of December 31, 2008, we had outstanding $296 million aggregate principal amount ($295 million book value and $455 million original aggregate principal amount) under our 11.625% senior secured notes due October 15, 2010. The 2010 Secured Notes are currently redeemable at 102.906% of the principal amount plus accrued interest, declining to par on and after October 15, 2009. Interest on the 2010 Secured Notes is payable semiannually in April and October of each year. The 2010 Secured Notes are secured by a first priority lien on all collateral securing the Senior Credit Facilities as described above (other than capital stock of Huntsman International's first-tier foreign subsidiaries), shared equally with the lenders on the Senior Credit Facilities, subject to certain inter-creditor arrangements. The 2010 Secured Notes contain covenants relating to the incurrence of debt and limitations on distributions, certain restricted payments, asset sales and affiliate transactions and are guaranteed by the Guarantors. The indentures governing the 2010 Secured Notes also contain provisions requiring us to offer to repurchase the notes upon a change of control.
Senior Notes
As of December 31, 2008, we had outstanding $198 million ($300 million original aggregate principal amount) of 11.5% senior notes due 2012. Interest on the 2012 Senior Notes is payable
F-49
HUNTSMAN CORPORATION AND SUBSIDIARIES
HUNTSMAN INTERNATIONAL LLC AND SUBSIDIARIES
NOTES TO CONSOLIDATED FINANCIAL STATEMENTS (Continued)
14. DEBT (Continued)
semiannually in January and July of each year. The 2012 Senior Notes are currently redeemable at 105.75% of the principal amount plus accrued interest, declining ratably to par on and after July 15, 2010. The 2012 Senior Notes are unsecured obligations. The indentures governing our 2012 Senior Notes contain covenants, among other things, relating to the incurrence of debt and limitations on distributions and certain restricted payments, asset sales and affiliate transactions and are guaranteed by the Guarantors. The indentures governing the 2012 Senior Notes contain provisions requiring us to offer to repurchase the notes upon a change of control.
Subordinated Notes
As of December 31, 2008, we had outstanding $175 million 7.375% senior subordinated notes due 2015 and €135 million (approximately $191 million) 7.5% senior subordinated notes due 2015. The 2015 Subordinated Notes are redeemable on or after January 1, 2010 at 103.688% and 103.750%, respectively, of the principal amount plus accrued interest, declining ratably to par on and after January 1, 2013.
As of December 31, 2008, we had outstanding €400 million (approximately $567 million) 6.875% senior subordinated notes due 2013 and $347 million aggregate principal amount ($352 million book value) under our 7.875% senior subordinated notes due 2014. The 2013 Subordinated Notes are redeemable on or after November 15, 2009 at 105.156% of the principal amount plus accrued interest, declining ratably to par on or after November 15, 2012. The 2014 Subordinated Notes are redeemable on or after November 15, 2010 at 103.938% of the principal amount plus accrued interest, declining ratably to par on or after November 15, 2012.
Interest on the 2015 Subordinated Notes is payable semiannually in January and July of each year. Interest on the 2013 Subordinated Notes and the 2014 Subordinated Notes is payable semiannually in November and May of each year. All of our subordinated notes are unsecured. The indentures governing our subordinated notes contain covenants relating, among other things, to the incurrence of debt and limitations on distributions, certain restricted payments, asset sales and affiliate transactions. Our subordinated notes are guaranteed by the Guarantors. The indentures also contain provisions requiring us to offer to repurchase the notes upon a change of control.
On February 22, 2007, we closed on a direct private placement of $147 million (included within the total outstanding principal amount of $347 million of 2014 Subordinated Notes) in aggregate principal amount of the 2014 Subordinated Notes. These notes were issued at a premium of 104% of principal amount for a yield of 7.01%. We used the net proceeds of $152 million to redeem all (approximately €114 million) of our remaining outstanding euro denominated 10.125% senior subordinated notes due 2009, which were called for redemption on March 27, 2007 at a call price of 101.688% plus accrued interest.
Convertible Notes
Pursuant to the Settlement Agreement, on December 23, 2008, we issued $250 million in Convertible Notes (recorded at $235 million fair value). The Convertible Notes are convertible at any time, at the option of the holder, at an initial conversion rate of 127.275 shares of our common stock per $1,000 principal amount of Convertible Notes (which is equal to an initial conversion price of $7.857 per share), subject to specified anti-dilution adjustments. The Convertible Notes bear interest at
F-50
HUNTSMAN CORPORATION AND SUBSIDIARIES
HUNTSMAN INTERNATIONAL LLC AND SUBSIDIARIES
NOTES TO CONSOLIDATED FINANCIAL STATEMENTS (Continued)
14. DEBT (Continued)
the rate of 7% per year payable semi-annually on January 1 and July 1 of each year, beginning on July 1, 2009. Interest is payable either in cash or, at our option, in shares of our common stock having a market value at that time equal to the interest payment. The Convertible Notes are our senior unsecured obligations and are not guaranteed by any of our subsidiaries, including Huntsman International.
The Convertible Notes will mature on December 23, 2018. At maturity, we may, at our option, pay the principal amount of the Convertible Notes in shares of our common stock having a market value at that time equal to the principal amount of the Convertible Notes, plus an amount equal to the underwriting spread of a nationally-recognized underwriter chosen by us that would be paid by a seller of the shares at such time.
We may redeem the Convertible Notes in whole, for cash, at the principal amount of the Convertible Notes plus accrued and unpaid interest, at any time on or after December 23, 2011 if the closing price of our common stock, for at least 20 consecutive trading days prior to the notice of redemption, exceeds 135% of the conversion price in effect at that time.
Upon the occurrence of certain change of control events, the holders of the Convertible Notes may require us to redeem all or any portion of the holders' Convertible Notes at the principal amount plus accrued and unpaid interest.
Other Debt
We maintain a $25 million European Overdraft Facility that is a demand facility used for the working capital needs for our European subsidiaries. As of December 31, 2008 and December 31, 2007, we had $16 million and $15 million U.S. dollar equivalents, respectively, in borrowings outstanding under the European Overdraft Facility. We also maintain other foreign overdraft facilities used for working capital needs.
HPS obtained secured loans for the construction of its MDI production facility. This debt consists of various committed loans. As of December 31, 2008, HPS had $25 million outstanding in U.S. dollar borrowings and 672 million in RMB borrowings (approximately $98 million) under these facilities. The interest rate on these facilities is LIBOR plus 0.48% for U.S. dollar borrowings and 90% of the Peoples Bank of China rate for RMB borrowings. As of December 31, 2008, the interest rate was approximately 3.1% for U.S. dollar borrowings and 6.5% for RMB borrowings. The loans are secured by substantially all the assets of HPS and will be repaid in 16 semiannual installments (which began on June 30, 2007). We have guaranteed 70% of any amount due and unpaid by HPS under the loans described above (except for the VAT facility, which is not guaranteed). Our guarantees remain in effect until HPS has met certain conditions. The conditions outstanding include completion of the building and equipment mortgage registrations, which are progressing as planned, and maintaining a debt service coverage ratio of at least 1.5:1 at the time such registrations are completed. Our Chinese MDI joint ventures are unrestricted subsidiaries under the Senior Credit Facilities and under the indentures governing our outstanding notes.
On October 22, 2008, HPS entered into a loan facility for the purpose of discounting commercial drafts with recourse. The facility has a stated capacity discounting up to CNY500 million (approximately $73 million) and drafts are discounted using a discount rate of the three-month SIBOR plus 4.2%. As of December 31, 2008 the all-in discount rate was 6.39%. As of December 31, 2008, HPS
F-51
HUNTSMAN CORPORATION AND SUBSIDIARIES
HUNTSMAN INTERNATIONAL LLC AND SUBSIDIARIES
NOTES TO CONSOLIDATED FINANCIAL STATEMENTS (Continued)
14. DEBT (Continued)
has discounted with recourse CNY500 million (approximately $73 million) of commercial drafts. While the facility has a maturity of July 24, 2009, the lender has right to accept or reject drafts presented for discounting.
Our Australian subsidiaries maintain credit facilities that had an aggregate outstanding balance of A$59 million (approximately $41 million) as of December 31, 2008 ($30 million of which is classified as current portion of long-term debt). These facilities are nonrecourse to Huntsman International and bear interest at the Australian index rate plus a margin of 2.4%. As of December 31, 2008, the interest rate for these facilities was 7.0%. The Australian credit facilities mature in May 2010.
We finance certain insurance premiums and, as of December 31, 2008 and 2007, we had outstanding notes payable in the amount of $23 million and $27 million, respectively. Insurance premium financings are generally secured by the unearned premiums under such policies.
On June 30, 2008, our subsidiary, Huntsman (UK) Limited, entered into the Short Term Revolving Facility, a $125 million short term committed revolving credit facility maturing on June 28, 2009. In connection with an amendment to the A/R Securitization Program on November 13, 2008, we terminated the short term committed revolving credit facility of our subsidiary, Huntsman (UK) Limited, of which nothing was drawn. See "Note 16. Securitization of Accounts Receivable."
Notes Payable from Huntsman International to Huntsman Corporation
Under an existing promissory note, as of December 31, 2008 we lent $423 million to our subsidiary, Huntsman International, which funds were used by Huntsman International to repay borrowings outstanding under the Revolving Facility. This demand note is unsecured and is classified as current on the accompanying consolidated balance sheets. As of December 31, 2008, under the terms of the note, Huntsman International promises to pay us interest on the unpaid principal amount thereof in like money at a rate per annum not to exceed 25 basis points (0.25%) less than the then current revolving loan U.S. LIBOR-based borrowing as defined by the Revolving Facility. On January 6, 2009, the interest rate was amended to a rate per annum based on the previous monthly average borrowing rate obtained under our A/R Securitization Program for U.S. dollar outstandings less 10 basis points. Notwithstanding the foregoing, the rate shall not exceed an amount that is 25 basis points less than the monthly average borrowing rate obtained for the U.S. LIBOR-based borrowings under the Revolving Facility. With our consent, the principal and accrued interest outstanding under this note may also be forgiven or capitalized or satisfied with any alternate form of consideration.
COMPLIANCE WITH COVENANTS
Our management believes that we are in compliance with the covenants contained in the agreements governing our debt instruments, including our Senior Credit Facilities, our A/R Securitization Program and the indentures governing our notes.
We have only one financial covenant under our Senior Credit Facilities, which applies to our $650 million Revolving Facility. At any time loans or letters of credit are outstanding under our Revolving Facility, the Leverage Covenant requires that Huntsman International maintain a net secured debt to EBITDA ratio of 3.75 to 1 (as defined in the applicable agreement, the "Secured Leverage Ratio").
F-52
HUNTSMAN CORPORATION AND SUBSIDIARIES
HUNTSMAN INTERNATIONAL LLC AND SUBSIDIARIES
NOTES TO CONSOLIDATED FINANCIAL STATEMENTS (Continued)
14. DEBT (Continued)
If in the future we were not able to meet the Secured Leverage Ratio, unless we obtained an amendment or waiver (as to which we can provide no assurance), then, for so long as we did not meet the Secured Leverage Ratio, we would not have access to the liquidity otherwise available under our Revolving Facility. If we failed to meet the Secured Leverage Ratio at a time when we had loans or letters of credit outstanding under the Revolving Facility, we would be in default under our Senior Credit Facilities, and, unless we obtained a waiver or forbearance with respect to such default (as to which we can provide no assurance), we would be required to pay off the balance of our Senior Credit Facilities in full and would not have further access to such facilities.
The agreements governing our $575 million A/R Securitization Program also contain certain financial covenants. Any material failure to meet the A/R Securitization Program covenants in the future could lead to an event of default under the A/R Securitization Program, which could require us to cease our use of such facility. Under these circumstances, unless any default was remedied or waived, we would likely lose the ability to obtain financing with respect to our trade receivables. A material default under the A/R Securitization Program would also constitute an event of default under our Senior Credit Facilities, which could require us to pay off the balance of the Senior Credit Facilities in full and could result in the loss of our Senior Credit Facilities.
MATURITIES
The scheduled maturities of our debt by year as of December 31, 2008 are as follows (dollars in millions):
HUNTSMAN CORPORATION
Year ending December 31:
|
|
|||
|---|---|---|---|---|
2009 |
$ | 205 | ||
2010 |
364 | |||
2011 |
49 | |||
2012 |
228 | |||
2013 |
597 | |||
Thereafter |
2,439 | |||
|
$ | 3,882 | ||
HUNTSMAN INTERNATIONAL
Year ending December 31:
|
|
|||
|---|---|---|---|---|
2009 |
$ | 628 | ||
2010 |
364 | |||
2011 |
49 | |||
2012 |
228 | |||
2013 |
597 | |||
Thereafter |
2,210 | |||
|
$ | 4,076 | ||
F-53
HUNTSMAN CORPORATION AND SUBSIDIARIES
HUNTSMAN INTERNATIONAL LLC AND SUBSIDIARIES
NOTES TO CONSOLIDATED FINANCIAL STATEMENTS (Continued)
14. DEBT (Continued)
We also have lease obligations accounted for as capital leases which are included in other long-term debt. The scheduled maturities of our commitments under capital leases are as follows (dollars in millions):
Year ending December 31:
|
|
||||
|---|---|---|---|---|---|
2009 |
$ | 4 | |||
2010 |
2 | ||||
Total minimum payments |
6 | ||||
Less: Amounts representing interest |
(1 | ) | |||
Present value of minimum lease payments |
5 | ||||
Less: Current portion of capital leases |
(3 | ) | |||
Long-term portion of capital leases |
$ | 2 | |||
15. DERIVATIVE INSTRUMENTS AND HEDGING ACTIVITIES
We are exposed to market risks, such as changes in interest rates, foreign exchange rates and commodity pricing risks. From time to time, we enter into transactions, including transactions involving derivative instruments, to manage certain of these exposures.
All derivatives, whether designated in hedging relationships or not, are recorded on our balance sheet at fair value. If the derivative is designated as a fair value hedge, the changes in the fair value of the derivative and the hedged items are recognized in earnings. If the derivative is designated as a cash flow hedge, changes in the fair value of the derivative are recorded in accumulated other comprehensive (loss) income, to the extent effective, and will be recognized in the income statement when the hedged item affects earnings. To the extent applicable, we perform effectiveness assessments in order to use hedge accounting at each reporting period. For a derivative that does not qualify as a hedge, changes in fair value are recognized in earnings.
We also hedge our net investment in certain European operations. Changes in the fair value of the hedge in the net investment of certain European operations are recorded in accumulated other comprehensive (loss) income.
INTEREST RATE RISKS
Through our borrowing activities, we are exposed to interest rate risk. Such risk arises due to the structure of our debt portfolio, including the duration of the portfolio and the mix of fixed and floating interest rates. Actions taken to reduce interest rate risk include managing the mix and rate characteristics of various interest bearing liabilities, as well as entering into interest rate derivative instruments.
From time to time, we may purchase interest rate swaps and/or interest rate collars to reduce the impact of changes in interest rates on our floating-rate long-term debt. Under interest rate swaps, we agree with other parties to exchange, at specified intervals, the difference between fixed-rate and floating-rate interest amounts calculated by reference to an agreed notional principal amount. The collars entitle us to receive from the counterparties (major banks) the amounts, if any, by which our interest payments on certain of our floating-rate borrowings exceed a certain rate, and require us to
F-54
HUNTSMAN CORPORATION AND SUBSIDIARIES
HUNTSMAN INTERNATIONAL LLC AND SUBSIDIARIES
NOTES TO CONSOLIDATED FINANCIAL STATEMENTS (Continued)
15. DERIVATIVE INSTRUMENTS AND HEDGING ACTIVITIES (Continued)
pay to the counterparties (major banks) the amount, if any, by which our interest payments on certain of our floating-rate borrowings are less than a certain rate.
Interest rate contracts were recorded as a component of other noncurrent liabilities as of December 31, 2008 and 2007. The effective portion of the changes in the fair value of the swaps were recorded in accumulated other comprehensive (loss) income, with any ineffectiveness recorded in interest expense. As of December 31, 2008 and 2007, the fair value of these contracts was not significant. As of December 31, 2008 and 2007, the contracts had a notional amount of $13 million and $14 million, respectively, and a maturity date of 2010, each.
For the years ended December 31, 2008 and 2007, the changes in accumulated other comprehensive (loss) income associated with cash flow hedging activities were not considered significant.
On July 2, 2007, we let expire an interest rate contract of notional amount of $60 million pursuant to which we had swapped LIBOR interest for a fixed rate of 4.315%.
During 2009, interest expense of approximately nil is expected to be reclassified to earnings. The actual amount that will be reclassified to earnings over the next twelve months may vary from this amount due to changing market conditions. We are exposed to credit losses in the event of nonperformance by a counterparty to the derivative financial instruments. We anticipate, however, that the counterparties will be able to fully satisfy obligations under the contracts. Market risk arises from changes in interest rates.
FOREIGN EXCHANGE RATE RISK
Our cash flows and earnings are subject to fluctuations due to exchange rate variation. Our revenues and expenses are denominated in various currencies. From time to time, we may enter into foreign currency derivative instruments to minimize the short-term impact of movements in foreign currency rates. Where practicable, we generally net multicurrency cash balances among our subsidiaries to help reduce exposure to foreign currency exchange rates. Certain other exposures may be managed from time to time through financial market transactions, principally through the purchase of spot or forward foreign exchange contracts (generally with maturities of one year or less). We do not hedge our currency exposures in a manner that would eliminate the effect of changes in exchange rates on our cash flows and earnings. Our A/R Securitization Program in certain circumstances requires that we enter into forward foreign currency hedges intended to hedge currency exposures. As of December 31, 2008 and December 31, 2007, we had no forward currency hedges outstanding.
On January 15, 2008, we entered into a series of forward foreign currency contracts in our Pigments segment to partially hedge the impact, for up to one year, of movements in foreign currency rates associated with the purchases of raw materials and sales of pigment in non-functional currencies. As of December 31, 2008, these contracts had a notional amount of approximately $9 million and were designated as cash flow hedges. As of December 31, 2008, the fair value of these contracts was not considered significant. For the year ended December 31, 2008, the effective portion of the changes in the fair value was not significant with ineffectiveness of $1 million recorded as a decrease in sales, $1 million recorded as a reduction in cost of sales and a foreign currency loss of $1 million.
F-55
HUNTSMAN CORPORATION AND SUBSIDIARIES
HUNTSMAN INTERNATIONAL LLC AND SUBSIDIARIES
NOTES TO CONSOLIDATED FINANCIAL STATEMENTS (Continued)
15. DERIVATIVE INSTRUMENTS AND HEDGING ACTIVITIES (Continued)
On October 24, 2008, we unwound a cross currency interest rate swap pursuant to which we had swapped $153 million of LIBOR floating rate debt payments for €116 million of EURIBOR floating rate debt payments. This swap was not designated as a hedge for financial reporting purposes. For the years ended December 31, 2008 and 2007, we recorded a foreign currency gain (loss) on this swap of $21 million and ($17) million, respectively, in the consolidated statement of operations.
On October 24, 2008, we unwound a cross currency interest rate swap pursuant to which we had swapped $96 million of LIBOR floating rate debt payments for €71 million of EURIBOR floating rate debt payments. This swap was designated as a hedge of a net investment for financial reporting purposes. We received a cash benefit from the unwind of $3 million in the fourth quarter of 2008. For the years ended December 31, 2008 and 2007, the effective portion of the changes in the fair value of $14 million and ($8) million, respectively, was recorded as income (loss) in other comprehensive (loss) income, with ineffectiveness of $2 million and nil, respectively, recorded in interest expense in our consolidated statement of operations.
On July 12, 2007, we unwound a cross currency interest rate swap pursuant to which we had swapped $31 million of 11.0% fixed rate debt for €25 million of 9.4% fixed rate debt. The swap was not designated as a hedge for financial reporting purposes. We recorded an unrealized foreign currency loss on this swap of $2 million and $3 million, respectively, in our consolidated statements of operations for the years ended December 31, 2007 and 2006.
A significant portion of our debt is denominated in euros. We also finance certain of our non-U.S. subsidiaries with intercompany loans that are, in many cases, denominated in currencies other than the entities' functional currency. We manage the net foreign currency exposure created by this debt through various means, including cross-currency swaps, the designation of certain intercompany loans as permanent loans because they are not expected to be repaid in the foreseeable future ("permanent loans") and the designation of certain debt and swaps as net investment hedges.
Foreign currency transaction gains and losses on intercompany loans that are not designated as permanent loans are recorded in earnings. Foreign currency transaction gains and losses on intercompany loans that are designated as permanent loans are recorded in other comprehensive income. From time to time, we review such designation of intercompany loans.
From time to time, we review our non-U.S. dollar denominated debt and swaps to determine the appropriate amounts designated as hedges. As of December 31, 2008, we have designated approximately €205 million of euro-denominated debt as a hedge of our net investments. As of December 31, 2008, we had approximately €961 million in net euro assets.
COMMODITY PRICES RISK
Our exposure to changing commodity prices is somewhat limited since the majority of our raw materials are acquired at posted or market related prices, and sales prices for many of our finished products are at market related prices which are largely set on a monthly or quarterly basis in line with industry practice. Consequently, we do not generally hedge our commodity exposures.
F-56
HUNTSMAN CORPORATION AND SUBSIDIARIES
HUNTSMAN INTERNATIONAL LLC AND SUBSIDIARIES
NOTES TO CONSOLIDATED FINANCIAL STATEMENTS (Continued)
16. SECURITIZATION OF ACCOUNTS RECEIVABLE
Under our A/R Securitization Program, we grant an undivided interest in certain of our trade receivables to a qualified off-balance sheet entity at a discount. This undivided interest serves as security for the issuance by the Receivables Trust of commercial paper. The A/R Securitization Program currently provides for financing through a commercial paper conduit program (in both U.S. dollars and euros). We account for the transfer of our receivables as a sale in accordance with SFAS No. 140. On November 13, 2008, we completed an amendment and expansion of our A/R Securitization Program. In connection with this amendment and expansion, among other things, the amendment (1) added two of our subsidiaries as receivables originators under the program, (2) increased the size of the program to an aggregate currency equivalent of approximately $575 million U.S. dollars from $500 million, (3) added two new financial institutions as funding agents for their related commercial paper conduits and liquidity providers, and (4) extended the term of the program through November 12, 2009. As a result of the amendment, the Receivable Trust has commercial paper conduit financing available at an interest rate equal to commercial paper cost of funds plus 150 basis points per annum.
As of December 31, 2008, the Receivables Trust had $446 million in U.S. dollar equivalents in commercial paper outstanding (consisting of $175 million and approximately €191 million ($271 million)) and held $25 million of cash collateral that was used subsequent to year-end to redeem outstanding commercial paper.
As of December 31, 2008 and 2007, the fair value of our retained interest in receivables (including servicing assets) subject to the program was approximately $147 million and $136 million, respectively. Our retained interest is reported in accounts and notes receivable in the consolidated balance sheet. The value of the retained interest is subject to credit and interest rate risk. For the years ended December 31, 2008, 2007 and 2006, new sales of accounts receivable under the program totaled approximately $5,187 million, $5,466 million and $7,492 million, respectively, and cash collections from receivables under the program that were reinvested totaled approximately $5,117 million, $5,580 million and $7,395 million, respectively. Servicing fees received during the years ended December 31, 2008, 2007 and 2006 were approximately $7 million, $7 million and $8 million, respectively.
We incur losses on the A/R Securitization Program for the discount on receivables under the program and fees and expenses associated with the program. For the years ended December 31, 2008, 2007 and 2006, losses on the A/R Securitization Program were $27 million, $21 million and $13 million, respectively. We also retain responsibility for the economic gains and losses on forward contracts mandated by the terms of the program to hedge the currency exposures on the collateral supporting the off-balance sheet debt issued. Gains and losses on forward contracts included as a component of the loss on the A/R Securitization Program were not significant for the years ended December 31, 2008, 2007 and 2006. For each of the years ending December 31, 2008 and 2007, the fair value of the open forward currency contracts was nil.
F-57
HUNTSMAN CORPORATION AND SUBSIDIARIES
HUNTSMAN INTERNATIONAL LLC AND SUBSIDIARIES
NOTES TO CONSOLIDATED FINANCIAL STATEMENTS (Continued)
16. SECURITIZATION OF ACCOUNTS RECEIVABLE (Continued)
The key economic assumptions used in valuing the residual interest are presented below:
| |
December 31, | ||||||
|---|---|---|---|---|---|---|---|
| |
2008 | 2007 | |||||
Weighted average life (in days) |
38-46 | 38-43 | |||||
Credit losses (annual rate) |
Less than 1 | % | Less than 1 | % | |||
Discount rate (weighted average life) |
Less than 1 | % | Less than 1 | % | |||
A 10% and 20% adverse change in any of the key economic assumptions would not have a material impact on the fair value of the retained interest. Total receivables over 60 days past due as of December 31, 2008 and 2007 were $21 million and $20 million, respectively.
17. FAIR VALUE MEASUREMENTS
We adopted SFAS No. 157 on January 1, 2008. SFAS No. 157 defines fair value, establishes a framework for measuring fair value, and expands disclosures about fair value measurements. In February 2008, the FASB issued FSP No. FAS 157-1 and FAS 157-2, which delays the effective date of SFAS No. 157 for all non-financial assets and non-financial liabilities, except those that are recognized or disclosed at fair value in the financial statements on a recurring basis (at least annually), to fiscal years beginning after November 15, 2008, and interim periods within those fiscal years and removes certain leasing transactions from the scope of SFAS No. 157. Assets and liabilities that we record at fair value and that are currently subject to SFAS No. 157 include our derivative instruments, available-for-sale securities, retained interests in securitized receivables and our Convertible Notes.
The following assets and liabilities are measured at fair value on a recurring basis (dollars in millions):
| |
|
Fair Value Amounts Using | |||||||||||
|---|---|---|---|---|---|---|---|---|---|---|---|---|---|
Description
|
December 31, 2008 |
Quoted prices in active markets for identical assets (Level 1) |
Significant other observable inputs (Level 2) |
Significant unobservable inputs (Level 3) |
|||||||||
Assets: |
|||||||||||||
Available-for-sale securities(1) |
$ | 10 | $ | 10 | $ | — | $ | — | |||||
Retained interest in securitized receivables(2) |
147 | — | — | 147 | |||||||||
Total assets |
$ | 157 | $ | 10 | $ | — | $ | 147 | |||||
Liabilities: |
|||||||||||||
Derivatives(3) |
$ | (1 | ) | $ | — | $ | (1 | ) | $ | — | |||
F-58
HUNTSMAN CORPORATION AND SUBSIDIARIES
HUNTSMAN INTERNATIONAL LLC AND SUBSIDIARIES
NOTES TO CONSOLIDATED FINANCIAL STATEMENTS (Continued)
17. FAIR VALUE MEASUREMENTS (Continued)
The following table shows a reconciliation of beginning and ending balances for assets measured at fair value on a recurring basis using significant unobservable inputs (Level 3) (dollars in millions):
Fair Value Measurements Using Level 3 Inputs
|
Year ended December 31, 2008 |
|||
|---|---|---|---|---|
Balance at beginning of period |
$ | 136 | ||
Total net losses (realized/unrealized) included in earnings |
(40 | ) | ||
Purchases, issuances and settlements |
51 | |||
Balance at end of period |
$ | 147 | ||
The amount of total losses for the period included in earnings attributable to the changes in unrealized gains or losses relating to assets still held at December 31, 2008 |
$ |
(16 |
) |
|
Gains and losses (realized and unrealized) included in earnings (or changes in net assets) for the year ended December 31, 2008 are reported in loss on accounts receivable securitization program and other income (expense) as follows (dollars in millions):
| |
|
Other income (expense) | |||||
|---|---|---|---|---|---|---|---|
| |
Loss on accounts receivable securitization program | ||||||
| |
December 31, 2008 | ||||||
| |
December 31, 2008 | ||||||
Total net losses included in earnings (or changes in net assets) |
$ | (31 | ) | $ | (9 | ) | |
Changes in unrealized losses relating to assets still held at December 31, 2008 |
$ | (7 | ) | $ | (9 | ) | |
The following liabilities were measured at fair value upon initial recognition (dollars in millions):
| |
|
Fair Value Amounts Using | |||||||||||
|---|---|---|---|---|---|---|---|---|---|---|---|---|---|
Description
|
December 31, 2008 | Quoted prices in active markets for identical assets (Level 1) |
Significant other observable inputs (Level 2) |
Significant unobservable inputs (Level 3) |
|||||||||
Liabilities: |
|||||||||||||
Convertible Notes(4) |
$ | (235 | ) | $ | — | $ | — | $ | (235 | ) | |||
F-59
HUNTSMAN CORPORATION AND SUBSIDIARIES
HUNTSMAN INTERNATIONAL LLC AND SUBSIDIARIES
NOTES TO CONSOLIDATED FINANCIAL STATEMENTS (Continued)
17. FAIR VALUE MEASUREMENTS (Continued)
best estimates of key assumptions including relevant interest rates, expected share volatility, dividend yields and the probabilities associated with certain features of the Convertible Notes. We also used the market approach to assess comparables and corroborate the fair value determined using the income approach.
18. FAIR VALUE OF FINANCIAL INSTRUMENTS
Huntsman Corporation
| |
December 31, | ||||||||||||
|---|---|---|---|---|---|---|---|---|---|---|---|---|---|
| |
2008 | 2007 | |||||||||||
| |
Carrying Amount |
Estimated Fair Value |
Carrying Amount |
Estimated Fair Value |
|||||||||
| |
(Dollars in millions) |
||||||||||||
Non-qualifed employee benefit plan investments |
$ | 10 | $ | 10 | $ | 13 | $ | 13 | |||||
Government securities |
— | — | 4 | 4 | |||||||||
Long-term debt (including current portion) |
3,882 | 2,537 | 3,569 | 3,637 | |||||||||
Huntsman International
| |
December 31, | ||||||||||||
|---|---|---|---|---|---|---|---|---|---|---|---|---|---|
| |
2008 | 2007 | |||||||||||
| |
Carrying Amount |
Estimated Fair Value |
Carrying Amount |
Estimated Fair Value |
|||||||||
| |
(Dollars in millions) |
||||||||||||
Non-qualifed employee benefit plan investments |
$ | 10 | $ | 10 | $ | 13 | $ | 13 | |||||
Long-term debt (including current portion) |
3,647 | 2,302 | 3,569 | 3,637 | |||||||||
The carrying amount reported in the balance sheets for cash and cash equivalents, accounts receivable and accounts payable approximates fair value because of the immediate or short-term maturity of these financial instruments. The fair value of government securities and non-qualified employee benefit plan investments are estimated using prevailing market prices. With the exception of our Convertible Notes, which were recorded at fair value based on the present value of estimated future cash flows, our long-term debt was recorded at cost. The estimated fair values of our long-term debt other than the Convertible Notes are based on quoted market prices or on interest rates that are currently available to us for issuance of debt with similar terms and remaining maturities for debt issues not quoted on an exchange.
The fair value estimates presented herein are based on pertinent information available to management as of December 31, 2008 and 2007. Although management is not aware of any factors that would significantly affect the estimated fair value amounts, such amounts have not been comprehensively revalued for purposes of these financial statements since December 31, 2008, and current estimates of fair value may differ significantly from the amounts presented herein.
F-60
HUNTSMAN CORPORATION AND SUBSIDIARIES
HUNTSMAN INTERNATIONAL LLC AND SUBSIDIARIES
NOTES TO CONSOLIDATED FINANCIAL STATEMENTS (Continued)
19. EMPLOYEE BENEFIT PLANS
DEFINED BENEFIT AND OTHER POSTRETIREMENT BENEFIT PLANS
Our employees participate in a trusteed, non-contributory defined benefit pension plan (the "Plan") that covers substantially all of our full-time U.S. employees. Effective July 1, 2004, the Plan formula for employees not covered by a collective bargaining agreement was converted to a cash balance design. For represented employees, participation in the cash balance design is subject to the terms of negotiated contracts. For participating employees, benefits accrued under the prior formula were converted to opening cash balance accounts. The new cash balance benefit formula provides annual pay credits from 4% to 12% of eligible pay, depending on age and service, plus accrued interest. Participants in the plan on July 1, 2004 may be eligible for additional annual pay credits from 1% to 8%, depending on their age and service as of that date, for up to five years. The conversion to the cash balance plan did not have a significant impact on the accrued benefit liability, the funded status or ongoing pension expense.
We sponsor defined benefit plans in a number of countries outside of the U.S. The availability of these plans, and their specific design provisions, are consistent with local competitive practices and regulations.
We also sponsor two unfunded postretirement benefit plans other than pensions, which provide medical and life insurance benefits.
Our postretirement benefit plans provide a fully insured Medicare Part D plan including prescription drug benefits affected by the Medicare Prescription Drug, Improvement and Modernization Act of 2003 (the "Act"). We cannot determine whether the medical benefits provided by our postretirement benefit plans are actuarially equivalent to those provided by the Act. We do not collect a subsidy and our net periodic postretirement benefits cost, and related benefit obligation, do not reflect an amount associated with the subsidy.
In September 2006, the FASB issued SFAS No. 158, Employers' Accounting for Defined Benefit Pension and Other Postretirement Plans—an amendment of FASB Statements No. 87, 88, 106, and 132(R). SFAS No. 158 requires us to recognize the overfunded or underfunded status of our defined benefit postretirement plan(s) (other than multiemployer plans) as an asset or liability in our statement of financial position and to recognize changes in the funded status in the year in which the changes occur through comprehensive income. We adopted certain provisions of SFAS No. 158 on January 1, 2008. Beginning with our fiscal year ended December 31, 2008, SFAS No. 158 requires that the assumptions used to measure our benefit obligations and annual expenses be determined as of the balance sheet date and all plan assets be reported as of that date. We used the second approach as described in paragraph 19 of SFAS No. 158 to transition our measurement date from November 30 to December 31. Under this approach, we recorded a charge to beginning retained earnings, net of tax, of $3 million, as of January 1, 2008.
F-61
HUNTSMAN CORPORATION AND SUBSIDIARIES
HUNTSMAN INTERNATIONAL LLC AND SUBSIDIARIES
NOTES TO CONSOLIDATED FINANCIAL STATEMENTS (Continued)
19. EMPLOYEE BENEFIT PLANS (Continued)
The following table sets forth the funded status of the plans and the amounts recognized in the consolidated balance sheets at December 31, 2008 and 2007 (dollars in millions):
| |
Defined Benefit Plans | Other Postretirement Benefit Plans | ||||||||||||||||||||||||
|---|---|---|---|---|---|---|---|---|---|---|---|---|---|---|---|---|---|---|---|---|---|---|---|---|---|---|
| |
2008 | 2007 | 2008 | 2007 | ||||||||||||||||||||||
| |
U.S. Plans | Non-U.S. Plans |
U.S. Plans | Non-U.S. Plans |
U.S. Plans | Non-U.S. Plans |
U.S. Plans | Non-U.S. Plans |
||||||||||||||||||
Change in benefit obligation |
||||||||||||||||||||||||||
Benefit obligation at beginning of year |
$ | 660 | $ | 2,257 | $ | 663 | $ | 2,585 | $ | 144 | $ | 5 | $ | 171 | $ | 5 | ||||||||||
Elimination of early measurement date |
1 | 8 | — | — | — | — | — | — | ||||||||||||||||||
Service cost |
24 | 50 | 30 | 50 | 3 | — | 4 | — | ||||||||||||||||||
Interest cost |
40 | 113 | 40 | 113 | 8 | — | 9 | — | ||||||||||||||||||
Participant contributions |
— | 12 | — | 13 | 3 | — | — | — | ||||||||||||||||||
Plan amendments |
— | 1 | — | (3 | ) | — | — | — | — | |||||||||||||||||
Divestitures/acquisitions |
— | — | — | (4 | ) | — | — | — | — | |||||||||||||||||
Exchange rate changes |
— | (257 | ) | — | 144 | — | (1 | ) | — | 1 | ||||||||||||||||
Settlements/transfers |
— | (35 | ) | — | (339 | ) | — | — | — | — | ||||||||||||||||
Other |
— | (2 | ) | 4 | (2 | ) | — | — | — | — | ||||||||||||||||
Curtailments |
— | — | (1 | ) | — | — | — | (9 | ) | — | ||||||||||||||||
Special termination benefits |
— | 1 | — | — | — | — | — | — | ||||||||||||||||||
Actuarial (gain)/loss |
(16 | ) | (47 | ) | (17 | ) | (215 | ) | 5 | — | (17 | ) | — | |||||||||||||
Benefits paid |
(55 | ) | (92 | ) | (59 | ) | (85 | ) | (17 | ) | (1 | ) | (14 | ) | (1 | ) | ||||||||||
Benefit obligation at end of year |
$ | 654 | $ | 2,009 | $ | 660 | $ | 2,257 | $ | 146 | $ | 3 | $ | 144 | $ | 5 | ||||||||||
Change in plan assets |
||||||||||||||||||||||||||
Fair value of plan assets at beginning of year |
$ | 519 | $ | 2,230 | $ | 490 | $ | 2,271 | $ | — | $ | — | $ | — | $ | — | ||||||||||
Elimination of early measurement date |
7 | 42 | — | — | — | — | — | — | ||||||||||||||||||
Actual return on plan assets |
(159 | ) | (415 | ) | 29 | 143 | — | — | — | — | ||||||||||||||||
Exchange rate changes |
— | (210 | ) | — | 136 | — | — | — | — | |||||||||||||||||
Participant contributions |
— | 12 | — | 13 | 3 | — | — | — | ||||||||||||||||||
Other |
— | (1 | ) | — | (1 | ) | — | — | — | — | ||||||||||||||||
Administrative expenses |
— | (1 | ) | — | — | — | — | — | — | |||||||||||||||||
Company contributions |
36 | 62 | 59 | 93 | 14 | 1 | 14 | 1 | ||||||||||||||||||
Settlements/transfers |
— | (35 | ) | — | (340 | ) | — | — | — | — | ||||||||||||||||
Benefits paid |
(55 | ) | (92 | ) | (59 | ) | (85 | ) | (17 | ) | (1 | ) | (14 | ) | (1 | ) | ||||||||||
Fair value of plan assets at end of year |
$ | 348 | $ | 1,592 | $ | 519 | $ | 2,230 | $ | — | $ | — | $ | — | $ | — | ||||||||||
Funded status |
||||||||||||||||||||||||||
Fair value of plan assets |
$ | 348 | $ | 1,592 | $ | 519 | $ | 2,230 | $ | — | $ | — | $ | — | $ | — | ||||||||||
Benefit obligation |
654 | 2,009 | 660 | 2,257 | 146 | 3 | 144 | 5 | ||||||||||||||||||
Funded status |
(306 | ) | (417 | ) | (141 | ) | (27 | ) | (146 | ) | (3 | ) | (144 | ) | (5 | ) | ||||||||||
Contributions paid December 1 through December 31 |
— | — | 8 | 35 | — | — | 1 | — | ||||||||||||||||||
Accrued benefit cost |
$ | (306 | ) | $ | (417 | ) | $ | (133 | ) | $ | 8 | $ | (146 | ) | $ | (3 | ) | $ | (143 | ) | $ | (5 | ) | |||
Amounts recognized in balance sheet: |
||||||||||||||||||||||||||
Noncurrent asset |
$ | — | $ | 2 | $ | 2 | $ | 171 | $ | — | $ | — | $ | — | $ | — | ||||||||||
Current liability |
(5 | ) | (7 | ) | (5 | ) | (6 | ) | (13 | ) | — | (13 | ) | (1 | ) | |||||||||||
Noncurrent liability |
(301 | ) | (412 | ) | (130 | ) | (157 | ) | (133 | ) | (3 | ) | (130 | ) | (4 | ) | ||||||||||
|
$ | (306 | ) | $ | (417 | ) | $ | (133 | ) | $ | 8 | $ | (146 | ) | $ | (3 | ) | $ | (143 | ) | $ | (5 | ) | |||
F-62
HUNTSMAN CORPORATION AND SUBSIDIARIES
HUNTSMAN INTERNATIONAL LLC AND SUBSIDIARIES
NOTES TO CONSOLIDATED FINANCIAL STATEMENTS (Continued)
19. EMPLOYEE BENEFIT PLANS (Continued)
Huntsman Corporation
| |
Defined Benefit Plans | Other Postretirement Benefit Plans | |||||||||||||||||||||||
|---|---|---|---|---|---|---|---|---|---|---|---|---|---|---|---|---|---|---|---|---|---|---|---|---|---|
| |
2008 | 2007 | 2008 | 2007 | |||||||||||||||||||||
| |
U.S. Plans | Non-U.S. Plans |
U.S. Plans | Non-U.S. Plans |
U.S. Plans | Non-U.S. Plans |
U.S. Plans | Non-U.S. Plans |
|||||||||||||||||
Amounts recognized in accumulated other comprehensive (loss) income: |
|||||||||||||||||||||||||
Net actuarial loss |
$ | 292 | $ | 592 | $ | 112 | $ | 76 | $ | 37 | $ | 1 | $ | 33 | $ | 1 | |||||||||
Prior service cost |
(36 | ) | (2 | ) | (41 | ) | (5 | ) | (15 | ) | — | (17 | ) | — | |||||||||||
Transition obligation |
1 | 1 | 2 | 1 | — | — | — | — | |||||||||||||||||
|
$ | 257 | $ | 591 | $ | 73 | $ | 72 | $ | 22 | $ | 1 | $ | 16 | $ | 1 | |||||||||
Huntsman International
| |
Defined Benefit Plans | Other Postretirement Benefit Plans | |||||||||||||||||||||||
|---|---|---|---|---|---|---|---|---|---|---|---|---|---|---|---|---|---|---|---|---|---|---|---|---|---|
| |
2008 | 2007 | 2008 | 2007 | |||||||||||||||||||||
| |
U.S. Plans | Non-U.S. Plans |
U.S. Plans | Non-U.S. Plans |
U.S. Plans | Non-U.S. Plans |
U.S. Plans | Non-U.S. Plans |
|||||||||||||||||
Amounts recognized in accumulated other comprehensive (loss) income: |
|||||||||||||||||||||||||
Net actuarial loss |
$ | 295 | $ | 682 | $ | 115 | $ | 172 | $ | 37 | $ | 1 | $ | 33 | $ | 1 | |||||||||
Prior service cost |
(36 | ) | (2 | ) | (41 | ) | (5 | ) | (15 | ) | — | (17 | ) | — | |||||||||||
Transition obligation |
1 | 1 | 2 | 1 | — | — | — | — | |||||||||||||||||
|
$ | 260 | $ | 681 | $ | 76 | $ | 168 | $ | 22 | $ | 1 | $ | 16 | $ | 1 | |||||||||
The amounts in accumulated other comprehensive (loss) income that are expected to be recognized as components of net periodic benefit cost during the next fiscal year are as follows (dollars in millions):
Huntsman Corporation
| |
Defined Benefit Plans | Other Postretirement Benefit Plans |
|||||||||||
|---|---|---|---|---|---|---|---|---|---|---|---|---|---|
| |
U.S. Plans | Non-U.S. Plans | U.S. Plans | Non-U.S. Plans | |||||||||
Actuarial loss |
$ | 7 | $ | 29 | $ | 2 | $ | — | |||||
Prior service cost |
(5 | ) | (2 | ) | (2 | ) | — | ||||||
Transition obligation |
— | 1 | — | — | |||||||||
Total |
$ | 2 | $ | 28 | $ | — | $ | — | |||||
F-63
HUNTSMAN CORPORATION AND SUBSIDIARIES
HUNTSMAN INTERNATIONAL LLC AND SUBSIDIARIES
NOTES TO CONSOLIDATED FINANCIAL STATEMENTS (Continued)
19. EMPLOYEE BENEFIT PLANS (Continued)
Huntsman International
| |
Defined Benefit Plans | Other Postretirement Benefit Plans |
|||||||||||
|---|---|---|---|---|---|---|---|---|---|---|---|---|---|
| |
U.S. Plans | Non-U.S. Plans | U.S. Plans | Non-U.S. Plans | |||||||||
Actuarial loss |
$ | 7 | $ | 34 | $ | 2 | $ | — | |||||
Prior service cost |
(5 | ) | (2 | ) | (2 | ) | — | ||||||
Transition obligation |
— | 1 | — | — | |||||||||
Total |
$ | 2 | $ | 33 | $ | — | $ | — | |||||
Components of net periodic benefit costs for the years ended December 31, 2008, 2007 and 2006 were as follows (dollars in millions):
Huntsman Corporation
| |
Defined Benefit Plans | ||||||||||||||||||
|---|---|---|---|---|---|---|---|---|---|---|---|---|---|---|---|---|---|---|---|
| |
U.S. plans | Non U.S. plans | |||||||||||||||||
| |
2008 | 2007 | 2006 | 2008 | 2007 | 2006 | |||||||||||||
Service cost |
$ | 24 | $ | 30 | $ | 34 | $ | 50 | $ | 50 | $ | 53 | |||||||
Interest cost |
40 | 40 | 37 | 113 | 113 | 98 | |||||||||||||
Expected return on assets |
(42 | ) | (40 | ) | (34 | ) | (148 | ) | (158 | ) | (125 | ) | |||||||
Amortization of transition obligation |
1 | 1 | 1 | — | 1 | 1 | |||||||||||||
Amortization of prior service cost |
(5 | ) | (6 | ) | (6 | ) | (1 | ) | (1 | ) | (1 | ) | |||||||
Amortization of actuarial loss (gain) |
5 | 7 | 9 | (1 | ) | 7 | 10 | ||||||||||||
Curtailment gain |
— | (14 | ) | — | — | — | (18 | ) | |||||||||||
Settlement loss (gain) |
— | — | — | 1 | (5 | ) | 1 | ||||||||||||
Special termination benefits |
— | — | — | 1 | — | 2 | |||||||||||||
Net periodic benefit cost |
23 | 18 | 41 | 15 | 7 | 21 | |||||||||||||
Less discontinued operations |
— | 11 | (7 | ) | — | 11 | (2 | ) | |||||||||||
Net periodic benefit cost from continuing operations |
$ | 23 | $ | 29 | $ | 34 | $ | 15 | $ | 18 | $ | 19 | |||||||
| |
Other Postretirement Benefit Plans | ||||||||||||||||||
|---|---|---|---|---|---|---|---|---|---|---|---|---|---|---|---|---|---|---|---|
| |
U.S. plans | Non U.S. plans | |||||||||||||||||
| |
2008 | 2007 | 2006 | 2008 | 2007 | 2006 | |||||||||||||
Service cost |
$ | 3 | $ | 4 | $ | 4 | $ | — | $ | — | $ | — | |||||||
Interest cost |
8 | 9 | 9 | — | — | — | |||||||||||||
Amortization of prior service cost |
(2 | ) | (2 | ) | (3 | ) | — | — | — | ||||||||||
Amortization of actuarial loss |
2 | 2 | 3 | — | — | — | |||||||||||||
Curtailment gain |
— | (4 | ) | — | — | — | — | ||||||||||||
Net periodic benefit cost |
11 | 9 | 13 | — | — | — | |||||||||||||
Less discontinued operations |
— | 1 | (2 | ) | — | — | — | ||||||||||||
Net periodic benefit cost from continuing operations |
$ | 11 | $ | 10 | $ | 11 | $ | — | $ | — | $ | — | |||||||
F-64
HUNTSMAN CORPORATION AND SUBSIDIARIES
HUNTSMAN INTERNATIONAL LLC AND SUBSIDIARIES
NOTES TO CONSOLIDATED FINANCIAL STATEMENTS (Continued)
19. EMPLOYEE BENEFIT PLANS (Continued)
Huntsman International
| |
Defined Benefit Plans | ||||||||||||||||||
|---|---|---|---|---|---|---|---|---|---|---|---|---|---|---|---|---|---|---|---|
| |
U.S. plans | Non U.S. plans | |||||||||||||||||
| |
2008 | 2007 | 2006 | 2008 | 2007 | 2006 | |||||||||||||
Service cost |
$ | 24 | $ | 30 | $ | 34 | $ | 50 | $ | 50 | $ | 53 | |||||||
Interest cost |
40 | 40 | 37 | 113 | 113 | 98 | |||||||||||||
Expected return on assets |
(42 | ) | (40 | ) | (34 | ) | (148 | ) | (158 | ) | (125 | ) | |||||||
Amortization of transition obligation |
1 | 1 | 1 | — | 1 | 1 | |||||||||||||
Amortization of prior service cost |
(5 | ) | (6 | ) | (6 | ) | (1 | ) | (1 | ) | (1 | ) | |||||||
Amortization of actuarial loss |
5 | 7 | 10 | 5 | 14 | 20 | |||||||||||||
Curtailment gain |
— | (14 | ) | — | — | — | — | ||||||||||||
Settlement loss |
— | — | — | 1 | 5 | 1 | |||||||||||||
Special termination benefits |
— | — | — | 1 | — | 2 | |||||||||||||
Net periodic benefit cost |
23 | 18 | 42 | 21 | 24 | 49 | |||||||||||||
Less discontinued operations |
— | 11 | (7 | ) | — | — | (19 | ) | |||||||||||
Net periodic benefit cost from continuing operations |
$ | 23 | $ | 29 | $ | 35 | $ | 21 | $ | 24 | $ | 30 | |||||||
| |
Other Postretirement Benefit Plans | ||||||||||||||||||
|---|---|---|---|---|---|---|---|---|---|---|---|---|---|---|---|---|---|---|---|
| |
U.S. plans | Non U.S. plans | |||||||||||||||||
| |
2008 | 2007 | 2006 | 2008 | 2007 | 2006 | |||||||||||||
Service cost |
$ | 3 | $ | 4 | $ | 4 | $ | — | $ | — | $ | — | |||||||
Interest cost |
8 | 9 | 9 | — | — | — | |||||||||||||
Amortization of prior service cost |
(2 | ) | (2 | ) | (3 | ) | — | — | — | ||||||||||
Amortization of actuarial loss |
2 | 2 | 3 | — | — | — | |||||||||||||
Curtailment gain |
— | (4 | ) | — | — | — | — | ||||||||||||
Net periodic benefit cost |
11 | 9 | 13 | — | — | — | |||||||||||||
Less discontinued operations |
— | 1 | (2 | ) | — | — | — | ||||||||||||
Net periodic benefit cost from continuing operations |
$ | 11 | $ | 10 | $ | 11 | $ | — | $ | — | $ | — | |||||||
F-65
HUNTSMAN CORPORATION AND SUBSIDIARIES
HUNTSMAN INTERNATIONAL LLC AND SUBSIDIARIES
NOTES TO CONSOLIDATED FINANCIAL STATEMENTS (Continued)
19. EMPLOYEE BENEFIT PLANS (Continued)
The following weighted-average assumptions were used to determine the projected benefit obligation at the measurement date and the net periodic pension cost for the year:
| |
Defined Benefit Plans | ||||||||||||||||||
|---|---|---|---|---|---|---|---|---|---|---|---|---|---|---|---|---|---|---|---|
| |
U.S. plans | Non U.S. plans | |||||||||||||||||
| |
2008 | 2007 | 2006 | 2008 | 2007 | 2006 | |||||||||||||
Projected benefit obligation: |
|||||||||||||||||||
Discount rate |
6.47 | % | 6.21 | % | 5.67 | % | 5.04 | % | 5.09 | % | 4.39 | % | |||||||
Rate of compensation increase |
3.77 | % | 3.89 | % | 3.89 | % | 3.21 | % | 3.24 | % | 3.22 | % | |||||||
Net periodic pension cost: |
|||||||||||||||||||
Discount rate |
6.21 | % | 5.67 | % | 5.75 | % | 5.09 | % | 4.39 | % | 4.61 | % | |||||||
Rate of compensation increase |
3.89 | % | 3.89 | % | 3.90 | % | 3.24 | % | 3.22 | % | 3.33 | % | |||||||
Expected return on plan assets |
8.25 | % | 8.25 | % | 8.25 | % | 6.89 | % | 6.75 | % | 6.89 | % | |||||||
| |
Other Postretirement Benefit Plans | ||||||||||||||||||
|---|---|---|---|---|---|---|---|---|---|---|---|---|---|---|---|---|---|---|---|
| |
U.S. plans | Non U.S. plans | |||||||||||||||||
| |
2008 | 2007 | 2006 | 2008 | 2007 | 2006 | |||||||||||||
Projected benefit obligation: |
|||||||||||||||||||
Discount rate |
6.39 | % | 6.05 | % | 5.63 | % | 6.25 | % | 5.25 | % | 5.00 | % | |||||||
Net periodic pension cost: |
|||||||||||||||||||
Discount rate |
6.05 | % | 5.63 | % | 5.71 | % | 5.25 | % | 5.00 | % | 5.00 | % | |||||||
The projected benefit obligation and fair value of plan assets for the defined benefit plans with projected benefit obligations in excess of plan assets were as follows (dollars in millions):
| |
U.S. plans | Non U.S. plans | |||||||||||
|---|---|---|---|---|---|---|---|---|---|---|---|---|---|
| |
2008 | 2007 | 2008 | 2007 | |||||||||
Projected benefit obligation in excess of plan assets |
|||||||||||||
Projected benefit obligation, end of year |
$ | 654 | $ | 642 | $ | 2,005 | $ | 1,198 | |||||
Fair value of plan assets, end of year |
348 | 499 | 1,587 | 1,027 | |||||||||
The projected benefit obligation, accumulated benefit obligation and fair value of plan assets for the defined benefit plans with an accumulated benefit obligation in excess of plan assets at December 31, 2008 and 2007 were as follows (dollars in millions):
| |
U.S. plans | Non U.S. plans | |||||||||||
|---|---|---|---|---|---|---|---|---|---|---|---|---|---|
| |
2008 | 2007 | 2008 | 2007 | |||||||||
Accumulated benefit obligation in excess of plan assets |
|||||||||||||
Projected benefit obligation, year end |
$ | 654 | $ | 642 | $ | 1,337 | $ | 172 | |||||
Accumulated benefit obligation, year end |
628 | 617 | 1,233 | 152 | |||||||||
Fair value of plan assets, year end |
348 | 499 | 957 | 31 | |||||||||
F-66
HUNTSMAN CORPORATION AND SUBSIDIARIES
HUNTSMAN INTERNATIONAL LLC AND SUBSIDIARIES
NOTES TO CONSOLIDATED FINANCIAL STATEMENTS (Continued)
19. EMPLOYEE BENEFIT PLANS (Continued)
Expected future contributions and benefit payments are as follows (dollars in millions):
| |
U.S. Plans | Non-U.S. Plans | |||||||||||||
|---|---|---|---|---|---|---|---|---|---|---|---|---|---|---|---|
| |
Defined Benefit Plans |
Other Postretirement Benefit Plans |
Defined Benefit Plans |
Other Postretirement Benefit Plans |
|||||||||||
2009 expected employer contributions: |
|||||||||||||||
To plan trusts |
$ | 85 | $ | 13 | $ | 58 | $ | — | |||||||
Expected benefit payments: |
|||||||||||||||
2009 |
45 | 13 | 86 | — | |||||||||||
2010 |
45 | 13 | 86 | — | |||||||||||
2011 |
46 | 13 | 90 | — | |||||||||||
2012 |
48 | 13 | 96 | — | |||||||||||
2013 |
42 | 12 | 93 | — | |||||||||||
2014-2018 |
229 | 57 | 494 | 1 | |||||||||||
In both 2008 and 2007, the health care trend rate used to measure the expected increase in the cost of benefits was assumed to be 9%, decreasing to 5% after 2016. Assumed health care cost trend rates have a significant effect on the amounts reported for the postretirement benefit plans. A one-percent-point change in assumed health care cost trend rates would have the following effects (dollars in millions):
Asset category
|
Increase | Decrease | |||||
|---|---|---|---|---|---|---|---|
Effect on total of service and interest cost |
$ | — | $ | — | |||
Effect on postretirement benefit obligation |
4 | (4 | ) | ||||
The asset allocation for our pension plans at December 31, 2008 and 2007 and the target allocation for 2009, by asset category, follows. The fair value of plan assets for these plans was $1,940 million at December 31, 2008. Based upon historical returns, the expectations of our investment
F-67
HUNTSMAN CORPORATION AND SUBSIDIARIES
HUNTSMAN INTERNATIONAL LLC AND SUBSIDIARIES
NOTES TO CONSOLIDATED FINANCIAL STATEMENTS (Continued)
19. EMPLOYEE BENEFIT PLANS (Continued)
committee and outside advisors, the expected long term rate of return on these assets is estimated to be between 6.89% and 8.25%.
Asset category
|
Target Allocation 2009 | Allocation at December 31, 2008 |
Allocation at December 31, 2007 |
|||||||||
|---|---|---|---|---|---|---|---|---|---|---|---|---|
U.S. pension plans: |
||||||||||||
Large Cap Equities |
30 | % | 27 | % | 30 | % | ||||||
Small/Mid Cap Equities |
15 | % | 15 | % | 17 | % | ||||||
International Equities |
19 | % | 14 | % | 17 | % | ||||||
Fixed Income |
25 | % | 29 | % | 24 | % | ||||||
Real Estate/Other |
11 | % | 15 | % | 10 | % | ||||||
Cash |
— | — | 2 | % | ||||||||
Total U.S. pension plans |
100 | % | 100 | % | 100 | % | ||||||
Non-U.S. pension plans: |
||||||||||||
Equities |
48 | % | 42 | % | 53 | % | ||||||
Fixed Income |
38 | % | 44 | % | 41 | % | ||||||
Real Estate/Other |
13 | % | 12 | % | 5 | % | ||||||
Cash |
1 | % | 2 | % | 1 | % | ||||||
Total non-U.S. pension plans |
100 | % | 100 | % | 100 | % | ||||||
Equity securities in our pension plans did not include any equity securities of our Company or our affiliates at the end of 2008.
Our pension plan assets are managed by outside investment managers; assets are rebalanced based upon market opportunities and the consideration of transactions costs. Our strategy with respect to pension assets is to pursue an investment plan that, over the long term is expected to protect the funded status of the plan, enhance the real purchasing power of plan assets, and not threaten the plan's ability to meet currently committed obligations.
DEFINED CONTRIBUTION PLANS
We have a money purchase pension plan covering substantially all of our domestic employees who were hired prior to January 1, 2004. Employer contributions are made based on a percentage of employees' earnings (ranging up to 8%).
We also have a salary deferral plan covering substantially all domestic employees. Plan participants may elect to make voluntary contributions to this plan up to a specified amount of their compensation. We contribute an amount equal to one-half of the participant's contribution, not to exceed 2% of the participant's compensation.
Coincident with the introduction of the cash balance formula within our defined benefit pension plan, the money purchase pension plan was closed to new hires. At the same time, the company match in the salary deferral plan was increased, for new hires, to a 100% match, not to exceed 4% of the participant's compensation, once the participant has achieved six years of service with the Company.
F-68
HUNTSMAN CORPORATION AND SUBSIDIARIES
HUNTSMAN INTERNATIONAL LLC AND SUBSIDIARIES
NOTES TO CONSOLIDATED FINANCIAL STATEMENTS (Continued)
19. EMPLOYEE BENEFIT PLANS (Continued)
Our total combined expense for the above defined contribution plans for the years ended December 31, 2008, 2007 and 2006 was $12 million, $16 million and $15 million, respectively of which nil, $4 million and $4 million related to discontinued operations, respectively.
SUPPLEMENTAL SALARY DEFERRAL PLAN AND SUPPLEMENTAL EXECUTIVE RETIREMENT PLAN
The Huntsman Supplemental Savings Plan ("SSP") is a non-qualified plan covering key management employees and allows participants to defer amounts that would otherwise be paid as compensation. The participant can defer up to 75% of their salary and bonus each year. This plan also provides benefits that would be provided under the Huntsman Salary Deferral Plan if that plan were not subject to legal limits on the amount of contributions that can be allocated to an individual in a single year. The SSP was amended and restated effective as of January 1, 2005 to allow eligible executive employees to comply with Section 409A of the Internal Revenue Code of 1986 ("Section 409A").
The Huntsman Supplemental Executive Retirement Plan (the "SERP") is an unfunded nonqualified pension plan established to provide certain executive employees with benefits that could not be provided, due to legal limitations, under the Huntsman Defined Benefit Pension Plan, a qualified defined benefit pension plan, and the Huntsman Money Purchase Pension Plan, a qualified money purchase pension plan.
Assets of these plans are included in other noncurrent assets and at December 31, 2008 and 2007 were $10 million and $13 million, respectively. During each of the years ended December 31, 2008, 2007 and 2006, we expensed a total of $1 million for the SSP and the SERP.
STOCK-BASED INCENTIVE PLAN
In connection with the initial public offering of common and preferred stock on February 16, 2005, we adopted the Huntsman Stock Incentive Plan (the "Stock Incentive Plan"). The Stock Incentive Plan permits the grant of non-qualified stock options, incentive stock options, stock appreciation rights, nonvested stock, phantom stock, performance awards and other stock-based awards ("Awards") to our employees, directors and consultants and to employees and consultants of our subsidiaries, provided that incentive stock options may be granted solely to employees. A maximum of 21,590,909 shares of common stock may be delivered pursuant to the Awards under the Stock Incentive Plan. See "Note 26. Stock-Based Compensation Plans."
INTERNATIONAL PLANS
International employees are covered by various post employment arrangements consistent with local practices and regulations. Such obligations are included in the consolidated financial statements in other long-term liabilities.
F-69
HUNTSMAN CORPORATION AND SUBSIDIARIES
HUNTSMAN INTERNATIONAL LLC AND SUBSIDIARIES
NOTES TO CONSOLIDATED FINANCIAL STATEMENTS (Continued)
20. INCOME TAXES
The following is a summary of U.S. and non-U.S. provisions for current and deferred income taxes (dollars in millions):
Huntsman Corporation
| |
For the Year ended December 31, | ||||||||||
|---|---|---|---|---|---|---|---|---|---|---|---|
| |
2008 | 2007 | 2006 | ||||||||
Income tax (expense) benefit: |
|||||||||||
U.S. |
|||||||||||
Current |
$ | (22 | ) | $ | 1 | $ | 15 | ||||
Deferred |
(190 | ) | (16 | ) | 6 | ||||||
Non-U.S. |
|||||||||||
Current |
(36 | ) | (53 | ) | (49 | ) | |||||
Deferred |
58 | 80 | 78 | ||||||||
Total |
$ | (190 | ) | $ | 12 | $ | 50 | ||||
Huntsman International
| |
For the Year ended December 31, | ||||||||||
|---|---|---|---|---|---|---|---|---|---|---|---|
| |
2008 | 2007 | 2006 | ||||||||
Income tax benefit (expense): |
|||||||||||
U.S. |
|||||||||||
Current |
$ | (6 | ) | $ | 1 | $ | 16 | ||||
Deferred |
(10 | ) | (63 | ) | 4 | ||||||
Non-U.S. |
|||||||||||
Current |
(36 | ) | (53 | ) | (49 | ) | |||||
Deferred |
54 | 74 | 60 | ||||||||
Total |
$ | 2 | $ | (41 | ) | $ | 31 | ||||
F-70
HUNTSMAN CORPORATION AND SUBSIDIARIES
HUNTSMAN INTERNATIONAL LLC AND SUBSIDIARIES
NOTES TO CONSOLIDATED FINANCIAL STATEMENTS (Continued)
20. INCOME TAXES (Continued)
The following schedule reconciles the differences between the U.S. federal income taxes at the U.S. statutory rate to our (provision) benefit for income taxes (dollars in millions):
Huntsman Corporation
| |
For the Year ended December 31, | |||||||||
|---|---|---|---|---|---|---|---|---|---|---|
| |
2008 | 2007 | 2006 | |||||||
Income from continuing operations before income taxes and minority interest |
$ | 669 | $ | 31 | $ | 260 | ||||
Expected tax expense at U.S. statutory rate of 35% |
(234 |
) |
(11 |
) |
(91 |
) |
||||
Change resulting from: |
||||||||||
State tax (expense) benefit net of federal benefit |
(7 | ) | 3 | 1 | ||||||
Effects of non-U.S. operations and tax rate differentials |
5 | (15 | ) | (8 | ) | |||||
Expenses associated with the Merger |
73 | (73 | ) | — | ||||||
U.K. exchange gains and losses |
24 | 1 | (2 | ) | ||||||
Tax authority dispute resolutions |
68 | 3 | 55 | |||||||
Change in valuation allowance |
(117 | ) | 110 | 94 | ||||||
Other—net |
(2 | ) | (6 | ) | 1 | |||||
Total income tax (expense) benefit |
$ | (190 | ) | $ | 12 | $ | 50 | |||
Huntsman International
| |
For the Year ended December 31, |
|||||||||
|---|---|---|---|---|---|---|---|---|---|---|
| |
2008 | 2007 | 2006 | |||||||
(Loss) income from continuing operations before income taxes and minority interest |
$ | (94 | ) | $ | 255 | $ | 261 | |||
Expected tax benefit (expense) at U.S. statutory rate of 35% |
33 |
(89 |
) |
(91 |
) |
|||||
Change resulting from: |
||||||||||
State tax (expense) benefit net of federal benefit |
(7 | ) | 3 | 3 | ||||||
Effects of non-U.S. operations and tax rate differential |
2 | (18 | ) | (8 | ) | |||||
U.K. exchange gains and losses |
24 | 1 | (2 | ) | ||||||
Tax authority dispute resolutions |
68 | 3 | 55 | |||||||
Change in valuation allowance |
(115 | ) | 63 | 73 | ||||||
Other—net |
(3 | ) | (4 | ) | 1 | |||||
Total income tax benefit (expense) |
$ | 2 | $ | (41 | ) | $ | 31 | |||
F-71
HUNTSMAN CORPORATION AND SUBSIDIARIES
HUNTSMAN INTERNATIONAL LLC AND SUBSIDIARIES
NOTES TO CONSOLIDATED FINANCIAL STATEMENTS (Continued)
20. INCOME TAXES (Continued)
The components of income (loss) from continuing operations before income taxes and minority interest were as follows (dollars in millions):
Huntsman Corporation
| |
For the Year ended December 31, |
||||||||||
|---|---|---|---|---|---|---|---|---|---|---|---|
| |
2008 | 2007 | 2006 | ||||||||
U.S. |
$ | 805 | $ | 33 | $ | 201 | |||||
Non-U.S. |
(136 | ) | (2 | ) | 59 | ||||||
Total |
$ | 669 | $ | 31 | $ | 260 | |||||
Huntsman International
| |
For the Year ended December 31, |
||||||||||
|---|---|---|---|---|---|---|---|---|---|---|---|
| |
2008 | 2007 | 2006 | ||||||||
U.S. |
$ | 42 | $ | 257 | $ | 203 | |||||
Non-U.S. |
(136 | ) | (2 | ) | 58 | ||||||
Total |
$ | (94 | ) | $ | 255 | $ | 261 | ||||
Components of deferred income tax assets and liabilities were as follows (dollars in millions):
Huntsman Corporation
| |
December 31, | |||||||
|---|---|---|---|---|---|---|---|---|
| |
2008 | 2007 | ||||||
Deferred income tax assets: |
||||||||
Net operating loss and AMT credit carryforwards |
$ | 739 | $ | 789 | ||||
Pension and other employee compensation |
278 | 150 | ||||||
Property, plant and equipment |
110 | 136 | ||||||
Intangible assets |
81 | 82 | ||||||
Foreign tax credits |
67 | 69 | ||||||
Other, net |
106 | 185 | ||||||
Total |
1,381 | 1,411 | ||||||
Deferred income tax liabilities: |
||||||||
Property, plant and equipment |
(474 | ) | (517 | ) | ||||
Pension and other employee compensation |
(1 | ) | (34 | ) | ||||
Other, net |
(85 | ) | (98 | ) | ||||
Total |
(560 | ) | (649 | ) | ||||
Net deferred tax asset before valuation allowance |
821 |
762 |
||||||
Valuation allowance |
(669 | ) | (496 | ) | ||||
Net deferred tax asset (liability) |
$ | 152 | $ | 266 | ||||
F-72
HUNTSMAN CORPORATION AND SUBSIDIARIES
HUNTSMAN INTERNATIONAL LLC AND SUBSIDIARIES
NOTES TO CONSOLIDATED FINANCIAL STATEMENTS (Continued)
20. INCOME TAXES (Continued)
| |
December 31, | ||||||
|---|---|---|---|---|---|---|---|
| |
2008 | 2007 | |||||
Current tax asset |
$ | 21 | $ | 73 | |||
Current tax liability |
(36 | ) | (3 | ) | |||
Non-current tax asset |
284 | 350 | |||||
Non-current tax liability |
(117 | ) | (154 | ) | |||
Total |
$ | 152 | $ | 266 | |||
Huntsman International
| |
December 31, | |||||||
|---|---|---|---|---|---|---|---|---|
| |
2008 | 2007 | ||||||
Deferred income tax assets: |
||||||||
Net operating loss and AMT credit carryforwards |
$ | 819 | $ | 718 | ||||
Pension and other employee compensation |
278 | 150 | ||||||
Property, plant and equipment |
110 | 136 | ||||||
Intangible assets |
80 | 80 | ||||||
Foreign tax credits |
71 | 69 | ||||||
Other, net |
103 | 184 | ||||||
Total |
1,461 | 1,337 | ||||||
Deferred income tax liabilities: |
||||||||
Property, plant and equipment |
(455 | ) | (495 | ) | ||||
Pension and other employee compensation |
(1 | ) | (34 | ) | ||||
Other, net |
(15 | ) | (51 | ) | ||||
Total |
(471 | ) | (580 | ) | ||||
Net deferred tax asset before valuation allowance |
990 |
757 |
||||||
Valuation allowance |
(681 | ) | (510 | ) | ||||
Net deferred tax asset (liability) |
$ | 309 | $ | 247 | ||||
Current tax asset |
$ |
21 |
$ |
74 |
||||
Current tax liability |
(35 | ) | (3 | ) | ||||
Non-current tax asset |
392 | 300 | ||||||
Non-current tax liability |
(69 | ) | (124 | ) | ||||
Total |
$ | 309 | $ | 247 | ||||
As of December 31, 2008, we have fully utilized all of our U.S. federal regular tax net operating loss carryforwards ("NOLs"). We have NOLs of $2,565 million in various non-U.S. jurisdictions. While the majority of the non-U.S. NOLs have no expiration date, $210 million have a limited life and $8 million are scheduled to expire in 2009. We had $10 million of NOLs expire unused in 2008 that had been previously subject to a full valuation allowance.
F-73
HUNTSMAN CORPORATION AND SUBSIDIARIES
HUNTSMAN INTERNATIONAL LLC AND SUBSIDIARIES
NOTES TO CONSOLIDATED FINANCIAL STATEMENTS (Continued)
20. INCOME TAXES (Continued)
Included in the $2,565 million of non-U.S. NOLs is $1,169 million attributable to Huntsman Advanced Materials, LLC's Luxembourg entities. As of December 31, 2008, there was a valuation allowance against these net tax-effected NOLs of $281 million. Due to the uncertainty surrounding the realization of the benefits of these losses that may result from future dissolution or restructuring of the Luxembourg entities, including potential ruling requests from Luxembourg authorities, we have reduced the related deferred tax asset with a valuation allowance.
We are subject to the "ownership change" rules of Section 382 of the Internal Revenue Code. Under these rules, our use of the NOLs could be limited in tax periods following the date of an ownership change. Based upon the existence of significant tax "built-in income" items, the ownership change rules had no effect on our ability to utilize the NOLs.
Valuation allowances are reviewed each period on a tax jurisdiction by jurisdiction basis to analyze whether there is sufficient positive or negative evidence to support a change in judgment about the realizability of the related deferred tax assets. During the fourth quarter of 2008, we established valuation allowances of $35 million on certain net deferred tax assets principally, in Switzerland. During 2007, we released valuation allowances of $123 million on certain net deferred tax assets, principally in the United States.
The following is a summary of changes in the valuation allowance (dollars in millions):
Huntsman Corporation
| |
2008 | 2007 | 2006 | ||||||||
|---|---|---|---|---|---|---|---|---|---|---|---|
Valuation allowance as of January 1 |
$ | 496 | $ | 572 | $ | 550 | |||||
Valuation allowance as of December 31 |
669 | 496 | 572 | ||||||||
Net change |
(173 | ) | 76 | (22 | ) | ||||||
Foreign currency movements |
(19 | ) | 17 | 7 | |||||||
Deferred tax liabilities recorded in purchase accounting which reduced the need for valuation allowance |
— |
— |
(8 |
) |
|||||||
Recognition of net operating losses based on final settlement with U.S. and U.K. tax authorities, with a corresponding increase to valuation allowances |
— |
— |
53 |
||||||||
Increase to deferred tax assets with an offsetting decrease to valuation allowances |
76 | 27 | 72 | ||||||||
Movement of net deferred tax assets related to discontinued operations |
— | — | (7 | ) | |||||||
Reversal of valuation allowances on deferred tax assets related to prior acquisitions, with a corresponding credit to equity |
— |
(8 |
) |
— |
|||||||
Reversal of valuation allowances on deferred tax assets related to prior acquisitions, with a corresponding reduction to goodwill and intangible assets |
(1 |
) |
(2 |
) |
(1 |
) |
|||||
Change in valuation allowance per rate reconciliation |
$ | (117 | ) | $ | 110 | $ | 94 | ||||
F-74
HUNTSMAN CORPORATION AND SUBSIDIARIES
HUNTSMAN INTERNATIONAL LLC AND SUBSIDIARIES
NOTES TO CONSOLIDATED FINANCIAL STATEMENTS (Continued)
20. INCOME TAXES (Continued)
| |
2008 | 2007 | 2006 | ||||||||
|---|---|---|---|---|---|---|---|---|---|---|---|
Components of change in valuation allowance affecting operating tax expense: |
|||||||||||
Effects of pre-tax income and pre-tax losses in jurisdictions with valuation allowances |
$ | (82 | ) | $ | (10 | ) | $ | 73 | |||
Releases of valuation allowances in various jurisdictions |
— | 123 | 29 | ||||||||
Establishments of valuation allowances in various jurisdictions |
(35 | ) | (3 | ) | (8 | ) | |||||
Change in valuation allowance per rate reconciliation |
$ | (117 | ) | $ | 110 | $ | 94 | ||||
Huntsman International
| |
2008 | 2007 | 2006 | ||||||||
|---|---|---|---|---|---|---|---|---|---|---|---|
Valuation allowance as of January 1 |
$ | 510 | $ | 536 | $ | 495 | |||||
Valuation allowance as of December 31 |
681 | 510 | 536 | ||||||||
Net change |
(171 | ) | 26 | (41 | ) | ||||||
Foreign currency movements |
(19 | ) | 17 | 7 | |||||||
Deferred tax liabilities recorded in purchase accounting which reduced the need for valuation allowances |
— |
— |
(8 |
) |
|||||||
Recognition of net operating losses based on final settlement with U.S. and U.K. tax authorities, with a corresponding increase to valuation allowances |
— |
— |
53 |
||||||||
Increase to deferred tax assets with an offsetting decrease to valuation allowance |
76 |
30 |
71 |
||||||||
Movement of net deferred tax assets related to discontinued operations |
— | — | (8 | ) | |||||||
Reversal of valuation allowances on deferred tax assets related to prior acquisitions, with a corresponding credit to equity |
— |
(8 |
) |
— |
|||||||
Reversal of valuation allowances on deferred tax assets related to prior acquisitions, with a corresponding reduction to goodwill and intangible assets |
(1 |
) |
(2 |
) |
(1 |
) |
|||||
Change in valuation allowance per rate reconciliation |
$ | (115 | ) | $ | 63 | $ | 73 | ||||
Components of change in valuation allowance affecting operating tax expense: |
|||||||||||
Effects of pre-tax income and pre-tax losses in jurisdictions with valuation allowances |
$ | (80 | ) | $ | (8 | ) | $ | 66 | |||
Releases of valuation allowances in various jurisdictions |
— | 74 | 21 | ||||||||
Establishments of valuation allowances in various jurisdictions |
(35 | ) | (3 | ) | (14 | ) | |||||
Change in valuation allowance per rate reconciliation |
$ | (115 | ) | $ | 63 | $ | 73 | ||||
F-75
HUNTSMAN CORPORATION AND SUBSIDIARIES
HUNTSMAN INTERNATIONAL LLC AND SUBSIDIARIES
NOTES TO CONSOLIDATED FINANCIAL STATEMENTS (Continued)
20. INCOME TAXES (Continued)
The following is a reconciliation of our unrecognized tax benefits (dollars in millions):
| |
2008 | 2007 | |||||
|---|---|---|---|---|---|---|---|
Unrecognized tax benefits as of January 1 |
$ | 141 | $ | 124 | |||
Gross increases and decreases—tax positions taken during a prior period |
(77 | ) | 1 | ||||
Gross increases and decreases—tax positions taken during the current period |
11 | 9 | |||||
Decreases related to settlement of amounts due to tax authorities |
(2 | ) | (1 | ) | |||
Reductions resulting from the lapse of statute of limitations |
(4 | ) | (1 | ) | |||
Foreign currency movements |
(5 | ) | 9 | ||||
Unrecognized tax benefits as of December 31 |
$ | 64 | $ | 141 | |||
As of December 31, 2008 and 2007, the amount of unrecognized tax benefits which, if recognized, would affect the effective tax rate was $44 million and $117 million, respectively.
In accordance with our accounting policy, we continue to recognize interest and penalties accrued related to unrecognized tax benefits in income tax expense. During the year ended December 31, 2008, we recognized approximately $7 million of tax benefit in income tax expense related to interest and $1 million of tax expense related to penalties. We had approximately $5 million and $12 million accrued for the payment of interest and approximately $2 million and $1 million accrued for the payment of penalties as of December 31, 2008 and 2007, respectively.
We conduct business globally and, as a result, we file income tax returns in the U.S. federal, various U.S. state and various non-U.S. jurisdictions. The following table summarizes the tax years that remain subject to examination by major tax jurisdictions:
Tax Jurisdiction
|
Open Tax Years | |
|---|---|---|
Australia |
2002 and later | |
Belgium |
2004 and later | |
China |
2002 and later | |
Germany |
2002 and later | |
Italy |
2000 and later | |
Switzerland |
2004 and later | |
The Netherlands |
2005 and later | |
United Kingdom |
2007 and later | |
United States federal |
2005 and later |
Certain of our U.S. and non-U.S. income tax returns are currently under various stages of audit by applicable tax authorities and the amounts ultimately agreed upon in resolution of the issues raised may differ materially from the amounts accrued.
We estimate that it is reasonably possible that certain of our unrecognized tax benefits (both U.S. and non-U.S.) could change within 12 months of the reporting date with a resulting decrease in the unrecognized tax benefits within a reasonably possible range of $10 million to $15 million. For the 12-month period from the reporting date, we would expect that a substantial portion of the decrease in our unrecognized tax benefits would result in a corresponding benefit to our income tax expense.
F-76
HUNTSMAN CORPORATION AND SUBSIDIARIES
HUNTSMAN INTERNATIONAL LLC AND SUBSIDIARIES
NOTES TO CONSOLIDATED FINANCIAL STATEMENTS (Continued)
20. INCOME TAXES (Continued)
During 2008, we concluded and settled tax examinations in the U.S. (both Federal and various states) and various non-U.S. jurisdictions including, but not limited to, Germany, Italy and the U.K.
For non-U.S. entities that were not treated as branches for U.S. tax purposes, we do not provide for income taxes on the undistributed earnings of these subsidiaries as earnings are reinvested and, in the opinion of management, will continue to be reinvested indefinitely. The undistributed earnings of foreign subsidiaries that are deemed to be permanently invested were $279 million at December 31, 2008. It is not practicable to determine the unrecognized deferred tax liability on those earnings.
21. INCOME (EXPENSES) ASSOCIATED WITH THE MERGER
Total income (expenses) associated with the Merger were as follows (dollars in millions):
| |
December 31, | |||||||
|---|---|---|---|---|---|---|---|---|
| |
2008 | 2007 | ||||||
Gain recognized pursuant to the Settlement Agreement |
$ | 765 | $ | — | ||||
Basell Termination Fee |
100 | (200 | ) | |||||
Investment banking fees |
(25 | ) | — | |||||
Directors' fees |
(17 | ) | — | |||||
Legal fees and other |
(43 | ) | (10 | ) | ||||
Total |
$ | 780 | $ | (210 | ) | |||
Prior to entering into the Merger Agreement, we terminated the Basell Merger Agreement and paid Basell the $200 million Basell Termination Fee required under the terms of the Basell Merger Agreement during the third quarter of 2007. One-half of the Basell Termination Fee, or $100 million, was reimbursed by Hexion. The $100 million funded by Hexion had been deferred and was recorded in accrued liabilities in the December 31, 2007 consolidated balance sheet. This amount was recognized in earnings during the fourth quarter of 2008 in connection with the Settlement Agreement. Fees paid in connection with the Merger consist of the following:
For more information regarding the termination of the Merger and settlement of the related litigation, see "Note 1. General—Termination of Merger Agreement and Settlement of Related Litigation."
F-77
HUNTSMAN CORPORATION AND SUBSIDIARIES
HUNTSMAN INTERNATIONAL LLC AND SUBSIDIARIES
NOTES TO CONSOLIDATED FINANCIAL STATEMENTS (Continued)
22. COMMITMENTS AND CONTINGENCIES
PURCHASE COMMITMENTS
We have various purchase commitments extending through 2023 for materials and supplies entered into in the ordinary course of business. The purchase commitments are contracts that require minimum volume purchases. Certain contracts allow for changes in minimum required purchase volumes in the event of a temporary or permanent shutdown of a facility. The contractual purchase prices for substantially all of these contracts require minimum payments, even if no volume is purchased. Historically, we have not made any minimum payments under such take or pay contracts without taking the product.
Total purchase commitments as of December 31, 2008 are as follows (dollars in millions):
Year ending December 31:
|
|
|||
|---|---|---|---|---|
2009 |
$ | 157 | ||
2010 |
110 | |||
2011 |
73 | |||
2012 |
65 | |||
2013 |
48 | |||
Thereafter |
75 | |||
|
$ | 528 | ||
OPERATING LEASES
We lease certain railcars, aircraft, equipment and facilities under long-term lease agreements. The total net expense recorded under operating lease agreements in the accompanying consolidated statements of operations is approximately $48 million, $46 million and $51 million for the years ended December 31, 2008, 2007 and 2006, respectively, of which nil, $9 million and $13 million related to discontinued operations, respectively.
Future minimum lease payments under operating leases as of December 31, 2008 are as follows (dollars in millions):
Year ending December 31:
|
|
|||
|---|---|---|---|---|
2009 |
$ | 47 | ||
2010 |
44 | |||
2011 |
40 | |||
2012 |
32 | |||
2013 |
28 | |||
Thereafter |
96 | |||
|
$ | 287 | ||
F-78
HUNTSMAN CORPORATION AND SUBSIDIARIES
HUNTSMAN INTERNATIONAL LLC AND SUBSIDIARIES
NOTES TO CONSOLIDATED FINANCIAL STATEMENTS (Continued)
22. COMMITMENTS AND CONTINGENCIES (Continued)
LEGAL MATTERS
Litigation Relating to our Merger with Hexion
For information regarding the termination of the Merger Agreement and settlement of the related litigation, see "Note 1. General—Termination of Merger Agreement and Settlement of Related Litigation" above.
Texas Bank Litigation
For information with respect to the Texas Bank Litigation, see "Note 1. General—Recent Developments—Texas Bank Litigation" above.
Discoloration Claims
Certain claims have been filed against us relating to discoloration of unplasticized polyvinyl chloride products allegedly caused by our titanium dioxide. Substantially all of the titanium dioxide that is the subject of these claims was manufactured prior to our acquisition of the titanium dioxide business from ICI in 1999. Net of amounts we have received from insurers and pursuant to contracts of indemnity, we have paid an aggregate of approximately $16 million in costs and settlement amounts for Discoloration Claims through December 31, 2008.
During the year ended December 31, 2008, we did not settle any Discoloration Claims. During the year ended December 31, 2007, we paid an insignificant amount in partial settlement of a claim. The two Discoloration Claims unresolved as of December 31, 2008 asserted aggregate damages of €36 million (approximately $51 million). An appropriate liability has been accrued for these claims. Based on our understanding of the merits of these claims and our rights under contracts of indemnity and insurance, we do not believe that the net impact on our financial condition, results of operations or liquidity will be material.
While additional Discoloration Claims may be made in the future, we cannot reasonably estimate the amount of loss related to such claims. Although we may incur additional costs as a result of future claims (including settlement costs), based on our history with Discoloration Claims to date, the fact that substantially all of the titanium dioxide that has been the subject of these Discoloration Claims was manufactured and sold more than nine years ago, and the fact that we have rights under contract to indemnity, including from ICI, we do not believe that any unasserted Discoloration Claims will have a material impact on our financial condition, results of operations or liquidity. Based on this conclusion and our inability to reasonably estimate our expected costs with respect to these unasserted claims, we have made no accruals in our financial statements as of December 31, 2008 for costs associated with unasserted Discoloration Claims.
Asbestos Litigation
We have been named as a "premises defendant" in a number of asbestos exposure cases, typically claims by non-employees of exposure to asbestos while at a facility. In the past, these cases typically have involved multiple plaintiffs bringing actions against multiple defendants, and the complaints have not indicated which plaintiffs were making claims against which defendants, where or how the alleged
F-79
HUNTSMAN CORPORATION AND SUBSIDIARIES
HUNTSMAN INTERNATIONAL LLC AND SUBSIDIARIES
NOTES TO CONSOLIDATED FINANCIAL STATEMENTS (Continued)
22. COMMITMENTS AND CONTINGENCIES (Continued)
injuries occurred or what injuries each plaintiff claimed. These facts, which would be central to any estimate of probable loss, generally have been learned only through discovery.
Where a claimant's alleged exposure occurred prior to our ownership of the relevant "premises," the prior owners generally have contractually agreed to retain liability for, and to indemnify us against, asbestos exposure claims. This indemnification is not subject to any time or dollar amount limitations. Upon service of a complaint in one of these cases, we tender it to the prior owner. None of the complaints in these cases state the amount of damages being sought. The prior owner accepts responsibility for the conduct of the defense of the cases and payment of any amounts due to the claimants. In our fourteen-year experience with tendering these cases, we have not made any payment with respect to any tendered asbestos cases. We believe that the prior owners have the intention and ability to continue to honor their indemnity obligations, although we cannot assure you that they will continue to do so or that we will not be liable for these cases if they do not.
The following table presents for the periods indicated certain information about cases for which service has been received that we have tendered to the prior owner, all of which have been accepted.
| |
Year ended December 31, 2008 |
Year ended December 31, 2007 |
Year ended December 31, 2006 |
|||||||
|---|---|---|---|---|---|---|---|---|---|---|
Unresolved at beginning of period |
1,192 | 1,367 | 576 | |||||||
Tendered during period |
21 | 21 | 998 | |||||||
Resolved during period(1) |
73 | 196 | 207 | |||||||
Unresolved at end of period |
1,140 | 1,192 | 1,367 | |||||||
We have never made any payments with respect to these cases. As of December 31, 2008, we had an accrued liability of $16 million relating to these cases and a corresponding receivable of $16 million relating to our indemnity protection with respect to these cases. We cannot assure you that our liability will not exceed our accruals or that our liability associated with these cases would not be material to our financial condition, results of operations or liquidity; however, we are not able to estimate the amount or range of loss in excess of our accruals. Additional asbestos exposure claims may be made against us in the future, and such claims could be material. However, because we are not able to estimate the amount or range of losses associated with such claims, we have made no accruals with respect to unasserted asbestos exposure claims as of December 31, 2008.
Certain cases in which we are a "premises defendant" are not subject to indemnification by prior owners or operators. The following table presents for the periods indicated certain information about these cases. Cases include all cases for which service has been received by us, other than a number of
F-80
HUNTSMAN CORPORATION AND SUBSIDIARIES
HUNTSMAN INTERNATIONAL LLC AND SUBSIDIARIES
NOTES TO CONSOLIDATED FINANCIAL STATEMENTS (Continued)
22. COMMITMENTS AND CONTINGENCIES (Continued)
cases that were erroneously filed against us due to a clerical error. The cases filed in error have been dismissed.
| |
Year ended December 31, 2008 |
Year ended December 31, 2007 |
Year ended December 31, 2006 |
|||||||
|---|---|---|---|---|---|---|---|---|---|---|
Unresolved at beginning of period |
39 | 42 | 34 | |||||||
Filed during period |
8 | 52 | 19 | |||||||
Resolved during period |
4 | 55 | 11 | |||||||
Unresolved at end of period |
43 | 39 | 42 | |||||||
We paid gross settlement costs for asbestos exposure cases that are not subject to indemnification of nil, $3 million and nil during the years ended December 31, 2008, 2007 and 2006, respectively. We cannot assure you that our liability will not exceed our accruals or that our liability associated with these cases would not be material to our financial condition, results of operations or liquidity; however, we are not able to estimate the amount or range of loss in excess of our accruals. Additional asbestos exposure claims may be made against us in the future, and such claims could be material. However, because we are not able to estimate the amount or range of losses associated with such claims, we have made no accruals with respect to unasserted asbestos exposure claims as of December 31, 2008.
Antitrust Matters
We have been named as a defendant in civil antitrust suits alleging that between 1999 and 2004 we conspired with Bayer, BASF, Dow, and Lyondell to fix the prices of MDI, TDI, polyether polyols, and related systems ("polyether polyol products") sold in the United States in violation of the federal Sherman Act. These cases are consolidated as the "Polyether Polyols" cases in multidistrict litigation known as In re Urethane Antitrust Litigation, MDL No. 1616, Civil No. 2:04-md-01616-JWL-DJW, pending in the United States District Court, District of Kansas. The Kansas court has ruled that plaintiffs may prosecute the Polyether Polyols cases on behalf of a class of all direct purchasers of polyether polyol products in the United States. Bayer has entered into a settlement with the plaintiffs' class and has been dismissed as a defendant. Merits discovery is underway, and trial has been set for May 3, 2011.
We and the other Polyether Polyol defendants (excluding Bayer) have also been named as defendants in two civil antitrust suits brought by certain direct purchasers of polyether polyol products that opted out of the class certified in MDL No. 1616. These cases have been brought by 12 groups of affiliated companies, 73 plaintiffs in all, who allege that between 1994 and 2006 the Polyether Polyol defendants conspired to fix the prices of polyether polyol products sold in the United States and abroad in violation of the Sherman Act, similar laws of several U.S. states, and the laws of the European Union and certain of its member states. We and the other defendants have moved to dismiss the opt-out complaints.
We, along with the other Polyether Polyols defendants and Rhodia, have also been named as a defendant in civil antitrust suits alleging a conspiracy to fix the prices of polyether polyol products sold in Canada in violation of Canadian competition law. These cases, filed in the Superior Court of Justice, Ontario, Canada on May 5, 2006 and in Superior Court, Quebec, Canada on May 17, 2006, purport to
F-81
HUNTSMAN CORPORATION AND SUBSIDIARIES
HUNTSMAN INTERNATIONAL LLC AND SUBSIDIARIES
NOTES TO CONSOLIDATED FINANCIAL STATEMENTS (Continued)
22. COMMITMENTS AND CONTINGENCIES (Continued)
be brought on behalf of various classes of Canadian direct purchasers of polyether polyol products. There has been little activity in these cases since they were filed.
Along with Flexsys, Crompton (now Chemtura), Uniroyal, Rhein Chemie Rheinau, and the other Polyether Polyol defendants, we also have been named as a defendant in a civil antitrust suit pending in the Superior Court of California, County of San Francisco, filed on February 15, 2005, that alleges that between 1994 and 2004 the defendants conspired to fix the prices of certain rubber and urethane products sold in California in violation of antitrust and unfair competition laws of California. This case purports to be brought on behalf of a class of all California purchasers of products containing rubber and urethanes products. By agreement of the parties this case has been stayed pending the resolution of MDL No. 1616.
Along with Dow, BASF, and Lyondell, we have also been named as a defendant in a third amended complaint proposed for filing in an existing civil antitrust suit pending against Bayer and Chemtura in federal district court in Massachusetts. The proposed amended complaint alleges that beginning around 1990 we and the other defendants conspired to fix the prices of MDI, TDI, polyether polyols, and polyester polyols sold throughout the United States in violation of the federal Sherman Act and the laws of various states. The proposed amended complaint seeks to sue on behalf of all indirect purchasers of such products in the United States. The Massachusetts action has been stayed pending plaintiffs' settlement of the previously asserted claims against Bayer and Chemtura. We have filed papers opposing the motion for leave to file the proposed amended complaint adding us as a defendant in that action.
The plaintiffs' pleadings in these various antitrust suits provide few specifics about any alleged illegal conduct on our part, and we are not aware of any illegal conduct by us or any of our employees. For these reasons, we cannot estimate the possibility of loss or range of loss relating to these claims, and therefore we have not accrued a liability for these claims. Nevertheless, we could incur losses due to these claims in the future and those losses could be material.
In addition, on February 16, 2006, the Antitrust Division of the U.S. Department of Justice served us with a grand jury subpoena requesting production of documents relating to our sale of polyether polyol products. The other defendants in the Polyether Polyols cases have confirmed that they were also served with subpoenas in this matter. We cooperated fully with the investigation, and by letter dated December 16, 2007, the U.S. Department of Justice notified us that its investigation of possible antitrust violations by manufacturers of polyether polyol products has been closed.
MTBE Litigation
We have been named as a defendant in 14 lawsuits pending in multidistrict litigation in the U.S. District Court for the Southern District of New York alleging liability related to MTBE contamination in groundwater. Four of these cases were filed on March 23, 2007, one was filed on March 28, 2007, three were filed on April 5, 2007, one was filed on January 11, 2008, two were filed on September 4, 2008, one was filed November 7, 2008, one was filed November 18, 2008, and one was filed on December 19, 2008. Numerous other companies, including refiners, manufacturers and sellers of gasoline, as well as manufacturers of MTBE, have been named as defendants in these and many other cases currently pending in U.S. courts. The plaintiffs in the fourteen cases in which we have been
F-82
HUNTSMAN CORPORATION AND SUBSIDIARIES
HUNTSMAN INTERNATIONAL LLC AND SUBSIDIARIES
NOTES TO CONSOLIDATED FINANCIAL STATEMENTS (Continued)
22. COMMITMENTS AND CONTINGENCIES (Continued)
named are municipal water districts, a regional water supply authority, and municipal corporations that claim that defendants' conduct has caused MTBE contamination of their groundwater. The plaintiffs seek injunctive relief, such as monitoring and abatement, compensatory damages, punitive damages and attorney fees. At this time, we have insufficient information to meaningfully assess our potential exposure in these cases and therefore we have not accrued a liability for these claims. We believe that our liability in these cases, if any, would likely be covered, at least in part, by insurance and/or by indemnity agreements with prior owners.
Shareholder Litigation
From July 5 to July 13, 2007, four putative shareholder class action complaints were filed against our Company and our directors alleging breaches of fiduciary duty in connection with our then-proposed sale to Basell and the receipt of a superior proposal from Hexion. Three actions were filed in Delaware: Cohen v. Archibald, et al., No. 3070, in the Court of Chancery for the State of Delaware (filed July 5, 2007); Augenstein v. Archibald, et al., No. 3076, in the Court of Chancery for the State of Delaware (filed July 9, 2007); and Murphy v. Huntsman, et al., No. 3094, in the Court of Chancery for the State of Delaware (filed July 13, 2007). Another action was filed in Texas: Schwoegler v. Huntsman Corporation, et al., Cause No. 07-07-06993-CV, in the 9th Judicial District Court of Montgomery County, Texas (filed July 6, 2007). As subsequently amended, these lawsuits together allege that we and our directors breached fiduciary duties to the stockholders by, among other things, engaging in an unfair sales process, approving an unfair price per share for the Merger with Hexion, and making inadequate disclosures to stockholders, and that Basell, Hexion and MatlinPatterson entities aided and abetted these breaches of fiduciary duty. The lawsuits sought to enjoin the stockholder vote on the Merger.
On September 20, 2007, the parties entered into a Memorandum of Understanding with plaintiffs' counsel in the Delaware and Texas actions to settle these four lawsuits. As part of the proposed settlement, the defendants deny all allegations of wrongdoing, but we agreed to make certain additional disclosures in the final proxy statement that was mailed to our stockholders on or about September 14, 2007. In connection with the settlement, the parties also reached an agreement with respect to any application that the plaintiffs' counsel will make for an award of customary attorneys' fees and expenses to be paid following the completion of the Merger.
The Memorandum of Understanding is now null and void and of no force and effect because the Merger was not consummated. The Texas action has been voluntarily dismissed, but there has been no further developments in the Delaware actions at this time.
A fifth putative shareholder class action was filed against the Company and three of its officers on August 12, 2008 in the United States District Court for the District of Utah alleging, among other things, that the defendants failed to disclose material adverse facts about the Company's financial well-being, business relationships and prospects during the period from June 26, 2007 to June 18, 2008 in violation of Section 10(b) of the Securities and Exchange Act of 1934 and Rule 10b-5. Prior to any further activity in the case, the action was voluntarily dismissed October 3, 2008.
F-83
HUNTSMAN CORPORATION AND SUBSIDIARIES
HUNTSMAN INTERNATIONAL LLC AND SUBSIDIARIES
NOTES TO CONSOLIDATED FINANCIAL STATEMENTS (Continued)
22. COMMITMENTS AND CONTINGENCIES (Continued)
Port Arthur Plant Fire Insurance Litigation
On August 31, 2007, an action was brought against our Company and IRIC, our captive insurer, in the United States District Court for the Southern District of Texas, by the Reinsurers under the property insurance policy issued by IRIC to our Company for the period covering the April 29, 2006 fire at our manufacturing facility in Port Arthur, Texas. The action seeks to compel our Company and IRIC to arbitrate with the Reinsurers to resolve disputes related to the claim for losses caused by the fire or, in the alternative, to declare judgment in favor of the Reinsurers. On September 26, 2008, the court denied motions to dismiss filed by our Company and IRIC, ordering the parties to engage in a short period of discovery on the issue of arbitrability. In a second and related action filed by our Company against IRIC in state court in Jefferson County, Texas, IRIC filed a third party petition against the Reinsurers, who then removed that action to the United States District Court for the Eastern District of Texas. Some of the Reinsurers filed answers and motions to compel arbitration, to stay these proceedings, and to change venue to the United States District Court for the Southern District of Texas in order to consolidate the two actions. Our Company filed a motion to remand that action to the state court and opposition to the Reinsurers' motions in that action. On April 23, 2008, the United States District Court for the Eastern District of Texas transferred the case to the United States District Court for the Southern District of Texas. On September 26, 2008, the court denied our Company's motion to remand that suit to the state court in which it was filed. Pursuant to a December 29, 2008 agreement among the parties to the actions referenced above: (1) a mediation is scheduled for February 24-25, 2009, (2) if the disputes are not fully resolved in mediation, the parties will submit all coverage and quantum issues to a three-arbitrator panel in August of 2009, with a binding award to be entered by September 30, 2009, (3) the Reinsurers paid an additional $40 million on the claim of the Company on December 29, 2008 and agreed that all monies paid by the participating Reinsurers on the claim to date are nonrefundable, (4) the Company waived its noncontractual claims against the Reinsurers, (5) the first action referenced above will be stayed pending final resolution and entry of judgment, and (6) the second action reference above will be dismissed. Reinsurers responsible for a small percentage of our remaining claim were not parties to the two lawsuits and are not parties to the agreement, thus we may need to pursue them separately for their pro rata shares of the unpaid claim. Our Company has paid its deductible on the claim of $60 million and has been paid $365 million to date by the Reinsurers. As of December 31, 2008, our Company has claimed an additional approximately $235 million as presently due and owing and unpaid under the Policy for losses caused by the fire, and anticipates filing additional claims. For more information, see "Note 24. Casualty Losses and Insurance Recoveries—Port Arthur, Texas Plant Fire."
Other Proceedings
We are a party to various other proceedings instituted by private plaintiffs, governmental authorities and others arising under provisions of applicable laws, including various environmental, products liability and other laws. Except as otherwise disclosed in this report, we do not believe that the outcome of any of these matters will have a material adverse effect on our financial condition, results of operations or liquidity.
F-84
HUNTSMAN CORPORATION AND SUBSIDIARIES
HUNTSMAN INTERNATIONAL LLC AND SUBSIDIARIES
NOTES TO CONSOLIDATED FINANCIAL STATEMENTS (Continued)
22. COMMITMENTS AND CONTINGENCIES (Continued)
GUARANTEES
On September 19, 2003, SLIC obtained secured financing for the construction of production facilities. SLIC obtained various committed loans in the aggregate amount of approximately $230 million in U.S. dollar equivalents. As of December 31, 2008, there were $68 million and RMB 840 million (approximately $123 million) in outstanding borrowings under these facilities. The interest rate on these facilities is LIBOR plus 0.48% for U.S. dollar borrowings and 90% of the Peoples Bank of China rate for RMB borrowings. The loans are secured by substantially all the assets of SLIC and will be paid in 16 semiannual installments (of which 13 installments remain), which began on June 30, 2007. We unconditionally guarantee 35% of any amounts due and unpaid by SLIC under the loans described above (except for the VAT facility which is not guaranteed). Our guarantee remains in effect until SLIC has met certain conditions. The conditions outstanding include completion of the building and equipment mortgage registrations, which are progressing as planned, and maintaining a debt service coverage ratio of at least 1:1 at the time such registrations are completed. We have estimated that the fair value of this guarantee is nil as of the closing of the transaction and, accordingly, no amounts have been recorded.
Our unconsolidated Saudi Arabia joint venture with Zamil Group obtained various loan commitments in the aggregate amount of approximately $195 million in U.S. dollar equivalents, of which $45 million was drawn under a short term bridge loan facility as of December 31, 2008. We have provided certain guarantees of approximately $14 million for these commitments, and our guarantees will terminate upon completion of the project and satisfaction of certain other conditions. We have estimated that the fair value of such guarantees was nil as of the closing date of this transaction and, accordingly, no amounts have been recorded.
23. ENVIRONMENTAL, HEALTH AND SAFETY MATTERS
General
We are subject to extensive federal, state, local and foreign laws, regulations, rules and ordinances relating to safety, pollution, protection of the environment and the generation, storage, handling, transportation, treatment, disposal and remediation of hazardous substances and waste materials. In the ordinary course of business, we are subject to frequent environmental inspections and monitoring and occasional investigations by governmental enforcement authorities. In addition, our production facilities require operating permits that are subject to renewal, modification and, in certain circumstances, revocation. Actual or alleged violations of safety laws, environmental laws or permit requirements could result in restrictions or prohibitions on plant operations, substantial civil or criminal sanctions, as well as, under some environmental laws, the assessment of strict liability and/or joint and several liability. Moreover, changes in environmental regulations could inhibit or interrupt our operations, or require us to modify our facilities or operations. Accordingly, environmental or regulatory matters may cause us to incur significant unanticipated losses, costs or liabilities.
EHS Systems
We are committed to achieving and maintaining compliance with all applicable EHS legal requirements, and we have developed policies and management systems that are intended to identify
F-85
HUNTSMAN CORPORATION AND SUBSIDIARIES
HUNTSMAN INTERNATIONAL LLC AND SUBSIDIARIES
NOTES TO CONSOLIDATED FINANCIAL STATEMENTS (Continued)
23. ENVIRONMENTAL, HEALTH AND SAFETY MATTERS (Continued)
the multitude of EHS legal requirements applicable to our operations, enhance compliance with applicable legal requirements, ensure the safety of our employees, contractors, community neighbors and customers and minimize the production and emission of wastes and other pollutants. Although EHS legal requirements are constantly changing and are frequently difficult to comply with, these EHS management systems are designed to assist us in our compliance goals while also fostering efficiency and improvement and minimizing overall risk to us.
EHS Capital Expenditures
We may incur future costs for capital improvements and general compliance under EHS laws, including costs to acquire, maintain and repair pollution control equipment. For the years ended December 31, 2008, 2007 and 2006, our capital expenditures for EHS matters totaled $58 million, $69 million and $53 million, respectively. Since capital expenditures for these matters are subject to evolving regulatory requirements and depend, in part, on the timing, promulgation and enforcement of specific requirements, we cannot provide assurance that our recent expenditures will be indicative of future amounts required under EHS laws.
Remediation Liabilities
We have incurred, and we may in the future incur, liability to investigate and clean up waste or contamination at our current or former facilities or facilities operated by third parties at which we may have disposed of waste or other materials. Similarly, we may incur costs for the cleanup of wastes that were disposed of prior to the purchase of our businesses. Under some circumstances, the scope of our liability may extend to damages to natural resources.
Under the CERCLA and similar state laws, a current or former owner or operator of real property may be liable for remediation costs regardless of whether the release or disposal of hazardous substances was in compliance with law at the time it occurred, and a current owner or operator may be liable regardless of whether it owned or operated the facility at the time of the release. We have been notified by third parties of claims against us for cleanup liabilities at approximately 10 former facilities or third party sites, including, but not limited to, sites listed under CERCLA. Based on current information and past experiences at other CERCLA sites, we do not expect any of these third party claims to result in material liability to us.
In addition, under the RCRA and similar state laws, we may be required to remediate contamination originating from our properties as a condition to our hazardous waste permit. Some of our manufacturing sites have an extended history of industrial chemical manufacturing and use, including on-site waste disposal. We are aware of soil, groundwater or surface contamination from past operations at some of our sites, and we may find contamination at other sites in the future. For example, our Port Neches, Texas, and Geismar, Louisiana, facilities are the subject of ongoing remediation requirements under RCRA authority.
In June of 2006, an agreement was reached between the local regulatory authorities and our advanced materials site in Pamplona, Spain to relocate our manufacturing operations in order to facilitate new urban development desired by the city. Subsequently, as required by the authorities, soil and groundwater sampling was performed and followed by a quantitative risk assessment. Although
F-86
HUNTSMAN CORPORATION AND SUBSIDIARIES
HUNTSMAN INTERNATIONAL LLC AND SUBSIDIARIES
NOTES TO CONSOLIDATED FINANCIAL STATEMENTS (Continued)
23. ENVIRONMENTAL, HEALTH AND SAFETY MATTERS (Continued)
unresolved at this time, some level of remediation of site contamination may be required in the future, but the estimated cost is unknown because the remediation approach and timing has not been determined.
By letter dated March 7, 2006, our Base Chemicals and Polymers facility in West Footscray, Australia, was issued a clean-up notice by the Australian (Victorian) EPA. The agency was concerned about soil and groundwater contamination emanating from the site. Although we fulfilled all initial requirements under the clean-up notice, the agency revoked the original clean-up notice on September 4, 2007 and issued a revised clean-up notice granting an extension due to "the complexity of contamination issues" at the site. The revised clean-up notice reflects the requirement for a more detailed program, with a deadline for the submission of a detailed site remediation action plan by March 31, 2009. We expect to respond to the EPA addressing their revised concerns. We can provide no assurance that the EPA will agree with our proposed plan or will not seek to institute additional requirements for the site. However, we do not believe the costs to us associated with this issue will be material.
In many cases, our potential liability arising from historical contamination is based on operations and other events occurring prior to our ownership of a business or specific facility. In these situations, we frequently obtained an indemnity agreement from the prior owner addressing remediation liabilities arising from pre-closing conditions. We have successfully exercised our rights under these contractual covenants for a number of sites and, where applicable, mitigated our ultimate remediation liability. We cannot assure you, however, that all of such matters will be subject to indemnity, that the prior owner will honor its indemnity or that our existing indemnities will be sufficient to cover our liabilities for such matters.
Based on available information and the indemnification rights we believe are likely to be available, we believe that the costs to investigate and remediate known contamination will not have a material adverse effect on our financial condition, results of operations or cash flows. However, if such indemnities are unavailable or do not fully cover the costs of investigation and remediation or we are required to contribute to such costs, and if such costs are material, then such expenditures may have a material adverse effect on our financial condition, results of operations or cash flows. At the current time, we are unable to estimate the full cost, exclusive of indemnification benefits, to remediate any of the known contamination sites.
Environmental Reserves
We have accrued liabilities relating to anticipated environmental cleanup obligations, site reclamation and closure costs and known penalties. Liabilities are recorded when potential liabilities are either known or considered probable and can be reasonably estimated. Our liability estimates are based upon requirements placed upon the company by regulators, available facts, existing technology and past experience. The environmental liabilities do not include amounts recorded as asset retirement obligations. We had accrued $7 million and $8 million for environmental liabilities as of December 31, 2008 and 2007, respectively. Of these amounts, $4 million and $5 million were classified as accrued liabilities in our consolidated balance sheets as of December 31, 2008 and 2007, respectively, and $3 million and $3 million were classified as other noncurrent liabilities in our consolidated balance sheets as of December 31, 2008 and December 31, 2007, respectively. In certain cases, our remediation
F-87
HUNTSMAN CORPORATION AND SUBSIDIARIES
HUNTSMAN INTERNATIONAL LLC AND SUBSIDIARIES
NOTES TO CONSOLIDATED FINANCIAL STATEMENTS (Continued)
23. ENVIRONMENTAL, HEALTH AND SAFETY MATTERS (Continued)
liabilities may be payable over periods of up to 30 years. We may incur losses for environmental remediation in excess of the amounts accrued; however, we are not able to estimate the amount or range of such potential excess.
Regulatory Developments
Under the EU's integrated pollution prevention and control directive, EU member governments adopted rules and implemented a cross media (air, water and waste) environmental permitting program for individual facilities. Although the EU countries varied in their respective implementation of the IPPC permit program, we submitted on a timely basis all necessary IPPC permit applications required and received completed permits from the applicable government agencies. Based upon a review of those permits, the costs of compliance with the IPPC permit program are not material to our financial condition, results of operations or cash flows.
In December 2006, the EU parliament and EU council approved a new EU regulatory framework for chemicals called "REACH" (Registration, Evaluation and Authorization of Chemicals). REACH took effect on June 1, 2007, and the program it establishes will be phased in over 11 years. Under the regulation, companies that manufacture or import more than one ton of a chemical substance per year will be required to register such chemical substances and isolated intermediates in a central database. Use authorizations will be granted for a specific chemical if the applicants can show that any risk in using the chemical can be adequately controlled or, where there are no suitable alternatives available, if the applicant can demonstrate that the social and economic benefits of using the chemical outweigh the risks. In addition, specified uses of some hazardous substances may be restricted. Furthermore, all applicants will have to study the availability of alternative chemicals. If an alternative is available, an applicant will have to submit a "substitution" plan to the regulatory agency. The regulatory agency will only authorize persistent bio-accumulative and toxic substances if an alternative chemical is not available. The registration, evaluation and authorization phases of the program will require expenditures and resource commitments in order to, for example, develop information technology tools, generate data, prepare and submit dossiers for substance registration, participate in consortia, obtain legal advice and reformulate products, if necessary. We have established a cross-business European REACH team that is working closely with our businesses to identify and list all substances purchased, manufactured or imported by or for us into the EU. Our pre-registration REACH compliance began on June 1, 2008, utilizing internal resources at nominal expense, and we met all chemical pre-registration requirements by the November 30, 2008 statutory deadline. We are currently proceeding with the registration of the high-volume and high-priority chemicals under the program. Although the total long-term cost for REACH compliance is not estimable at this time, we spent approximately $2 million and $3 million during the years ended December 31, 2008 and 2007, respectively, on REACH compliance.
Greenhouse Gas Regulation
In the EU and other jurisdictions committed to compliance with the Kyoto Protocol to the United Nations Framework Convention on Climate Change, there is an increasing likelihood that our manufacturing sites will be affected in some way over the next few years by regulation or taxation of GHG emissions. In addition, although the U.S. is not a signatory to the Convention, several states, including California, are implementing their own GHG regulatory programs, and a federal program in
F-88
HUNTSMAN CORPORATION AND SUBSIDIARIES
HUNTSMAN INTERNATIONAL LLC AND SUBSIDIARIES
NOTES TO CONSOLIDATED FINANCIAL STATEMENTS (Continued)
23. ENVIRONMENTAL, HEALTH AND SAFETY MATTERS (Continued)
the U.S. is likely for the future. Several of our sites are subject to existing GHG legislation, but few have experienced or anticipate significant cost increases as a result, although it is likely that GHG emission restrictions will increase over time. Potential consequences of such restrictions include capital requirements to modify assets used to meet GHG restriction and/or increases in energy costs above the level of general inflation, as well as direct compliance costs. Currently, however, it is not possible to estimate the likely financial impact of potential future regulation on any of our sites.
Chemical Facility Anti-terrorism Rulemaking
The Department of Homeland Security issued the final rule of their "Chemical Facility Anti-Terrorism Standard" in 2007. The initial phase of the rule required all chemical facilities in the U.S. to evaluate their facilities against the DHS Appendix A list of "Chemicals of Interest." Facilities which have specified chemicals in designated quantities on the Appendix A list were required to submit a "Top Screen" to DHS in 2008. A Top Screen is a questionnaire completed by a facility having Chemicals of Interest in designated threshold quantities. In early 2008, we submitted Top Screens from several of our facilities. After reviewing the Top Screens, DHS determined that some of our sites were "High Risk" facilities. As a result, we were required to perform Security Vulnerability Assessments at the High Risk sites. The SVAs were completed and sent to DHS during the fourth quarter of 2008. We are currently awaiting the final risk ranking from the DHS, based on their assessment of the SVAs. Any of the sites which are still considered High Risk after the DHS assessment will be required to develop site security plans based on a list of DHS risk-based performance standards. We are unable to determine the cost of security enhancements at our High Risk sites until the site security plans are developed. We anticipate this phase of the rule to be completed by mid-2009.
MTBE Developments
We produce MTBE, an oxygenate that is blended with gasoline to reduce vehicle air emissions and to enhance the octane rating of gasoline. Litigation or legislative initiatives restricting the use of MTBE in gasoline may subject us or our products to environmental liability or materially adversely affect our sales and costs. Because MTBE has contaminated some water supplies, its use has become controversial in the U.S. and elsewhere, and its use has been effectively eliminated in the U.S. market. Since 2007, we have marketed MTBE, either directly or through third parties, only to gasoline additive customers located outside the U.S., although there are additional costs associated with such outside-U.S. sales which may result in decreased profitability compared to historical sales in the U.S. We may also elect to use all or a portion of our precursor tertiary butyl alcohol to produce saleable products other than MTBE. If we opt to produce products other than MTBE, necessary modifications to our facilities will require significant capital expenditures and the sale of such other products may produce a lower level of cash flow than that historically produced from the sale of MTBE.
Numerous companies, including refiners, manufacturers and sellers of gasoline, as well as manufacturers of MTBE, have been named as defendants in more than 150 cases in U.S. courts that allege MTBE contamination in groundwater. Many of these cases were settled after the parties engaged in mediation supervised by a court-appointed special settlement master. Beginning in March 2007 and continuing through December 2008, we have been named as a defendant in fourteen of these lawsuits, all of which are still pending. For more information, see "Note 22. Commitment and Contingencies—Legal Matters—MTBE Litigation." The plaintiffs in the MTBE groundwater contamination cases
F-89
HUNTSMAN CORPORATION AND SUBSIDIARIES
HUNTSMAN INTERNATIONAL LLC AND SUBSIDIARIES
NOTES TO CONSOLIDATED FINANCIAL STATEMENTS (Continued)
23. ENVIRONMENTAL, HEALTH AND SAFETY MATTERS (Continued)
generally seek compensatory damages, punitive damages, injunctive relief, such as monitoring and abatement, and attorney fees. We currently have insufficient information to meaningfully assess our potential exposure in these cases. We believe that some of our liability in these cases, if any, is likely covered by insurance and/or indemnity agreements with prior owners. It is possible that we could be named as a defendant in additional existing or future MTBE contamination cases. We cannot provide assurances that adverse results against us in existing or future MTBE contamination cases will not have a material adverse effect on our business, results of operations and financial position.
24. CASUALTY LOSSES AND INSURANCE RECOVERIES
PORT ARTHUR, TEXAS PLANT FIRE
On April 29, 2006, our Port Arthur, Texas olefins manufacturing plant (which we sold in November 2007) experienced a major fire. With the exception of cyclohexane operations at the site, which were restarted in June 2006, the operations at the site were shutdown until the fourth quarter of 2007. The Port Arthur manufacturing plant is covered by property damage and business interruption insurance. With respect to coverage for this outage, the deductible for property damage is $10 million and business interruption coverage does not apply for the first 60 days, subject to a combined deductible for property damage and business interruption of $60 million.
Through December 31, 2008, we received partial recovery advances on this loss totaling $365 million, including $40 million received in December 2008. We have claimed an additional approximately $235 million as of December 31, 2008 as presently due and owing and unpaid under the insurance policy for losses caused by the fire, and anticipate filing additional claims. On December 29, 2008, we reached a partial settlement with certain of the Reinsurers whereby we received a partial claim reimbursement of $40 million and we and the Reinsurers agreed to dismiss all legal suits arising from this insured loss and to participate in non-binding mediation scheduled to occur in February 2009 and, if the non-binding mediation is not successful, in binding arbitration targeted to occur in the later half of 2009. Also as part of the Partial Fire Insurance Settlement, the Reinsurers that are parties to such agreement agreed that none of their respective portion, or $340 million of the $365 million of partial recovery advances received to date are refundable (those insurers representing the other $25 million portion received to date were not required to enter into this agreement because their coverage limits had been exhausted at much lower levels).
Through December 31, 2008, we had recorded $190 million of repair and maintenance costs and fixed costs incurred during the business interruption period and had recognized in earnings a corresponding amount of the partial recovery amounts. Prior to the Partial Fire Insurance Settlement, we had deferred recognition of the gain associated with partial recovery advances and these amounts were included in accrued liabilities on the accompanying consolidated balance sheets. As a result of the Partial Fire Insurance Settlement, we recognized a gain of $175 million in the fourth quarter of 2008 which represented all previously deferred insurance recovery gain amounts. The following table
F-90
HUNTSMAN CORPORATION AND SUBSIDIARIES
HUNTSMAN INTERNATIONAL LLC AND SUBSIDIARIES
NOTES TO CONSOLIDATED FINANCIAL STATEMENTS (Continued)
24. CASUALTY LOSSES AND INSURANCE RECOVERIES (Continued)
describes changes to the deferred insurance recovery gain during the years ended December 31, 2008, 2007 and 2006 (dollars in millions):
| |
2008 | 2007 | 2006 | |||||||
|---|---|---|---|---|---|---|---|---|---|---|
Balance at January 1 |
$ | 137 | $ | 94 | $ | — | ||||
Insurance recovery advances |
40 | 175 | 150 | |||||||
Incurrence of repair and maintenance costs during the period |
(2 | ) | (52 | ) | (17 | ) | ||||
Incurrence of fixed costs during the business interruption period |
— | (80 | ) | (39 | ) | |||||
Recognition of deferred gain in connection with the Partial Fire Insurance Settlement |
(175 | ) | — | — | ||||||
Balance as of December 31 |
$ | — | $ | 137 | $ | 94 | ||||
Future collections on this insured loss, if any, will represent additional income for us upon final settlement.
2005 U.S. GULF COAST STORMS
On September 22, 2005, we sustained property damage at our Port Neches and Port Arthur, Texas facilities as a result of a hurricane. We maintain customary insurance coverage for property damage and business interruption. With respect to coverage of these losses, the deductible for property damage was $10 million per site, while business interruption coverage does not apply for the first 60 days.
During 2007 and 2006, we received insurance recovery advances of $38 million related to the 2005 Gulf Coast storms. On December 12, 2008, the insurers agreed to pay an additional $3 million of insurance recovery advances related to the 2005 Gulf Coast storms, of which $2 million was received as of December 31, 2008. We and our insurers are working to reach a settlement on the remainder of the insurance claim, and we can provide no assurance with respect to the ultimate resolution of this matter. Any future collections will represent income for us upon final settlement.
25. STOCKHOLDERS' EQUITY
On February 16, 2005, we completed an initial public offering of 55,681,819 shares of our common stock sold by us and 13,579,546 share of our common stock sold by a selling stockholder, in each case at a price to the public of $23 per share, and 5,750,000 shares of our mandatory convertible preferred stock sold by us at a price to the public of $50 per share. On February 16, 2008, the mandatory convertible preferred stock converted into 12,082,475 shares of our common stock. See "Note 2. Summary of Significant Accounting Policies—Net Income (Loss) per Share."
DIVIDENDS ON COMMON STOCK
On March 31, 2008, June 30, 2008, September 30, 2008 and December 31, 2008 we paid dividends of approximately $23 million each, for a total of $93 million, or $0.10 per share each, to common stockholders of record as of March 14, 2008, June 16, 2008, September 15, 2008 and December 15, 2008, respectively. On March 30, 2007, June 29, 2007, September 28, 2007 and December 31, 2007, we paid cash dividends of approximately $22 million each, or $0.10 per share each, for a total of
F-91
HUNTSMAN CORPORATION AND SUBSIDIARIES
HUNTSMAN INTERNATIONAL LLC AND SUBSIDIARIES
NOTES TO CONSOLIDATED FINANCIAL STATEMENTS (Continued)
25. STOCKHOLDERS' EQUITY (Continued)
$88 million, to common stockholders of record as of March 15, 2007, June 15, 2007, September 15, 2007 and December 15, 2007, respectively.
DIVIDENDS ON MANDATORY CONVERTIBLE PREFERRED STOCK
In connection with the initial public offering of our 5% mandatory convertible preferred stock on February 16, 2005, we declared all dividends that will be payable on such preferred stock from the issuance through the mandatory conversion date, which was February 16, 2008. Accordingly, we recorded dividends payable of $43 million and a corresponding charge to net loss available to common stockholders during the year ended December 31, 2005. As of December 31, 2007, we had $4 million invested in government securities that were restricted to be used to satisfy our dividend payment obligations through the mandatory conversion date. We paid the final dividend in cash on February 16, 2008.
26. STOCK-BASED COMPENSATION PLAN
Under the Huntsman Stock Incentive Plan (the "Stock Incentive Plan"), a plan approved by stockholders, we may grant non-qualified stock options, incentive stock options, stock appreciation rights, restricted stock, phantom stock, performance awards and other stock-based awards to our employees and directors and to employees and directors of our subsidiaries, provided that incentive stock options may be granted solely to employees. The terms of the grants are fixed at the grant date. As of December 31, 2008, we were authorized to grant up to 21,590,909 shares under the Stock Incentive Plan. Option awards have a maximum contractual term of 10 years and generally must have an exercise price at least equal to the market price of our common stock on the date the option award is granted. Stock-based awards generally vest over a three-year period.
The compensation cost from continuing operations for the Stock Incentive Plan was $20 million, $25 million, and $16 million for the years ended December 31, 2008, 2007 and 2006, respectively. The total income tax benefit recognized in the statement of operations for stock-based compensation arrangements was $6 million, $8 million and nil for the years ended December 31, 2008, 2007 and 2006, respectively.
The fair value of each stock option award is estimated on the date of grant using the Black-Scholes valuation model that uses the assumptions noted in the following table. Because we only became a publicly-held company in February 2005, expected volatilities were based on implied volatilities from the stock of comparable companies and other factors. The expected term of options granted was estimated based on the contractual term of the instruments and employees' expected exercise and post-vesting employment termination behavior. The risk-free rate for periods within the contractual life of the option was based on the U.S. Treasury yield curve in effect at the time of grant.
| |
Year ended December 31, | ||||||||
|---|---|---|---|---|---|---|---|---|---|
| |
2008 | 2007 | 2006 | ||||||
Dividend yield |
NA | 1.9 | % | — | |||||
Expected volatility |
NA | 20.8 | % | 23.1 | % | ||||
Risk-free interest rate |
NA | 4.7 | % | 4.6 | % | ||||
Expected life of stock options granted during the period |
NA | 6.6 years | 6.6 years | ||||||
During the year ended December 31, 2008, no stock options were granted.
F-92
HUNTSMAN CORPORATION AND SUBSIDIARIES
HUNTSMAN INTERNATIONAL LLC AND SUBSIDIARIES
NOTES TO CONSOLIDATED FINANCIAL STATEMENTS (Continued)
26. STOCK-BASED COMPENSATION PLAN (Continued)
STOCK OPTIONS
A summary of stock option activity under the Stock Incentive Plan as of December 31, 2008 and changes during the year then ended is presented below:
Option Awards
|
Shares | Weighted Average Exercise Price |
Weighted Average Remaining Contractual Term |
Aggregate Intrinsic Value |
|||||||||
|---|---|---|---|---|---|---|---|---|---|---|---|---|---|
| |
(000) |
|
(Years) |
($000) |
|||||||||
Outstanding at January 1, 2008 |
6,327 | $ | 21.32 | ||||||||||
Granted |
— | — | |||||||||||
Exercised |
— | — | |||||||||||
Forfeited |
(192 | ) | 20.96 | ||||||||||
Outstanding at December 31, 2008 |
6,135 | 21.33 | 7.1 | $ | — | ||||||||
Exercisable at December 31, 2008 |
4,236 | 21.67 | 6.8 | — | |||||||||
The weighted-average grant-date fair value of stock options granted during the years ended December 31, 2007 and 2006 was $5.15 and $7.27 per option, respectively. As of December 31, 2008, there was $5 million of total unrecognized compensation cost related to nonvested stock option arrangements granted under the Stock Incentive Plan. That cost is expected to be recognized over a weighted-average period of approximately nine months.
The total intrinsic value of stock options exercised during the year ended December 31, 2007 was not significant. During the years ended December 31, 2008 and 2006 there were no stock options exercised.
NONVESTED SHARES
Nonvested shares granted under the Stock Incentive Plan consist of restricted stock, which is accounted for as an equity award, and phantom stock, which is accounted for as a liability award
F-93
HUNTSMAN CORPORATION AND SUBSIDIARIES
HUNTSMAN INTERNATIONAL LLC AND SUBSIDIARIES
NOTES TO CONSOLIDATED FINANCIAL STATEMENTS (Continued)
26. STOCK-BASED COMPENSATION PLAN (Continued)
because it can be settled in either stock or cash. A summary of the status of our nonvested shares as of December 31, 2008 and changes during the years then ended is presented below:
| |
Equity Awards | Liability Awards | |||||||||||
|---|---|---|---|---|---|---|---|---|---|---|---|---|---|
| |
Shares | Weighted Average Grant- Date Fair Value |
Shares | Weighted Average Grant- Date Fair Value |
|||||||||
| |
(000) |
|
(000) |
|
|||||||||
Nonvested at January 1, 2008 |
1,007 | $ | 21.12 | 145 | $ | 20.76 | |||||||
Granted |
492 | 24.56 | 108 | 24.56 | |||||||||
Vested |
(537 | )(1) | 21.59 | (58 | ) | 21.03 | |||||||
Forfeited |
(32 | ) | 22.37 | (24 | ) | 22.57 | |||||||
Nonvested at December 31, 2008 |
930 | 22.62 | 171 | 22.82 | |||||||||
As of December 31, 2008, there was $13 million of total unrecognized compensation cost related to nonvested share compensation arrangements granted under the Stock Incentive Plan. That cost is expected to be recognized over a weighted-average period of approximately 18 months. The value of share awards that vested during the years ended December 31, 2008, 2007 and 2006 was $13 million, $9 million and $6 million, respectively.
F-94
HUNTSMAN CORPORATION AND SUBSIDIARIES
HUNTSMAN INTERNATIONAL LLC AND SUBSIDIARIES
NOTES TO CONSOLIDATED FINANCIAL STATEMENTS (Continued)
27. OTHER COMPREHENSIVE (LOSS) INCOME
Other comprehensive income consisted of the following (dollars in millions):
Huntsman Corporation
| |
December 31, | |||||||||||||||
|---|---|---|---|---|---|---|---|---|---|---|---|---|---|---|---|---|
| |
2008 | 2007 | 2006 | |||||||||||||
| |
Accumulated income (loss) |
Income (loss) |
Accumulated income (loss) |
Income (loss) |
Income (loss) |
|||||||||||
Foreign currency translation adjustments, net of tax of $16 and $5 as of December 31, 2008 and 2007, respectively |
$ | 204 | $ | (176 | ) | $ | 380 | $ | 134 | $ | 168 | |||||
Pension and other postretirement benefits adjustments, net of tax of $158 and $18 as of December 31, 2008 and 2007, respectively |
(713 | ) | (569 | ) | (144 | ) | 184 | (23 | ) | |||||||
Other comprehensive income of unconsolidated affiliates |
9 | — | 9 | 2 | — | |||||||||||
Other |
11 | (1 | ) | 12 | (2 | ) | 4 | |||||||||
Total |
$ | (489 | ) | $ | (746 | ) | $ | 257 | $ | 318 | $ | 149 | ||||
Huntsman International
| |
December 31, | |||||||||||||||
|---|---|---|---|---|---|---|---|---|---|---|---|---|---|---|---|---|
| |
2008 | 2007 | 2006 | |||||||||||||
| |
Accumulated income (loss) |
Income (loss) |
Accumulated income (loss) |
Income (loss) |
Income (loss) |
|||||||||||
Foreign currency translation adjustments, net of tax of $3 and $(8) as of December 31, 2008 and 2007, respectively |
$ | 202 | $ | (176 | ) | $ | 378 | $ | 136 | $ | 199 | |||||
Pension and other postretirement benefits adjustments, net of tax of $193 and $54 as of December 31, 2008 and 2007, respectively |
(771 | ) | (564 | ) | (207 | ) | 198 | (18 | ) | |||||||
Other comprehensive income of unconsolidated affiliates |
9 | — | 9 | 2 | — | |||||||||||
Other |
6 | (1 | ) | 7 | (2 | ) | 2 | |||||||||
Total |
$ | (554 | ) | $ | (741 | ) | $ | 187 | $ | 334 | $ | 183 | ||||
During 2006, $49 million of foreign currency translation adjustments were reclassified to loss on disposal of discontinued operations related to the U.K. Petrochemicals Disposition.
The adoption of SFAS No. 158 and related pension adjustments in 2006 included the effect of the calculation of the additional minimum pension liability prior to the adoption of the SFAS No. 158, which is included in other comprehensive (loss) income, as well as the net effect of the adoption of SFAS No. 158, which is a direct adjustment to accumulated other comprehensive (loss) income.
F-95
HUNTSMAN CORPORATION AND SUBSIDIARIES
HUNTSMAN INTERNATIONAL LLC AND SUBSIDIARIES
NOTES TO CONSOLIDATED FINANCIAL STATEMENTS (Continued)
27. OTHER COMPREHENSIVE (LOSS) INCOME (Continued)
Items of other comprehensive (loss) income of our Company and our consolidated affiliates have been recorded net of tax, with the exception of the foreign currency translation adjustments related to subsidiaries with earnings permanently reinvested. The tax effect is determined based upon the jurisdiction where the income or loss was recognized and is net of valuation allowances that have been recorded
28. RELATED PARTY TRANSACTIONS
Our accompanying consolidated financial statements include the following transactions with our affiliates not otherwise disclosed (dollars in millions):
| |
Year ended December 31, | ||||||||||
|---|---|---|---|---|---|---|---|---|---|---|---|
| |
2008 | 2007 | 2006 | ||||||||
Sales to: |
|||||||||||
Unconsolidated affiliates |
$ | 98 | $ | 171 | $ | 109 | |||||
Inventory purchases from: |
|||||||||||
Unconsolidated affiliates |
299 | 224 | 145 | ||||||||
We have agreed with the Jon and Karen Huntsman Foundation, a private charitable foundation established by Jon M. and Karen H. Huntsman to further the charitable interests of the Huntsman family, that we will donate our Salt Lake City office building and our option to acquire an adjacent undeveloped parcel of land to the foundation free of debt. We have agreed to complete this donation on the earlier of November 30, 2009 or the date on which we occupy less than 20% of the two main floors of the Salt Lake City office building. Under certain circumstances, after we make this donation we will have the right, but not the obligation, to lease space in the Salt Lake City office building from the foundation.
Through May 2002, we paid the premiums on various life insurance policies for Jon M. Huntsman. These policies have been liquidated, and the cash values have been paid to Mr. Huntsman. Mr. Huntsman is indebted to us in the amount of approximately $2 million, which represents the insurance premiums paid on his behalf through May 2002. This amount is included in other noncurrent assets on the accompanying consolidated balance sheets. We have a consulting agreement with Mr. Huntsman pursuant to which he receives $950,000 per year.
Wayne A. Reaud, a member of our board of directors, is of counsel to the law firm of Reaud, Morgan & Quinn. We pay the firm $200,000 per year for legal services. Mr. Reaud has no interest in the firm or in the proceeds for current work done at the firm. As of counsel, the law firm provides Mr. Reaud with an office and certain secretarial services.
F-96
HUNTSMAN CORPORATION AND SUBSIDIARIES
HUNTSMAN INTERNATIONAL LLC AND SUBSIDIARIES
NOTES TO CONSOLIDATED FINANCIAL STATEMENTS (Continued)
29. OTHER OPERATING EXPENSE (INCOME)
Other operating expense (income) consisted of the following (dollars in millions):
| |
Year ended December 31, | ||||||||||
|---|---|---|---|---|---|---|---|---|---|---|---|
| |
2008 | 2007 | 2006 | ||||||||
Loss (gain) on sale of business/asset, net |
$ | 6 | $ | (70 | ) | $ | (92 | ) | |||
Foreign exchange losses |
12 | 14 | 1 | ||||||||
Bad debts |
6 | 3 | 6 | ||||||||
Legal and contract settlements—net |
— | 6 | — | ||||||||
Insurance recoveries |
— | (11 | ) | (35 | ) | ||||||
Other, net |
3 | 3 | 6 | ||||||||
Total other operating expense (income) |
$ | 27 | $ | (55 | ) | $ | (114 | ) | |||
30. OPERATING SEGMENT INFORMATION
We derive our revenues, earnings and cash flows from the manufacture and sale of a wide variety of differentiated and commodity chemical products. We have reported our operations through six segments: Polyurethanes, Materials and Effects, Performance Products, Pigments, Polymers and Base Chemicals. We have organized our business and derived our operating segments around differences in product lines.
The major products of each reportable operating segment are as follows:
Segment
|
Products | |
|---|---|---|
Polyurethanes |
MDI, PO, polyols, PG, TPU, aniline and MTBE | |
Materials and Effects |
epoxy resin compounds and formulations; cross-linking, matting and curing agents; epoxy, acrylic and polyurethane-based adhesives, tooling resin formulations, textile chemicals and dyes and APAO | |
Performance Products |
amines, surfactants, LAB, maleic anhydride, other performance chemicals, EG, olefins and technology licenses | |
Pigments |
titanium dioxide | |
Polymers(1) |
LDPE and LLDPE, polypropylene and EPS | |
Base Chemicals(1) |
olefins and cyclohexane | |
Corporate and Other |
Styrene |
Sales between segments are generally recognized at external market prices and are eliminated in consolidation. We use EBITDA to measure the financial performance of our global business units and
F-97
HUNTSMAN CORPORATION AND SUBSIDIARIES
HUNTSMAN INTERNATIONAL LLC AND SUBSIDIARIES
NOTES TO CONSOLIDATED FINANCIAL STATEMENTS (Continued)
30. OPERATING SEGMENT INFORMATION (Continued)
for reporting the results of our operating segments. This measure includes all operating items relating to the businesses. The EBITDA of operating segments excludes items that principally apply to our company as a whole. The revenues and EBITDA for each of our reportable operating segments are as follows (dollars in millions):
| |
December 31, | |||||||||||||
|---|---|---|---|---|---|---|---|---|---|---|---|---|---|---|
| |
2008 | 2007 | 2006 | |||||||||||
Net Sales: |
||||||||||||||
Polyurethanes |
$ | 4,055 | $ | 3,813 | $ | 3,457 | ||||||||
Materials and Effects |
2,395 | 2,419 | 1,792 | |||||||||||
Performance Products |
2,703 | 2,310 | 2,037 | |||||||||||
Pigments |
1,072 | 1,109 | 1,058 | |||||||||||
Corporate and Other |
159 | 155 | 538 | |||||||||||
Eliminations |
(169 | ) | (155 | ) | (151 | ) | ||||||||
Total |
$ | 10,215 | $ | 9,651 | $ | 8,731 | ||||||||
Huntsman Corporation: |
||||||||||||||
Segment EBITDA(1): |
||||||||||||||
Polyurethanes |
$ | 382 | $ | 592 | $ | 583 | ||||||||
Materials and Effects |
116 | 199 | 154 | |||||||||||
Performance Products |
278 | 202 | 208 | |||||||||||
Pigments |
17 | 51 | 113 | |||||||||||
Corporate and Other(2) |
550 | (342 | ) | (62 | ) | |||||||||
Subtotal |
1,343 | 702 | 996 | |||||||||||
Polymers(3) |
3 | (197 | ) | 121 | ||||||||||
Base Chemicals(3) |
183 | (130 | ) | (86 | ) | |||||||||
Total |
1,529 | 375 | 1,031 | |||||||||||
Interest expense, net |
(263 | ) | (286 | ) | (351 | ) | ||||||||
Income tax (expense) benefit—continuing operations |
(190 | ) | 12 | 50 | ||||||||||
Income tax (expense) benefit—discontinued operations |
(69 | ) | 140 | (35 | ) | |||||||||
Depreciation and amortization |
(398 | ) | (413 | ) | (465 | ) | ||||||||
Net income (loss) |
$ | 609 | $ | (172 | ) | $ | 230 | |||||||
Depreciation and Amortization: |
||||||||||||||
Polyurethanes |
$ | 153 | $ | 150 | $ | 142 | ||||||||
Materials and Effects |
47 | 43 | 47 | |||||||||||
Performance Products |
69 | 62 | 54 | |||||||||||
Pigments |
91 | 90 | 78 | |||||||||||
Polymers |
— | 22 | 45 | |||||||||||
Base Chemicals |
— | 11 | 58 | |||||||||||
Corporate and Other(2) |
38 | 35 | 41 | |||||||||||
Total |
$ | 398 | $ | 413 | $ | 465 | ||||||||
Capital Expenditures: |
||||||||||||||
Polyurethanes |
$ | 109 | $ | 120 | $ | 82 | ||||||||
Materials and Effects |
81 | 89 | 52 | |||||||||||
F-98
HUNTSMAN CORPORATION AND SUBSIDIARIES
HUNTSMAN INTERNATIONAL LLC AND SUBSIDIARIES
NOTES TO CONSOLIDATED FINANCIAL STATEMENTS (Continued)
30. OPERATING SEGMENT INFORMATION (Continued)
| |
December 31, | |||||||||||||
|---|---|---|---|---|---|---|---|---|---|---|---|---|---|---|
| |
2008 | 2007 | 2006 | |||||||||||
Performance Products |
149 | 148 | 89 | |||||||||||
Pigments |
69 | 104 | 40 | |||||||||||
Polymers |
— | 12 | 209 | |||||||||||
Base Chemicals |
— | 177 | 61 | |||||||||||
Corporate and Other(2) |
10 | 15 | 17 | |||||||||||
Total |
$ | 418 | $ | 665 | $ | 550 | ||||||||
Total Assets: |
||||||||||||||
Polyurethanes |
$ | 4,442 | $ | 4,650 | ||||||||||
Materials and Effects |
1,701 | 2,006 | ||||||||||||
Performance Products |
2,313 | 2,216 | ||||||||||||
Pigments |
1,474 | 1,589 | ||||||||||||
Corporate and Other(2) |
(1,872 | ) | (2,295 | ) | ||||||||||
Total |
$ | 8,058 | $ | 8,166 | ||||||||||
F-99
HUNTSMAN CORPORATION AND SUBSIDIARIES
HUNTSMAN INTERNATIONAL LLC AND SUBSIDIARIES
NOTES TO CONSOLIDATED FINANCIAL STATEMENTS (Continued)
30. OPERATING SEGMENT INFORMATION (Continued)
| |
December 31, | |||||||||||||
|---|---|---|---|---|---|---|---|---|---|---|---|---|---|---|
| |
2008 | 2007 | 2006 | |||||||||||
Huntsman International |
||||||||||||||
Segment EBITDA(1): |
||||||||||||||
Polyurethanes |
$ | 382 | $ | 592 | $ | 583 | ||||||||
Materials and Effects |
116 | 199 | 154 | |||||||||||
Performance Products |
278 | 202 | 208 | |||||||||||
Pigments |
17 | 51 | 113 | |||||||||||
Corporate and Other |
(236 | ) | (150 | ) | (61 | ) | ||||||||
Subotal |
557 | 894 | 997 | |||||||||||
Polymers(3) |
3 | (197 | ) | 121 | ||||||||||
Base Chemicals(3) |
183 | (130 | ) | (86 | ) | |||||||||
Total |
743 | 567 | 1,032 | |||||||||||
Interest expense, net |
(264 | ) | (287 | ) | (355 | ) | ||||||||
Income tax benefit (expense)—continuing operations |
2 | (41 | ) | 31 | ||||||||||
Income tax (expense) benefit—discontinued operations |
(69 | ) | 140 | (35 | ) | |||||||||
Depreciation and amortization |
(374 | ) | (391 | ) | (439 | ) | ||||||||
Net income (loss) |
$ | 38 | $ | (12 | ) | $ | 234 | |||||||
Depreciation and Amortization: |
||||||||||||||
Polyurethanes |
$ | 153 | $ | 150 | $ | 142 | ||||||||
Materials and Effects |
47 | 43 | 47 | |||||||||||
Performance Products |
69 | 62 | 54 | |||||||||||
Pigments |
91 | 90 | 78 | |||||||||||
Polymers |
— | 22 | 45 | |||||||||||
Base Chemicals |
— | 11 | 58 | |||||||||||
Corporate and Other(2) |
14 | 13 | 13 | |||||||||||
Total |
$ | 374 | $ | 391 | $ | 437 | ||||||||
Capital Expenditures: |
||||||||||||||
Polyurethanes |
$ | 109 | $ | 120 | $ | 82 | ||||||||
Materials and Effects |
81 | 89 | 52 | |||||||||||
Performance Products |
149 | 148 | 89 | |||||||||||
Pigments |
69 | 104 | 40 | |||||||||||
Polymers |
— | 12 | 209 | |||||||||||
Base Chemicals |
— | 177 | 61 | |||||||||||
Corporate and Other(2) |
10 | 15 | 17 | |||||||||||
Total |
$ | 418 | $ | 665 | $ | 550 | ||||||||
F-100
HUNTSMAN CORPORATION AND SUBSIDIARIES
HUNTSMAN INTERNATIONAL LLC AND SUBSIDIARIES
NOTES TO CONSOLIDATED FINANCIAL STATEMENTS (Continued)
30. OPERATING SEGMENT INFORMATION (Continued)
| |
December 31, | |
||||||||||||
|---|---|---|---|---|---|---|---|---|---|---|---|---|---|---|
| |
2008 | 2007 | |
|||||||||||
Total Assets: |
||||||||||||||
Polyurethanes |
$ | 4,442 | $ | 4,650 | ||||||||||
Materials and Effects |
1,701 | 2,006 | ||||||||||||
Performance Products |
2,313 | 2,216 | ||||||||||||
Pigments |
1,474 | 1,589 | ||||||||||||
Corporate and Other(2) |
(2,505 | ) | (2,366 | ) | ||||||||||
Total |
$ | 7,425 | $ | 8,095 | ||||||||||
F-101
HUNTSMAN CORPORATION AND SUBSIDIARIES
HUNTSMAN INTERNATIONAL LLC AND SUBSIDIARIES
NOTES TO CONSOLIDATED FINANCIAL STATEMENTS (Continued)
30. OPERATING SEGMENT INFORMATION (Continued)
and the EBITDA of our base chemicals business is included in the Base Chemicals segment EBITDA for all periods presented. For more information, see "Note 3. Discontinued Operations."
| |
December 31, | |||||||||||
|---|---|---|---|---|---|---|---|---|---|---|---|---|
| |
2008 | 2007 | 2006 | |||||||||
By Geographic Area |
||||||||||||
Revenues: |
||||||||||||
United States |
$ | 5,019 | $ | 4,788 | $ | 5,080 | ||||||
Netherlands |
2,401 | 2,173 | 1,947 | |||||||||
Other nations |
6,113 | 6,038 | 4,262 | |||||||||
Eliminations |
(3,318 | ) | (3,348 | ) | (2,558 | ) | ||||||
Total |
$ | 10,215 | $ | 9,651 | $ | 8,731 | ||||||
Long-lived assets(1): |
||||||||||||
Huntsman Corporation |
||||||||||||
United States |
$ | 1,601 | $ | 1,533 | ||||||||
Netherlands |
390 | 403 | ||||||||||
Other nations |
1,658 | 1,827 | ||||||||||
Total |
$ | 3,649 | $ | 3,763 | ||||||||
Huntsman International |
||||||||||||
United States |
$ | 1,418 | $ | 1,327 | ||||||||
Netherlands |
390 | 403 | ||||||||||
Other nations |
1,658 | 1,826 | ||||||||||
Total |
$ | 3,466 | $ | 3,556 | ||||||||
31. CONDENSED CONSOLIDATING FINANCIAL STATEMENTS—HUNTSMAN INTERNATIONAL
The following condensed consolidating financial statements present, in separate columns, financial information for the following: Huntsman International LLC (on a parent only basis), with its investment in subsidiaries recorded under the equity method; the Guarantors on a combined, and where appropriate, consolidated basis; and the non-guarantors on a combined, and where appropriate, consolidated basis. Additional columns present eliminating adjustments and consolidated totals as of December 31, 2008 and 2007 and for the years ended December 31, 2008, 2007 and 2006. There are no contractual restrictions limiting transfers of cash from guarantor subsidiaries to Huntsman International. Each of the Guarantors is 100% owned by Huntsman International and has fully and unconditionally guaranteed Huntsman International's outstanding notes on a joint and several basis.
F-102
HUNTSMAN CORPORATION AND SUBSIDIARIES
HUNTSMAN INTERNATIONAL LLC AND SUBSIDIARIES
NOTES TO CONSOLIDATED FINANCIAL STATEMENTS (Continued)
31. CONDENSED CONSOLIDATING FINANCIAL STATEMENTS—HUNTSMAN INTERNATIONAL (Continued)
HUNTSMAN INTERNATIONAL LLC AND SUBSIDIARIES
CONDENSED CONSOLIDATING BALANCE SHEETS
AS OF DECEMBER 31, 2008
(Dollars in Millions)
| |
Parent Company |
Guarantors | Non-guarantors | Eliminations | Consolidated Huntsman International LLC |
|||||||||||||
|---|---|---|---|---|---|---|---|---|---|---|---|---|---|---|---|---|---|---|
ASSETS |
||||||||||||||||||
Current assets: |
||||||||||||||||||
Cash and cash equivalents |
$ | — | $ | 3 | $ | 84 | $ | — | $ | 87 | ||||||||
Restricted cash |
— | — | 5 | — | 5 | |||||||||||||
Accounts and notes receivable, net |
19 | 114 | 772 | — | 905 | |||||||||||||
Accounts receivable from affiliates |
350 | 1,819 | 38 | (2,192 | ) | 15 | ||||||||||||
Inventories, net |
103 | 198 | 1,207 | (8 | ) | 1,500 | ||||||||||||
Prepaid expenses |
14 | 29 | 21 | (19 | ) | 45 | ||||||||||||
Deferred income taxes |
9 | — | 21 | (9 | ) | 21 | ||||||||||||
Other current assets |
61 | 2 | 92 | (56 | ) | 99 | ||||||||||||
Total current assets |
556 | 2,165 | 2,240 | (2,284 | ) | 2,677 | ||||||||||||
Property, plant and equipment, net |
477 |
924 |
2,062 |
3 |
3,466 |
|||||||||||||
Investment in affiliates |
4,883 | 1,367 | 118 | (6,101 | ) | 267 | ||||||||||||
Intangible assets, net |
103 | — | 54 | — | 157 | |||||||||||||
Goodwill |
— | 87 | 9 | (4 | ) | 92 | ||||||||||||
Deferred income taxes |
168 | 9 | 273 | (58 | ) | 392 | ||||||||||||
Notes receivable from affiliates |
319 | 1,470 | 9 | (1,789 | ) | 9 | ||||||||||||
Other noncurrent assets |
47 | 145 | 172 | — | 364 | |||||||||||||
Total assets |
$ | 6,553 | $ | 6,167 | $ | 4,937 | $ | (10,233 | ) | $ | 7,424 | |||||||
LIABILITIES AND MEMBERS' EQUITY |
||||||||||||||||||
Current liabilities: |
||||||||||||||||||
Accounts payable |
$ | 20 | $ | 175 | $ | 533 | $ | — | $ | 728 | ||||||||
Accounts payable to affiliates |
1,567 | 265 | 375 | (2,191 | ) | 16 | ||||||||||||
Accrued liabilities |
91 | 155 | 389 | (75 | ) | 560 | ||||||||||||
Deferred income tax |
— | 35 | 10 | (10 | ) | 35 | ||||||||||||
Note payable to affiliate |
423 | — | — | — | 423 | |||||||||||||
Current portion of long-term debt |
39 | — | 166 | — | 205 | |||||||||||||
Total current liabilities |
2,140 | 630 | 1,473 | (2,276 | ) | 1,967 | ||||||||||||
Long-term debt |
3,303 |
12 |
127 |
— |
3,442 |
|||||||||||||
Notes payable to affiliates |
— | 282 | 1,513 | (1,789 | ) | 6 | ||||||||||||
Deferred income taxes |
2 | 2 | 65 | — | 69 | |||||||||||||
Other noncurrent liabilities |
211 | 175 | 635 | — | 1,021 | |||||||||||||
Total liabilities |
5,656 | 1,101 | 3,813 | (4,065 | ) | 6,505 | ||||||||||||
Minority interest in consolidated subsidiaries |
— |
— |
17 |
5 |
22 |
|||||||||||||
Members' equity: |
||||||||||||||||||
Members' equity |
2,865 | 4,685 | 1,716 | (6,401 | ) | 2,865 | ||||||||||||
Subsidiary preferred stock |
— | 1 | 1 | (2 | ) | — | ||||||||||||
(Accumulated deficit) retained earnings |
(1,414 | ) | 499 | (111 | ) | (388 | ) | (1,414 | ) | |||||||||
Accumulated other comprehensive loss |
(554 | ) | (119 | ) | (499 | ) | 618 | (554 | ) | |||||||||
Total members' equity |
897 | 5,066 | 1,107 | (6,173 | ) | 897 | ||||||||||||
Total liabilities and members' equity |
$ | 6,553 | $ | 6,167 | $ | 4,937 | $ | (10,233 | ) | $ | 7,424 | |||||||
F-103
HUNTSMAN CORPORATION AND SUBSIDIARIES
HUNTSMAN INTERNATIONAL LLC AND SUBSIDIARIES
NOTES TO CONSOLIDATED FINANCIAL STATEMENTS (Continued)
31. CONDENSED CONSOLIDATING FINANCIAL STATEMENTS—HUNTSMAN INTERNATIONAL (Continued)
HUNTSMAN INTERNATIONAL LLC AND SUBSIDIARIES
CONDENSED CONSOLIDATING BALANCE SHEETS
AS OF DECEMBER 31, 2007
(Dollars in Millions)
| |
Parent Company |
Guarantors | Non-guarantors | Eliminations | Consolidated Huntsman International LLC |
|||||||||||||
|---|---|---|---|---|---|---|---|---|---|---|---|---|---|---|---|---|---|---|
ASSETS |
||||||||||||||||||
Current assets: |
||||||||||||||||||
Cash and cash equivalents |
$ | 11 | $ | 6 | $ | 137 | $ | — | $ | 154 | ||||||||
Accounts and notes receivable, net |
30 | 212 | 1,011 | — | 1,253 | |||||||||||||
Accounts receivable from affiliates |
1,528 | 2,439 | 532 | (4,306 | ) | 193 | ||||||||||||
Inventories, net |
96 | 234 | 1,130 | (8 | ) | 1,452 | ||||||||||||
Prepaid expenses |
6 | 27 | 24 | (20 | ) | 37 | ||||||||||||
Deferred income taxes |
9 | 46 | 18 | 1 | 74 | |||||||||||||
Other current assets |
10 | 1 | 102 | — | 113 | |||||||||||||
Total current assets |
1,690 | 2,965 | 2,954 | (4,333 | ) | 3,276 | ||||||||||||
Property, plant and equipment, net |
471 |
838 |
2,245 |
2 |
3,556 |
|||||||||||||
Investment in affiliates |
5,345 | 1,597 | 115 | (6,829 | ) | 228 | ||||||||||||
Intangible assets, net |
128 | 1 | 48 | — | 177 | |||||||||||||
Goodwill |
— | 87 | 9 | (3 | ) | 93 | ||||||||||||
Deferred income taxes |
85 | 16 | 211 | (12 | ) | 300 | ||||||||||||
Notes receivable from affiliates |
518 | 1,726 | 9 | (2,244 | ) | 9 | ||||||||||||
Other noncurrent assets |
57 | 98 | 301 | — | 456 | |||||||||||||
Total assets |
$ | 8,294 | $ | 7,328 | $ | 5,892 | $ | (13,419 | ) | $ | 8,095 | |||||||
LIABILITIES AND MEMBERS' EQUITY |
||||||||||||||||||
Current liabilities: |
||||||||||||||||||
Accounts payable |
$ | 41 | $ | 258 | $ | 706 | $ | — | $ | 1,005 | ||||||||
Accounts payable to affiliates |
2,682 | 708 | 931 | (4,306 | ) | 15 | ||||||||||||
Accrued liabilities |
101 | 238 | 462 | (20 | ) | 781 | ||||||||||||
Deferred income tax |
— | — | 3 | — | 3 | |||||||||||||
Current portion of long-term debt |
27 | — | 42 | — | 69 | |||||||||||||
Total current liabilities |
2,851 | 1,204 | 2,144 | (4,326 | ) | 1,873 | ||||||||||||
Long-term debt |
3,343 |
— |
157 |
— |
3,500 |
|||||||||||||
Notes payable to affiliates |
28 | 477 | 1,744 | (2,244 | ) | 5 | ||||||||||||
Deferred income taxes |
2 | 11 | 122 | (11 | ) | 124 | ||||||||||||
Other noncurrent liabilities |
181 | 122 | 374 | — | 677 | |||||||||||||
Total liabilities |
6,405 | 1,814 | 4,541 | (6,581 | ) | 6,179 | ||||||||||||
Minority interest in consolidated subsidiaries |
— |
— |
19 |
8 |
27 |
|||||||||||||
Members' equity: |
||||||||||||||||||
Members' equity |
2,845 | 4,673 | 1,296 | (5,969 | ) | 2,845 | ||||||||||||
Subsidiary preferred stock |
— | 2 | 1 | (3 | ) | — | ||||||||||||
(Accumulated deficit) retained earnings |
(1,143 | ) | 383 | (3 | ) | (380 | ) | (1,143 | ) | |||||||||
Accumulated other comprehensive income |
187 | 456 | 38 | (494 | ) | 187 | ||||||||||||
Total members' equity |
1,889 | 5,514 | 1,332 | (6,846 | ) | 1,889 | ||||||||||||
Total liabilities and members' equity |
$ | 8,294 | $ | 7,328 | $ | 5,892 | $ | (13,419 | ) | $ | 8,095 | |||||||
F-104
HUNTSMAN CORPORATION AND SUBSIDIARIES
HUNTSMAN INTERNATIONAL LLC AND SUBSIDIARIES
NOTES TO CONSOLIDATED FINANCIAL STATEMENTS (Continued)
31. CONDENSED CONSOLIDATING FINANCIAL STATEMENTS—HUNTSMAN INTERNATIONAL (Continued)
HUNTSMAN INTERNATIONAL LLC AND SUBSIDIARIES
CONDENSED CONSOLIDATING STATEMENTS OF OPERATIONS
YEAR ENDED DECEMBER 31, 2008
(Dollars in Millions)
| |
Parent Company |
Guarantors | Nonguarantors | Eliminations | Consolidated Huntsman International LLC |
||||||||||||
|---|---|---|---|---|---|---|---|---|---|---|---|---|---|---|---|---|---|
Revenues: |
|||||||||||||||||
Trade sales, services and fees |
$ | 869 | $ | 2,778 | $ | 6,470 | $ | — | $ | 10,117 | |||||||
Related party sales |
337 | 442 | 1,080 | (1,761 | ) | 98 | |||||||||||
Total revenues |
1,206 | 3,220 | 7,550 | (1,761 | ) | 10,215 | |||||||||||
Cost of goods sold |
1,006 | 2,869 | 6,806 | (1,747 | ) | 8,934 | |||||||||||
Gross profit |
200 |
351 |
744 |
(14 |
) |
1,281 |
|||||||||||
Selling, general and administrative |
109 | 132 | 641 | (1 | ) | 881 | |||||||||||
Research and development |
53 | 31 | 70 | — | 154 | ||||||||||||
Other operating (income) expense |
(15 | ) | 55 | (13 | ) | — | 27 | ||||||||||
Restructuring, impairment and plant closing costs |
— | — | 36 | — | 36 | ||||||||||||
Operating income |
53 |
133 |
10 |
(13 |
) |
183 |
|||||||||||
Interest (expense) income, net |
(231 | ) | 106 | (139 | ) | — | (264 | ) | |||||||||
Gain (loss) on accounts receivable securitization program |
6 | (10 | ) | (23 | ) | — | (27 | ) | |||||||||
Equity in income (loss) of investment in affiliates and subsidiaries |
106 | (45 | ) | 14 | (61 | ) | 14 | ||||||||||
Other (expense) income |
(14 | ) | — | 1 | 13 | — | |||||||||||
(Loss) income from continuing operations before income taxes and minority interest |
(80 | ) | 184 | (137 | ) | (61 | ) | (94 | ) | ||||||||
Income tax benefit (expense) |
119 | (77 | ) | 16 | (56 | ) | 2 | ||||||||||
Minority interest in subsidiaries' income |
— | — | (1 | ) | — | (1 | ) | ||||||||||
Income (loss) from continuing operations |
39 | 107 | (122 | ) | (117 | ) | (93 | ) | |||||||||
(Loss) income from discontinued operations, net of tax |
(1 | ) | 119 | (1 | ) | — | 117 | ||||||||||
Extraordinary gain on the acquisition of a business, net of tax |
— | — | 14 | — | 14 | ||||||||||||
Net income (loss) |
$ | 38 | $ | 226 | $ | (109 | ) | $ | (117 | ) | $ | 38 | |||||
F-105
HUNTSMAN CORPORATION AND SUBSIDIARIES
HUNTSMAN INTERNATIONAL LLC AND SUBSIDIARIES
NOTES TO CONSOLIDATED FINANCIAL STATEMENTS (Continued)
31. CONDENSED CONSOLIDATING FINANCIAL STATEMENTS—HUNTSMAN INTERNATIONAL (Continued)
HUNTSMAN INTERNATIONAL LLC AND SUBSIDIARIES
CONDENSED CONSOLIDATING STATEMENTS OF OPERATIONS
YEAR ENDED DECEMBER 31, 2007
(Dollars in Millions)
| |
Parent Company |
Guarantors | Non-guarantors | Eliminations | Consolidated Huntsman International LLC |
||||||||||||
|---|---|---|---|---|---|---|---|---|---|---|---|---|---|---|---|---|---|
Revenues: |
|||||||||||||||||
Trade sales, services and fees |
$ | 934 | $ | 2,420 | $ | 6,126 | $ | — | $ | 9,480 | |||||||
Related party sales |
484 | 450 | 1,007 | (1,770 | ) | 171 | |||||||||||
Total revenues |
1,418 | 2,870 | 7,133 | (1,770 | ) | 9,651 | |||||||||||
Cost of goods sold |
1,084 | 2,528 | 6,247 | (1,764 | ) | 8,095 | |||||||||||
Gross profit |
334 |
342 |
886 |
(6 |
) |
1,556 |
|||||||||||
Selling, general and administrative |
140 | 120 | 612 | (1 | ) | 871 | |||||||||||
Research and development |
45 | 33 | 67 | — | 145 | ||||||||||||
Other operating expense (income) |
36 | (121 | ) | 30 | — | (55 | ) | ||||||||||
Restructuring, impairment and plant closing (credits) costs |
— | (1 | ) | 43 | — | 42 | |||||||||||
Operating income |
113 |
311 |
134 |
(5 |
) |
553 |
|||||||||||
Interest expense, net |
(64 | ) | (95 | ) | (128 | ) | — | (287 | ) | ||||||||
Gain (loss) on accounts receivable securitization program |
9 | (9 | ) | (21 | ) | — | (21 | ) | |||||||||
Equity in (loss) income of investment in affiliates and subsidiaries |
(79 | ) | 51 | 13 | 28 | 13 | |||||||||||
Other (expense) income |
(6 | ) | 6 | 2 | (5 | ) | (3 | ) | |||||||||
(Loss) income from continuing operations before income taxes and minority interest |
(27 | ) | 264 | — | 18 | 255 | |||||||||||
Income tax benefit (expense) |
29 | (93 | ) | 23 | — | (41 | ) | ||||||||||
Minority interest in subsidiaries' loss |
— | — | 9 | — | 9 | ||||||||||||
Income from continuing operations |
2 | 171 | 32 | 18 | 223 | ||||||||||||
(Loss) income from discontinued operations, net of tax |
(12 | ) | (231 | ) | 15 | — | (228 | ) | |||||||||
Extraordinary loss on the acquisition of a business, net of tax |
(2 | ) | — | (5 | ) | — | (7 | ) | |||||||||
Net (loss) income |
$ | (12 | ) | $ | (60 | ) | $ | 42 | $ | 18 | $ | (12 | ) | ||||
F-106
HUNTSMAN CORPORATION AND SUBSIDIARIES
HUNTSMAN INTERNATIONAL LLC AND SUBSIDIARIES
NOTES TO CONSOLIDATED FINANCIAL STATEMENTS (Continued)
31. CONDENSED CONSOLIDATING FINANCIAL STATEMENTS—HUNTSMAN INTERNATIONAL (Continued)
HUNTSMAN INTERNATIONAL LLC AND SUBSIDIARIES
CONDENSED CONSOLIDATING STATEMENTS OF OPERATIONS
YEAR ENDED DECEMBER 31, 2006
(Dollars in Millions)
| |
Parent Company |
Guarantors | Non-guarantors | Eliminations | Consolidated Huntsman International LLC |
||||||||||||
|---|---|---|---|---|---|---|---|---|---|---|---|---|---|---|---|---|---|
Revenues: |
|||||||||||||||||
Trade sales, services and fees |
$ | 921 | $ | 2,689 | $ | 5,012 | $ | — | $ | 8,622 | |||||||
Related party sales |
310 | 350 | 913 | (1,464 | ) | 109 | |||||||||||
Total revenues |
1,231 | 3,039 | 5,925 | (1,464 | ) | 8,731 | |||||||||||
Cost of goods sold |
912 | 2,681 | 5,154 | (1,455 | ) | 7,292 | |||||||||||
Gross Profit |
319 |
358 |
771 |
(9 |
) |
1,439 |
|||||||||||
Selling, general and administrative |
133 | 120 | 508 | — | 761 | ||||||||||||
Research and development |
37 | 30 | 48 | — | 115 | ||||||||||||
Other operating expense (income) |
58 | (160 | ) | (12 | ) | — | (114 | ) | |||||||||
Restructuring, impairment and plant closing costs |
— | 3 | 12 | — | 15 | ||||||||||||
Operating income |
91 |
365 |
215 |
(9 |
) |
662 |
|||||||||||
Interest expense, net |
(138 | ) | (82 | ) | (135 | ) | — | (355 | ) | ||||||||
Gain (loss) on accounts receivable securitization program |
13 | (10 | ) | (16 | ) | — | (13 | ) | |||||||||
Equity in income (loss) of investment in affiliates and subsidiaries |
302 | (20 | ) | 4 | (282 | ) | 4 | ||||||||||
Other (expense) income |
(42 | ) | 11 | — | (6 | ) | (37 | ) | |||||||||
Income from continuing operations before income taxes and minority interest |
226 | 264 | 68 | (297 | ) | 261 | |||||||||||
Income tax benefit |
7 | 9 | 15 | — | 31 | ||||||||||||
Minority interest in subsidiaries' income |
— | (40 | ) | (1 | ) | 38 | (3 | ) | |||||||||
Income from continuing operations |
233 | 233 | 82 | (259 | ) | 289 | |||||||||||
Income (loss) from discontinued operations, net of tax |
3 | 68 | (182 | ) | — | (111 | ) | ||||||||||
Extraordinary (loss) gain on the acquisition of a business, net of tax |
(2 | ) | — | 58 | — | 56 | |||||||||||
Net income (loss) |
$ | 234 | $ | 301 | $ | (42 | ) | $ | (259 | ) | $ | 234 | |||||
F-107
HUNTSMAN CORPORATION AND SUBSIDIARIES
HUNTSMAN INTERNATIONAL LLC AND SUBSIDIARIES
NOTES TO CONSOLIDATED FINANCIAL STATEMENTS (Continued)
31. CONDENSED CONSOLIDATING FINANCIAL STATEMENTS—HUNTSMAN INTERNATIONAL (Continued)
HUNTSMAN INTERNATIONAL LLC AND SUBSIDIARIES
CONDENSED CONSOLIDATING STATEMENT OF CASH FLOWS
YEAR ENDED DECEMBER 31, 2008
(Dollars in Millions)
| |
Parent Company |
Guarantors | Nonguarantors | Eliminations | Consolidated Huntsman International LLC |
|||||||||||
|---|---|---|---|---|---|---|---|---|---|---|---|---|---|---|---|---|
Net cash (used in) provided by operating activities |
$ | (320 | ) | $ | 649 | $ | (290 | ) | $ | — | $ | 39 | ||||
Investing activities: |
||||||||||||||||
Capital expenditures |
(50 | ) | (154 | ) | (214 | ) | — | (418 | ) | |||||||
Acquisition of business, net of cash acquired and post-closing adjustments |
— | — | (2 | ) | — | (2 | ) | |||||||||
Proceeds from sale of assets, net of adjustments |
— | (28 | ) | 2 | — | (26 | ) | |||||||||
Decrease in receivable from affiliate |
406 | 46 | — | (273 | ) | 179 | ||||||||||
Investment in affiliate |
(164 | ) | (426 | ) | — | 546 | (44 | ) | ||||||||
Cash received from affiliate |
— | 10 | — | — | 10 | |||||||||||
Change in restricted cash |
— | — | (8 | ) | — | (8 | ) | |||||||||
Other, net |
— | (3 | ) | (2 | ) | — | (5 | ) | ||||||||
Net cash provided by (used in) investing activities |
192 | (555 | ) | (224 | ) | 273 | (314 | ) | ||||||||
Financing activities: |
||||||||||||||||
Net borrowings under revolving loan facilities |
8 | — | 3 | — | 11 | |||||||||||
Net borrowings on overdraft facilities and other short-term debt |
— | — | 8 | — | 8 | |||||||||||
Repayments of long-term debt |
(1 | ) | — | (10 | ) | — | (11 | ) | ||||||||
Proceeds from long-term debt |
1 | 10 | 90 | — | 101 | |||||||||||
Issuance of note payable to affiliate |
423 | — | — | — | 423 | |||||||||||
Intercompany (repayments) borrowings |
— | (227 | ) | (46 | ) | 273 | — | |||||||||
Borrowings on notes payable |
41 | — | 7 | — | 48 | |||||||||||
Repayments of notes payable |
(44 | ) | — | (11 | ) | — | (55 | ) | ||||||||
Contribution from parent, net |
— | 120 | 426 | (546 | ) | — | ||||||||||
Dividends paid |
(306 | ) | — | — | — | (306 | ) | |||||||||
Debt issuance costs paid |
(5 | ) | — | — | — | (5 | ) | |||||||||
Other, net |
— | — | (1 | ) | — | (1 | ) | |||||||||
Net cash provided by (used in) financing activities |
117 | (97 | ) | 466 | (273 | ) | 213 | |||||||||
Effect of exchange rate changes on cash |
— | — | (5 | ) | — | (5 | ) | |||||||||
Decrease in cash and cash equivalents |
(11 | ) | (3 | ) | (53 | ) | — | (67 | ) | |||||||
Cash and cash equivalents at beginning of period |
11 | 6 | 137 | — | 154 | |||||||||||
Cash and cash equivalents at end of period |
$ | — | $ | 3 | $ | 84 | $ | — | $ | 87 | ||||||
F-108
HUNTSMAN CORPORATION AND SUBSIDIARIES
HUNTSMAN INTERNATIONAL LLC AND SUBSIDIARIES
NOTES TO CONSOLIDATED FINANCIAL STATEMENTS (Continued)
31. CONDENSED CONSOLIDATING FINANCIAL STATEMENTS—HUNTSMAN INTERNATIONAL (Continued)
HUNTSMAN INTERNATIONAL LLC AND SUBSIDIARIES
CONDENSED CONSOLIDATING STATEMENTS OF CASH FLOW
YEAR ENDED DECEMBER 31, 2007
(Dollars in Millions)
| |
Parent Company |
Guarantors | Non-Guarantors | Eliminations | Consolidated Huntsman International LLC |
|||||||||||
|---|---|---|---|---|---|---|---|---|---|---|---|---|---|---|---|---|
Net cash (used in) provided by operating activities |
$ | (1,378 | ) | $ | 1,356 | $ | 85 | $ | (6 | ) | $ | 57 | ||||
Investing activities: |
||||||||||||||||
Capital expenditures |
(42 | ) | (313 | ) | (310 | ) | — | (665 | ) | |||||||
Acquisition of business, net of cash acquired and post-closing adjustments |
(8 | ) | — | 21 | — | 13 | ||||||||||
Proceeds from sale of businesses/assets |
348 | 486 | 16 | — | 850 | |||||||||||
Decrease (increase) in receivable from affiliate |
1,234 | (83 | ) | — | (1,329 | ) | (178 | ) | ||||||||
Investment in affiliate |
— | (16 | ) | (12 | ) | 11 | (17 | ) | ||||||||
Cash received from affiliate |
19 | — | 4 | (19 | ) | 4 | ||||||||||
Other, net |
— | — | 1 | — | 1 | |||||||||||
Net cash provided by (used in) investing activities |
1,551 | 74 | (280 | ) | (1,337 | ) | 8 | |||||||||
Financing activities: |
||||||||||||||||
Net repayments under revolving loan facilities |
— | — | (17 | ) | — | (17 | ) | |||||||||
Net borrowings on overdraft facilities and other short-term debt |
— | — | 15 | — | 15 | |||||||||||
Repayments of long-term debt |
(413 | ) | — | (9 | ) | — | (422 | ) | ||||||||
Proceeds from long-term debt |
249 | — | 17 | — | 266 | |||||||||||
Intercompany (repayments) borrowings |
— | (1,412 | ) | 83 | 1,329 | — | ||||||||||
Borrowings on notes payable |
47 | — | 6 | — | 53 | |||||||||||
Repayments of notes payable |
(57 | ) | — | — | — | (57 | ) | |||||||||
Debt issuance costs paid |
(5 | ) | — | — | — | (5 | ) | |||||||||
Call premiums related to early extinguishment of debt |
(1 | ) | — | — | — | (1 | ) | |||||||||
Dividends paid |
— | (6 | ) | — | 6 | — | ||||||||||
Other, net |
— | (6 | ) | (3 | ) | 8 | (1 | ) | ||||||||
Net cash (used in) provided by financing activities |
(180 | ) | (1,424 | ) | 92 | 1,343 | (169 | ) | ||||||||
Effect of exchange rate changes on cash |
— | — | 12 | — | 12 | |||||||||||
(Decrease) increase in cash and cash equivalents |
(7 | ) | 6 | (91 | ) | — | (92 | ) | ||||||||
Cash and cash equivalents at beginning of period |
18 | — | 228 | — | 246 | |||||||||||
Cash and cash equivalents at end of period |
$ | 11 | $ | 6 | $ | 137 | $ | — | $ | 154 | ||||||
F-109
HUNTSMAN CORPORATION AND SUBSIDIARIES
HUNTSMAN INTERNATIONAL LLC AND SUBSIDIARIES
NOTES TO CONSOLIDATED FINANCIAL STATEMENTS (Continued)
31. CONDENSED CONSOLIDATING FINANCIAL STATEMENTS—HUNTSMAN INTERNATIONAL (Continued)
HUNTSMAN INTERNATIONAL LLC AND SUBSIDIARIES
CONDENSED CONSOLIDATING STATEMENTS OF CASH FLOW
YEAR ENDED DECEMBER 31, 2006
(Dollars in Millions)
| |
Parent Company |
Guarantors | Non- Guarantors |
Eliminations | Consolidated Huntsman International LLC |
|||||||||||
|---|---|---|---|---|---|---|---|---|---|---|---|---|---|---|---|---|
Net cash provided by (used in) operating activities |
$ | 1,497 | $ | (981 | ) | $ | 376 | $ | (9 | ) | $ | 883 | ||||
Investing activities: |
||||||||||||||||
Capital expenditures |
(31 | ) | (113 | ) | (406 | ) | — | (550 | ) | |||||||
Acquisition of business, net of cash acquired and post-closing adjustments |
(10 | ) | — | (167 | ) | — | (177 | ) | ||||||||
Proceeds from sale of business/assets |
— | 201 | 694 | — | 895 | |||||||||||
(Increase) decrease in receivable from affiliate |
(1,191 | ) | 425 | — | 766 | — | ||||||||||
Investment in affiliate |
— | (8 | ) | (14 | ) | 8 | (14 | ) | ||||||||
Cash received from affiliate |
714 | 2 | — | (714 | ) | 2 | ||||||||||
Other, net |
— | — | 3 | — | 3 | |||||||||||
Net cash (used in) provided by investing activities |
(518 | ) | 507 | 110 | 60 | 159 | ||||||||||
Financing activities: |
||||||||||||||||
Net repayments under revolving loan facilities |
— | — | (6 | ) | — | (6 | ) | |||||||||
Net repayments on overdraft facilities and other short-term debt |
— | — | (7 | ) | — | (7 | ) | |||||||||
Repayments of long-term debt |
(1,755 | ) | (9 | ) | (20 | ) | — | (1,784 | ) | |||||||
Proceeds from long-term debt |
810 | — | 62 | — | 872 | |||||||||||
Intercompany borrowings (repayments) |
— | 487 | (425 | ) | (62 | ) | — | |||||||||
Borrowings on notes payable |
67 | — | 7 | — | 74 | |||||||||||
Repayments of notes payable |
(50 | ) | (1 | ) | (9 | ) | — | (60 | ) | |||||||
Debt issuance costs paid |
(13 | ) | — | — | — | (13 | ) | |||||||||
Call premiums related to early extinguishment of debt |
(30 | ) | — | — | — | (30 | ) | |||||||||
Contribution from minority shareholder |
— | — | 6 | — | 6 | |||||||||||
Dividends paid |
— | (11 | ) | — | 11 | — | ||||||||||
Other, net |
— | — | 4 | — | 4 | |||||||||||
Net cash (used in) provided by financing activities |
(971 | ) | 466 | (388 | ) | (51 | ) | (944 | ) | |||||||
Effect of exchange rate changes on cash |
— |
— |
15 |
— |
15 |
|||||||||||
Increase (decrease) in cash and cash equivalents |
8 |
(8 |
) |
113 |
— |
113 |
||||||||||
Cash and cash equivalents at beginning of period |
10 | 8 | 115 | — | 133 | |||||||||||
Cash and cash equivalents at end of period |
$ | 18 | $ | — | $ | 228 | $ | — | $ | 246 | ||||||
F-110
HUNTSMAN CORPORATION AND SUBSIDIARIES
HUNTSMAN INTERNATIONAL LLC AND SUBSIDIARIES
NOTES TO CONSOLIDATED FINANCIAL STATEMENTS (Continued)
32. SELECTED UNAUDITED QUARTERLY FINANCIAL DATA
A summary of selected unaudited quarterly financial data for the years ended December 31, 2008 and 2007 is as follows (dollars in millions):
Huntsman Corporation
| |
Three months ended | |||||||||||||
|---|---|---|---|---|---|---|---|---|---|---|---|---|---|---|
| |
March 31, 2008 |
June 30, 2008 |
September 30, 2008 |
December 31, 2008 |
||||||||||
Revenues |
$ | 2,540 | $ | 2,896 | $ | 2,731 | $ | 2,048 | ||||||
Gross profit |
367 | 381 | 351 | 165 | ||||||||||
Restructuring, impairment and plant closing costs |
4 | 1 | 3 | 28 | ||||||||||
Income (loss) from continuing operations(a)(b) |
8 | 10 | (22 | ) | 482 | |||||||||
Income (loss) before extraordinary gain |
7 | 15 | (21 | ) | 594 | |||||||||
Net income (loss) |
7 | 24 | (20 | ) | 598 | |||||||||
Basic income (loss) per share: |
||||||||||||||
Income (loss) from continuing operations(a)(b) |
0.04 | 0.04 | (0.10 | ) | 2.06 | |||||||||
Income (loss) before extraordinary gain |
0.03 | 0.06 | (0.10 | ) | 2.55 | |||||||||
Net income (loss) |
0.03 | 0.10 | (0.09 | ) | 2.56 | |||||||||
Diluted income (loss) per share: |
||||||||||||||
Income (loss) from continuing operations(a)(b) |
0.03 | 0.04 | (0.10 | ) | 2.04 | |||||||||
Income (loss) before extraordinary gain |
0.03 | 0.06 | (0.10 | ) | 2.52 | |||||||||
Net income (loss) |
0.03 | 0.10 | (0.09 | ) | 2.53 | |||||||||
| |
Three months ended | |||||||||||||
|---|---|---|---|---|---|---|---|---|---|---|---|---|---|---|
| |
March 31, 2007 |
June 30, 2007 |
September 30, 2007 |
December 31, 2007 |
||||||||||
Revenues |
$ | 2,252 | $ | 2,471 | $ | 2,424 | $ | 2,504 | ||||||
Gross profit |
391 | 388 | 400 | 361 | ||||||||||
Restructuring, impairment and plant closing costs |
11 | 13 | 10 | 8 | ||||||||||
Income (loss) from continuing operations |
48 | 62 | (136 | ) | 78 | |||||||||
Income (loss) before extraordinary loss |
45 | (63 | ) | (150 | ) | 3 | ||||||||
Net income (loss) |
47 | (71 | ) | (150 | ) | 2 | ||||||||
Basic income (loss) per share: |
||||||||||||||
Income from continuing operations |
0.21 | 0.28 | (0.62 | ) | 0.35 | |||||||||
Income (loss) before extraordinary loss |
0.20 | (0.28 | ) | (0.68 | ) | 0.01 | ||||||||
Net income (loss) |
0.21 | (0.32 | ) | (0.68 | ) | 0.01 | ||||||||
Diluted income (loss) per share: |
||||||||||||||
Income (loss) from continuing operations |
0.20 | 0.27 | (0.62 | ) | 0.33 | |||||||||
Income (loss) before extraordinary loss |
0.19 | (0.27 | ) | (0.68 | ) | 0.01 | ||||||||
Net income (loss) |
0.20 | (0.30 | ) | (0.68 | ) | 0.01 | ||||||||
F-111
HUNTSMAN CORPORATION AND SUBSIDIARIES
HUNTSMAN INTERNATIONAL LLC AND SUBSIDIARIES
NOTES TO CONSOLIDATED FINANCIAL STATEMENTS (Continued)
32. SELECTED UNAUDITED QUARTERLY FINANCIAL DATA (Continued)
Huntsman International
| |
Three months ended | ||||||||||||
|---|---|---|---|---|---|---|---|---|---|---|---|---|---|
| |
March 31, 2008 |
June 30, 2008 |
September 30, 2008 |
December 31, 2008 |
|||||||||
Revenues |
$ | 2,540 | $ | 2,896 | $ | 2,731 | $ | 2,048 | |||||
Gross profit |
371 | 386 | 355 | 169 | |||||||||
Restructuring, impairment and plant closing costs |
4 | 1 | 3 | 28 | |||||||||
Income (loss) from continuing operations(b) |
13 | 18 | 7 | (131 | ) | ||||||||
Income (loss) before extraordinary gain |
12 | 23 | 8 | (19 | ) | ||||||||
Net income (loss) |
13 | 32 | 9 | (16 | ) | ||||||||
| |
Three months ended | ||||||||||||
|---|---|---|---|---|---|---|---|---|---|---|---|---|---|
| |
March 31, 2007 | June 30, 2007 | September 30, 2007 | December 31, 2007 | |||||||||
Revenues |
$ | 2,252 | $ | 2,471 | $ | 2,424 | $ | 2,504 | |||||
Gross profit |
393 | 394 | 405 | 364 | |||||||||
Restructuring, impairment and plant closing costs |
11 | 13 | 10 | 8 | |||||||||
Income from continuing operations |
37 | 43 | 62 | 81 | |||||||||
Income (loss) before extraordinary loss |
34 | (82 | ) | 48 | (5 | ) | |||||||
Net income (loss) |
36 | (91 | ) | 48 | (5 | ) | |||||||
33. SUBSEQUENT EVENTS
On February 5, 2009, our board of directors declared a $0.10 per share cash dividend, payable on March 31, 2009, to stockholders of record as of March 16, 2009.
On January 22, 2009, our board of directors approved and we announced plans to close our titanium dioxide plant located in Grimsby, U.K. The Grimsby plant is our Pigments segment's oldest and least efficient manufacturing plant and has annual production capacity of 40,000 tons of titanium dioxide. Pigments production at this plant, which had a net book value of approximately $32 million at December 31, 2008, is expected to cease during the first quarter of 2009. Approximately 200 full-time employees and contractors work at this site.
F-112
HUNTSMAN CORPORATION (PARENT ONLY)
Schedule I—Condensed Financial Information of Registrant
HUNTSMAN CORPORATION (Parent Only)
BALANCE SHEETS
(Dollars in Millions)
| |
December 31, | ||||||||
|---|---|---|---|---|---|---|---|---|---|
| |
2008 | 2007 | |||||||
ASSETS |
|||||||||
Cash and cash equivalents |
$ | 570 | $ | — | |||||
Note receivable from affiliate |
423 | — | |||||||
Investment in government securities (restricted as to use) |
— | 4 | |||||||
Total current assets |
993 | 4 | |||||||
Investment in and advances to affiliates |
903 | 2,112 | |||||||
Total assets |
$ | 1,896 | $ | 2,116 | |||||
LIABILITIES AND STOCKHOLDERS' EQUITY |
|||||||||
Accounts payable |
$ | 4 | $ | — | |||||
Payable to affiliate |
7 | 184 | |||||||
Dividends payable |
— | 4 | |||||||
Accrued liabilities |
40 | 100 | |||||||
Total current liabilities |
51 | 288 | |||||||
Long-term debt |
235 | — | |||||||
Other long term liabilities |
— | 2 | |||||||
Total liabilities |
286 | 290 | |||||||
STOCKHOLDERS' EQUITY |
|||||||||
Common stock, $0.01 par value, 1,200,000,000 shares authorized, 234,430,334 and 222,012,474 issued and 233,553,515 and 221,036,190 outstanding in 2008 and 2007, respectively |
2 | 2 | |||||||
Mandatory convertible preferred stock, $0.01 par value, 100,000,000 shares authorized, and 5,750,000 issued and outstanding in 2007 |
— | 288 | |||||||
Additional paid-in capital |
3,141 | 2,831 | |||||||
Unearned stock-based compensation |
(13 | ) | (12 | ) | |||||
Accumulated deficit |
(1,031 | ) | (1,540 | ) | |||||
Accumulated other comprehensive (loss) income |
(489 | ) | 257 | ||||||
Total stockholders' equity |
1,610 | 1,826 | |||||||
Total liabilities and stockholders' equity |
$ | 1,896 | $ | 2,116 | |||||
This statement should be read in conjunction with the notes to the consolidated financial statements.
F-113
HUNTSMAN CORPORATION (Parent Only)
STATEMENTS OF OPERATIONS AND COMPREHENSIVE INCOME (LOSS)
(Dollars in Millions)
| |
Year ended December 31, | |||||||||
|---|---|---|---|---|---|---|---|---|---|---|
| |
2008 | 2007 | 2006 | |||||||
Selling, general and administrative |
$ | (3 | ) | $ | (4 | ) | $ | (5 | ) | |
Interest income |
— | 1 | 1 | |||||||
Equity in (loss) income of subsidiaries |
(474 | ) | 41 | 234 | ||||||
Dividend income—affiliate |
306 | — | — | |||||||
Income (expenses) associated with the Merger |
780 | (210 | ) | — | ||||||
Net income (loss) |
$ | 609 | $ | (172 | ) | $ | 230 | |||
Net income (loss) |
$ | 609 | $ | (172 | ) | $ | 230 | |||
Other comprehensive (loss) income from subsidiaries |
(746 | ) | 318 | 149 | ||||||
Comprehensive (loss) income |
$ | (137 | ) | $ | 146 | $ | 379 | |||
This statement should be read in conjunction with the notes to the consolidated financial statements.
F-114
HUNTSMAN CORPORATION (Parent Only)
STATEMENTS OF STOCKHOLDERS' EQUITY (DEFICIT)
(Dollars in Millions)
| |
Shares | |
|
|
|
|
|
|
||||||||||||||||||||
|---|---|---|---|---|---|---|---|---|---|---|---|---|---|---|---|---|---|---|---|---|---|---|---|---|---|---|---|---|
| |
|
|
|
|
|
Accumulated other comprehensive (loss) income |
|
|||||||||||||||||||||
| |
Common Stock | Mandatory convertible preferred stock |
Common stock |
Mandatory convertible preferred stock |
Additional paid-in capital |
Unearned stock-based compensation |
Accumulated deficit |
Total | ||||||||||||||||||||
Balance, January 1, 2006 |
220,451,484 | 5,750,000 | $ | 2 | $ | 288 | $ | 2,780 | $ | (12 | ) | $ | (1,506 | ) | $ | (31 | ) | $ | 1,521 | |||||||||
Net income |
— | — | — | — | — | — | 230 | — | 230 | |||||||||||||||||||
Other comprehensive income |
— | — | — | — | — | — | — | 149 | 149 | |||||||||||||||||||
Issuance of nonvested stock awards |
— | — | — | — | 9 | (9 | ) | — | — | — | ||||||||||||||||||
Vesting of stock awards |
278,531 | — | — | — | — | — | — | — | — | |||||||||||||||||||
Recognition of stock-based compensation |
— | — | — | — | 9 | 8 | — | — | 17 | |||||||||||||||||||
Cumulative effect of adoption of SFAS No. 158, net of tax |
— | — | — | — | — | — | — | (179 | ) | (179 | ) | |||||||||||||||||
Repurchase and cancellation of stock awards |
(77,586 | ) | — | — | — | — | — | (2 | ) | — | (2 | ) | ||||||||||||||||
Balance, December 31, 2006 |
220,652,429 | 5,750,000 | 2 | 288 | 2,798 | (13 | ) | (1,278 | ) | (61 | ) | 1,736 | ||||||||||||||||
Net loss |
— | — | — | — | — | — | (172 | ) | — | (172 | ) | |||||||||||||||||
Other comprehensive income |
— | — | — | — | — | — | — | 318 | 318 | |||||||||||||||||||
Issuance of nonvested stock awards |
— | — | — | — | 10 | (10 | ) | — | — | — | ||||||||||||||||||
Vesting of stock awards |
393,555 | — | — | — | — | — | — | — | — | |||||||||||||||||||
Stock options exercised |
99,332 | — | — | — | 2 | — | — | — | 2 | |||||||||||||||||||
Recognition of stock-based compensation |
— | — | — | — | 13 | 11 | — | — | 24 | |||||||||||||||||||
Repurchase and cancellation of stock awards |
(109,126 | ) | — | — | — | — | — | (2 | ) | — | (2 | ) | ||||||||||||||||
Dividends declared on common stock |
— | — | — | — | — | — | (88 | ) | — | (88 | ) | |||||||||||||||||
Reversal of valuation allowance on deferred tax assets related to previous equity transactions |
— | — | — | — | 8 | — | — | — | 8 | |||||||||||||||||||
Balance, December 31, 2007 |
221,036,190 | 5,750,000 | 2 | 288 | 2,831 | (12 | ) | (1,540 | ) | 257 | 1,826 | |||||||||||||||||
Net income |
— | — | — | — | — | — | 609 | — | 609 | |||||||||||||||||||
Other comprehensive loss |
— | — | — | — | — | — | — | (746 | ) | (746 | ) | |||||||||||||||||
Issuance of nonvested stock awards |
— | — | — | — | 12 | (12 | ) | — | — | — | ||||||||||||||||||
Vesting of stock awards |
594,908 | — | — | — | 1 | — | — | — | 1 | |||||||||||||||||||
Recognition of stock-based compensation |
— | — | — | — | 9 | 11 | — | — | 20 | |||||||||||||||||||
Repurchase and cancellation of stock awards |
(160,058 | ) | — | — | — | — | — | (4 | ) | — | (4 | ) | ||||||||||||||||
Preferred stock conversion |
12,082,475 | (5,750,000 | ) | — | (288 | ) | 288 | — | — | — | — | |||||||||||||||||
Effect of adoption of SFAS No. 158, net of tax |
— | — | — | — | — | — | (3 | ) | — | (3 | ) | |||||||||||||||||
Dividends declared on common stock |
— | — | — | — | — | — | (93 | ) | — | (93 | ) | |||||||||||||||||
Balance, December 31, 2008 |
233,553,515 | — | $ | 2 | $ | — | $ | 3,141 | $ | (13 | ) | $ | (1,031 | ) | $ | (489 | ) | $ | 1,610 | |||||||||
This statement should be read in conjunction with the notes to the consolidated financial statements.
F-115
HUNTSMAN CORPORATION (Parent Only)
STATEMENTS OF CASH FLOWS
(Dollars in Millions)
| |
Year ended December 31, | ||||||||||
|---|---|---|---|---|---|---|---|---|---|---|---|
| |
2008 | 2007 | 2006 | ||||||||
Operating Activities: |
|||||||||||
Net income (loss) |
$ | 609 | $ | (172 | ) | $ | 230 | ||||
Equity in loss (income) of subsidiaries |
474 | (41 | ) | (234 | ) | ||||||
Changes in operating assets and liabilities |
(49 | ) | 104 | 6 | |||||||
Net cash provided by (used in) operating activities |
1,034 | (109 | ) | 2 | |||||||
Investing Activities: |
|||||||||||
Loan to affiliate |
(423 | ) | — | — | |||||||
Proceeds from maturity of government securities (restricted as to use) |
4 | 14 | 14 | ||||||||
Net cash (used in) provided by investing activities |
(419 | ) | 14 | 14 | |||||||
Financing Activities: |
|||||||||||
Proceeds from issuance of Convertible Note |
235 | — | — | ||||||||
Dividends paid to preferred stockholders |
(4 | ) | (14 | ) | (14 | ) | |||||
Dividends paid to common stockholders |
(93 | ) | (88 | ) | — | ||||||
Repurchase and cancellation of stock awards |
(4 | ) | — | — | |||||||
Stock options exercised |
— | 2 | — | ||||||||
(Decrease) increase payable to affiliates |
(179 | ) | 178 | 5 | |||||||
Net cash (used in) provided by financing activities |
(45 | ) | 78 | (9 | ) | ||||||
Increase (decrease) in cash and cash equivalents |
570 | (17 | ) | 7 | |||||||
Cash and cash equivalents at beginning of period |
— | 17 | 10 | ||||||||
Cash and cash equivalents at end of period |
$ | 570 | $ | — | $ | 17 | |||||
This statement should be read in conjunction with the notes to the consolidated financial statements.
F-116
HUNTSMAN CORPORATION AND SUBSIDIARIES
Schedule II—Valuation and Qualifying Accounts
(Dollars in Millions)
Column A
|
Column B | Column C | |
Column D | Column E | ||||||||||||
|---|---|---|---|---|---|---|---|---|---|---|---|---|---|---|---|---|---|
| |
|
Additions | |
|
|
||||||||||||
Description
|
Balance at Beginning of Period |
Charged to cost and expenses |
Charged to other accounts |
Deductions | Balance at End of Period |
||||||||||||
Allowance for Doubtful Accounts: |
|||||||||||||||||
Year ended December 31, 2008 |
$ | 43 | $ | 6 | $ | (2 | ) | $ | — | $ | 47 | ||||||
Year ended December 31, 2007 |
$ | 39 | $ | 3 | $ | 1 | $ | — | $ | 43 | |||||||
Year ended December 31, 2006 |
$ | 34 | $ | 6 | $ | — | $ | (1 | ) | $ | 39 | ||||||
F-117
HUNTSMAN INTERNATIONAL LLC AND SUBSIDIARIES
Schedule II—Valuation and Qualifying Accounts
(Dollars in Millions)
Column A
|
Column B | Column C | |
Column D | Column E | ||||||||||||
|---|---|---|---|---|---|---|---|---|---|---|---|---|---|---|---|---|---|
| |
|
Additions | |
|
|
||||||||||||
Description
|
Balance at Beginning of Period |
Charged to cost and expenses |
Charged to other accounts |
Deductions | Balance at End of Period |
||||||||||||
Allowance for Doubtful Accounts: |
|||||||||||||||||
Year ended December 31, 2008 |
$ | 43 | $ | 6 | $ | (2 | ) | $ | — | $ | 47 | ||||||
Year ended December 31, 2007 |
$ | 39 | $ | 3 | $ | 1 | $ | — | $ | 43 | |||||||
Year ended December 31, 2006 |
$ | 34 | $ | 6 | $ | — | $ | (1 | ) | $ | 39 | ||||||
F-118
| Number | Description | ||
|---|---|---|---|
| 1.1 | Underwriting Agreement, dated as of August 2, 2007, by and among the Company, MatlinPatterson Global Opportunities Partners L.P., MatlinPatterson Global Opportunities Partners B, L.P., MatlinPatterson Global Opportunities Partners (Bermuda) L.P. and Credit Suisse Securities (USA) LLC (incorporated by reference to Exhibit 1.1 to our current report on Form 8-K filed on August 6, 2007) | ||
2.1 |
Asset Purchase Agreement, dated February 15, 2007 among Flint Hills Resources, LLC, Huntsman International LLC, Huntsman Petrochemical Corporation, Huntsman International Chemicals Corporation, Huntsman Polymers Holdings Corporation, Huntsman Expandable Polymers Company, LLC, Huntsman Polymers Corp. and Huntsman Chemical Company of Canada, Inc. (incorporated by reference to Exhibit 2.1 to our current report on Form 8-K filed on February 20, 2007) |
||
2.2 |
Amended and Restated Asset Purchase Agreement dated June 22, 2007 among Flint Hills Resources, LP, Flint Hills Resources, LLC, Huntsman International LLC, Huntsman Petrochemical Corporation, Huntsman International Chemicals Corporation, Huntsman Polymers Holdings Corporation, Huntsman Expandable Polymers Company, LC, Huntsman Polymers Corp. and Huntsman Chemical Company of Canada, Inc. (incorporated by reference to Exhibit 2.1 to our current report on Form 8-K filed on June 25, 2007) |
||
2.3 |
Agreement and Plan of Merger, dated as of June 26, 2007, among the Company, Basell AF and BI Acquisition Holdings Limited (incorporated by reference to Exhibit 2.1 to our current report on Form 8-K filed on June 27, 2007) |
||
2.4 |
Agreement and Plan of Merger, dated as of July 12, 2007, among the Company, Hexion Specialty Chemicals, Inc. and Nimbus Merger Sub Inc. (incorporated by reference to Exhibit 2.1 to our current report on Form 8-K filed on July 13, 2007) |
||
3.1 |
Certificate of Designations, Preferences and Rights of 5% Mandatory Convertible Preferred Stock (incorporated by reference to Exhibit 3.1 to our current report on Form 8-K filed on February 16, 2005) |
||
3.2 |
Second Amended and Restated Certificate of Incorporation of the Company (incorporated by reference to Exhibit 3.1(i) to our current report on Form 8-K filed on November 26, 2008) |
||
3.3 |
Second Amended and Restated Bylaws of the Company (incorporated by reference to Exhibit 3.1(ii) to our current report on Form 8-K filed on November 26, 2008) |
||
4.1 |
Indenture, dated as of September 30, 2003, among Huntsman LLC, the Guarantors party thereto and HSBC Bank USA, as Trustee, relating to the 115/8% Senior Secured Notes due 2010 (incorporated by reference to Exhibit 4.36 to Huntsman LLC's registration statement on Form S-4 filed on January 29, 2004 (File No. 333-112279)) |
||
4.2 |
Form of Unrestricted 115/8% Senior Secured Note due 2010 (included as Exhibit A-2 to Exhibit 4.1) |
||
4.3 |
Form of Guarantee relating to the 115/8% Senior Secured Notes due 2010 (included as Exhibit E to Exhibit 4.1) |
||
4.4 |
Indenture, dated as of June 22, 2004, among Huntsman LLC, the Guarantors party thereto and HSBC Bank USA, as Trustee, relating to the 111/2% Senior Notes due 2012 and Senior Floating Rate Notes due 2011 (incorporated by reference to Exhibit 4.1 to Huntsman LLC's quarterly report on Form 10-Q for the three months ended June 30, 2004, filed on August 16, 2004) |
||
4.5 |
Form of Restricted Fixed Rate Note due 2012 (included as Exhibit A-1 to Exhibit 4.4) |
||
| Number | Description | ||
|---|---|---|---|
| 4.6 | Form of Restricted Floating Rate Note due 2011 (included as Exhibit A-2 to Exhibit 4.4) | ||
4.7 |
Form of Guarantee relating to the 111/2% Senior Notes due 2012 and Senior Floating Rate Notes due 2011 (included as Exhibit E to Exhibit 4.4) |
||
4.8 |
Indenture, dated as of December 17, 2004, among Huntsman International LLC, as Issuer, the Guarantors named therein and Wells Fargo Bank, National Association, as Trustee, relating to the 73/8% Senior Subordinated Notes due 2015 and the 71/2% Senior Subordinated Notes due 2015 (incorporated by reference to Exhibit 4.1 to Huntsman International LLC's current report on Form 8-K filed on December 23, 2004) |
||
4.9 |
Form of Restricted 73/8% Senior Subordinated Note denominated in dollars due 2015 (included as Exhibit A-1 to Exhibit 4.8) |
||
4.10 |
Form of Restricted 71/2% Senior Subordinated Note denominated in euros due 2015 (included as Exhibit A-2 to Exhibit 4.8) |
||
4.11 |
Form of Unrestricted 73/8% Senior Subordinated Note denominated in dollars due 2015 (included as Exhibit A-3 to Exhibit 4.8) |
||
4.12 |
Form of Unrestricted 71/2% Senior Subordinated Note denominated in euros due 2015 (included as Exhibit A-4 to Exhibit 4.8) |
||
4.13 |
Form of Guarantee (included as Exhibit E to Exhibit 4.8) |
||
4.14 |
Registration Rights Agreement dated as of February 10, 2005, by and among the Company and the stockholders signatory thereto (incorporated by reference to Exhibit 10.1 to our current report on Form 8-K filed on February 16, 2005) |
||
4.15 |
Form of stock certificate of Huntsman Corporation (incorporated by reference to Exhibit 4.68 to amendment No. 3 to our registration statement on Form S-1 filed on February 8, 2005 (File No. 333-120749)) |
||
4.16 |
Form of mandatory convertible preferred stock certificate of Huntsman Corporation (incorporated by reference to Exhibit A to Exhibit 3.01 to our current report on Form 8-K filed February 16, 2005) |
||
4.17 |
Supplemental Indenture, dated as of July 11, 2005, among Huntsman LLC, the Guarantors named therein and HSBC Bank USA, National Association, as Trustee, relating to the 111/2% Huntsman LLC Senior Notes due 2012 and Huntsman LLC Senior Floating Rate Notes due 2011 (incorporated by reference to Exhibit 4.1 to Huntsman LLC's current report on Form 8-K filed on July 15, 2005) |
||
4.18 |
Supplemental Indenture, dated as of July 13, 2005 among Huntsman LLC, the Guarantors named therein and HSBC Bank USA, National Association, as Trustee, relating to the 115/8% Huntsman LLC Senior Secured Notes due 2010 (incorporated by reference to Exhibit 4.2 to Huntsman LLC's current report on Form 8-K filed on July 15, 2005) |
||
4.19 |
Supplemental Indenture dated August 16, 2005 to Indenture dated as December 17, 2004 by and among Huntsman International LLC, the guarantors named therein, and Wells Fargo Bank, National Association (as successor by consolidation to Wells Fargo Bank Minnesota, National Association), as trustee, relating to Huntsman International LLC's dollar denominated 73/8% Senior Subordinated Notes due 2015 and euro denominated 71/2% Senior Subordinated Notes due 2015 (incorporated by reference to Exhibit 4.4 to Huntsman International LLC's current report on Form 8-K filed on August 22, 2005) |
||
| Number | Description | ||
|---|---|---|---|
| 4.20 | Supplemental Indenture dated August 16, 2005, to Indenture dated as of September 30, 2003 by and among Huntsman International LLC (as successor to Huntsman LLC), the guarantors named therein, and HSBC Bank USA, National Association, as trustee, relating to Huntsman International LLC's 115/8% Senior Secured Notes due 2010, originally issued by Huntsman LLC (incorporated by reference to Exhibit 4.7 to Huntsman International LLC's current report on Form 8-K filed on August 22, 2005) | ||
4.21 |
Supplemental Indenture dated August 16, 2005, to Indenture dated as of June 22, 2004 by and among Huntsman International LLC (as successor to Huntsman LLC), the guarantors named therein, and HSBC Bank USA, National Association, as trustee, relating to Huntsman International LLC's 111/2% Senior Notes due 2012 and Senior Floating Rate Notes due 2011, originally issued by Huntsman LLC (incorporated by reference to Exhibit 4.10 to Huntsman International LLC's current report on Form 8-K filed on August 22, 2005) |
||
4.22 |
Form of Restricted Stock Agreement for Outside Directors, effective for grants prior to February 6, 2008 (incorporated by reference to Exhibit 4.7 to our registration statement on Form S-8 filed on February 10, 2006 (File No. 333-131729)) |
||
4.23 |
Form of Restricted Stock Unit Agreement for Outside Directors effective for grants prior to February 6, 2008 (incorporated by reference to Exhibit 4.8 of our registration statement on Form S-8 filed on February 10, 2006 (File No. 333-131729)) |
||
4.24 |
Indenture, dated as of November 13, 2006, among Huntsman International LLC, as Issuer, the Guarantors party thereto, and Wells Fargo Bank, National Association, as Trustee, relating to the $200,000,000 77/8% Senior Subordinated Notes due 2014 and the €400,000,000 67/8 Senior Subordinated Notes due 2013 (incorporated by reference to Exhibit 4.1 to our quarterly report on Form 10-Q for the three months ended September 30, 2006, filed on November 14, 2006) |
||
4.25 |
Form of Restricted 77/8% Senior Subordinated Note denominated in dollars due 2014 (included as Exhibit A-1 to Exhibit 4.24) |
||
4.26 |
Form of Restricted 67/8% Senior Subordinated Note denominated in euros due 2013 (included as Exhibit A-2 to Exhibit 4.24) |
||
4.27 |
Form of Unrestricted 77/8% Senior Subordinated Note denominated in dollars due 2014 (included as Exhibit A-3 to Exhibit 4.24) |
||
4.28 |
Form of Unrestricted 67/8% Senior Subordinated Note denominated in euros due 2013 (included as Exhibit A-4 to Exhibit 4.24) |
||
4.29 |
Exchange and Registration Rights Agreement, dated as of November 13, 2006, among Huntsman International LLC, as Issuer, the Guarantors party thereto, and the Purchasers as defined therein, relating to $200,000,000 aggregated principal amount of the 77/8% Senior Subordinated Notes due 2014 (incorporated by reference to Exhibit 4.2 to our quarterly report on Form 10-Q for the three months ended September 30, 2006, filed on November 14, 2006) |
||
4.30 |
Amended and Restated Registration Rights Agreement dated July 12, 2007, among the Company, Huntsman Family Holdings Company LLC, MatlinPatterson Global Opportunities Partners, L.P., MatlinPatterson Global Opportunities Partners B, L.P., MatlinPatterson Global Opportunities Partners (Bermuda), L.P. and the other stockholders party thereto (incorporated by reference to Exhibit 4.1 to our current report on Form 8-K filed on July 13, 2007) |
||
4.31 |
Form of Restricted Stock Agreement for Outside Directors (incorporated by reference to Exhibit 4.31 to our annual report on Form 10-K filed on February 22, 2008) |
||
| Number | Description | ||
|---|---|---|---|
| 4.32 | Form of Restricted Stock Unit Agreement for Outside Directors (incorporated by reference to Exhibit 4.32 to our annual report on Form 10-K filed on February 22, 2008) | ||
10.1 |
Aircraft Dry Lease, dated as of September 14, 2001, between Jstar Corporation and Airstar Corporation (incorporated by reference to Exhibit 10.10 to amendment No. 1 to the registration statement on Form S-4 of Huntsman LLC filed on February 11, 2004 (File No. 333-112279)) |
||
10.2 |
Business Consulting Agreement, dated as of June 3, 2003, between Huntsman International LLC and Jon M. Huntsman (incorporated by reference to Exhibit 10.41 to amendment No. 1 to the registration statement on Form S-4 of Huntsman International LLC (File No. 333-106482)) |
||
10.3 |
Huntsman Cost Reduction Incentive Plan and Form of Participation Agreement (incorporated by reference to Exhibit 10.1 to the current report on Form 8-K of HMP Equity Holdings Corporation filed on November 23, 2004) |
||
10.4 |
Gift Agreement by and among Huntsman Group Inc. and the Jon and Karen Huntsman Foundation (incorporated by reference to Exhibit 10.17 to amendment No. 4 to our registration statement on Form S-1 filed on February 8, 2005 (File No. 333-120749)) |
||
10.5 |
Pledge, Assignment and Collateral Agency Agreement dated February 16, 2005 between the Company and Citibank, N.A. (incorporated by reference to Exhibit 10.18 to amendment No. 4 to our registration statement on Form S-1 filed on February 8, 2005 (File No. 333-120749)) |
||
10.6 |
Huntsman Corporation Stock Incentive Plan (incorporated by reference to Exhibit 10.19 to amendment No. 4 to our registration statement on Form S-1 filed on February 8, 2005 (File No. 333-120749)) |
||
10.7 |
Form of Nonqualified Stock Option Agreement (incorporated by reference to Exhibit 10.20 to amendment No. 4 to our registration statement on Form S-1 filed on February 8, 2005 (File No. 333-120749)) |
||
10.8 |
Form of Restricted Stock Agreement, effective for grants prior to February 6, 2008 (incorporated by reference to Exhibit 10.21 to amendment No. 4 to our registration statement on Form S-1 filed on February 8, 2005 (File No. 333-120749)) |
||
10.9 |
Form of Stock Appreciation Rights Agreement (incorporated by reference to Exhibit 10.22 to amendment No. 4 to our registration statement on Form S-1 filed on February 8, 2005 (File No. 333-120749)) |
||
10.10 |
Form of Phantom Share Agreement, effective for grants prior to February 6, 2008 (incorporated by reference to Exhibit 10.23 to amendment No. 4 to our registration statement on Form S-1 filed on February 8, 2005 (File No. 333-120749)) |
||
10.11 |
Form of Executive Severance Plan (as amended and restated) (incorporated by reference to Exhibit 10.24 to amendment No. 4 to our registration statement on Form S-1 filed on February 8, 2005 (File No. 333-120749)) |
||
10.12 |
Form of Indemnification Agreement (incorporated by reference to Exhibit 10.25 to amendment No. 4 to our registration statement on Form S-1 filed on February 8, 2005 (File No. 333-120749)) |
||
10.13 |
Employment Agreement with Paul Hulme (incorporated by reference to Exhibit 10.24 to amendment No. 1 to our registration statement on Form S-1 dated January 6, 2005 (File No. 333-120749)) |
||
| Number | Description | ||
|---|---|---|---|
| 10.14 | Employment Agreement with Anthony Hankins (incorporated by reference to Exhibit 10.27 to amendment No. 2 to our registration statement on Form S-1 filed on January 28, 2005 (File No. 333-120749)) | ||
10.15 |
Huntsman Supplemental Executive Retirement Plan, as amended through the sixth amendment, April 21, 2005 (incorporated by reference to Exhibit 10.1 to our quarterly report on Form 10-Q for the three-months ended March 31, 2005, filed on May 11, 2005) |
||
10.16 |
Credit Agreement dated August 16, 2005 among Huntsman International LLC, Deutsche Bank AG New York Branch as Administrative Agent and the other financial institutions named therein (incorporated by reference to Exhibit 10.1 to Huntsman International LLC's current report on Form 8-K filed August 22, 2005) |
||
10.17 |
Intercreditor Agreement dated August 16, 2005 among Deutsche Bank AG New York Branch as collateral agent and administrative agent under the above referenced credit agreement, and HSBC Bank USA, National Association as trustee under the indenture governing Huntsman International LLC's 115/8% Senior Secured Notes (incorporated by reference to Exhibit 10.2 to Huntsman International LLC's current report on Form 8-K filed August 22, 2005) |
||
10.18 |
Second Amendment to Amended and Restated Pooling Agreement, dated August 16, 2005, among Huntsman Receivables France LLC, Huntsman (Europe), BVBA and J.P. Morgan Bank (incorporated by reference to Exhibit 10.4 to Huntsman International LLC's current report on Form 8-K filed on August 22, 2005) |
||
10.19 |
Fourth Amendment to 2000-1 Supplement, dated August 16, 2005, among Huntsman Receivables Finance LLC, Huntsman (Europe), BVBA and J.P. Morgan (Ireland) Plc (incorporated by reference to Exhibit 10.5 to Huntsman International LLC's current report on Form 8-K filed on August 22, 2005) |
||
10.20 |
Form of Non-qualified Stock Option Agreement for Outside Directors (incorporated by reference to Exhibit 10.1 to our current report on Form 8-K filed November 8, 2005) |
||
10.21 |
Amended and Restated Huntsman Supplemental Executive Retirement Plan (incorporated by reference to Exhibit 10.1 to our current report on Form 8-K filed December 30, 2005) |
||
10.22 |
Huntsman Supplemental Executive MPP Plan (incorporated by reference to Exhibit 10.2 to our current report on Form 8-K filed December 30, 2005) |
||
10.23 |
Amended and Restated Huntsman Supplemental Savings Plan (incorporated by reference to Exhibit 10.3 to our current report on Form 8-K filed December 30, 2005) |
||
10.24 |
Huntsman Outside Directors Elective Deferral Plan (incorporated by reference to Exhibit 10.4 to our current report on Form 8-K filed December 30, 2005) |
||
10.25 |
Second Amended and Restated Pooling Agreement, among Huntsman Receivables Finance LLC, Huntsman (Europe) BVBA and J.P. Morgan Bank (Ireland), as trustee, dated as of April 18, 2006 (incorporated by reference to Exhibit 10.1 to our quarterly report on Form 10-Q for the three months ended March 31, 2006, filed on May 9, 2006) |
||
10.26 |
Amended and Restated 2000-1 Supplement to Second Amended and Restated Pooling Agreement, among Huntsman Receivables Finance LLC, Huntsman (Europe) BVBA, Jupiter Securitization Corporation, the several financial institutions party thereto as funding agents, the Series 2000-1 Conduit Purchasers party thereto, the several financial institutions party thereto as Series 2000-1 APA Banks, J.P.Morgan Securities Ltd., JPMorgan Chase Bank, N.A., and J.P.Morgan (Ireland) plc, as trustee, dated as of April 18, 2006 (incorporated by reference to Exhibit 10.2 to our quarterly report on Form 10-Q for the three months ended March 31, 2006, filed on May 9, 2006) |
||
| Number | Description | ||
|---|---|---|---|
| 10.27 | Amended and Restated Contribution Agreement, between Huntsman International LLC and Huntsman Receivables Finance LLC, dated as of April 18, 2006 (incorporated by reference to Exhibit 10.3 to our quarterly report on Form 10-Q for the three months ended March 31, 2006, filed on May 9, 2006) | ||
10.28 |
Second Amended and Restated Servicing Agreement, dated as of April 18, 2006, among Huntsman Receivables Finance LLC, Huntsman (Europe) BVBA, the various affiliates of Huntsman International LLC party thereto as local servicers, J.P.Morgan Bank (Ireland), as Trustee, PricewaterhouseCoopers LLP, and Huntsman International LLC (incorporated by reference to Exhibit 10.4 to our quarterly report on Form 10-Q for the three months ended March 31, 2006, filed on May 9, 2006) |
||
10.29 |
Consent and Second Amendment to Credit Agreement and Amendment to Security Documents, dated June 30, 2006, by and among Huntsman International LLC, as Borrower, Deutsche Bank AG New York Branch, as Administrative Agent and Collateral Agent, and the other financial institutions party thereto (incorporated by reference to Exhibit 10.1 to our current report on Form 8-K filed on July 7, 2006) |
||
10.30 |
Withdrawal of Originator, dated November 28, 2006, among Huntsman Receivables Finance LLC, Huntsman (Europe) BVBA, the various affiliates of Huntsman International LLC party thereto as local servicers, J.P.Morgan Bank (Ireland), as Trustee, PricewaterhouseCoopers LLP, and Huntsman International LLC (incorporated by reference to Exhibit 10.30 to our annual report on Form 10-K filed on March 1, 2007) |
||
10.31 |
Third Amendment to Credit Agreement dated April 19, 2007 by and among Huntsman International LLC, as Borrower, Deutsche Bank AG New York Branch, as Administrative Agent and Collateral Agent, and the other financial institutions party thereto (incorporated by reference to Exhibit 10.1 to our current report on Form 8-K filed on April 23, 2007) |
||
10.32 |
First Amendment to Huntsman Supplemental Executive Retirement Plan (incorporated by reference to Exhibit 10.32 to our annual report on Form 10-K filed on February 22, 2008) |
||
10.33 |
First Amendment to Huntsman Supplemental Executive MPP Plan (incorporated by reference to Exhibit 10.33 to our annual report on Form 10-K filed on February 22, 2008) |
||
10.34 |
First Amendment to Huntsman Supplemental Savings Plan (incorporated by reference to Exhibit 10.34 to our annual report on Form 10-K filed on February 22, 2008) |
||
10.35 |
Second Amendment to Huntsman Supplemental Savings Plan (incorporated by reference to Exhibit 10.35 to our annual report on Form 10-K filed on February 22, 2008) |
||
10.36 |
First Amendment to Huntsman Outside Directors Elective Deferral Plan (incorporated by reference to Exhibit 10.36 to our annual report on Form 10-K filed on February 22, 2008) |
||
10.37 |
Form of Restricted Stock Agreement (incorporated by reference to Exhibit 10.37 to our annual report on Form 10-K filed on February 22, 2008) |
||
10.38 |
Form of Phantom Share Agreement (incorporated by reference to Exhibit 10.38 to our annual report on Form 10-K filed on February 22, 2008) |
||
10.39 |
Huntsman Corporation's Acceptance of Backstop Commitment dated October 26, 2008, among the Company and certain stockholders (incorporated by reference to Exhibit 10.1 to our current report on Form 8-K filed on October 28, 2008) |
||
| Number | Description | ||
|---|---|---|---|
| 10.40 | Second Amendment to the Second Amended and Restated Pooling Agreement, among Huntsman Receivables Finance LLC, Huntsman (Europe) BVBA, the Series 2000-1 conduit purchasers party thereto, the several financial institutions party thereto as Series 2000-1 APA banks, the several financial institutions party thereto as funding agents, JPMorgan Chase Bank, N.A. as administrative agent and BNY Financial Services plc, the successor to J.P. Morgan Bank (Ireland) plc, as trustee, The Bank of New York Mellon, and JPMorgan Chase Bank, N.A., dated as of November 13, 2008 (incorporated by reference to Exhibit 10.1 to our current report on Form 8-K filed on November 19, 2008) | ||
10.41 |
Second Amended and Restated 2000-1 Supplement to Second Amended and Restated Pooling Agreement, among Huntsman Receivables Finance LLC, Huntsman (Europe) BVBA, the several financial institutions party thereto as funding agents, the Series 2000-1 Conduit Purchasers party thereto, the several financial institutions party thereto as Series 2000-1 APA Banks, J.P.Morgan Securities Ltd., JPMorgan Chase Bank, N.A., and BNY Financial Services plc, the successor to J.P.Morgan (Ireland) plc, as trustee, dated as of November 13, 2008 (incorporated by reference to Exhibit 10.2 to our current report on Form 8-K filed on November 19, 2008) |
||
10.42 |
Amendment to the Second Amended and Restated Servicing Agreement, among Huntsman Receivables Finance LLC, Huntsman (Europe) BVBA, the various affiliates of Huntsman International LLC party thereto as local servicers, Huntsman International LLC, as servicer guarantor, BNY Financial Services plc, the successor to J.P.Morgan Bank (Ireland), as trustee, and PricewaterhouseCoopers LLP, as liquidation servicer, dated as of November 13, 2008 (incorporated by reference to Exhibit 10.3 to our current report on Form 8-K filed on November 19, 2008) |
||
10.43 |
Settlement Agreement and Release, dated December 14, 2008, among Huntsman Corporation, Jon M. Huntsman, Peter R. Huntsman, Hexion Specialty Chemicals, Inc., Hexion LLC, Nimbus Merger Sub, Inc., Craig O. Morrison, Leon Black, Joshua J. Harris and Apollo Global Management, LLC and certain of its affiliates (incorporated by reference to Exhibit 10.1 to our current report on Form 8-K filed on December 15, 2008) |
||
10.44 |
Letter Agreement, dated December 14, 2008, among Huntsman Corporation, Jon M. Huntsman, Peter R. Huntsman, Hexion Specialty Chemicals, Inc., Hexion LLC, Nimbus Merger Sub, Inc., Craig O. Morrison, Leon Black, Joshua J. Harris and Apollo Global Management, LLC and certain of its affiliates (incorporated by reference to Exhibit 10.2 to our current report on Form 8-K filed on December 15, 2008) |
||
10.45 |
Note Purchase Agreement, dated December 23, 2008, by and among Huntsman Corporation and Apollo Investment Fund VI, L.P. and certain of its affiliates (incorporated by reference to Exhibit 10.1 to our current report on Form 8-K filed on December 23, 2008) |
||
10.46 |
Registration Rights Agreement, dated December 23, 2008, by and among Huntsman Corporation and Apollo Investment Fund VI, L.P. and certain of its affiliates (incorporated by reference to Exhibit 10.2 to our current report on Form 8-K filed on December 23, 2008) |
||
10.47 |
Voting and Standstill Agreement, dated December 23, 2008, by and among Huntsman Corporation and Apollo Investment Fund VI, L.P. and certain of its affiliates (incorporated by reference to Exhibit 10.3 to our current report on Form 8-K filed on December 23, 2008) |
||
21.1 |
* |
Subsidiaries of the Company |
|
23.1 |
* |
Consent of Independent Registered Public Accounting Firm |
|
31.1 |
* |
Certification of Chief Executive Officer pursuant to Section 302 of the Sarbanes-Oxley Act of 2002 |
|
| Number | Description | ||
|---|---|---|---|
| 31.2 | * | Certification of Chief Financial Officer pursuant to Section 302 of the Sarbanes-Oxley Act of 2002 | |
32.1 |
* |
Certification of Chief Executive Officer pursuant to Section 906 of the Sarbanes-Oxley Act of 2002 |
|
32.2 |
* |
Certification of Chief Financial Officer pursuant to Section 906 of the Sarbanes-Oxley Act of 2002 |
|