| 1 Huntsman Investor Day November 9, 2021 |
| 2 General Disclosure Forward-Looking Statements This presentation includes “forward-looking statements” within the meaning of Section 27A of the Securities Act of 1933 and Section 21E of the Securities Exchange Act of 1934. These forward-looking statements include statements concerning our plans, objectives, goals, strategies, future events, future revenue or performance, capital expenditures, financing needs, plans or intentions relating to acquisitions or strategic transactions, business trends and any other information that is not historical information. When used in this presentation, the words “estimates,” “expects,” “anticipates,” “likely,” “projects,” “outlook,” “plans,” “intends,” “believes,” “forecasts,” or future or conditional verbs, such as “will,” “should,” “could” or “may,” and variations of such words or similar expressions are intended to identify forward-looking statements. These forward-looking statements, including, without limitation, management’s examination of historical operating trends and data, are based upon our current expectations and various assumptions and beliefs. In particular, such forward-looking statements are subject to uncertainty and changes in circumstances and involve risks and uncertainties that may affect the company's operations, markets, products, prices and other factors as discussed in the Company’s filings with the U.S. Securities and Exchange Commission. Significant risks and uncertainties may relate to, but are not limited to, ongoing impact of COVID-19 on our operations and financial results, volatile global economic conditions, cyclical and volatile product markets, disruptions in production at manufacturing facilities, timing of proposed transactions, reorganization or restructuring of the Company’s operations, including any delay of, or other negative developments affecting the ability to implement cost reductions and manufacturing optimization improvements in the Company’s businesses and to realize anticipated cost savings, and other financial, operational, economic, competitive, environmental, political, legal, regulatory and technological factors. Any forward-looking statement should be considered in light of the risks set forth under the caption “Risk Factors” in our Annual Report on Form 10-K for the year ended December 31, 2020, which may be supplemented by other risks and uncertainties disclosed in any subsequent reports filed or furnished by the Company from time to time. All forward-looking statements apply only as of the date made. Except as required by law, the Company undertakes no obligation to update or revise forward-looking statements to reflect events or circumstances that arise after the date made or to reflect the occurrence of unanticipated events. Non-GAAP Financial Measures This presentation contains financial measures that are not in accordance with generally accepted accounting principles in the U.S. ("GAAP"), including adjusted EBITDA, adjusted EBITDA from discontinued operations, adjusted net income (loss), adjusted diluted income (loss) per share, free cash flow, adjusted free cash flow, and net debt. For more information on the non-GAAP financial measures used by the Company and referenced in this presentation, including definitions and reconciliations of non-GAAP measures to GAAP, please refer to “Non-GAAP Reconciliation” hyperlink available in the “Financials” section of the Company’s website at www.huntsman.com/investors. The Company does not provide reconciliations of forward-looking non-GAAP financial measures to the most comparable GAAP financial measures on a forward-looking basis because the Company is unable to provide a meaningful or accurate calculation or estimation of reconciling items and the information is not available without unreasonable effort. This is due to the inherent difficulty of forecasting the timing and amount of certain items, such as, but not limited to, (a) business acquisition and integration expenses, (b) merger costs, and (c) certain legal and other settlements and related costs. Each of such adjustments has not yet occurred, are out of the Company's control and/or cannot be reasonably predicted. For the same reasons, the Company is unable to address the probable significance of the unavailable information. Third-Party Trademarks Any third-party trademarks displayed in this presentation are not owned by the Company, and no relationship between the Company and any third party is implied. 2021 Huntsman Investor Day |
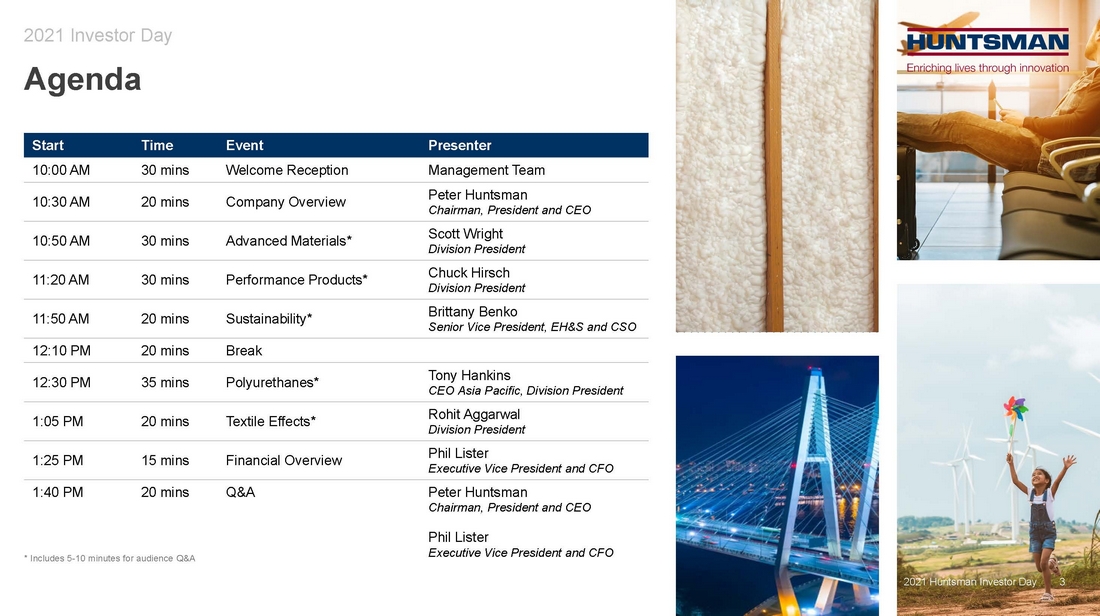
| 3 Agenda 2021 Investor Day Start Time Event Presenter 10:00 AM 30 mins Welcome Reception Management Team 10:30 AM 20 mins Company Overview Peter Huntsman Chairman, President and CEO 10:50 AM 30 mins Advanced Materials* Scott Wright Division President 11:20 AM 30 mins Performance Products* Chuck Hirsch Division President 11:50 AM 20 mins Sustainability* Brittany Benko Senior Vice President, EH&S and CSO 12:10 PM 20 mins Break 12:30 PM 35 mins Polyurethanes* Tony Hankins CEO Asia Pacific, Division President 1:05 PM 20 mins Textile Effects* Rohit Aggarwal Division President 1:25 PM 15 mins Financial Overview Phil Lister Executive Vice President and CFO 1:40 PM 20 mins Q&A Peter Huntsman Chairman, President and CEO Phil Lister Executive Vice President and CFO * Includes 5-10 minutes for audience Q&A 3 2021 Huntsman Investor Day |
| 4 Company Overview Peter Huntsman Chairman, President and CEO |
| 5 2021 Huntsman Investor Day 5 Our Mission Enriching Lives Through Innovation For 50 years, our employees have been using science and ingenuity to create innovations that play a critical role in the everyday lives of many millions of people. We work in deep partnership with our customers to create solutions that help make people’s lives more sustainable, effective and comfortable. |

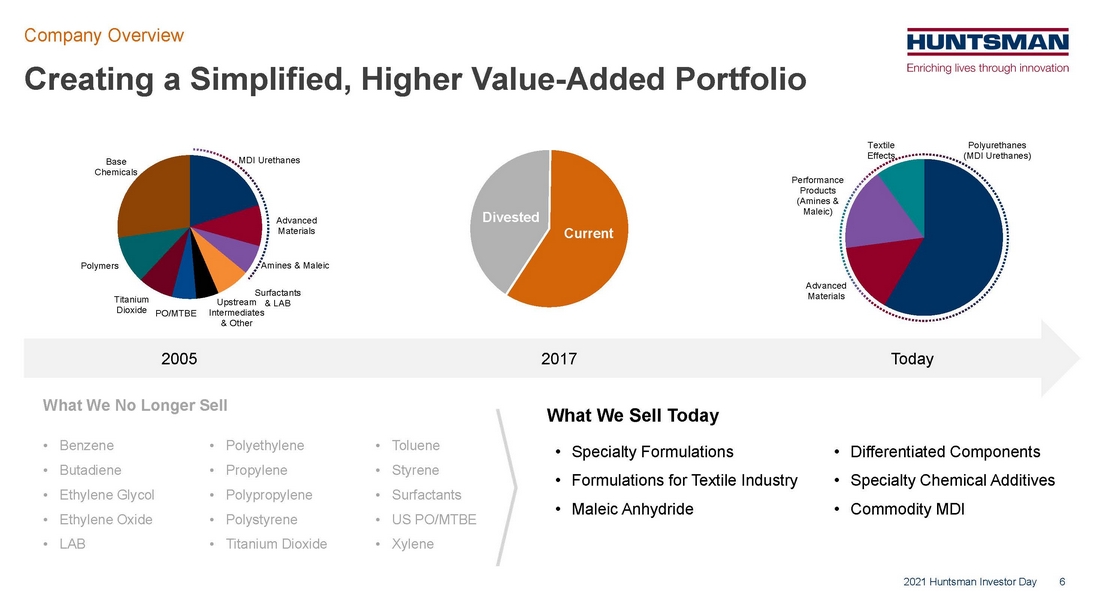
| 6 Divested Current Creating a Simplified, Higher Value-Added Portfolio Company Overview 2021 Huntsman Investor Day 2005 2017 Today What We No Longer Sell • Benzene • Butadiene • Ethylene Glycol • Ethylene Oxide • LAB • Polyethylene • Propylene • Polypropylene • Polystyrene • Titanium Dioxide • Toluene • Styrene • Surfactants • US PO/MTBE • Xylene What We Sell Today • Specialty Formulations • Formulations for Textile Industry • Maleic Anhydride • Differentiated Components • Specialty Chemical Additives • Commodity MDI MDI Urethanes Advanced Materials Amines & Maleic Surfactants & LAB Upstream Intermediates & Other PO/MTBE Titanium Dioxide Polymers Base Chemicals Polyurethanes (MDI Urethanes) Advanced Materials Performance Products (Amines & Maleic) Textile Effects |
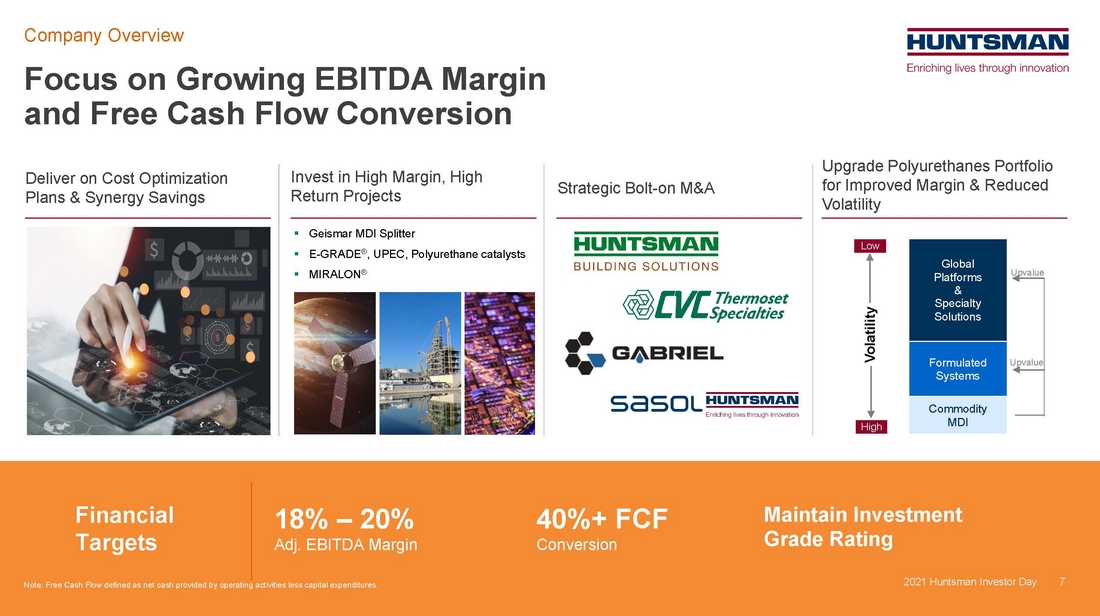
| 7 Focus on Growing EBITDA Margin and Free Cash Flow Conversion 2021 Huntsman Investor Day Company Overview 40%+ FCF Conversion Deliver on Cost Optimization Plans & Synergy Savings Invest in High Margin, High Return Projects Strategic Bolt-on M&A Upgrade Polyurethanes Portfolio for Improved Margin & Reduced Volatility .. Geismar MDI Splitter .. E-GRADE®, UPEC, Polyurethane catalysts .. MIRALON® 7 18% – 20% Adj. EBITDA Margin Financial Targets Maintain Investment Grade Rating HB S Commodity MDI Formulated Systems Global Platforms & Specialty Solutions Series 1 Upvalue Upvalue Volatility Low High Low High Volatility High Low Note: Free Cash Flow defined as net cash provided by operating activities less capital expenditures. |
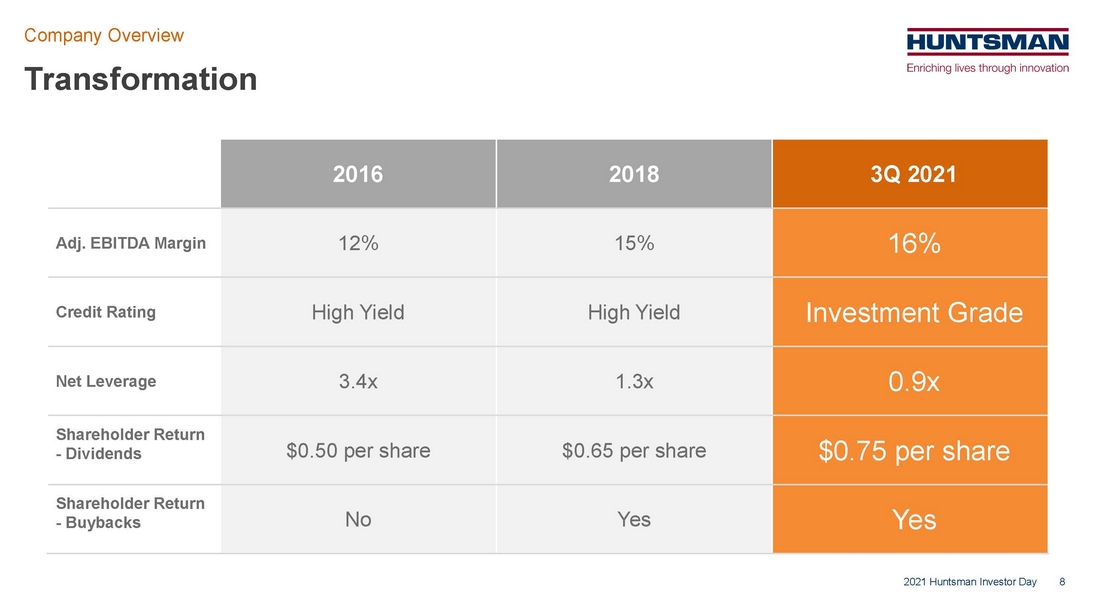
| 8 Transformation 2021 Huntsman Investor Day Company Overview 8 2016 2018 3Q 2021 Adj. EBITDA Margin 12% 15% 16% Credit Rating High Yield High Yield Investment Grade Net Leverage 3.4x 1.3x 0.9x Shareholder Return - Dividends $0.50 per share $0.65 per share $0.75 per share Shareholder Return - Buybacks No Yes Yes |
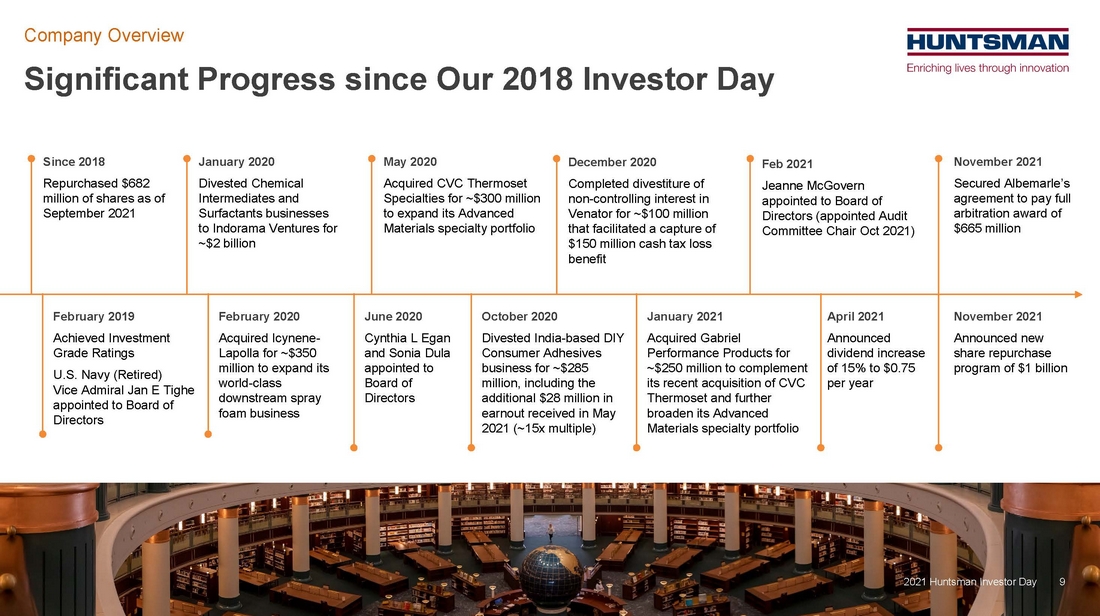
| 9 Significant Progress since Our 2018 Investor Day Company Overview 2021 Huntsman Investor Day 2021 Huntsman Investor Day 9 Since 2018 Repurchased $682 million of shares as of September 2021 January 2020 Divested Chemical Intermediates and Surfactants businesses to Indorama Ventures for ~$2 billion May 2020 Acquired CVC Thermoset Specialties for ~$300 million to expand its Advanced Materials specialty portfolio December 2020 Completed divestiture of non-controlling interest in Venator for ~$100 million that facilitated a capture of $150 million cash tax loss benefit Feb 2021 Jeanne McGovern appointed to Board of Directors (appointed Audit Committee Chair Oct 2021) November 2021 Secured Albemarle’s agreement to pay full arbitration award of $665 million February 2019 Achieved Investment Grade Ratings U.S. Navy (Retired) Vice Admiral Jan E Tighe appointed to Board of Directors February 2020 Acquired Icynene- Lapolla for ~$350 million to expand its world-class downstream spray foam business October 2020 Divested India-based DIY Consumer Adhesives business for ~$285 million, including the additional $28 million in earnout received in May 2021 (~15x multiple) January 2021 Acquired Gabriel Performance Products for ~$250 million to complement its recent acquisition of CVC Thermoset and further broaden its Advanced Materials specialty portfolio April 2021 Announced dividend increase of 15% to $0.75 per year November 2021 Announced new share repurchase program of $1 billion June 2020 Cynthia L Egan and Sonia Dula appointed to Board of Directors |
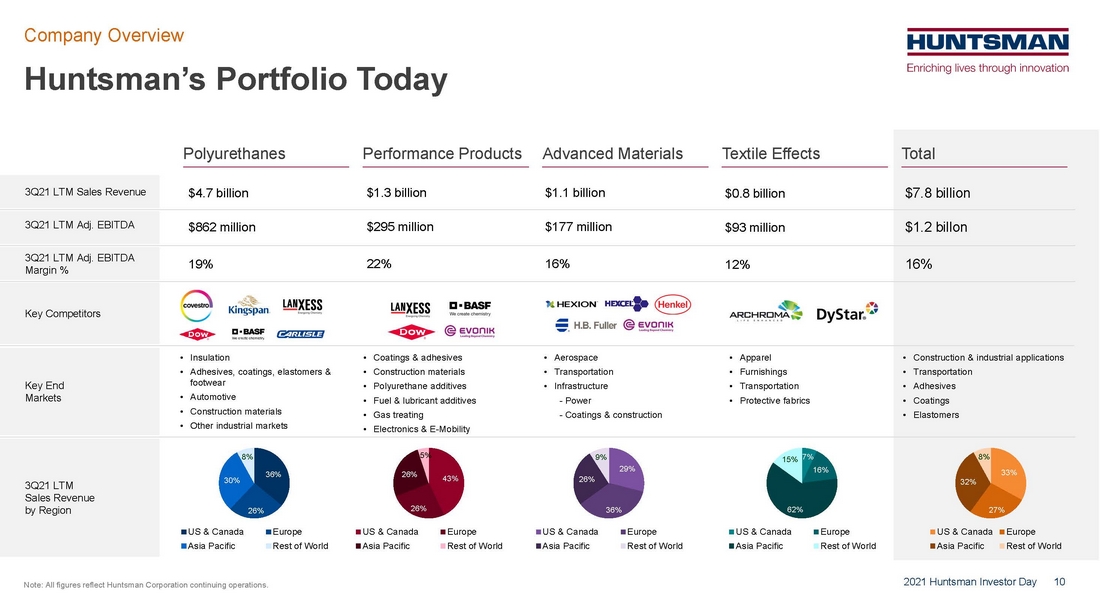
| 10 Huntsman’s Portfolio Today 2021 Huntsman Investor Day Company Overview Note: All figures reflect Huntsman Corporation continuing operations. Polyurethanes Performance Products Advanced Materials Textile Effects Total 3Q21 LTM Sales Revenue by Region 3Q21 LTM Sales Revenue 3Q21 LTM Adj. EBITDA 3Q21 LTM Adj. EBITDA Margin % $1.3 billion $4.7 billion $0.8 billion $7.8 billion $1.1 billion $295 million $862 million $93 million $1.2 billon $177 million 22% 19% 12% 16% 16% 33% 27% 32% 8% US & Canada Europe Asia Pacific Rest of World 7% 16% 62% 15% US & Canada Europe Asia Pacific Rest of World 29% 36% 26% 9% US & Canada Europe Asia Pacific Rest of World 43% 26% 26% 5% US & Canada Europe Asia Pacific Rest of World 36% 26% 30% 8% US & Canada Europe Asia Pacific Rest of World Key End Markets • Insulation • Adhesives, coatings, elastomers & footwear • Automotive • Construction materials • Other industrial markets • Apparel • Furnishings • Transportation • Protective fabrics • Aerospace • Transportation • Infrastructure - Power - Coatings & construction • Construction & industrial applications • Transportation • Adhesives • Coatings • Elastomers Key Competitors • Coatings & adhesives • Construction materials • Polyurethane additives • Fuel & lubricant additives • Gas treating • Electronics & E-Mobility |
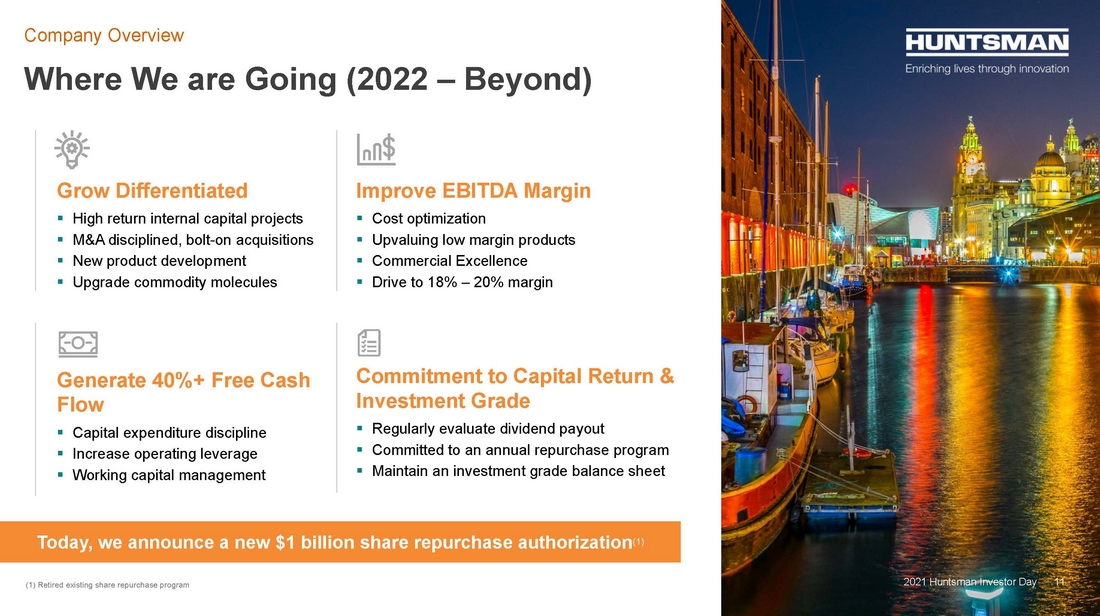
| 11 Where We are Going (2022 – Beyond) Company Overview Grow Differentiated .. High return internal capital projects .. M&A disciplined, bolt-on acquisitions .. New product development .. Upgrade commodity molecules Generate 40%+ Free Cash Flow .. Capital expenditure discipline .. Increase operating leverage .. Working capital management Improve EBITDA Margin .. Cost optimization .. Upvaluing low margin products .. Commercial Excellence .. Drive to 18% – 20% margin Commitment to Capital Return & Investment Grade .. Regularly evaluate dividend payout .. Committed to an annual repurchase program .. Maintain an investment grade balance sheet Today, we announce a new $1 billion share repurchase authorization(1) 2021 Huntsman Investor Day 11 (1) Retired existing share repurchase program |
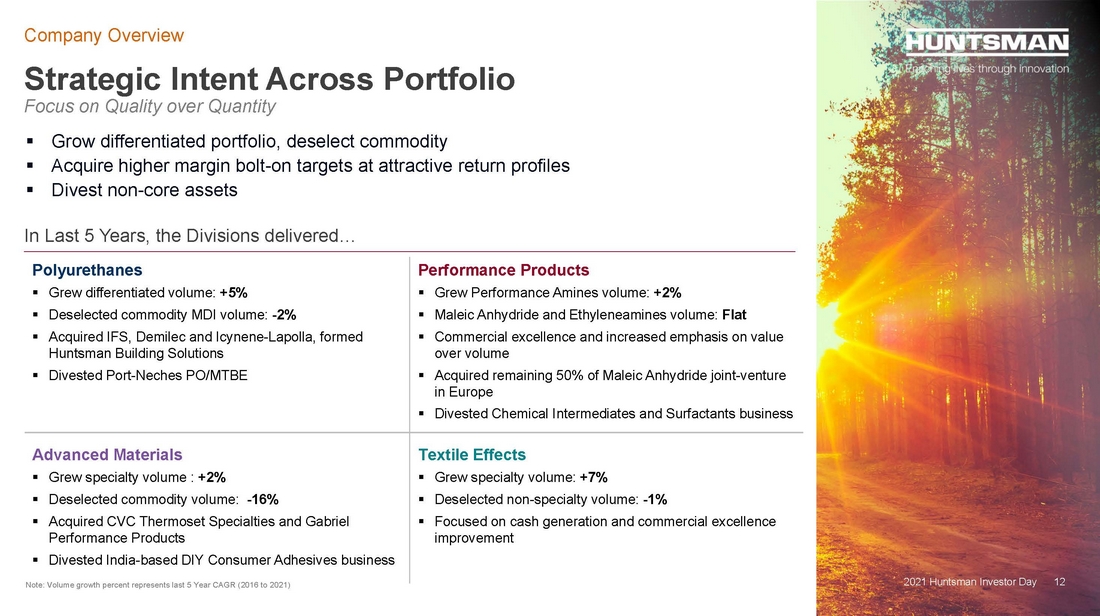
| 12 Strategic Intent Across Portfolio Focus on Quality over Quantity Company Overview 2021 Huntsman Investor Day 12 In Last 5 Years, the Divisions delivered… Polyurethanes .. Grew differentiated volume: +5% .. Deselected commodity MDI volume: -2% .. Acquired IFS, Demilec and Icynene-Lapolla, formed Huntsman Building Solutions .. Divested Port-Neches PO/MTBE Performance Products .. Grew Performance Amines volume: +2% .. Maleic Anhydride and Ethyleneamines volume: Flat .. Commercial excellence and increased emphasis on value over volume .. Acquired remaining 50% of Maleic Anhydride joint-venture in Europe .. Divested Chemical Intermediates and Surfactants business Advanced Materials .. Grew specialty volume : +2% .. Deselected commodity volume: -16% .. Acquired CVC Thermoset Specialties and Gabriel Performance Products .. Divested India-based DIY Consumer Adhesives business Textile Effects .. Grew specialty volume: +7% .. Deselected non-specialty volume: -1% .. Focused on cash generation and commercial excellence improvement Note: Volume growth percent represents last 5 Year CAGR (2016 to 2021) .. Grow differentiated portfolio, deselect commodity .. Acquire higher margin bolt-on targets at attractive return profiles .. Divest non-core assets |
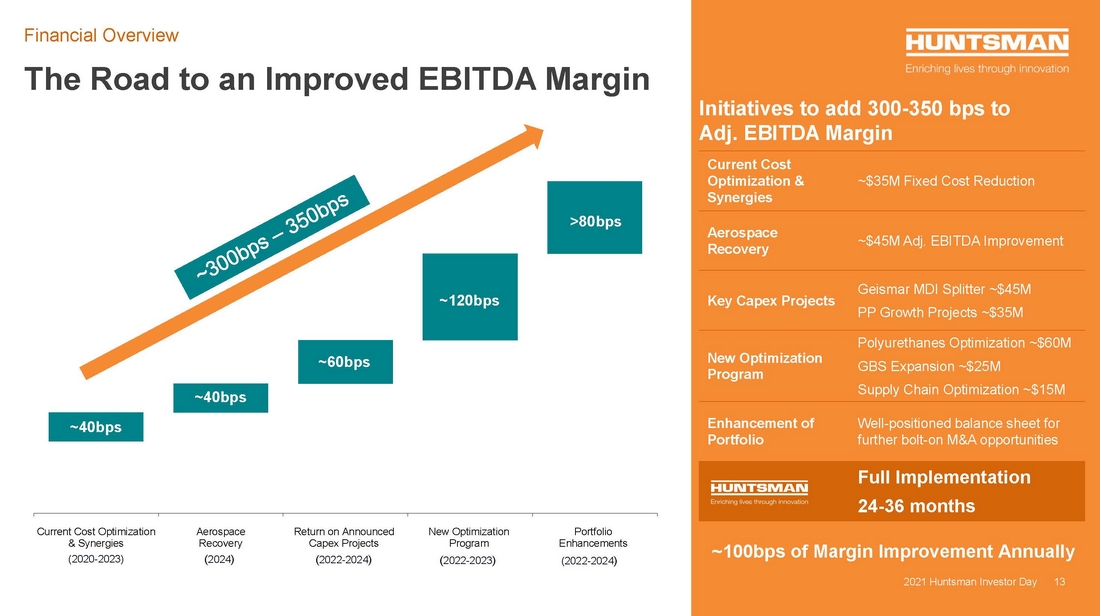
| 13 The Road to an Improved EBITDA Margin Financial Overview 2021 Huntsman Investor Day Initiatives to add 300-350 bps to Adj. EBITDA Margin Current Cost Optimization & Synergies ~$35M Fixed Cost Reduction Aerospace Recovery ~$45M Adj. EBITDA Improvement Key Capex Projects Geismar MDI Splitter ~$45M PP Growth Projects ~$35M New Optimization Program Polyurethanes Optimization ~$60M GBS Expansion ~$25M Supply Chain Optimization ~$15M Enhancement of Portfolio Well-positioned balance sheet for further bolt-on M&A opportunities Full Implementation 24-36 months 2021 Huntsman Investor Day 13 $0 0.0% $0 $0 ~40bps ~40bps ~60bps ~120bps >80bps $0 Current Cost Optimization & Synergies Aerospace Recovery Return on Announced Capex Projects New Optimization Program Portfolio Enhancements (2020-2023) (2024) (2022-2024) (2022-2024) (2022-2023) ~100bps of Margin Improvement Annually |
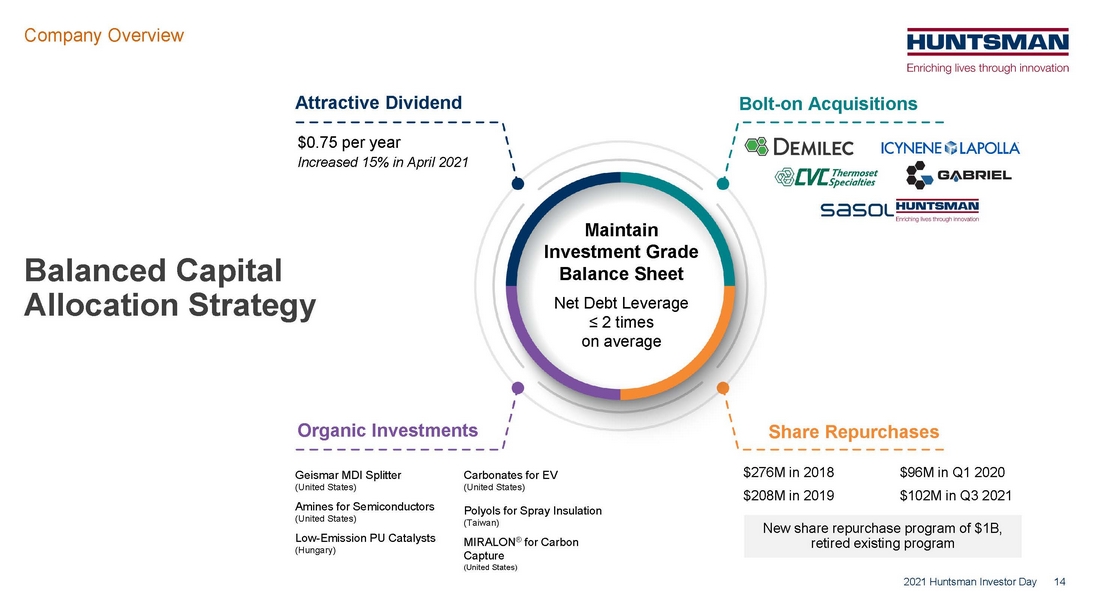
| 14 Balanced Capital Allocation Strategy 2021 Huntsman Investor Day Company Overview Maintain Investment Grade Balance Sheet Net Debt Leverage ≤ 2 times on average $276M in 2018 $208M in 2019 $96M in Q1 2020 $102M in Q3 2021 Share Repurchases Bolt-on Acquisitions Attractive Dividend $0.75 per year Increased 15% in April 2021 Organic Investments Geismar MDI Splitter (United States) Amines for Semiconductors (United States) Low-Emission PU Catalysts (Hungary) Carbonates for EV (United States) Polyols for Spray Insulation (Taiwan) MIRALON® for Carbon Capture (United States) New share repurchase program of $1B, retired existing program |
| 15 Since 2018: Strengthened Our Balance Sheet and Accelerated Return of Capital to Shareholders 2021 Huntsman Investor Day Company Overview $2.2B $1.0B 2018-2021 Total Cash Inflows Divestitures Adj. FCF $1.4B $0.8B $0.6B $0.7B 2018-2021 Total Cash Outflows Acquisitions Net Debt Reduction Dividends Buybacks $0 $1,000 $2,000 $3,000 $4,000 $5,000 $6,000 $7,000 2006 2007 2008 2009 2010 2011 2012 2013 2014 2015 2016 2017 2018 2019 2020 2021 YTD Cumulative Dividends Cumulative Buybacks Cumulative Net Debt Reduction Since 2006 Huntsman spent From 2006 to 2017 We Significantly Reduced Debt $3.6B(2) on Debt Reduction (net) $1.7B on Dividends $0.8B on Buybacks 2018 to Today, $3.2B of Cash generated from Divestitures & Adj. Free Cash Flow(1) Since 2018, Cash was used to support Bolt-on Acquisitions, Buybacks, Dividends & Net Debt Reduction (1) Adj. Free Cash Flow excludes the taxes paid in connection with the sale of our Chemical Intermediates Businesses and the sale of our India-based DIY business. (2) Does not reflect costs associated with early the extinguishment or issuance of debt USD in Millions |

| 16 Albemarle Litigation Settlement 2021 Huntsman Investor Day Company Overview On October 28, 2021 Huntsman won an arbitration award against Albemarle Corporation for fraud and breach of contract On November 4, 2021 Albemarle agreed to waive its appeal and accelerate full payment of award, paying Huntsman $332.5 million by December 3, 2021 and another $332.5 million by May 2, 2022 Net of legal fees but before taxes, Huntsman will receive in total $465 million Proceeds will be used for as follows: 1. Share Repurchases - Minimum 50% of Award, net of tax - This is additional to the annual minimum of $160 million of repurchases - The minimum 2022 buyback will be in excess of $300 million - Repurchases to be completed within 12 months of receiving each tranche of cash 2. Investments - Remaining cash to be allocated for corporate investments including business optimization restructuring and bolt-on acquisitions 16 |
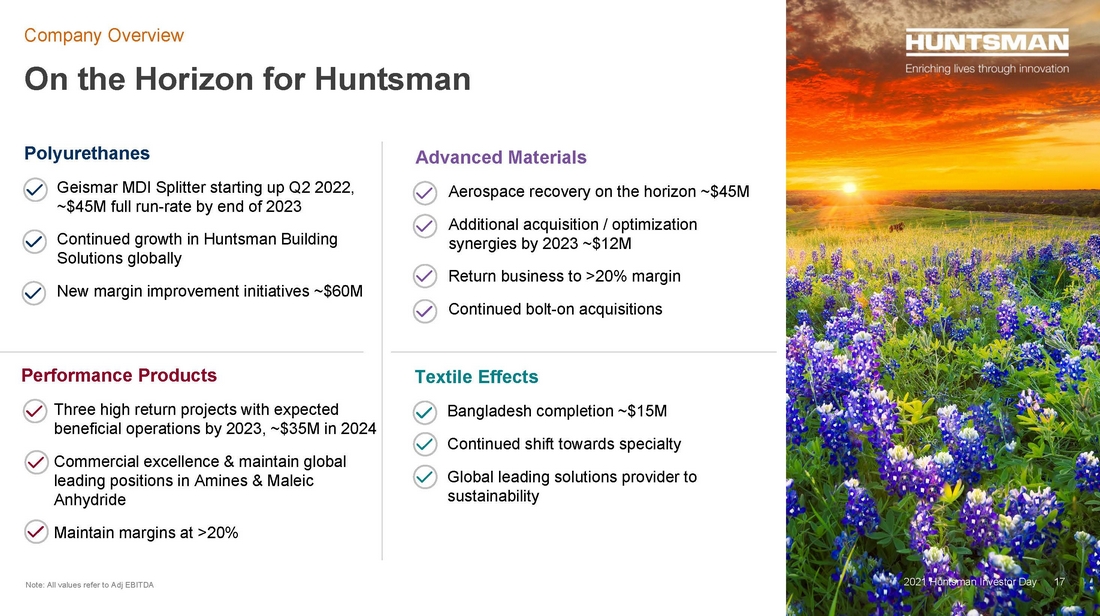
| 17 Textile Effects Bangladesh completion ~$15M Continued shift towards specialty Global leading solutions provider to sustainability On the Horizon for Huntsman 2021 Huntsman Investor Day Company Overview Polyurethanes Geismar MDI Splitter starting up Q2 2022, ~$45M full run-rate by end of 2023 Continued growth in Huntsman Building Solutions globally New margin improvement initiatives ~$60M Performance Products Three high return projects with expected beneficial operations by 2023, ~$35M in 2024 Commercial excellence & maintain global leading positions in Amines & Maleic Anhydride Maintain margins at >20% Advanced Materials Aerospace recovery on the horizon ~$45M Additional acquisition / optimization synergies by 2023 ~$12M Return business to >20% margin Continued bolt-on acquisitions 17 Note: All values refer to Adj EBITDA |
| 18 Advanced Materials Scott Wright Division President 2021 Huntsman Investor Day |

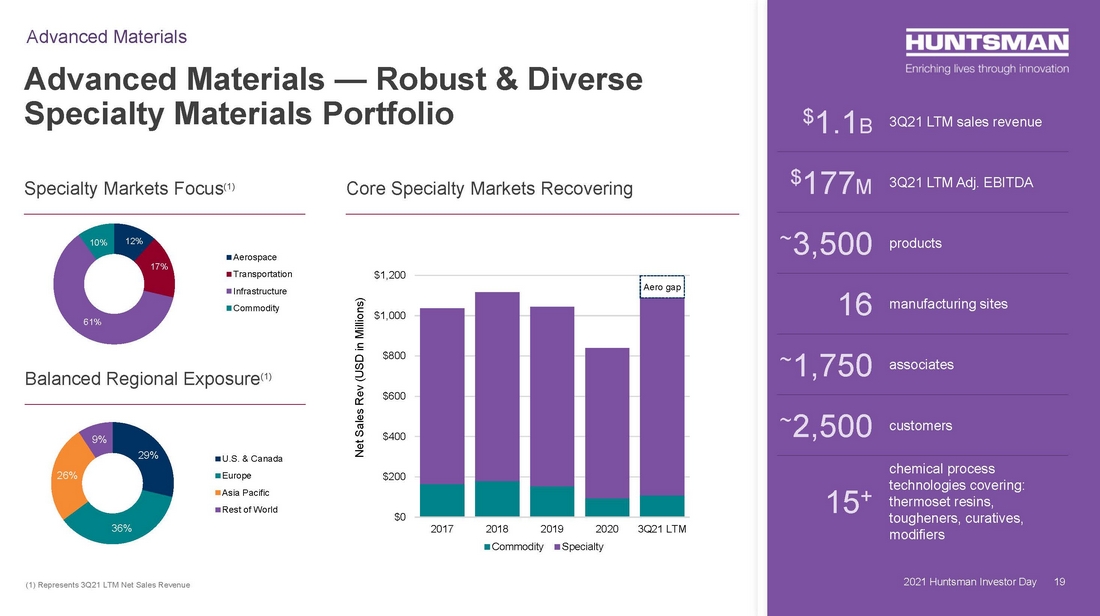
| 19 $0 $200 $400 $600 $800 $1,000 $1,200 2017 2018 2019 2020 3Q21 LTM Commodity Specialty Core Specialty Markets Recovering Advanced Materials — Robust & Diverse Specialty Materials Portfolio 2021 Huntsman Investor Day Advanced Materials Specialty Markets Focus(1) Balanced Regional Exposure(1) 12% 17% 61% 10% Aerospace Transportation Infrastructure Commodity 29% 36% 26% 9% U.S. & Canada Europe Asia Pacific Rest of World $1.1B 3Q21 LTM sales revenue $177M 3Q21 LTM Adj. EBITDA ~3,500 products 16 manufacturing sites ~1,750 associates ~2,500 customers 15+ chemical process technologies covering: thermoset resins, tougheners, curatives, modifiers 19 (1) Represents 3Q21 LTM Net Sales Revenue Net Sales Rev (USD in Millions) Aero gap |
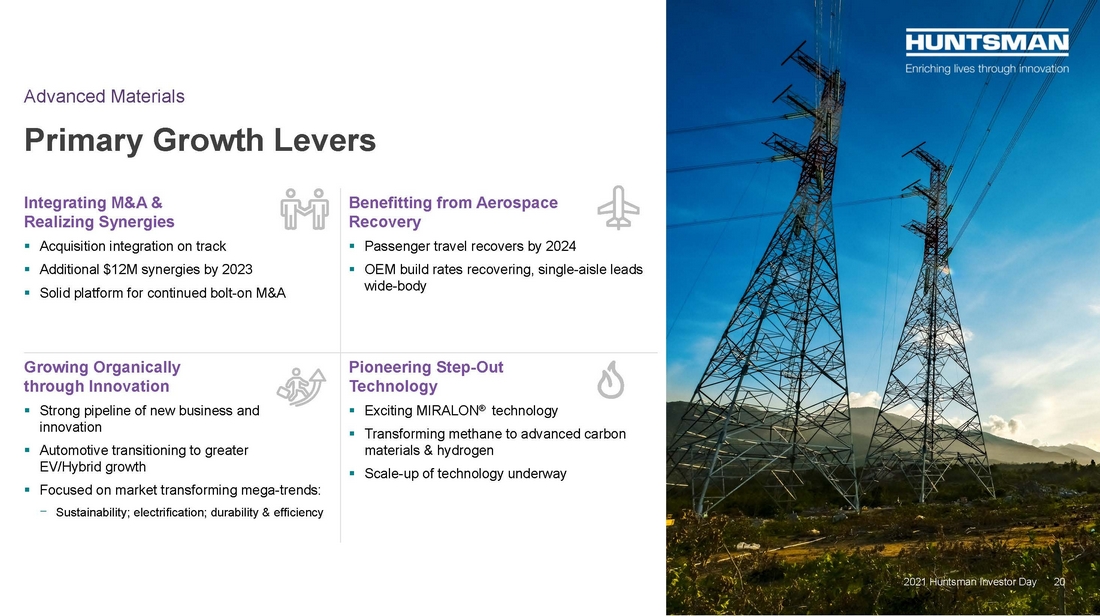
| 20 Primary Growth Levers 2021 Huntsman Investor Day Advanced Materials Integrating M&A & Realizing Synergies .. Acquisition integration on track .. Additional $12M synergies by 2023 .. Solid platform for continued bolt-on M&A Benefitting from Aerospace Recovery .. Passenger travel recovers by 2024 .. OEM build rates recovering, single-aisle leads wide-body Growing Organically through Innovation .. Strong pipeline of new business and innovation .. Automotive transitioning to greater EV/Hybrid growth .. Focused on market transforming mega-trends: ⎻ Sustainability; electrification; durability & efficiency Pioneering Step-Out Technology .. Exciting MIRALON® technology .. Transforming methane to advanced carbon materials & hydrogen .. Scale-up of technology underway 20 |
| 21 Acquisitions Enhance Specialty Portfolio Integrating M&A and Realizing Synergies 2021 Huntsman Investor Day Advanced Materials Net M&A Benefit of $57M Adj. EBITDA at <5x multiple Integration and Synergies on Track .. $11M synergy run-rate delivered .. $12M additional synergies by 2023 .. Complementary technology portfolio provides long-term innovation opportunity .. CVC & Gabriel acquisitions ⎻ $76M post synergy Adj. EBITDA at 7.2x multiple .. India DIY disposal $19M Adj. EBITDA at 15x multiple Commodity Materials Specialty Components Formulations Valuable Effects OEMs Epichlorahydrin Bis-Phenol A Base Resins Specialty Resins Tougheners Curing Agents Modifiers & Additives Composites Adhesives Resin Systems Light-weighting Adhesion & Joining Electrical Insulation Protection Heat Management <5% of Adj. EBITDA >95% of Adj. EBITDA |

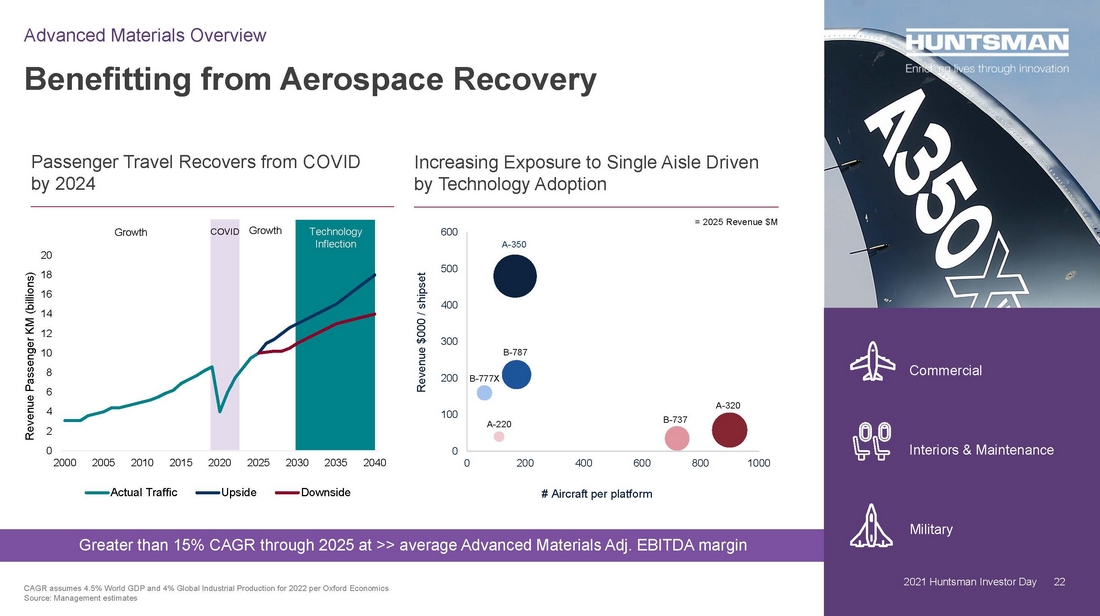
| 22 0 2 4 6 8 10 12 14 16 18 20 2000 2005 2010 2015 2020 2025 2030 2035 2040 Actual Traffic Upside Downside Passenger Travel Recovers from COVID by 2024 Technology Inflection COVID Growth Growth Greater than 15% CAGR through 2025 at >> average Advanced Materials Adj. EBITDA margin Benefitting from Aerospace Recovery 2021 Huntsman Investor Day Advanced Materials Overview Commercial Military Interiors & Maintenance 22 CAGR assumes 4.5% World GDP and 4% Global Industrial Production for 2022 per Oxford Economics Source: Management estimates Increasing Exposure to Single Aisle Driven by Technology Adoption 0 100 200 300 400 500 600 0 200 400 600 800 1000 Revenue $000 / shipset # Aircraft per platform A-350 B-787 B-737 A-320 B-777X A-220 = 2025 Revenue $M Revenue Passenger KM (billions) |
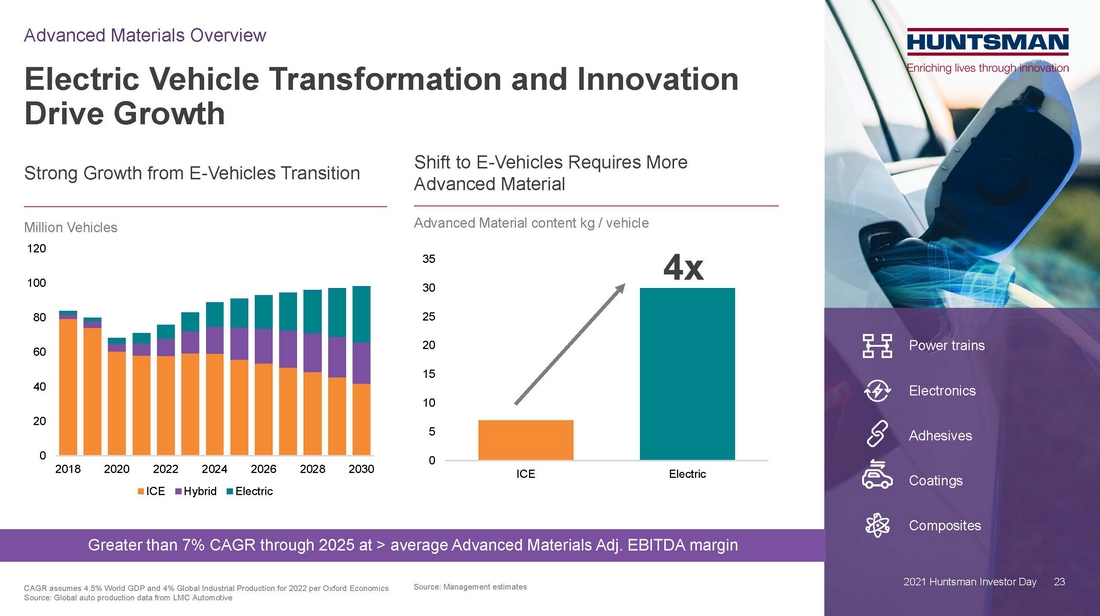
| 23 0 20 40 60 80 100 120 2018 2020 2022 2024 2026 2028 2030 ICE Hybrid Electric Electric Vehicle Transformation and Innovation Drive Growth 2021 Huntsman Investor Day Advanced Materials Overview Strong Growth from E-Vehicles Transition Shift to E-Vehicles Requires More Advanced Material Power trains Adhesives Electronics Million Vehicles Advanced Material content kg / vehicle Composites Coatings 4x CAGR assumes 4.5% World GDP and 4% Global Industrial Production for 2022 per Oxford Economics Source: Global auto production data from LMC Automotive 23 Source: Management estimates 0 5 10 15 20 25 30 35 ICE Electric Greater than 7% CAGR through 2025 at > average Advanced Materials Adj. EBITDA margin |
| 24 Greater than 6% CAGR through 2025 at average Advanced Materials Adj. EBITDA margin $18B $73B $26B $45B EU USA China India Infrastructure Investment and Innovation Drive Growth Advanced Materials Overview Sustainability: Renewable Energy Grid Build Drives Infrastructure Demand Durability & Efficiency: Infrastructure Protection Significant post-Covid global grid investments Generation Distribution Transmission Protection Transformed corrosion resistance Improved fire resistance Extended infrastructure lifetime 24 2021 Huntsman Investor Day CAGR assumes 4.5% World GDP and 4% Global Industrial Production for 2022 per Oxford Economics Source: Management estimates |

| 25 Pioneering Step-Out Technology Advanced Materials Overview 2021 Huntsman Investor Day Problem Oil & gas industry has long-term issue with methane / natural gas Methane has 28x more global warming potential than CO2 MIRALON® Solution, Market Applications & Scale-Up Plan 2010 Technology development 2015 Lab scale & experimental sales (c. $10,000/kg) 2019 Micro plant & experimental sales (c. $2,000/kg) 2021 Mini plant & experimental sales (c. $1,000/kg) 2022 Pilot Plant & commercial sales (c. $100/kg) 2024 1st Commercial scale plant Step change in unit cost 2024+ Replicate, scale & improve (<$10/kg) Revenue ~$50M p.a.by 2025 Methane 1150oC H2 ‘Turquoise’ hydrogen C MIRALON® 2021 Huntsman Investor Day |

| 26 Driving to Deliver Sustainable High-Value Growth 2021 Huntsman Investor Day Advanced Materials Overview Strong Specialty Market Position .. Strong position in attractive transforming specialty markets .. Highly qualified applications create cycle robustness .. Aerospace full market recovery by 2024 Innovation & Bolt-on Acquisitions Boost Growth .. On track to deliver $23M in acquisition synergies by 2023 .. Robust pipeline of new innovations to capture opportunities from mega-trends ⎻ E-vehicles, Corrosion resistant infrastructure Exciting Carbon Capture Opportunity .. Transformative growth opportunity in the carbon capture space .. Developing scale of MIRALON® methane to hydrogen & structural carbon technology 26 Adj. EBITDA (2022) $225M – $240M Adj. EBITDA Margin Target 20% – 25% |

| 27 Performance Products Chuck Hirsch Division President 2021 Huntsman Investor Day |
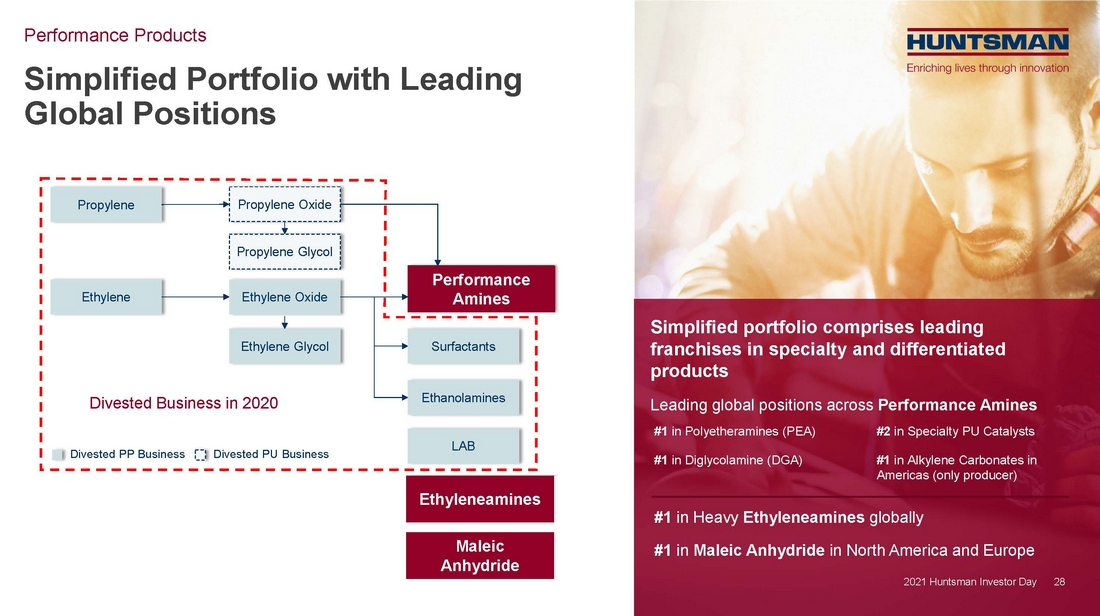
| 28 Simplified Portfolio with Leading Global Positions Performance Products 2021 Huntsman Investor Day Simplified portfolio comprises leading franchises in specialty and differentiated products Leading global positions across Performance Amines Ethylene Propylene Ethylene Oxide Ethylene Glycol Ethanolamines Surfactants LAB Propylene Oxide Propylene Glycol Divested PP Business Divested PU Business Performance Amines Divested Businesses in 2020 Divested Business in 2020 #1 in Polyetheramines (PEA) #1 in Diglycolamine (DGA) #2 in Specialty PU Catalysts #1 in Alkylene Carbonates in Americas (only producer) 2021 Huntsman Investor Day 28 #1 in Heavy Ethyleneamines globally #1 in Maleic Anhydride in North America and Europe Performance Amines Maleic Anhydride Ethyleneamines |
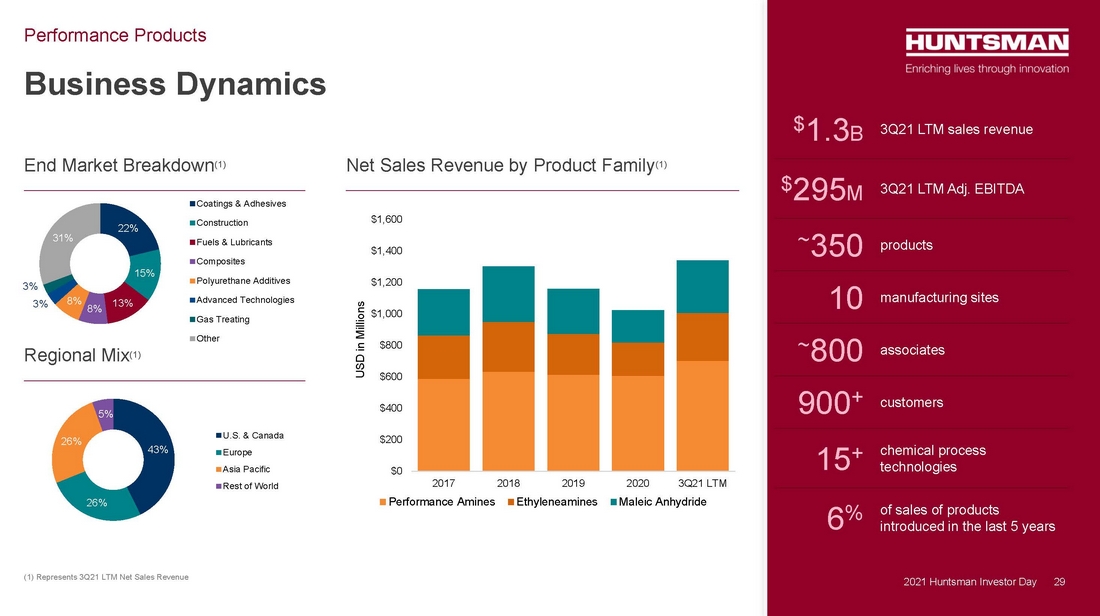
| 29 Business Dynamics Performance Products 2021 Huntsman Investor Day $1.3B 3Q21 LTM sales revenue $295M 3Q21 LTM Adj. EBITDA ~350 products 10 manufacturing sites ~800 associates 900+ customers 15+ chemical process technologies 6% of sales of products introduced in the last 5 years (1) Represents 3Q21 LTM Net Sales Revenue 2021 Huntsman Investor Day 29 $0 $200 $400 $600 $800 $1,000 $1,200 $1,400 $1,600 2017 2018 2019 2020 3Q21 LTM Performance Amines Ethyleneamines Maleic Anhydride USD in Millions 43% 26% 26% 5% U.S. & Canada Europe Asia Pacific Rest of World End Market Breakdown(1) Net Sales Revenue by Product Family(1) Regional Mix(1) 22% 15% 13% 8% 8% 3% 3% 31% Coatings & Adhesives Construction Fuels & Lubricants Composites Polyurethane Additives Advanced Technologies Gas Treating Other |
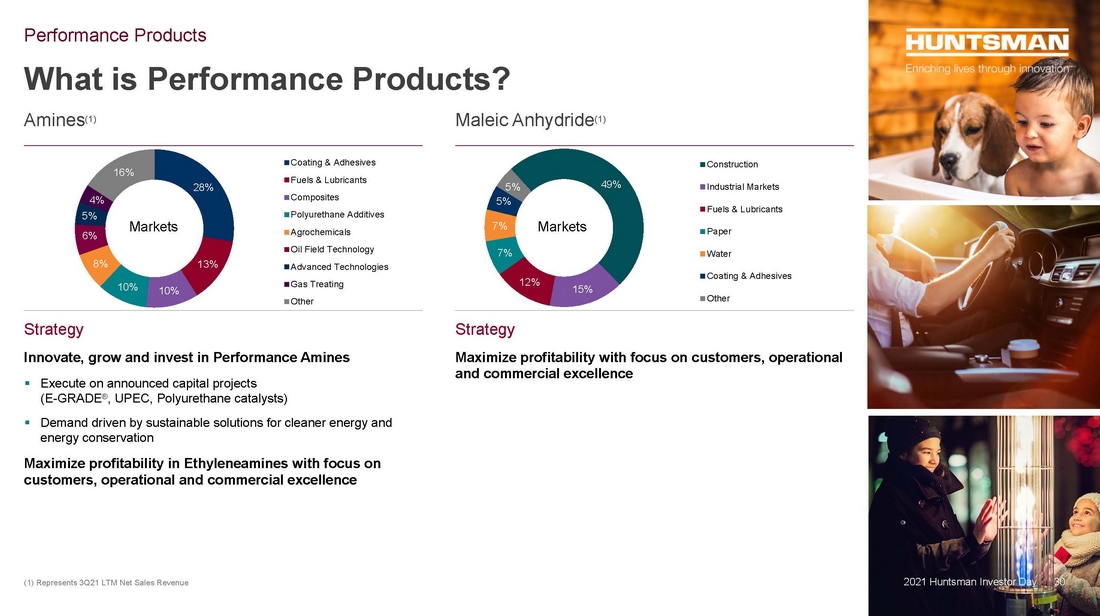
| 30 What is Performance Products? Performance Products Amines(1) Maleic Anhydride(1) Strategy Innovate, grow and invest in Performance Amines .. Execute on announced capital projects (E-GRADE®, UPEC, Polyurethane catalysts) .. Demand driven by sustainable solutions for cleaner energy and energy conservation Maximize profitability in Ethyleneamines with focus on customers, operational and commercial excellence Strategy Maximize profitability with focus on customers, operational and commercial excellence Markets Markets (1) Represents 3Q21 LTM Net Sales Revenue 28% 13% 10% 10% 8% 6% 5% 4% 16% Coating & Adhesives Fuels & Lubricants Composites Polyurethane Additives Agrochemicals Oil Field Technology Advanced Technologies Gas Treating Other 49% 15% 12% 7% 7% 5% 5% Construction Industrial Markets Fuels & Lubricants Paper Water Coating & Adhesives Other 30 2021 Huntsman Investor Day |
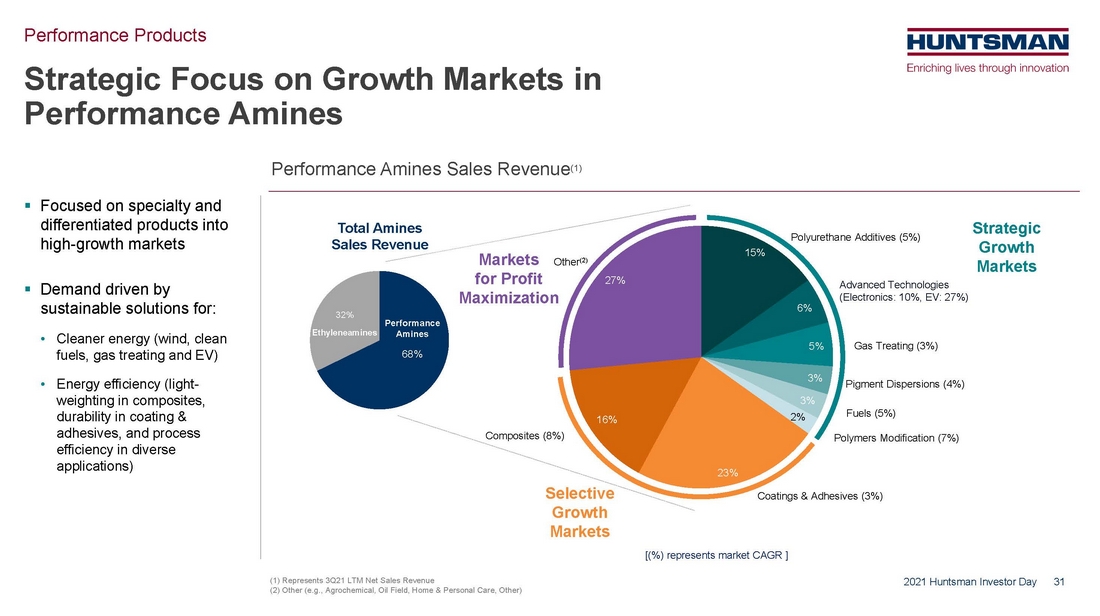
| 31 Performance Amines Sales Revenue(1) Strategic Focus on Growth Markets in Performance Amines Performance Products 2021 Huntsman Investor Day .. Focused on specialty and differentiated products into high-growth markets .. Demand driven by sustainable solutions for: • Cleaner energy (wind, clean fuels, gas treating and EV) • Energy efficiency (light- weighting in composites, durability in coating & adhesives, and process efficiency in diverse applications) 15% 6% 5% 3% 3% 2% 23% 16% 27% Polyurethane Additives (5%) Gas Treating (3%) Pigment Dispersions (4%) Fuels (5%) Polymers Modification (7%) Coatings & Adhesives (3%) Composites (8%) Other(2) Selective Growth Markets Markets for Profit Maximization (1) Represents 3Q21 LTM Net Sales Revenue (2) Other (e.g., Agrochemical, Oil Field, Home & Personal Care, Other) 68% 32% Performance Amines Ethyleneamines Total Amines Sales Revenue Strategic Growth Markets Advanced Technologies (Electronics: 10%, EV: 27%) [(%) represents market CAGR ] |
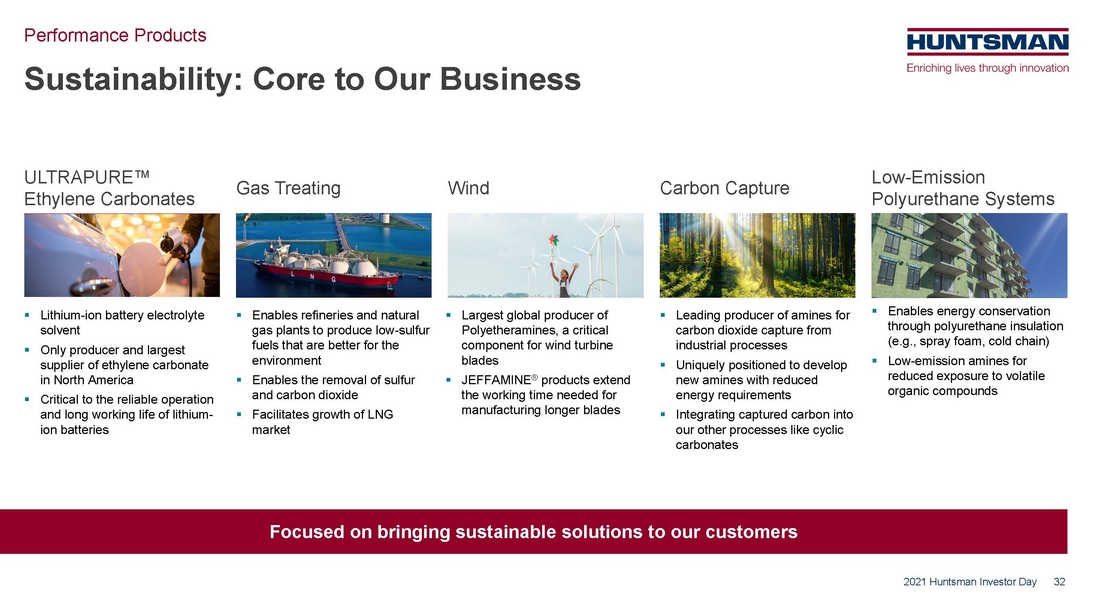
| 32 ULTRAPURE™ Ethylene Carbonates Gas Treating Wind Carbon Capture Low-Emission Polyurethane Systems Sustainability: Core to Our Business Performance Products 2021 Huntsman Investor Day Focused on bringing sustainable solutions to our customers .. Lithium-ion battery electrolyte solvent .. Only producer and largest supplier of ethylene carbonate in North America .. Critical to the reliable operation and long working life of lithium- ion batteries .. Enables refineries and natural gas plants to produce low-sulfur fuels that are better for the environment .. Enables the removal of sulfur and carbon dioxide .. Facilitates growth of LNG market .. Largest global producer of Polyetheramines, a critical component for wind turbine blades .. JEFFAMINE® products extend the working time needed for manufacturing longer blades .. Leading producer of amines for carbon dioxide capture from industrial processes .. Uniquely positioned to develop new amines with reduced energy requirements .. Integrating captured carbon into our other processes like cyclic carbonates .. Enables energy conservation through polyurethane insulation (e.g., spray foam, cold chain) .. Low-emission amines for reduced exposure to volatile organic compounds |
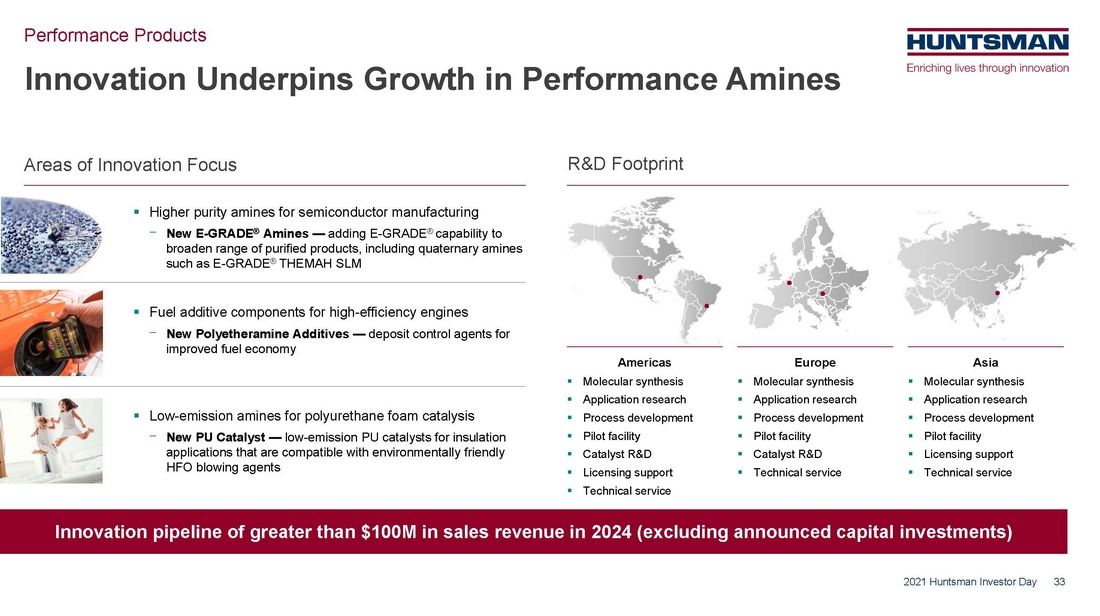
| 33 Innovation pipeline of greater than $100M in sales revenue in 2024 (excluding announced capital investments) Innovation Underpins Growth in Performance Amines Performance Products 2021 Huntsman Investor Day .. Higher purity amines for semiconductor manufacturing ⎻ New E-GRADE® Amines — adding E-GRADE® capability to broaden range of purified products, including quaternary amines such as E-GRADE® THEMAH SLM .. Fuel additive components for high-efficiency engines ⎻ New Polyetheramine Additives — deposit control agents for improved fuel economy .. Low-emission amines for polyurethane foam catalysis ⎻ New PU Catalyst — low-emission PU catalysts for insulation applications that are compatible with environmentally friendly HFO blowing agents Americas .. Molecular synthesis .. Application research .. Process development .. Pilot facility .. Catalyst R&D .. Licensing support .. Technical service Europe .. Molecular synthesis .. Application research .. Process development .. Pilot facility .. Catalyst R&D .. Technical service Asia .. Molecular synthesis .. Application research .. Process development .. Pilot facility .. Licensing support .. Technical service Areas of Innovation Focus R&D Footprint |
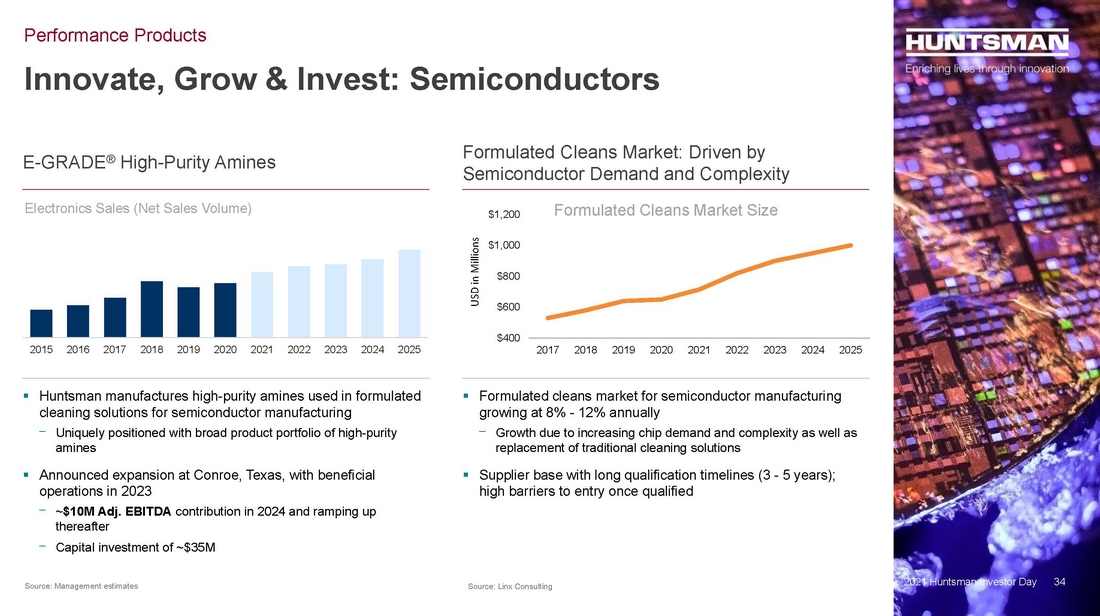
| 34 2015 2016 2017 2018 2019 2020 2021 2022 2023 2024 2025 Electronics Sales (Net Sales Volume) Innovate, Grow & Invest: Semiconductors Performance Products $400 $600 $800 $1,000 $1,200 2017 2018 2019 2020 2021 2022 2023 2024 2025 USD in Millions E-GRADE® High-Purity Amines Formulated Cleans Market: Driven by Semiconductor Demand and Complexity .. Huntsman manufactures high-purity amines used in formulated cleaning solutions for semiconductor manufacturing ⎻ Uniquely positioned with broad product portfolio of high-purity amines .. Announced expansion at Conroe, Texas, with beneficial operations in 2023 ⎻ ~$10M Adj. EBITDA contribution in 2024 and ramping up thereafter ⎻ Capital investment of ~$35M .. Formulated cleans market for semiconductor manufacturing growing at 8% - 12% annually ⎻ Growth due to increasing chip demand and complexity as well as replacement of traditional cleaning solutions .. Supplier base with long qualification timelines (3 - 5 years); high barriers to entry once qualified 2021 Huntsman Investor Day 34 Source: Management estimates Formulated Cleans Market Size Source: Linx Consulting |
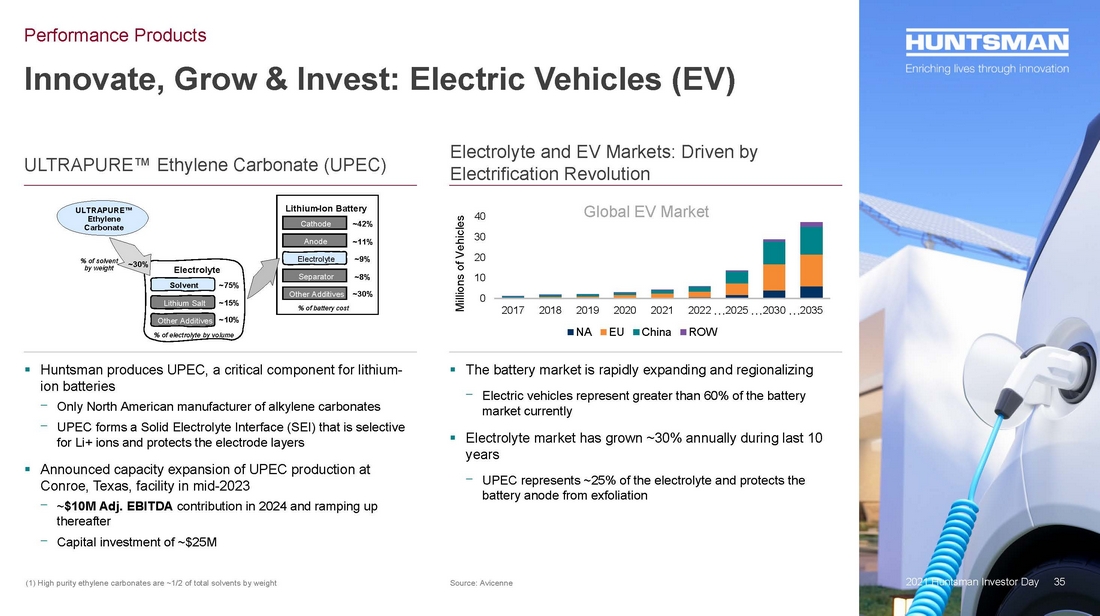
| 35 Innovate, Grow & Invest: Electric Vehicles (EV) Performance Products 2021 Huntsman Investor Day ULTRAPURE™ Ethylene Carbonate (UPEC) Electrolyte and EV Markets: Driven by Electrification Revolution .. Huntsman produces UPEC, a critical component for lithium- ion batteries ⎻ Only North American manufacturer of alkylene carbonates ⎻ UPEC forms a Solid Electrolyte Interface (SEI) that is selective for Li+ ions and protects the electrode layers .. Announced capacity expansion of UPEC production at Conroe, Texas, facility in mid-2023 ⎻ ~$10M Adj. EBITDA contribution in 2024 and ramping up thereafter ⎻ Capital investment of ~$25M .. The battery market is rapidly expanding and regionalizing ⎻ Electric vehicles represent greater than 60% of the battery market currently .. Electrolyte market has grown ~30% annually during last 10 years ⎻ UPEC represents ~25% of the electrolyte and protects the battery anode from exfoliation 0 10 20 30 40 2017 2018 2019 2020 2021 2022 2025 2030 2035 NA EU China ROW Global EV Market Millions of Vehicles … … … Source: Avicenne 35 (1) High purity ethylene carbonates are ~1/2 of total solvents by weight Solvent Lithium Salt Other Additives Electrolyte ~15% ~10% Electrolyte Separator Other Additives Anode Cathode ~75% ~30% % of electrolyte by volume % of solvent by weight Lithium -Ion Battery % of battery cost ~42% ~11% ~9% ~8% ~30% ULTRAPURE™ Ethylene Carbonate |
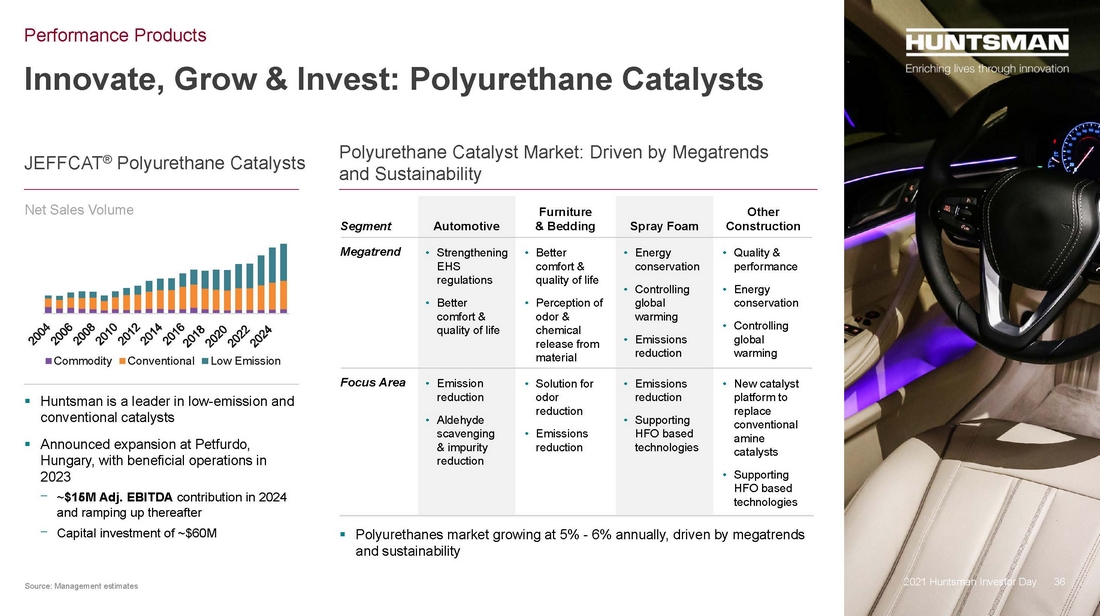
| 36 Innovate, Grow & Invest: Polyurethane Catalysts Performance Products 2021 Huntsman Investor Day JEFFCAT® Polyurethane Catalysts Polyurethane Catalyst Market: Driven by Megatrends and Sustainability .. Huntsman is a leader in low-emission and conventional catalysts .. Announced expansion at Petfurdo, Hungary, with beneficial operations in 2023 ⎻ ~$15M Adj. EBITDA contribution in 2024 and ramping up thereafter ⎻ Capital investment of ~$60M . Polyurethanes market growing at 5% - 6% annually, driven by megatrends and sustainability Commodity Conventional Low Emission Segment Automotive Furniture & Bedding Spray Foam Other Construction Megatrend • Strengthening EHS regulations • Better comfort & quality of life • Better comfort & quality of life • Perception of odor & chemical release from material • Energy conservation • Controlling global warming • Emissions reduction • Quality & performance • Energy conservation • Controlling global warming Focus Area • Emission reduction • Aldehyde scavenging & impurity reduction • Solution for odor reduction • Emissions reduction • Emissions reduction • Supporting HFO based technologies • New catalyst platform to replace conventional amine catalysts • Supporting HFO based technologies Net Sales Volume 36 Source: Management estimates |
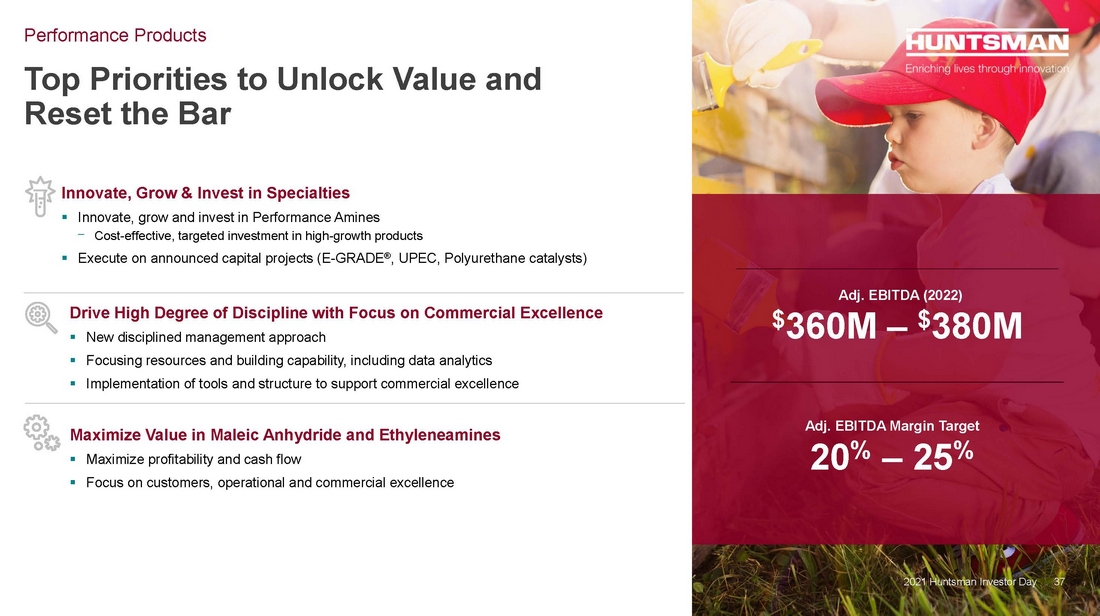
| 37 Top Priorities to Unlock Value and Reset the Bar Performance Products 2021 Huntsman Investor Day Drive High Degree of Discipline with Focus on Commercial Excellence .. New disciplined management approach .. Focusing resources and building capability, including data analytics .. Implementation of tools and structure to support commercial excellence Maximize Value in Maleic Anhydride and Ethyleneamines .. Maximize profitability and cash flow .. Focus on customers, operational and commercial excellence Innovate, Grow & Invest in Specialties .. Innovate, grow and invest in Performance Amines ⎻ Cost-effective, targeted investment in high-growth products .. Execute on announced capital projects (E-GRADE®, UPEC, Polyurethane catalysts) 37 Adj. EBITDA (2022) $360M – $380M Adj. EBITDA Margin Target 20% – 25% |
| 38 Sustainability Brit Benko Senior Vice President EHS and Manufacturing Excellence and Corporate Sustainability Officer 2021 Huntsman Investor Day |
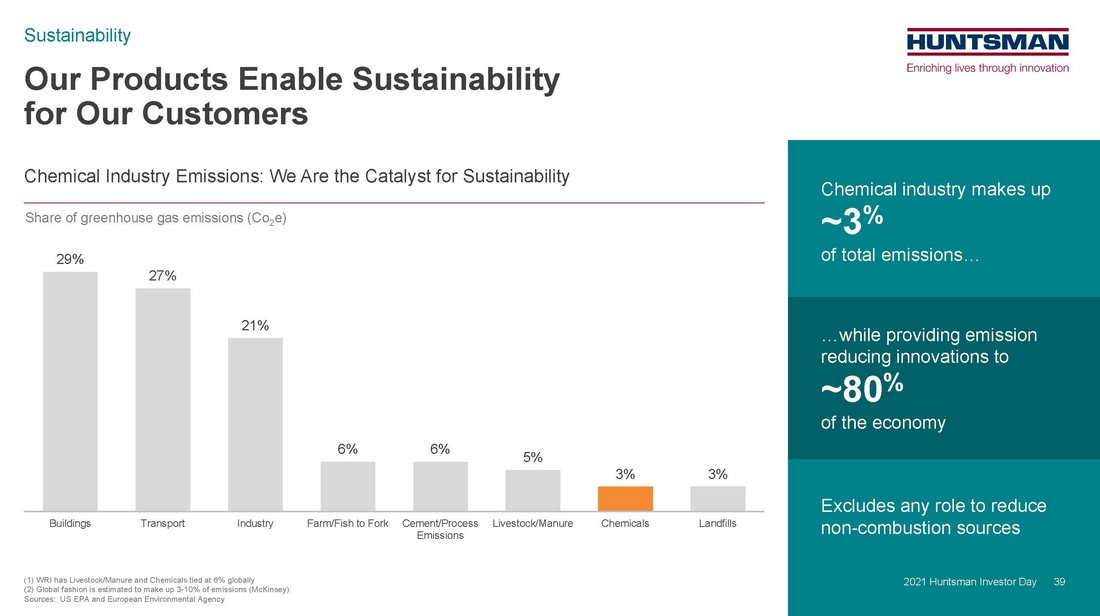
| 39 Excludes any role to reduce non-combustion sources Chemical industry makes up ~3% of total emissions… …while providing emission reducing innovations to ~80% of the economy Our Products Enable Sustainability for Our Customers 2021 Huntsman Investor Day Sustainability (1) WRI has Livestock/Manure and Chemicals tied at 6% globally (2) Global fashion is estimated to make up 3-10% of emissions (McKinsey) Sources: US EPA and European Environmental Agency Chemical Industry Emissions: We Are the Catalyst for Sustainability Share of greenhouse gas emissions (Co2e) 29% 27% 21% 6% 6% 5% 3% 3% Buildings Transport Industry Farm/Fish to Fork Cement/Process Emissions Livestock/Manure Chemicals Landfills 39 |
| 40 ~750M tons of lifetime emissions avoided each year by our product solutions Our Solutions Drive Significant Emission Reductions Source: Management estimates assured by a third-party review 2021 Huntsman Investor Day 40 Sustainability |
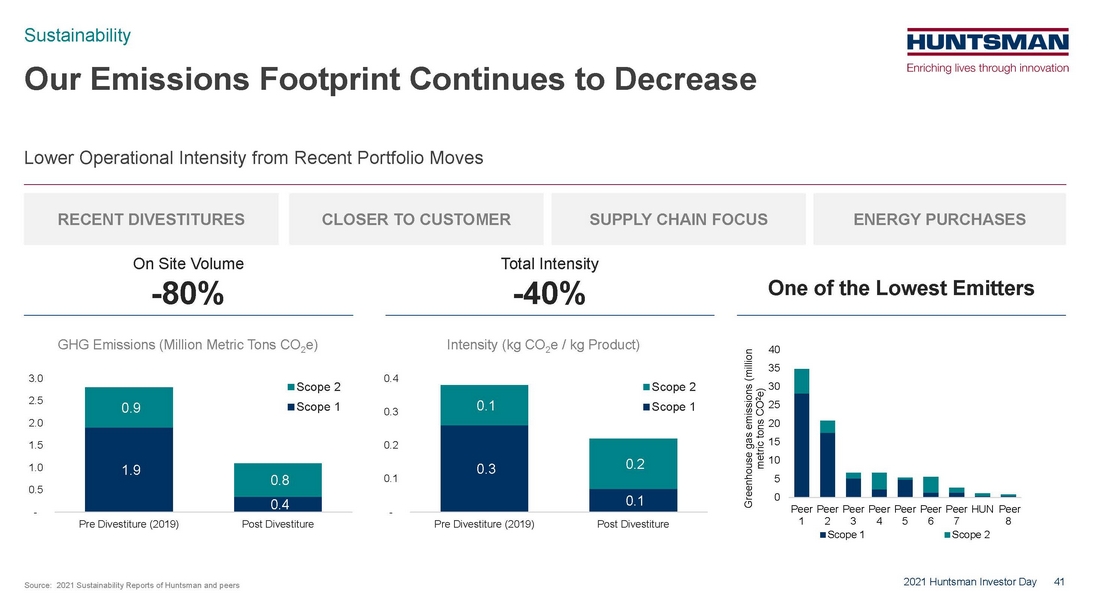
| 41 Our Emissions Footprint Continues to Decrease 2021 Huntsman Investor Day Sustainability ENERGY PURCHASES Source: 2021 Sustainability Reports of Huntsman and peers Lower Operational Intensity from Recent Portfolio Moves One of the Lowest Emitters RECENT DIVESTITURES CLOSER TO CUSTOMER On Site Volume -80% Total Intensity -40% GHG Emissions (Million Metric Tons CO2e) Intensity (kg CO2e / kg Product) 1.9 0.4 0.9 0.8 - 0.5 1.0 1.5 2.0 2.5 3.0 Pre Divestiture (2019) Post Divestiture Scope 2 Scope 1 0.3 0.1 0.1 0.2 - 0.1 0.2 0.3 0.4 Pre Divestiture (2019) Post Divestiture Scope 2 Scope 1 SUPPLY CHAIN FOCUS 0 5 10 15 20 25 30 35 40 Peer 1 Peer 2 Peer 3 Peer 4 Peer 5 Peer 6 Peer 7 HUN Peer 8 Greenhouse gas emissions (million metric tons CO 2 e) Scope 1 Scope 2 |
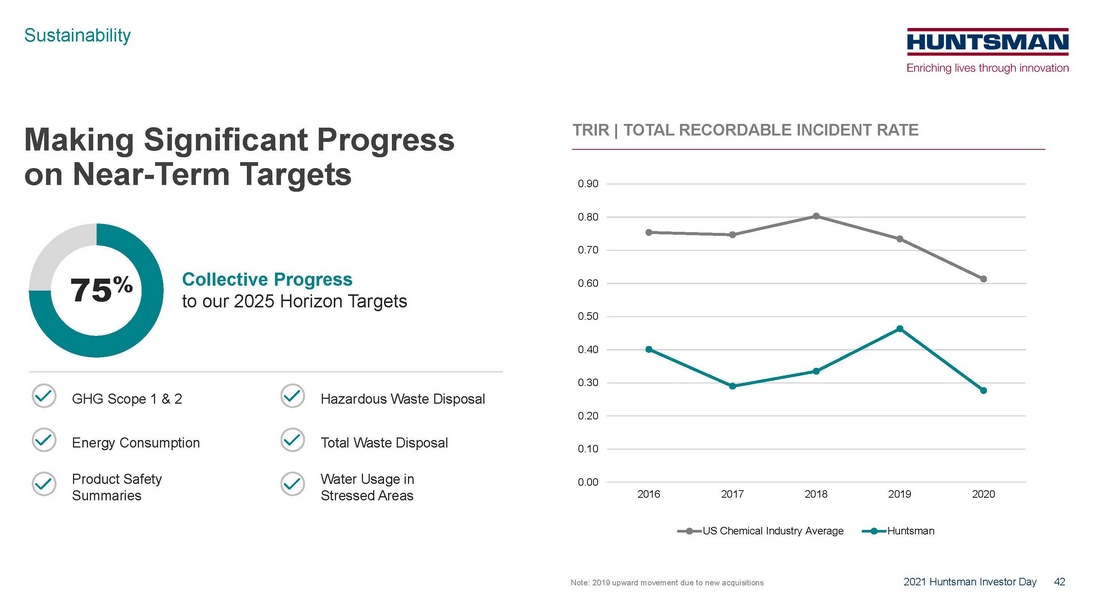
| 42 Making Significant Progress on Near-Term Targets 2021 Huntsman Investor Day TRIR | TOTAL RECORDABLE INCIDENT RATE 75% Collective Progress to our 2025 Horizon Targets GHG Scope 1 & 2 Energy Consumption Product Safety Summaries Hazardous Waste Disposal Total Waste Disposal Water Usage in Stressed Areas 0.00 0.10 0.20 0.30 0.40 0.50 0.60 0.70 0.80 0.90 2016 2017 2018 2019 2020 US Chemical Industry Average Huntsman Note: 2019 upward movement due to new acquisitions Sustainability |
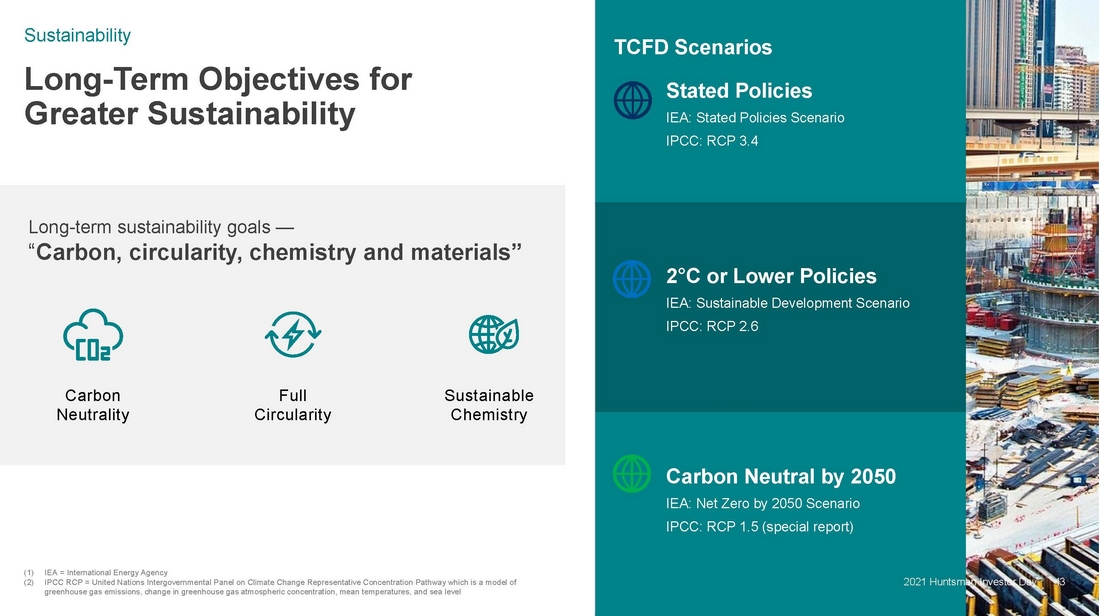
| 43 Long-Term Objectives for Greater Sustainability Sustainability (1) IEA = International Energy Agency (2) IPCC RCP = United Nations Intergovernmental Panel on Climate Change Representative Concentration Pathway which is a model of greenhouse gas emissions, change in greenhouse gas atmospheric concentration, mean temperatures, and sea level Carbon Neutral by 2050 IEA: Net Zero by 2050 Scenario IPCC: RCP 1.5 (special report) Stated Policies IEA: Stated Policies Scenario IPCC: RCP 3.4 2°C or Lower Policies IEA: Sustainable Development Scenario IPCC: RCP 2.6 Long-term sustainability goals — “Carbon, circularity, chemistry and materials” Full Circularity Carbon Neutrality Sustainable Chemistry TCFD Scenarios 43 2021 Huntsman Investor Day |
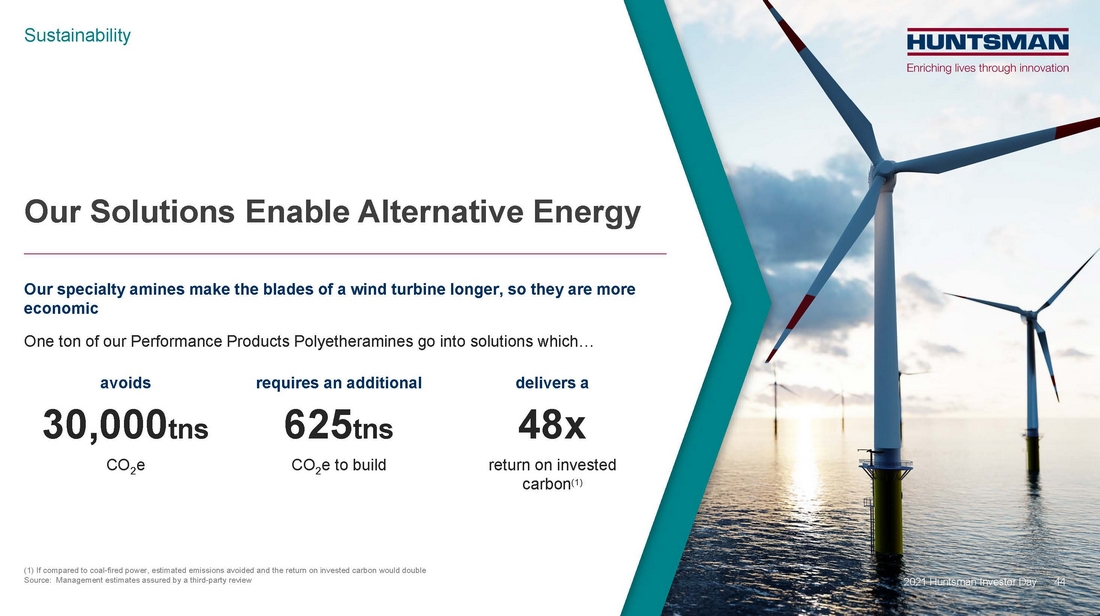
| 44 Our Solutions Enable Alternative Energy 2021 Huntsman Investor Day Our specialty amines make the blades of a wind turbine longer, so they are more economic One ton of our Performance Products Polyetheramines go into solutions which… (1) If compared to coal-fired power, estimated emissions avoided and the return on invested carbon would double Source: Management estimates assured by a third-party review avoids 30,000tns CO2e requires an additional 625tns CO2e to build delivers a 48x return on invested carbon(1) 44 Sustainability |
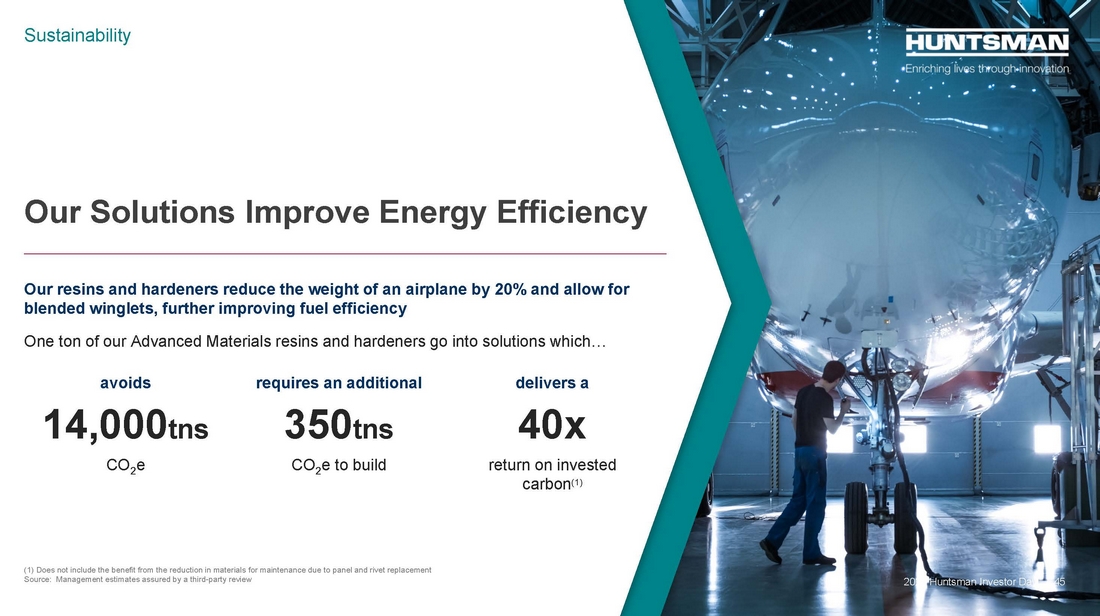
| 45 Our Solutions Improve Energy Efficiency 2021 Huntsman Investor Day (1) Does not include the benefit from the reduction in materials for maintenance due to panel and rivet replacement Source: Management estimates assured by a third-party review Our resins and hardeners reduce the weight of an airplane by 20% and allow for blended winglets, further improving fuel efficiency One ton of our Advanced Materials resins and hardeners go into solutions which… avoids 14,000tns CO2e requires an additional 350tns CO2e to build delivers a 40x return on invested carbon(1) 45 Sustainability |
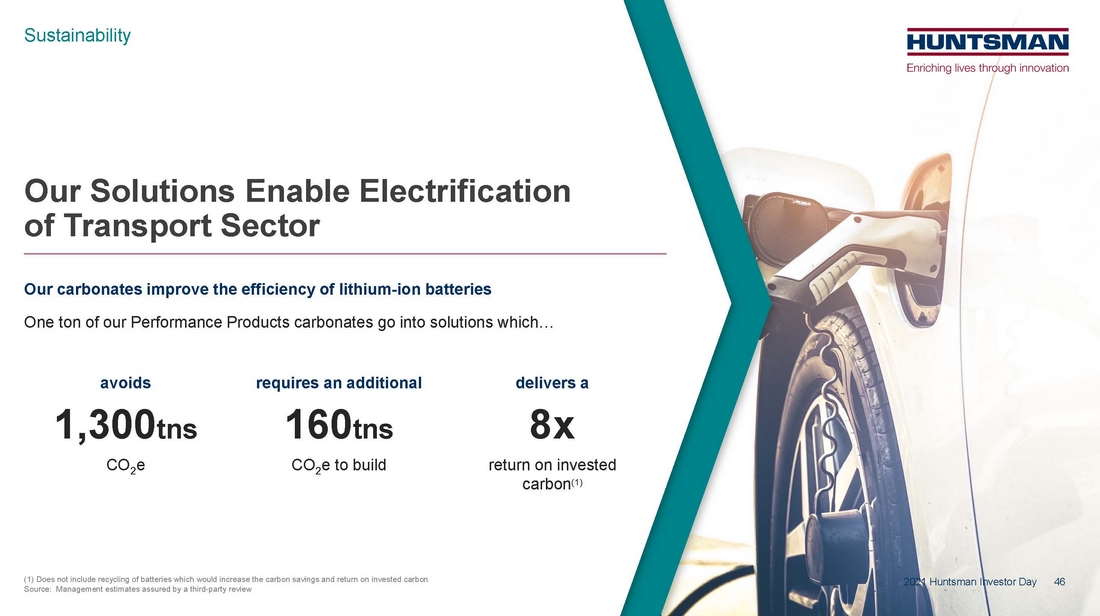
| 46 Our Solutions Enable Electrification of Transport Sector 2021 Huntsman Investor Day (1) Does not include recycling of batteries which would increase the carbon savings and return on invested carbon Source: Management estimates assured by a third-party review Our carbonates improve the efficiency of lithium-ion batteries One ton of our Performance Products carbonates go into solutions which… avoids 1,300tns CO2e requires an additional 160tns CO2e to build delivers a 8x return on invested carbon(1) 46 Sustainability |
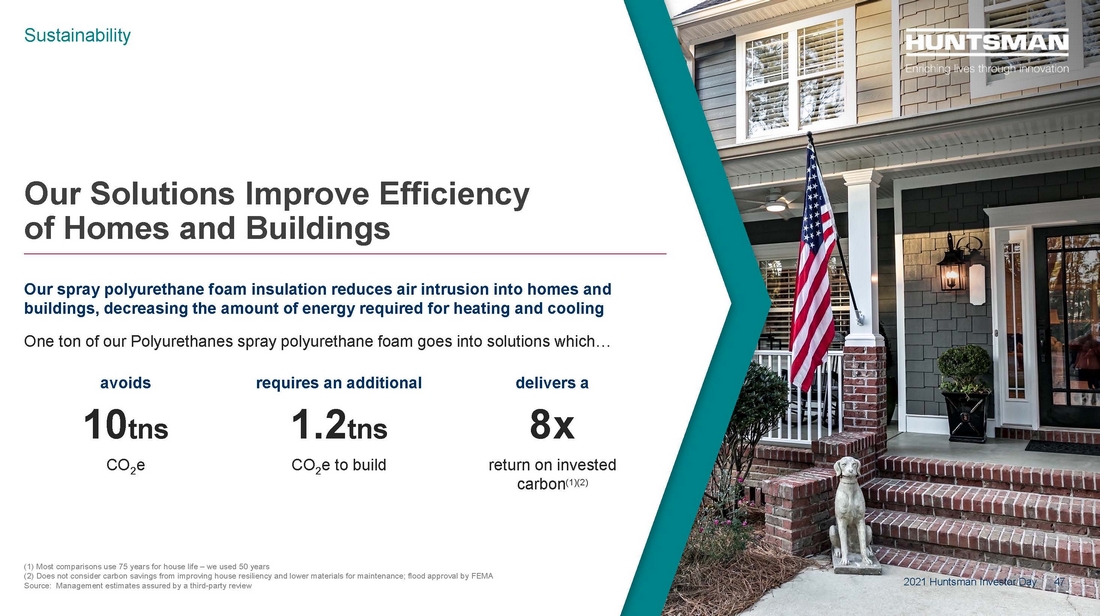
| 47 Our Solutions Improve Efficiency of Homes and Buildings 2021 Huntsman Investor Day (1) Most comparisons use 75 years for house life – we used 50 years (2) Does not consider carbon savings from improving house resiliency and lower materials for maintenance; flood approval by FEMA Source: Management estimates assured by a third-party review Our spray polyurethane foam insulation reduces air intrusion into homes and buildings, decreasing the amount of energy required for heating and cooling One ton of our Polyurethanes spray polyurethane foam goes into solutions which… avoids 10tns CO2e requires an additional 1.2tns CO2e to build delivers a 8x return on invested carbon(1)(2) 47 Sustainability |
| 48 Polyurethanes 2021 Huntsman Investor Day Tony Hankins CEO Asia Pacific | Division President |
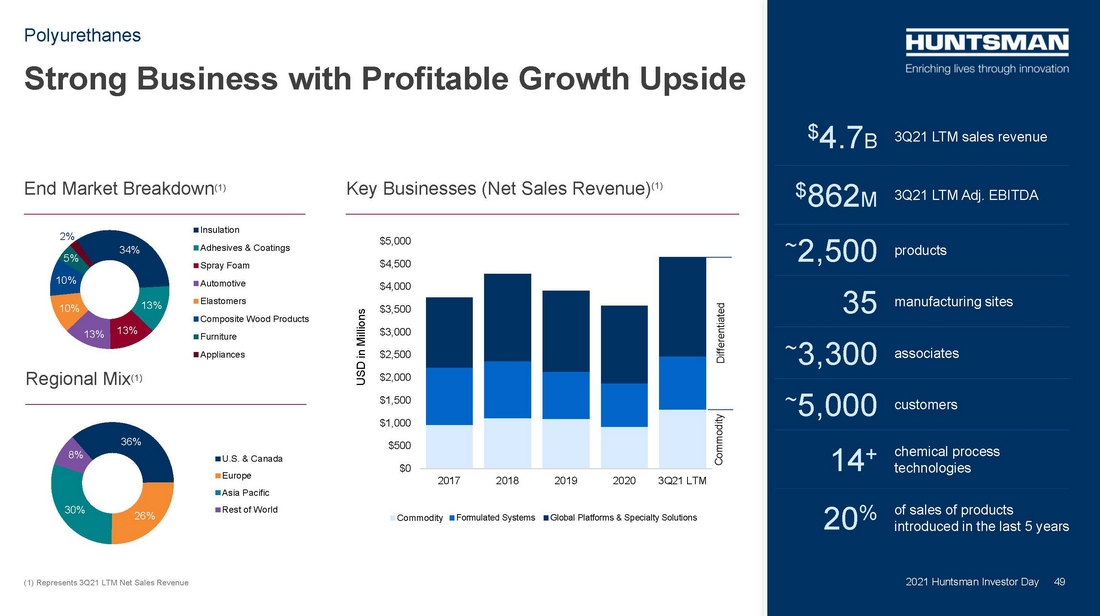
| 49 Strong Business with Profitable Growth Upside Polyurethanes $4.7B 3Q21 LTM sales revenue $862M 3Q21 LTM Adj. EBITDA ~2,500 products 35 manufacturing sites ~3,300 associates ~5,000 customers 14+ chemical process technologies 20% of sales of products introduced in the last 5 years End Market Breakdown(1) Key Businesses (Net Sales Revenue)(1) Regional Mix(1) (1) Represents 3Q21 LTM Net Sales Revenue 2021 Huntsman Investor Day 36% 26% 30% 8% U.S. & Canada Europe Asia Pacific Rest of World 34% 13% 13% 13% 10% 10% 5% 2% Insulation Adhesives & Coatings Spray Foam Automotive Elastomers Composite Wood Products Furniture Appliances 49 $0 $500 $1,000 $1,500 $2,000 $2,500 $3,000 $3,500 $4,000 $4,500 $5,000 2017 2018 2019 2020 3Q21 LTM Commodity Formulated Systems Global Platforms & Specialty Solutions USD in Millions Differentiated Commodity |
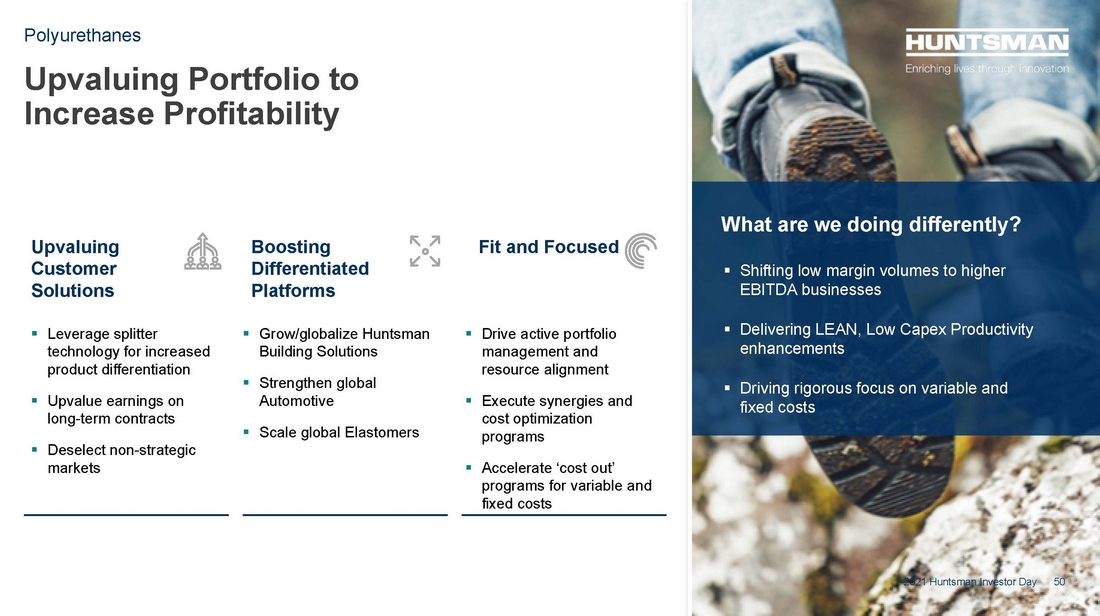
| 50 Upvaluing Portfolio to Increase Profitability Polyurethanes What are we doing differently? Upvaluing Customer Solutions .. Leverage splitter technology for increased product differentiation .. Upvalue earnings on long-term contracts .. Deselect non-strategic markets Boosting Differentiated Platforms .. Grow/globalize Huntsman Building Solutions .. Strengthen global Automotive .. Scale global Elastomers Fit and Focused .. Drive active portfolio management and resource alignment .. Execute synergies and cost optimization programs .. Accelerate ‘cost out’ programs for variable and fixed costs .. Shifting low margin volumes to higher EBITDA businesses .. Delivering LEAN, Low Capex Productivity enhancements .. Driving rigorous focus on variable and fixed costs 2021 Huntsman Investor Day 50 |
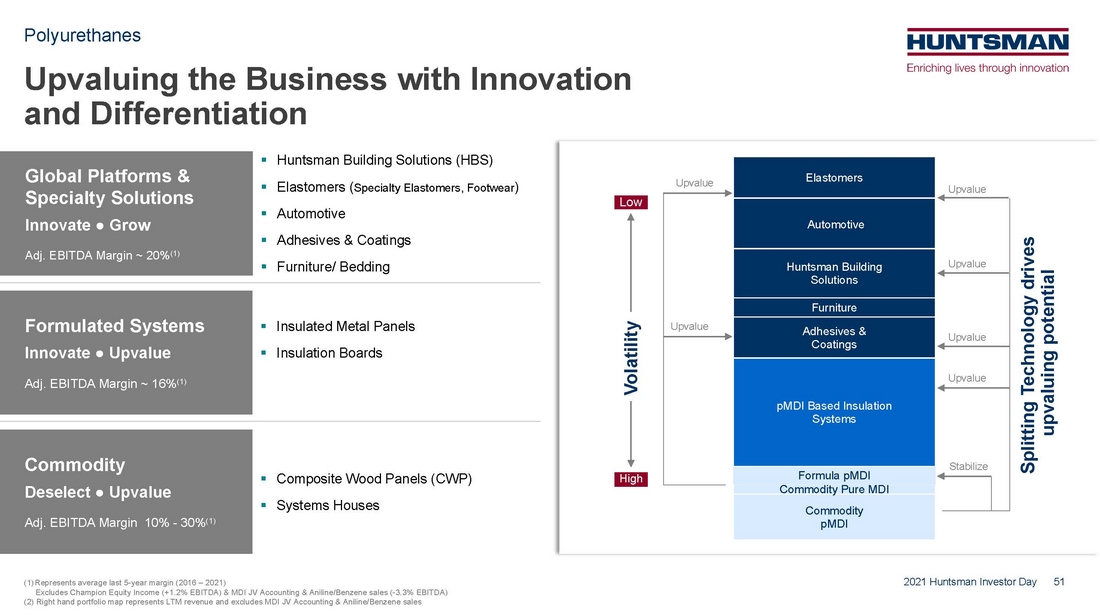
| 51 Polyurethanes 2021 Huntsman Investor Day HBS Splitting Technology drives upvaluing potential Commodity pMDI Commodity Pure MDI Formula pMDI pMDI Based Insulation Systems Adhesives & Coatings Furniture Huntsman Building Solutions Automotive Elastomers Series 1 Stabilize Upvalue Upvalue Upvalue Upvalue Upvalue Upvalue h Volatility Upvaluing the Business with Innovation and Differentiation Global Platforms & Specialty Solutions Innovate ● Grow Adj. EBITDA Margin ~ 20%(1) .. Huntsman Building Solutions (HBS) .. Elastomers (Specialty Elastomers, Footwear) .. Automotive .. Adhesives & Coatings .. Furniture/ Bedding Formulated Systems Innovate ● Upvalue Adj. EBITDA Margin ~ 16%(1) .. Insulated Metal Panels .. Insulation Boards Commodity Deselect ● Upvalue Adj. EBITDA Margin 10% - 30%(1) .. Composite Wood Panels (CWP) .. Systems Houses (1)Represents average last 5-year margin (2016 – 2021) Excludes Champion Equity Income (+1.2% EBITDA) & MDI JV Accounting & Aniline/Benzene sales (-3.3% EBITDA) (2) Right hand portfolio map represents LTM revenue and excludes MDI JV Accounting & Aniline/Benzene sales High Low |
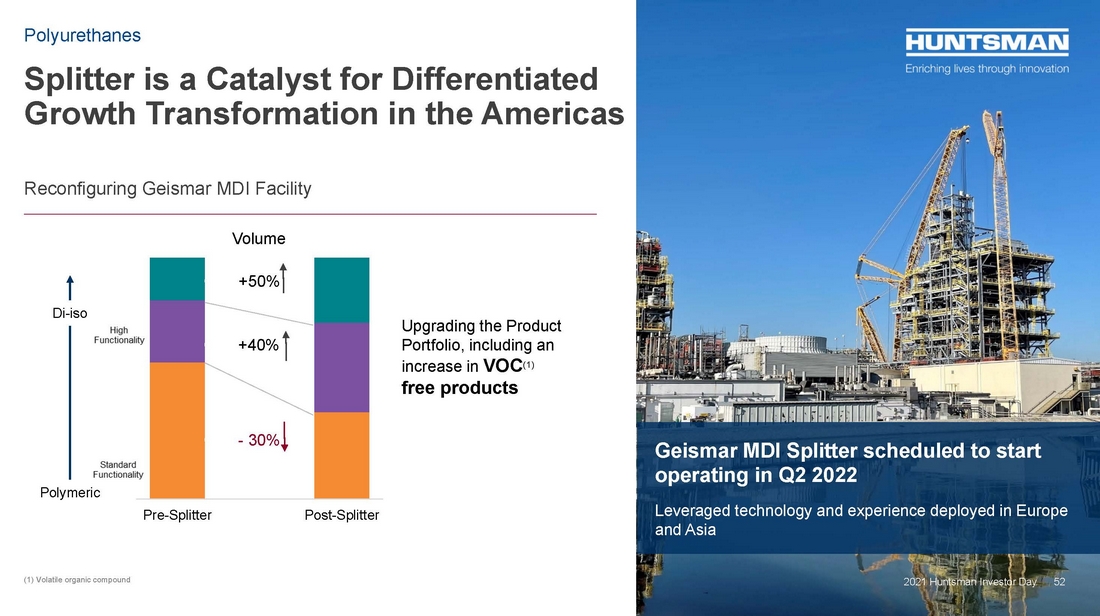
| 52 Splitter is a Catalyst for Differentiated Growth Transformation in the Americas (1) Volatile organic compound Polyurethanes Reconfiguring Geismar MDI Facility Pre-Splitter Post-Splitter +40% Di-iso Volume - 30% +50% Upgrading the Product Portfolio, including an increase in VOC(1) free products 2021 Huntsman Investor Day 52 Di-iso Polymeric Geismar MDI Splitter scheduled to start operating in Q2 2022 Leveraged technology and experience deployed in Europe and Asia |
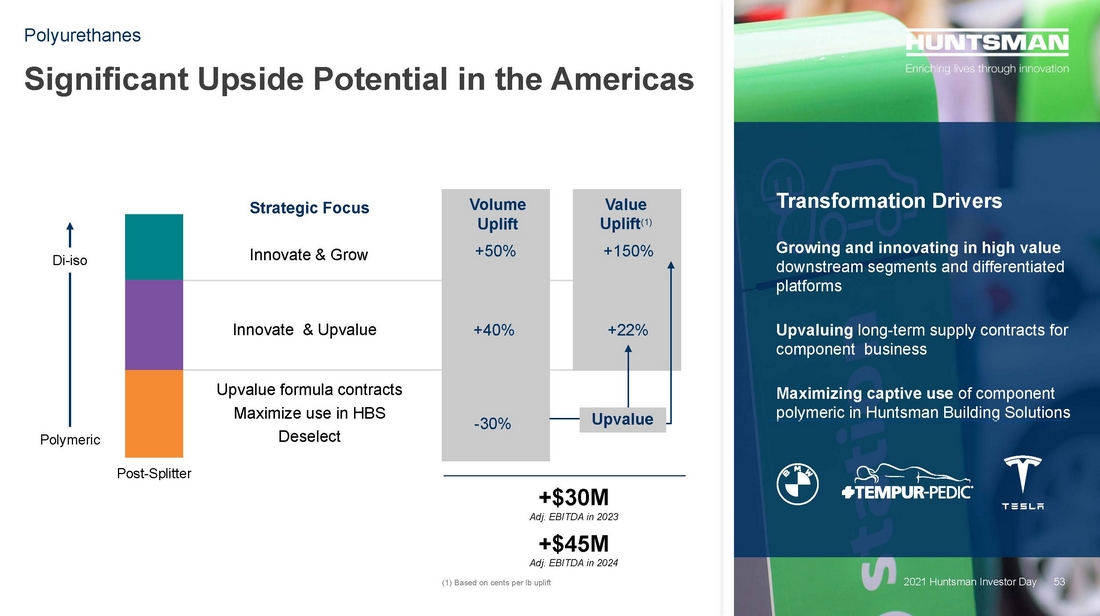
| 53 Significant Upside Potential in the Americas Polyurethanes Strategic Focus +50% Volume Uplift +150% Post-Splitter Value Uplift(1) Transformation Drivers Growing and innovating in high value downstream segments and differentiated platforms Upvaluing long-term supply contracts for component business Maximizing captive use of component polymeric in Huntsman Building Solutions Innovate & Grow Innovate & Upvalue Upvalue formula contracts Maximize use in HBS Deselect +40% +22% 2021 Huntsman Investor Day (1) Based on cents per lb uplift -30% +$30M Adj. EBITDA in 2023 +$45M Adj. EBITDA in 2024 Upvalue 53 Di-iso Polymeric |
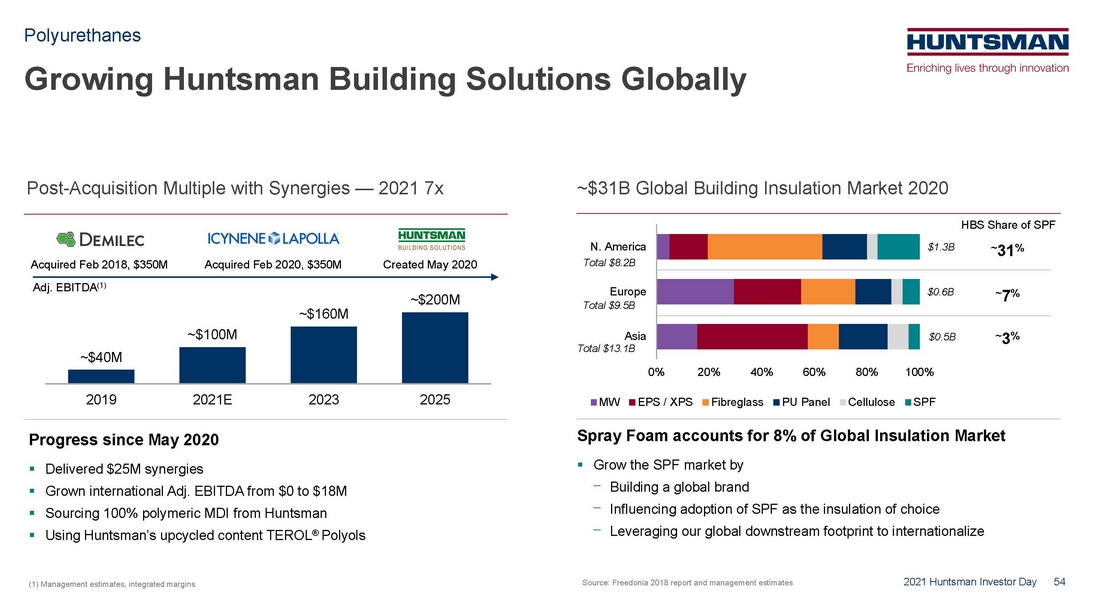
| 54 $0.5B $0.6B $1.3B 0% 20% 40% 60% 80% 100% Asia Europe N. America MW EPS / XPS Fibreglass PU Panel Cellulose SPF Total $8.2B Total $9.5B Total $13.1B Growing Huntsman Building Solutions Globally Polyurethanes 2021 Huntsman Investor Day Post-Acquisition Multiple with Synergies — 2021 7x ~$31B Global Building Insulation Market 2020 Progress since May 2020 .. Delivered $25M synergies .. Grown international Adj. EBITDA from $0 to $18M .. Sourcing 100% polymeric MDI from Huntsman .. Using Huntsman’s upcycled content TEROL® Polyols Spray Foam accounts for 8% of Global Insulation Market .. Grow the SPF market by ⎻ Building a global brand ⎻ Influencing adoption of SPF as the insulation of choice ⎻ Leveraging our global downstream footprint to internationalize ~$40M ~$100M ~$160M ~$200M 2019 2021E 2023 2025 Acquired Feb 2018, $350M Acquired Feb 2020, $350M Created May 2020 Source: Freedonia 2018 report and management estimates ~7% ~31% HBS Share of SPF ~3% Adj. EBITDA(1) (1) Management estimates, integrated margins |
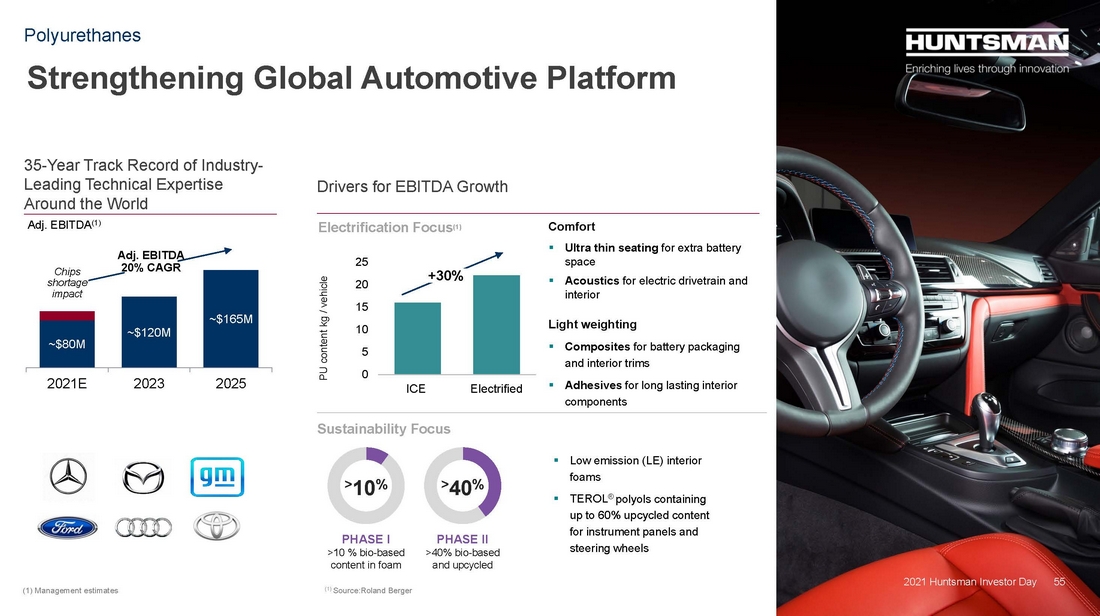
| 55 Strengthening Global Automotive Platform 2021 Huntsman Investor Day Polyurethanes 35-Year Track Record of Industry- Leading Technical Expertise Around the World Drivers for EBITDA Growth ~$80M ~$120M ~$165M 2021E 2023 2025 Chips shortage impact Adj. EBITDA 20% CAGR (1) Source:Roland Berger Electrification Focus(1) Comfort .. Ultra thin seating for extra battery space .. Acoustics for electric drivetrain and interior Light weighting .. Composites for battery packaging and interior trims .. Adhesives for long lasting interior components 0 5 10 15 20 25 ICE Electrified PU content kg / vehicle +30% Sustainability Focus .. Low emission (LE) interior foams .. TEROL® polyols containing up to 60% upcycled content for instrument panels and steering wheels >10% PHASE I >10 % bio-based content in foam >40% PHASE II >40% bio-based and upcycled 55 Adj. EBITDA(1) (1) Management estimates |
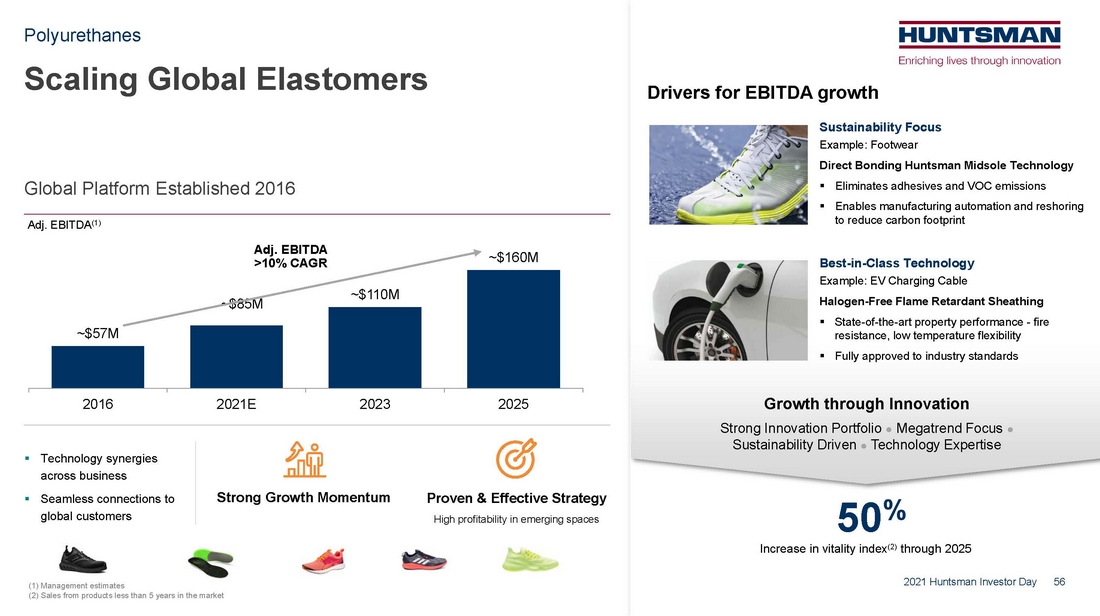
| 56 ~$57M ~$85M ~$110M ~$160M 2016 2021E 2023 2025 Scaling Global Elastomers 2021 Huntsman Investor Day Polyurethanes Adj. EBITDA >10% CAGR .. Technology synergies across business .. Seamless connections to global customers Strong Growth Momentum Proven & Effective Strategy High profitability in emerging spaces 50% Increase in vitality index(2) through 2025 Growth through Innovation Strong Innovation Portfolio ● Megatrend Focus ● Sustainability Driven ● Technology Expertise Drivers for EBITDA growth Sustainability Focus Example: Footwear Direct Bonding Huntsman Midsole Technology .. Eliminates adhesives and VOC emissions .. Enables manufacturing automation and reshoring to reduce carbon footprint Best-in-Class Technology Example: EV Charging Cable Halogen-Free Flame Retardant Sheathing .. State-of-the-art property performance - fire resistance, low temperature flexibility .. Fully approved to industry standards Global Platform Established 2016 56 Adj. EBITDA(1) (1) Management estimates (2) Sales from products less than 5 years in the market |
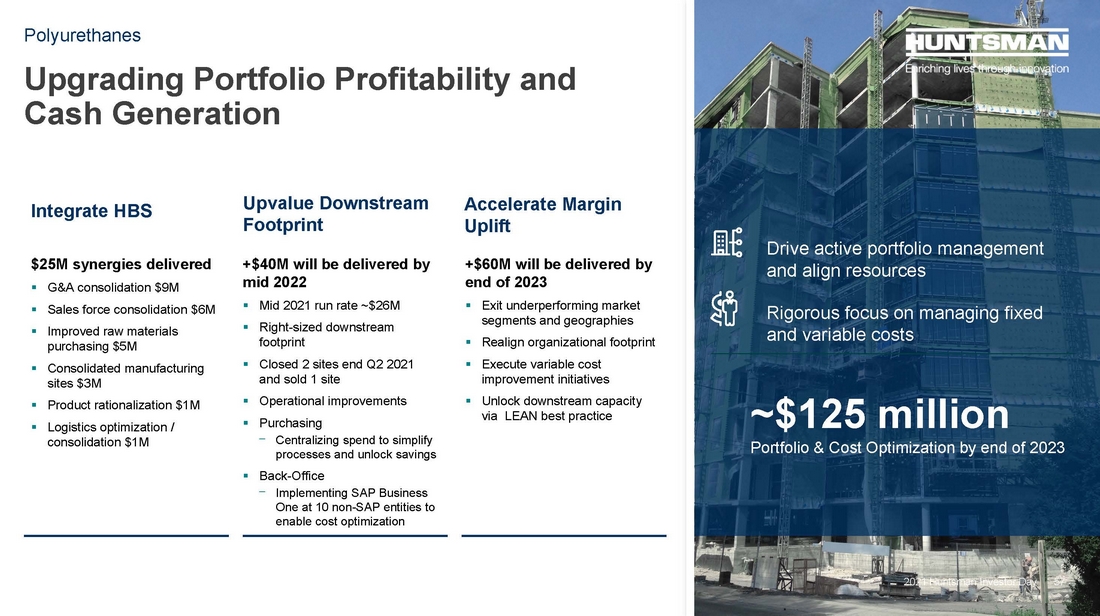
| 57 Upgrading Portfolio Profitability and Cash Generation Polyurethanes Integrate HBS $25M synergies delivered .. G&A consolidation $9M .. Sales force consolidation $6M .. Improved raw materials purchasing $5M .. Consolidated manufacturing sites $3M .. Product rationalization $1M .. Logistics optimization / consolidation $1M Upvalue Downstream Footprint +$40M will be delivered by mid 2022 .. Mid 2021 run rate ~$26M .. Right-sized downstream footprint .. Closed 2 sites end Q2 2021 and sold 1 site .. Operational improvements .. Purchasing ⎻ Centralizing spend to simplify processes and unlock savings .. Back-Office ⎻ Implementing SAP Business One at 10 non-SAP entities to enable cost optimization Accelerate Margin Uplift +$60M will be delivered by end of 2023 .. Exit underperforming market segments and geographies .. Realign organizational footprint .. Execute variable cost improvement initiatives .. Unlock downstream capacity via LEAN best practice Drive active portfolio management and align resources Rigorous focus on managing fixed and variable costs ~$125 million Portfolio & Cost Optimization by end of 2023 2021 Huntsman Investor Day 2021 Huntsman Investor Day 57 |
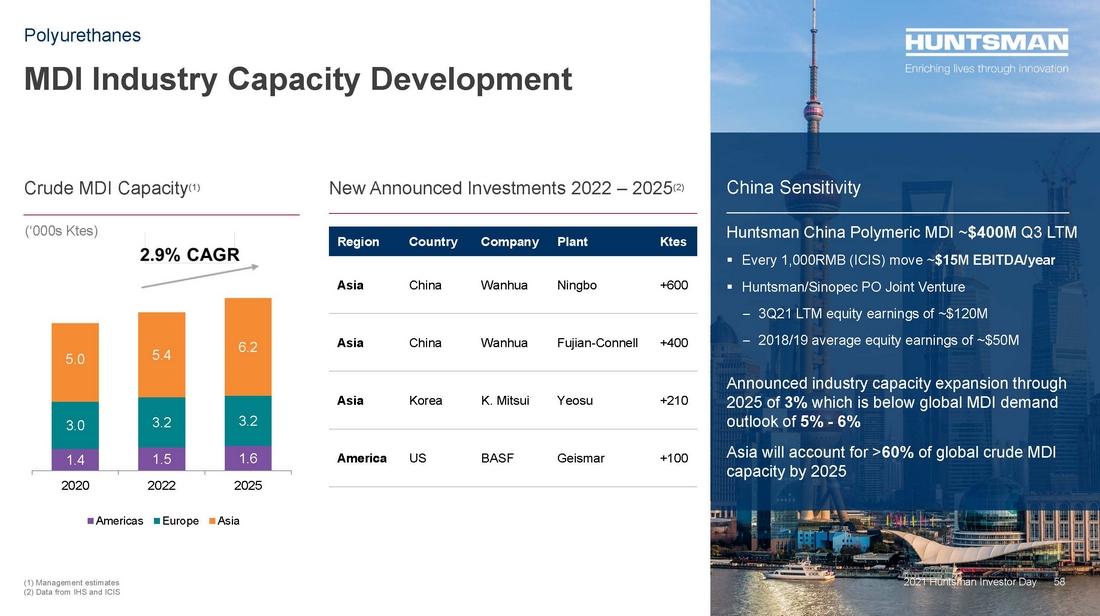
| 58 1.4 1.5 1.6 3.0 3.2 3.2 5.0 5.4 6.2 2020 2022 2025 Americas Europe Asia MDI Industry Capacity Development Polyurethanes Crude MDI Capacity(1) New Announced Investments 2022 – 2025(2) (‘000s Ktes) Region Country Company Plant Ktes Asia China Wanhua Ningbo +600 Asia China Wanhua Fujian-Connell +400 Asia Korea K. Mitsui Yeosu +210 America US BASF Geismar +100 Huntsman China Polymeric MDI = $420M Q3 LTM .. Every 1000RMB (ICIs) move ~ $14M EBITDA .. Huntsman/Sinopec PO/MTBE Joint Venture – 3Q21 LTM equity earnings of $120M – 3-year average equity of earnings of $65M Capacity expansion at 3% which is below global MDI demand outlook of 5% – 6% Asia will account for >60% of global crude MDI capacity by 2025 China Sensitivity Huntsman China Polymeric MDI ~$400M Q3 LTM .. Every 1,000RMB (ICIS) move ~$15M EBITDA/year .. Huntsman/Sinopec PO Joint Venture – 3Q21 LTM equity earnings of ~$120M – 2018/19 average equity earnings of ~$50M Announced industry capacity expansion through 2025 of 3% which is below global MDI demand outlook of 5% - 6% Asia will account for >60% of global crude MDI capacity by 2025 China Sensitivity 58 2021 Huntsman Investor Day (1) Management estimates (2) Data from IHS and ICIS |
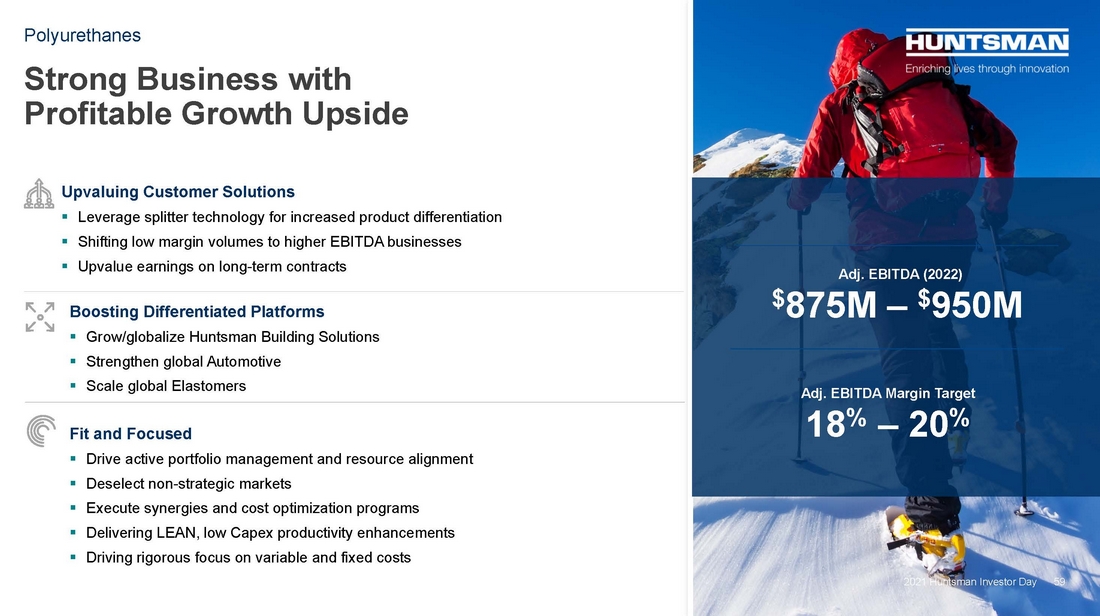
| 59 Strong Business with Profitable Growth Upside Polyurethanes 2021 Huntsman Investor Day Upvaluing Customer Solutions .. Leverage splitter technology for increased product differentiation .. Shifting low margin volumes to higher EBITDA businesses .. Upvalue earnings on long-term contracts Boosting Differentiated Platforms .. Grow/globalize Huntsman Building Solutions .. Strengthen global Automotive .. Scale global Elastomers Fit and Focused .. Drive active portfolio management and resource alignment .. Deselect non-strategic markets .. Execute synergies and cost optimization programs .. Delivering LEAN, low Capex productivity enhancements .. Driving rigorous focus on variable and fixed costs 59 Adj. EBITDA (2022) $875M – $950M Adj. EBITDA Margin Target 18% – 20% |
| 60 Textile Effects Rohit Aggarwal Division President 2021 Huntsman Investor Day |

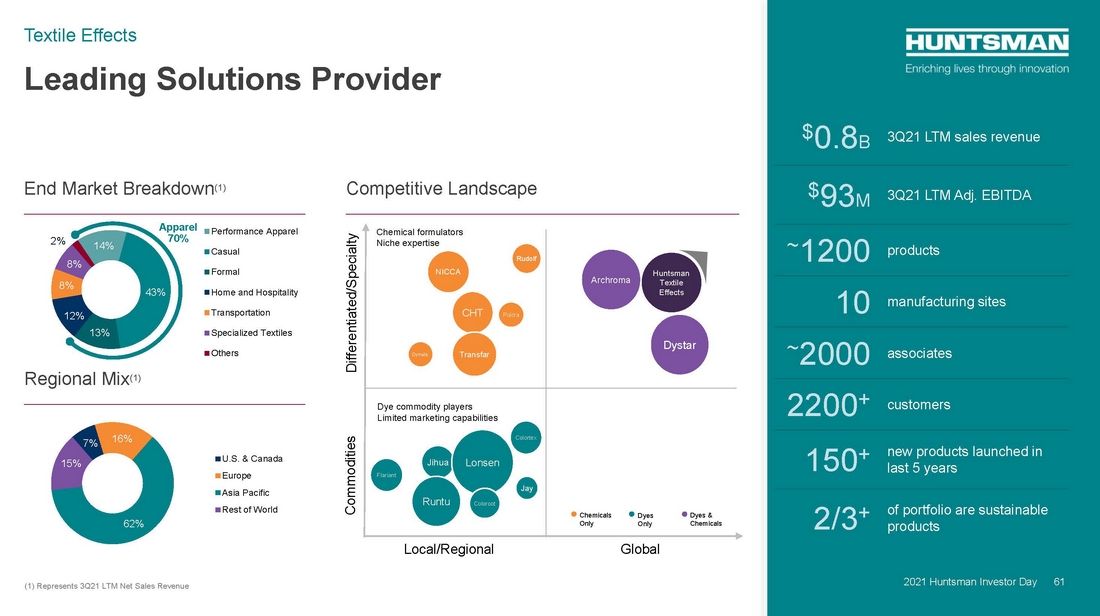
| 61 14% 43% 13% 12% 8% 8% 2% Performance Apparel Casual Formal Home and Hospitality Transportation Specialized Textiles Others Leading Solutions Provider Textile Effects 2021 Huntsman Investor Day $0.8B 3Q21 LTM sales revenue $93M 3Q21 LTM Adj. EBITDA ~1200 products 10 manufacturing sites ~2000 associates 2200+ customers 150+ new products launched in last 5 years 2/3+ of portfolio are sustainable products End Market Breakdown(1) Regional Mix(1) (1) Represents 3Q21 LTM Net Sales Revenue Apparel 70% 2021 Huntsman Investor Day 61 Commodities Differentiated/Specialty Local/Regional Global Chemicals Only Dyes Only Dyes & Chemicals Chemical formulators Niche expertise Dye commodity players Limited marketing capabilities Flariant Jihua Colortex Jay Lonsen Runtu Coloroot NICCA Rudolf Pulcra Dymatic CHT Transfar Archroma Dystar Huntsman Textile Effects Competitive Landscape 7% 16% 62% 15% U.S. & Canada Europe Asia Pacific Rest of World |
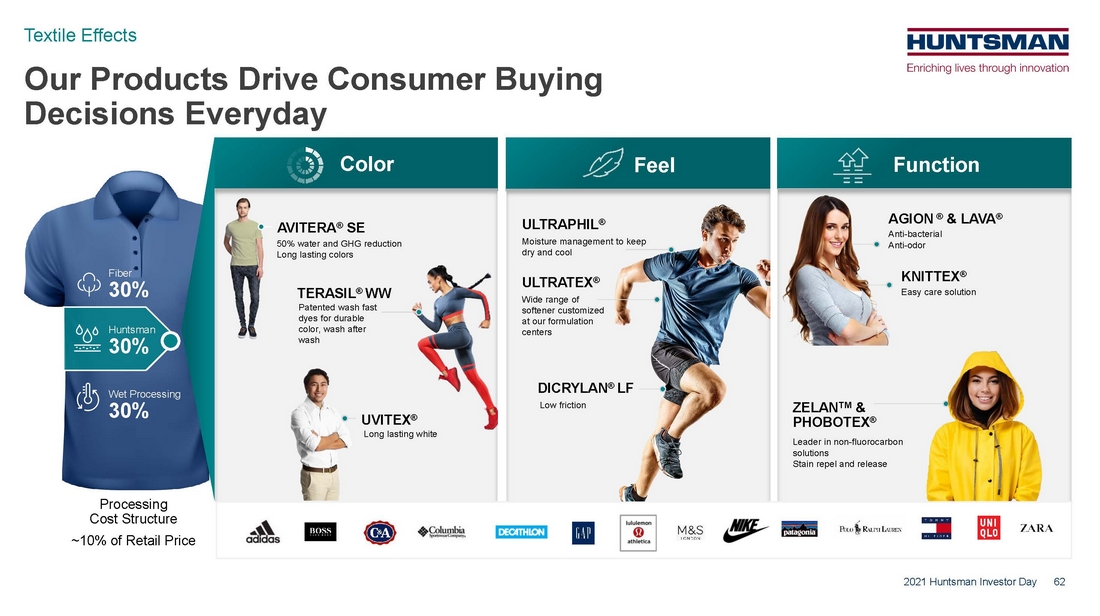
| 62 Our Products Drive Consumer Buying Decisions Everyday Textile Effects 2021 Huntsman Investor Day Fiber 30% Huntsman 30% Wet Processing 30% Color AVITERA® SE UVITEX® TERASIL® WW 50% water and GHG reduction Long lasting colors Long lasting white Patented wash fast dyes for durable color, wash after wash ULTRAPHIL® Moisture management to keep dry and cool Feel Function Processing Cost Structure ~10% of Retail Price ZELANTM & PHOBOTEX® Leader in non-fluorocarbon solutions Stain repel and release ULTRATEX® Wide range of softener customized at our formulation centers DICRYLAN® LF Low friction AGION ® & LAVA® Anti-bacterial Anti-odor KNITTEX® Easy care solution |
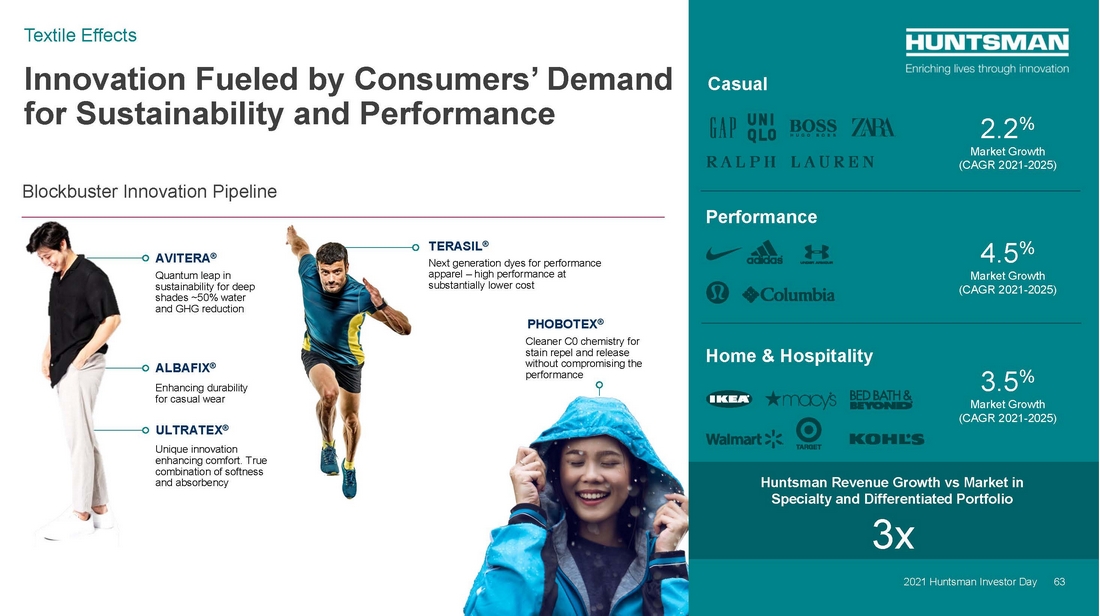
| 63 Innovation Fueled by Consumers’ Demand for Sustainability and Performance 2021 Huntsman Investor Day Textile Effects PHOBOTEX® Cleaner C0 chemistry for stain repel and release without compromising the performance Blockbuster Innovation Pipeline AVITERA® ALBAFIX® ULTRATEX® Quantum leap in sustainability for deep shades ~50% water and GHG reduction Enhancing durability for casual wear Unique innovation enhancing comfort. True combination of softness and absorbency Casual Performance Home & Hospitality TERASIL® Next generation dyes for performance apparel – high performance at substantially lower cost 2.2% Market Growth (CAGR 2021-2025) Huntsman Revenue Growth vs Market in Specialty and Differentiated Portfolio 3x 4.5% Market Growth (CAGR 2021-2025) 3.5% Market Growth (CAGR 2021-2025) 2021 Huntsman Investor Day 63 |
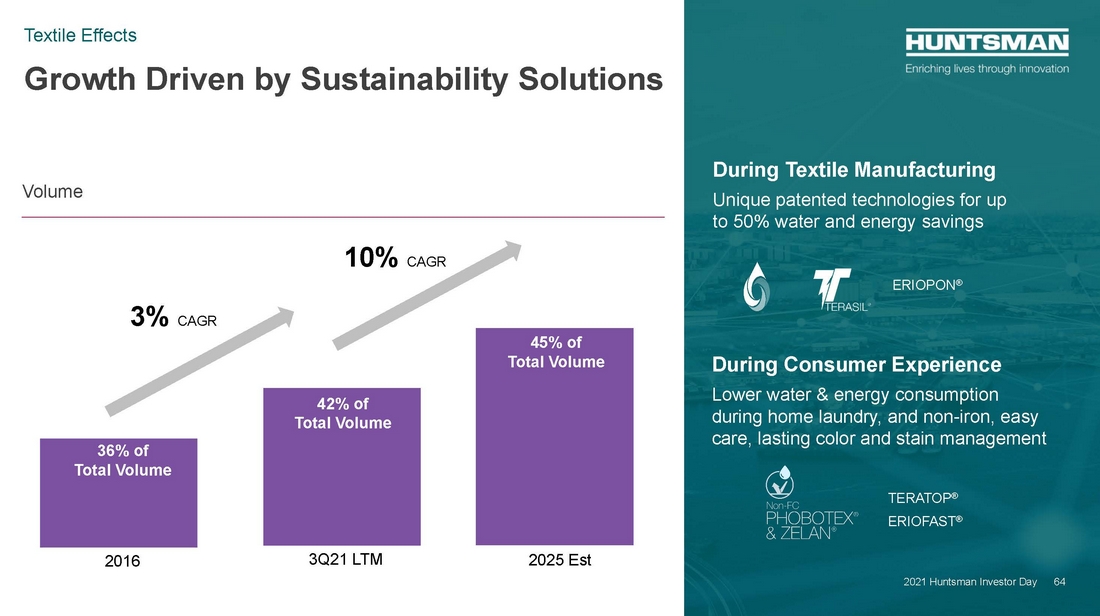
| 64 Growth Driven by Sustainability Solutions Textile Effects During Consumer Experience Lower water & energy consumption during home laundry, and non-iron, easy care, lasting color and stain management During Textile Manufacturing Unique patented technologies for up to 50% water and energy savings ERIOPON® TERATOP® ERIOFAST® Volume 3Q21 LTM 3% CAGR 2025 Est 2016 42% of Total Volume 45% of Total Volume 10% CAGR 2021 Huntsman Investor Day 64 36% of Total Volume |
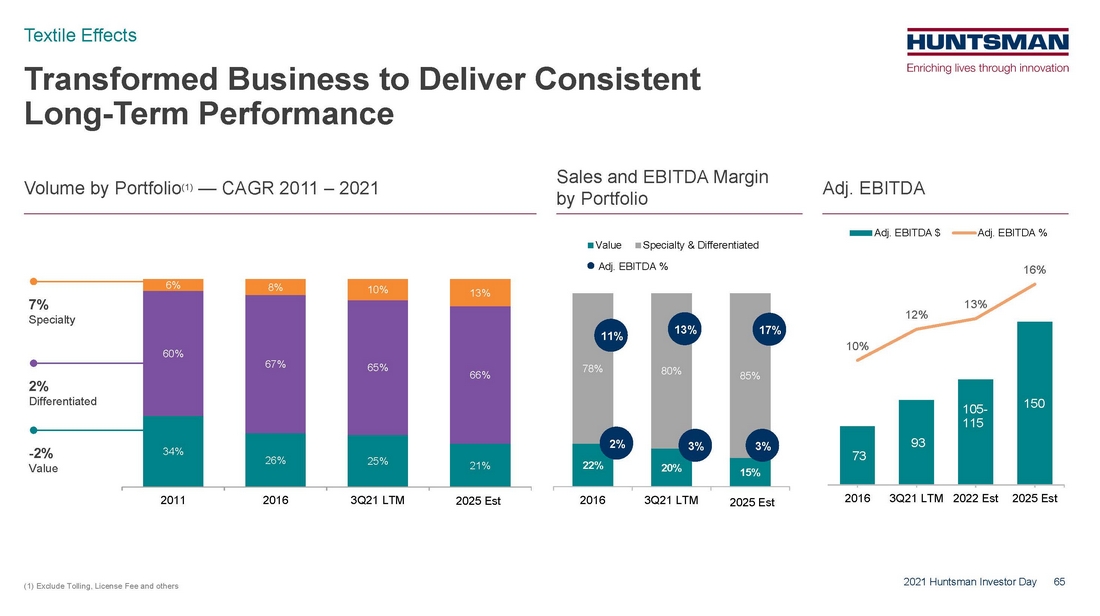
| 65 Transformed Business to Deliver Consistent Long-Term Performance Textile Effects 2021 Huntsman Investor Day (1) Exclude Tolling, License Fee and others Volume by Portfolio(1) — CAGR 2011 – 2021 Sales and EBITDA Margin by Portfolio Adj. EBITDA 73 93 150 10% 12% 13% 16% 2016 3Q21 LTM 2022 Est 2025 Est Adj. EBITDA $ Adj. EBITDA % 105- 115 7% 2% -2% 34% 26% 25% 21% 60% 67% 65% 66% 6% 8% 10% 13% 2011 2016 3Q21 LTM 2025 7% Specialty 2% Differentiated -2% Value 2025 Est 22% 20% 15% 78% 80% 85% 2016 3Q21 LTM 2025 Value Specialty & Differentiated 2025 Est Adj. EBITDA % 11% 13% 17% 2% 3% 3% |
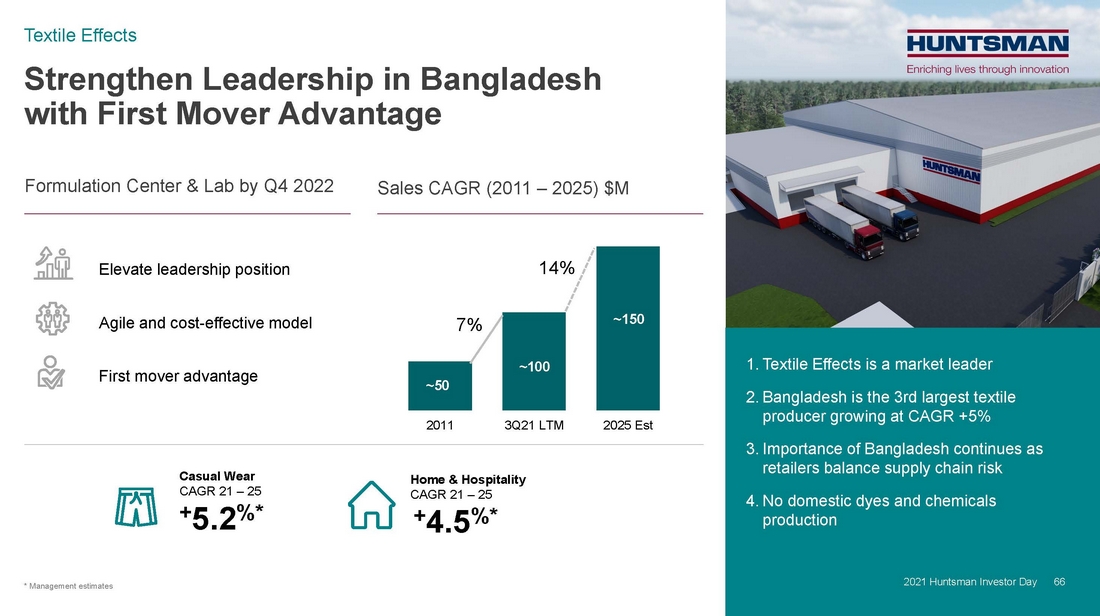
| 66 Strengthen Leadership in Bangladesh with First Mover Advantage Textile Effects 2021 Huntsman Investor Day 1. Textile Effects is a market leader 2. Bangladesh is the 3rd largest textile producer growing at CAGR +5% 3. Importance of Bangladesh continues as retailers balance supply chain risk 4. No domestic dyes and chemicals production Formulation Center & Lab by Q4 2022 Sales CAGR (2011 – 2025) $M Elevate leadership position Agile and cost-effective model First mover advantage Casual Wear CAGR 21 – 25 +5.2%* Home & Hospitality CAGR 21 – 25 +4.5%* 2021 Huntsman Investor Day 66 2011 3Q21 LTM 2025 Est 14% 7% ~50 ~100 ~150 * Management estimates |
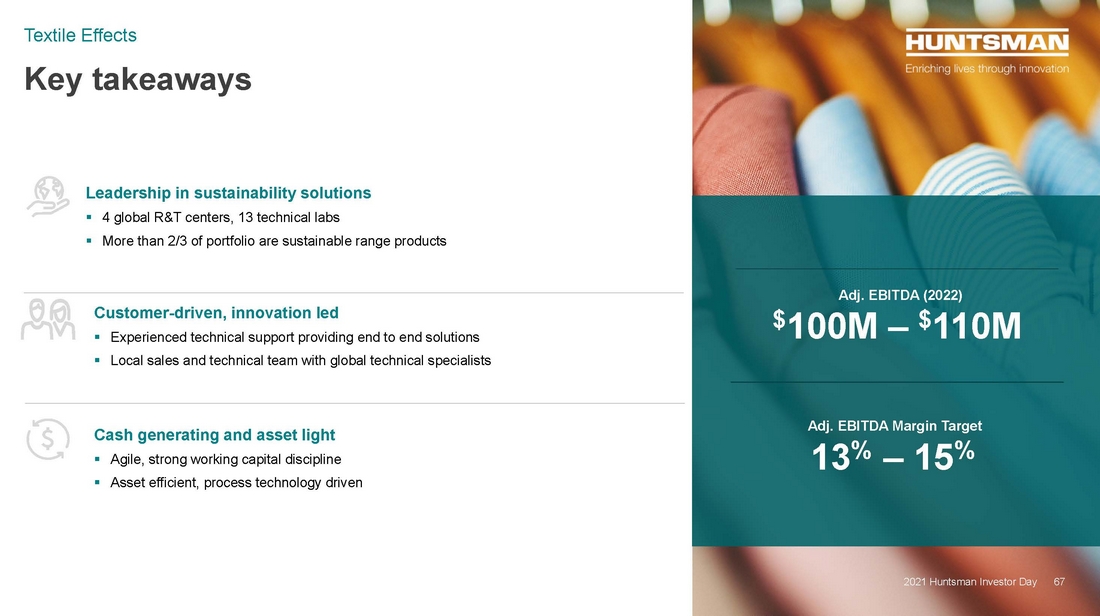
| 67 Key takeaways Textile Effects 2021 Huntsman Investor Day Customer-driven, innovation led .. Experienced technical support providing end to end solutions .. Local sales and technical team with global technical specialists Cash generating and asset light .. Agile, strong working capital discipline .. Asset efficient, process technology driven Leadership in sustainability solutions .. 4 global R&T centers, 13 technical labs .. More than 2/3 of portfolio are sustainable range products Adj. EBITDA (2022) $100M – $110M Adj. EBITDA Margin Target 13% – 15% 2021 Huntsman Investor Day 67 |
| 68 Financial Overview Phil Lister Executive Vice President & Chief Financial Officer 2021 Huntsman Investor Day |

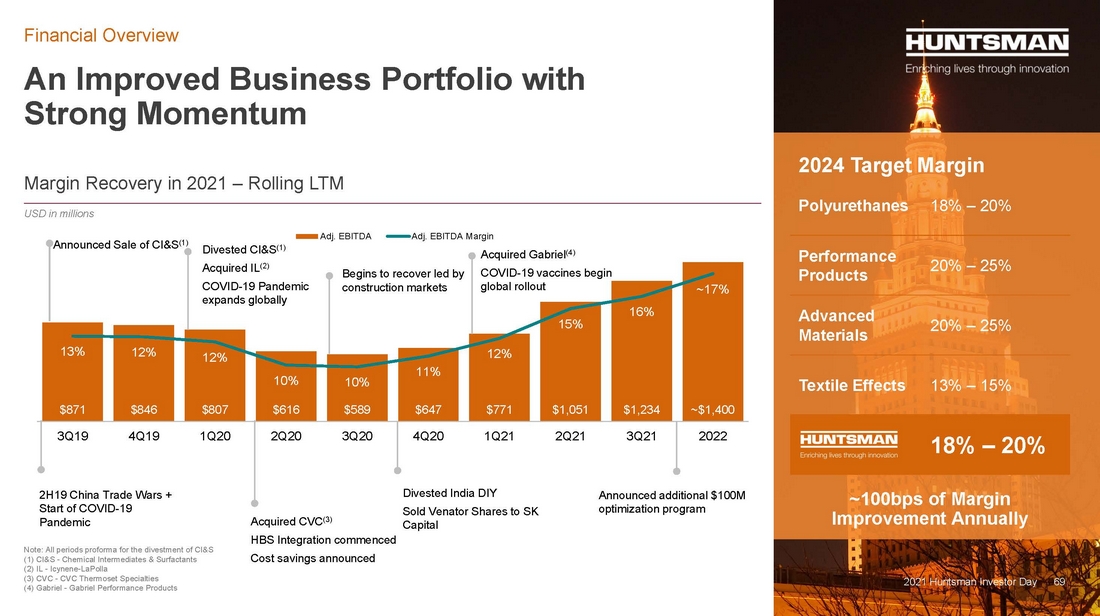
| 69 $871 $846 $807 $616 $589 $647 $771 $1,051 $1,234 ~$1,400 13% 12% 12% 10% 10% 11% 12% 15% 16% ~17% 5% 7% 9% 11% 13% 15% 17% 19% - 200 400 600 800 1,000 1,200 1,400 3Q19 4Q19 1Q20 2Q20 3Q20 4Q20 1Q21 2Q21 3Q21 2022 Adj. EBITDA Adj. EBITDA Margin Announced Sale of CI&S(1) An Improved Business Portfolio with Strong Momentum Financial Overview 2021 Huntsman Investor Day Margin Recovery in 2021 – Rolling LTM 2021 Huntsman Investor Day 69 2024 Target Margin Polyurethanes 18% – 20% Performance Products 20% – 25% Advanced Materials 20% – 25% Textile Effects 13% – 15% 18% – 20% 2H19 China Trade Wars + Start of COVID-19 Pandemic Divested CI&S(1) Acquired IL(2) COVID-19 Pandemic expands globally Acquired CVC(3) HBS Integration commenced Cost savings announced Begins to recover led by construction markets Divested India DIY Sold Venator Shares to SK Capital Acquired Gabriel(4) COVID-19 vaccines begin global rollout Announced additional $100M optimization program Note: All periods proforma for the divestment of CI&S (1) CI&S - Chemical Intermediates & Surfactants (2) IL - Icynene-LaPolla (3) CVC - CVC Thermoset Specialties (4) Gabriel - Gabriel Performance Products ~100bps of Margin Improvement Annually USD in millions |
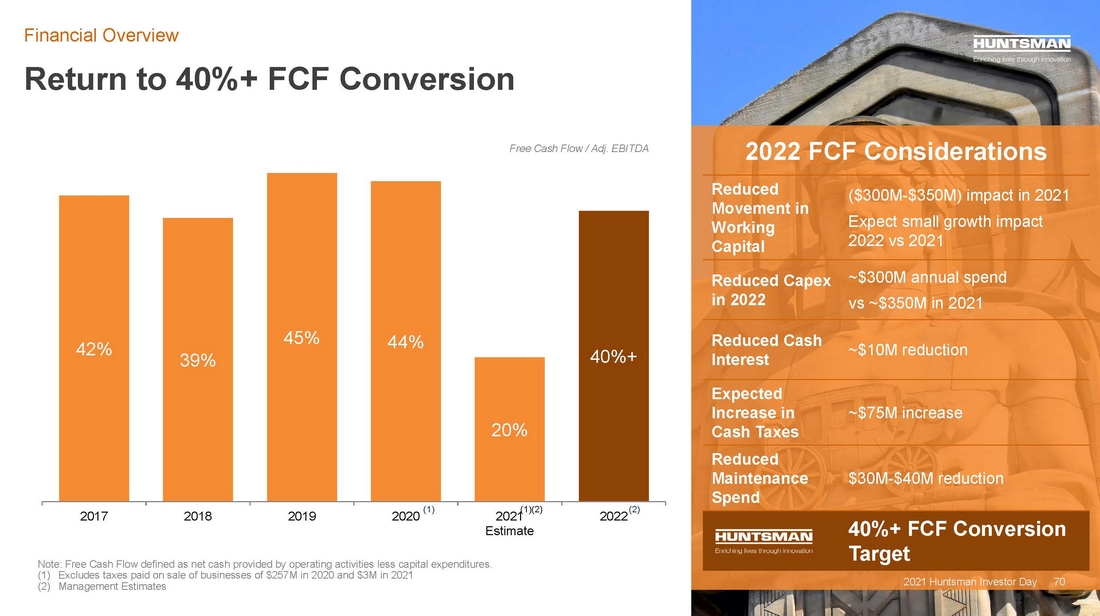
| 70 Return to 40%+ FCF Conversion Financial Overview 2021 Huntsman Investor Day 2022 FCF Considerations Reduced Movement in Working Capital ($300M-$350M) impact in 2021 Expect small growth impact 2022 vs 2021 Reduced Capex in 2022 ~$300M annual spend vs ~$350M in 2021 Reduced Cash Interest ~$10M reduction Expected Increase in Cash Taxes ~$75M increase Reduced Maintenance Spend $30M-$40M reduction 40%+ FCF Conversion Target 2021 Huntsman Investor Day 70 42% 39% 45% 44% 20% 40%+ 2017 2018 2019 2020 2021 Estimate 2022 (1)(2) Note: Free Cash Flow defined as net cash provided by operating activities less capital expenditures. (1) Excludes taxes paid on sale of businesses of $257M in 2020 and $3M in 2021 (2) Management Estimates (1) (2) Free Cash Flow / Adj. EBITDA |
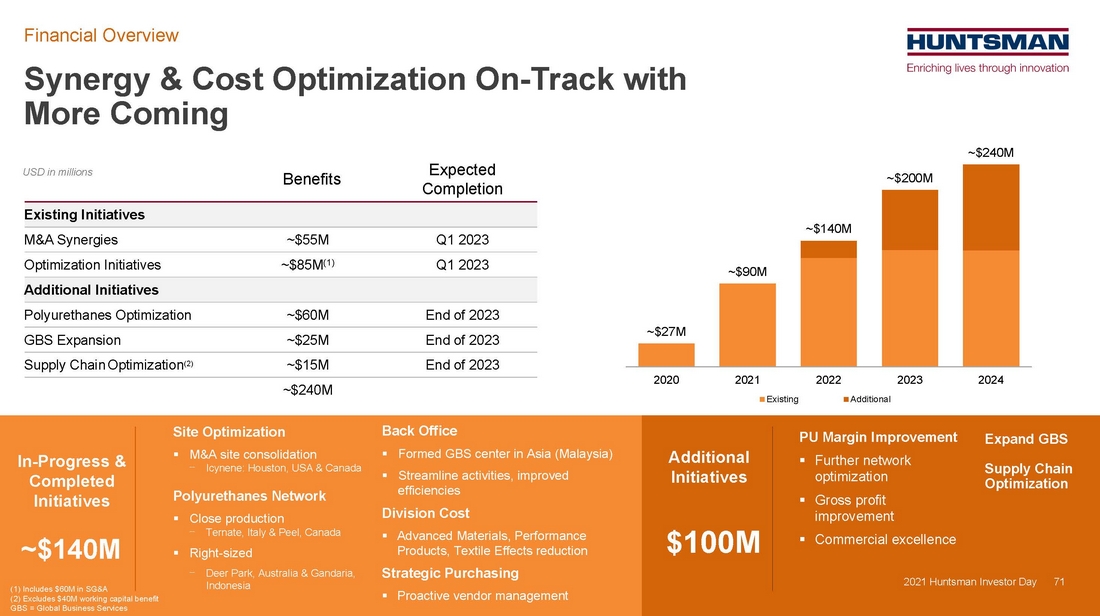
| 71 Synergy & Cost Optimization On-Track with More Coming 2021 Huntsman Investor Day Financial Overview 71 In-Progress & Completed Initiatives Site Optimization .. M&A site consolidation ⎻ Icynene: Houston, USA & Canada Polyurethanes Network .. Close production ⎻ Ternate, Italy & Peel, Canada .. Right-sized ⎻ Deer Park, Australia & Gandaria, Indonesia Back Office .. Formed GBS center in Asia (Malaysia) .. Streamline activities, improved efficiencies Division Cost .. Advanced Materials, Performance Products, Textile Effects reduction Strategic Purchasing .. Proactive vendor management Benefits Expected Completion Existing Initiatives M&A Synergies ~$55M Q1 2023 Optimization Initiatives ~$85M(1) Q1 2023 Additional Initiatives Polyurethanes Optimization ~$60M End of 2023 GBS Expansion ~$25M End of 2023 Supply ChainOptimization(2) ~$15M End of 2023 ~$240M (1) Includes $60M in SG&A (2) Excludes $40M working capital benefit GBS = Global Business Services PU Margin Improvement .. Further network optimization .. Gross profit improvement .. Commercial excellence ~$27M ~$90M ~$140M ~$200M ~$240M 2020 2021 2022 2023 2024 Existing Additional USD in millions Expand GBS Supply Chain Optimization Additional Initiatives $100M ~$140M |
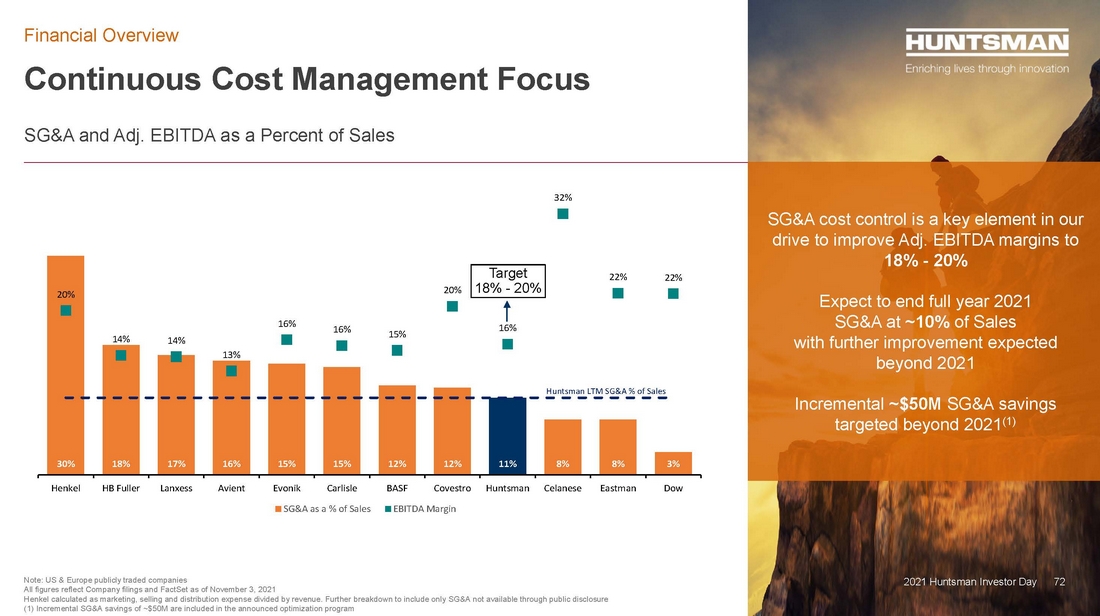
| 72 30% 18% 17% 16% 15% 15% 12% 12% 11% 8% 8% 3% 20% 14% 14% 13% 16% 16% 15% 20% 16% 32% 22% 22% 0% 5% 10% 15% 20% 25% 30% 35% 0% 5% 10% 15% 20% 25% 30% 35% 40% Henkel HB Fuller Lanxess Avient Evonik Carlisle BASF Covestro Huntsman Celanese Eastman Dow SG&A as a % of Sales EBITDA Margin Huntsman LTM SG&A % of Sales Continuous Cost Management Focus Financial Overview 2021 Huntsman Investor Day SG&A and Adj. EBITDA as a Percent of Sales SG&A cost control is a key element in our drive to improve Adj. EBITDA margins to 18% - 20% Expect to end full year 2021 SG&A at ~10% of Sales with further improvement expected beyond 2021 Incremental ~$50M SG&A savings targeted beyond 2021(1) Note: US & Europe publicly traded companies All figures reflect Company filings and FactSet as of November 3, 2021 Henkel calculated as marketing, selling and distribution expense divided by revenue. Further breakdown to include only SG&A not available through public disclosure (1) Incremental SG&A savings of ~$50M are included in the announced optimization program 72 Target 18% - 20% |
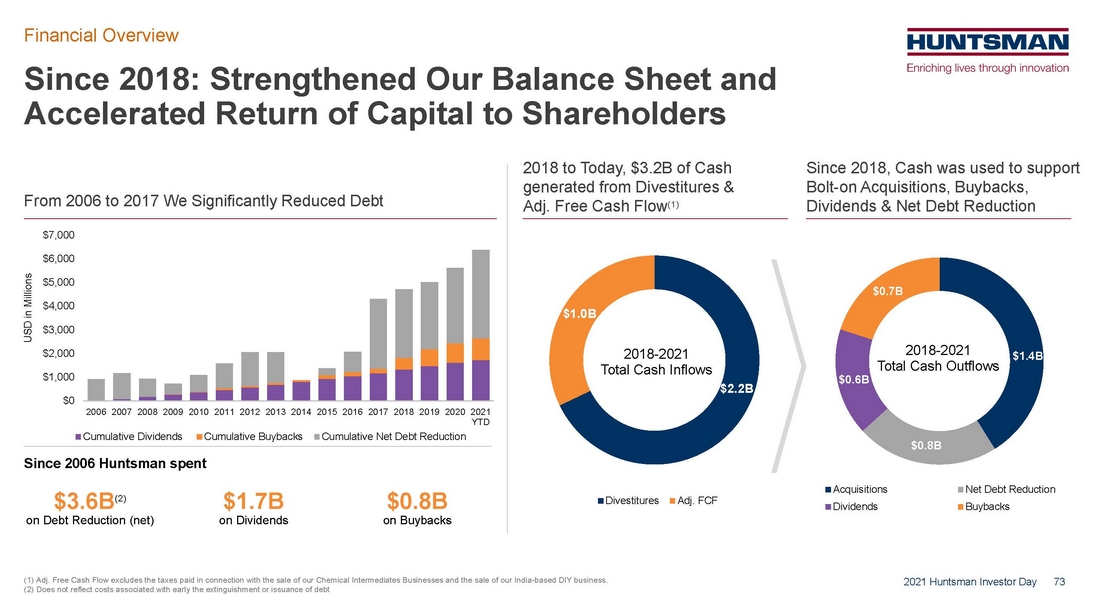
| 73 Since 2018: Strengthened Our Balance Sheet and Accelerated Return of Capital to Shareholders 2021 Huntsman Investor Day Financial Overview $2.2B $1.0B 2018-2021 Total Cash Inflows Divestitures Adj. FCF $1.4B $0.8B $0.6B $0.7B 2018-2021 Total Cash Outflows Acquisitions Net Debt Reduction Dividends Buybacks $0 $1,000 $2,000 $3,000 $4,000 $5,000 $6,000 $7,000 2006 2007 2008 2009 2010 2011 2012 2013 2014 2015 2016 2017 2018 2019 2020 2021 YTD Cumulative Dividends Cumulative Buybacks Cumulative Net Debt Reduction Since 2006 Huntsman spent From 2006 to 2017 We Significantly Reduced Debt $3.6B(2) on Debt Reduction (net) $1.7B on Dividends $0.8B on Buybacks 2018 to Today, $3.2B of Cash generated from Divestitures & Adj. Free Cash Flow(1) Since 2018, Cash was used to support Bolt-on Acquisitions, Buybacks, Dividends & Net Debt Reduction (1) Adj. Free Cash Flow excludes the taxes paid in connection with the sale of our Chemical Intermediates Businesses and the sale of our India-based DIY business. (2) Does not reflect costs associated with early the extinguishment or issuance of debt USD in Millions |
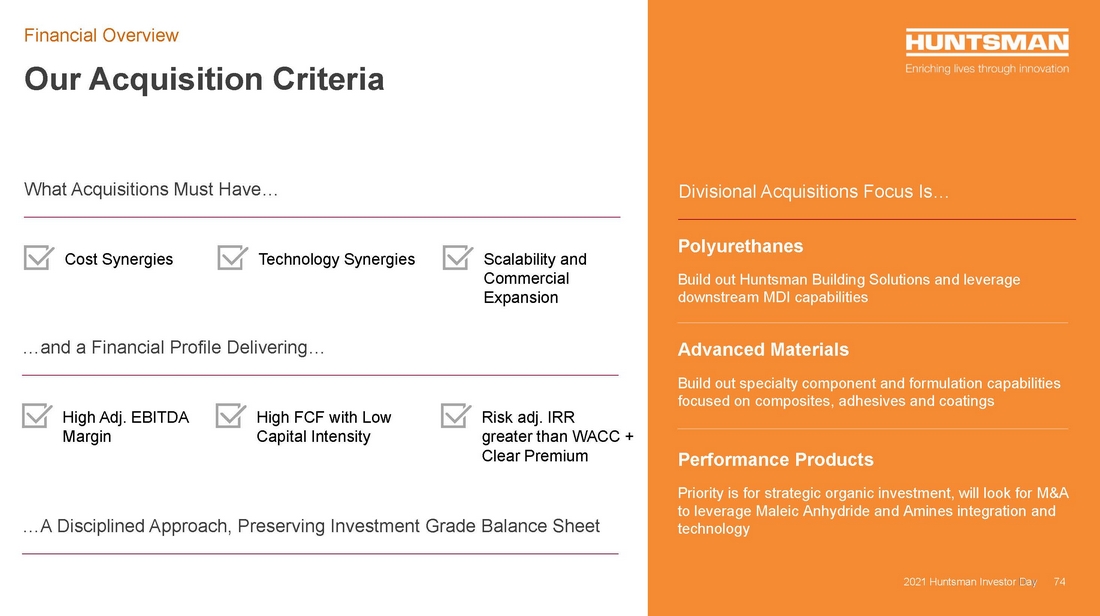
| 74 Our Acquisition Criteria Financial Overview 2021 Huntsman Investor Day 2021 Huntsman Investor Day 2021 Huntsman Investor Day 74 What Acquisitions Must Have… Cost Synergies Technology Synergies Scalability and Commercial Expansion Divisional Acquisitions Focus Is… Performance Products Priority is for strategic organic investment, will look for M&A to leverage Maleic Anhydride and Amines integration and technology Polyurethanes Build out Huntsman Building Solutions and leverage downstream MDI capabilities …and a Financial Profile Delivering… Advanced Materials Build out specialty component and formulation capabilities focused on composites, adhesives and coatings High Adj. EBITDA Margin High FCF with Low Capital Intensity Risk adj. IRR greater than WACC + Clear Premium …A Disciplined Approach, Preserving Investment Grade Balance Sheet |
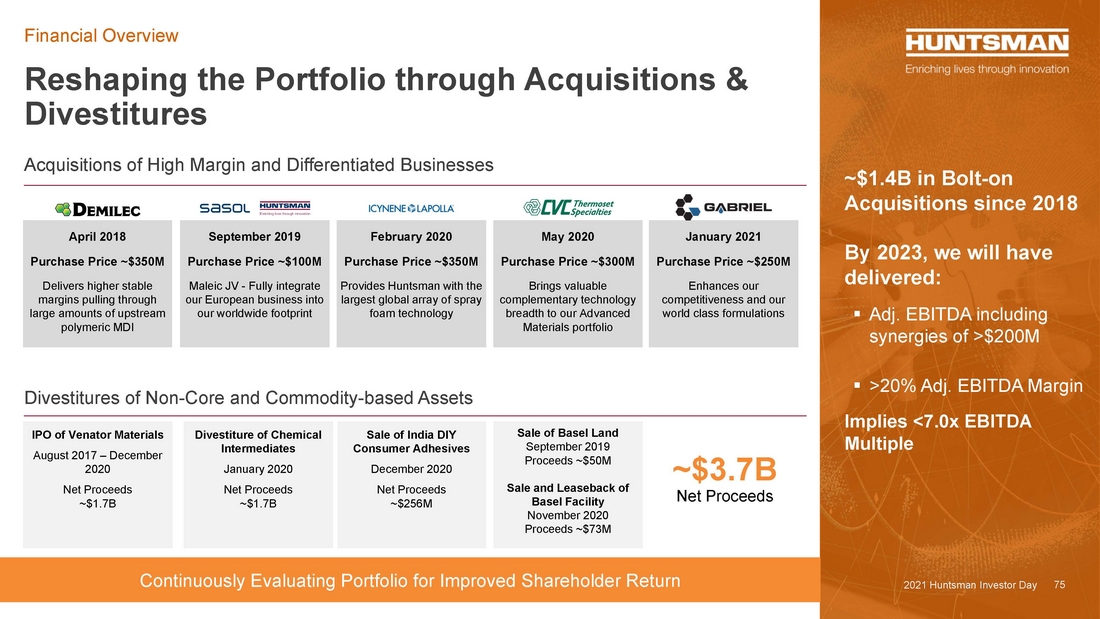
| 75 Reshaping the Portfolio through Acquisitions & Divestitures 2021 Huntsman Investor Day Financial Overview Acquisitions of High Margin and Differentiated Businesses ~$1.4B in Bolt-on Acquisitions since 2018 By 2023, we will have delivered: .. Adj. EBITDA including synergies of >$200M .. >20% Adj. EBITDA Margin Implies <7.0x EBITDA Multiple ~$3.7B Net Proceeds Divestiture of Chemical Intermediates January 2020 Net Proceeds ~$1.7B IPO of Venator Materials August 2017 – December 2020 Net Proceeds ~$1.7B Sale of Basel Land September 2019 Proceeds ~$50M Sale and Leaseback of Basel Facility November 2020 Proceeds ~$73M Sale of India DIY Consumer Adhesives December 2020 Net Proceeds ~$256M April 2018 Purchase Price ~$350M Delivers higher stable margins pulling through large amounts of upstream polymeric MDI February 2020 Purchase Price ~$350M Provides Huntsman with the largest global array of spray foam technology January 2021 Purchase Price ~$250M Enhances our competitiveness and our world class formulations May 2020 Purchase Price ~$300M Brings valuable complementary technology breadth to our Advanced Materials portfolio September 2019 Purchase Price ~$100M Maleic JV - Fully integrate our European business into our worldwide footprint 2021 Huntsman Investor Day 2021 Huntsman Investor Day 75 Continuously Evaluating Portfolio for Improved Shareholder Return Divestitures of Non-Core and Commodity-based Assets |
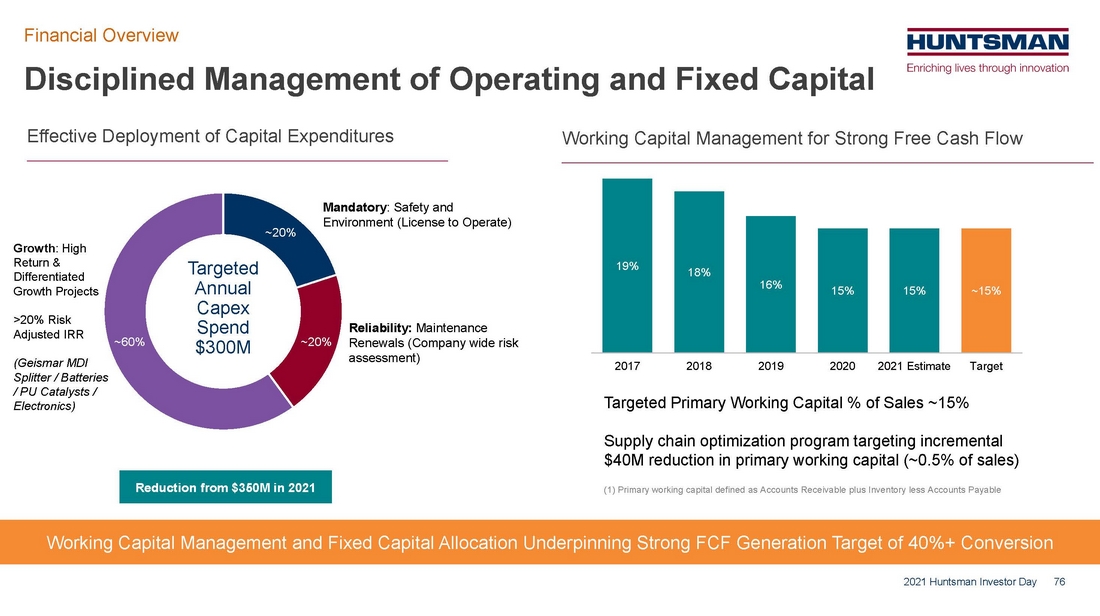
| 76 19% 18% 16% 15% 15% ~15% 2017 2018 2019 2020 2021 Estimate Target Disciplined Management of Operating and Fixed Capital Financial Overview 2021 Huntsman Investor Day Working Capital Management and Fixed Capital Allocation Underpinning Strong FCF Generation Target of 40%+ Conversion Growth: High Return & Differentiated Growth Projects >20% Risk Adjusted IRR (Geismar MDI Splitter / Batteries / PU Catalysts / Electronics) Effective Deployment of Capital Expenditures Working Capital Management for Strong Free Cash Flow Targeted Primary Working Capital % of Sales ~15% Supply chain optimization program targeting incremental $40M reduction in primary working capital (~0.5% of sales) ~20% ~20% ~60% Targeted Annual Capex Spend $300M Mandatory: Safety and Environment (License to Operate) Reliability: Maintenance Renewals (Company wide risk assessment) Reduction from $350M in 2021 (1) Primary working capital defined as Accounts Receivable plus Inventory less Accounts Payable |
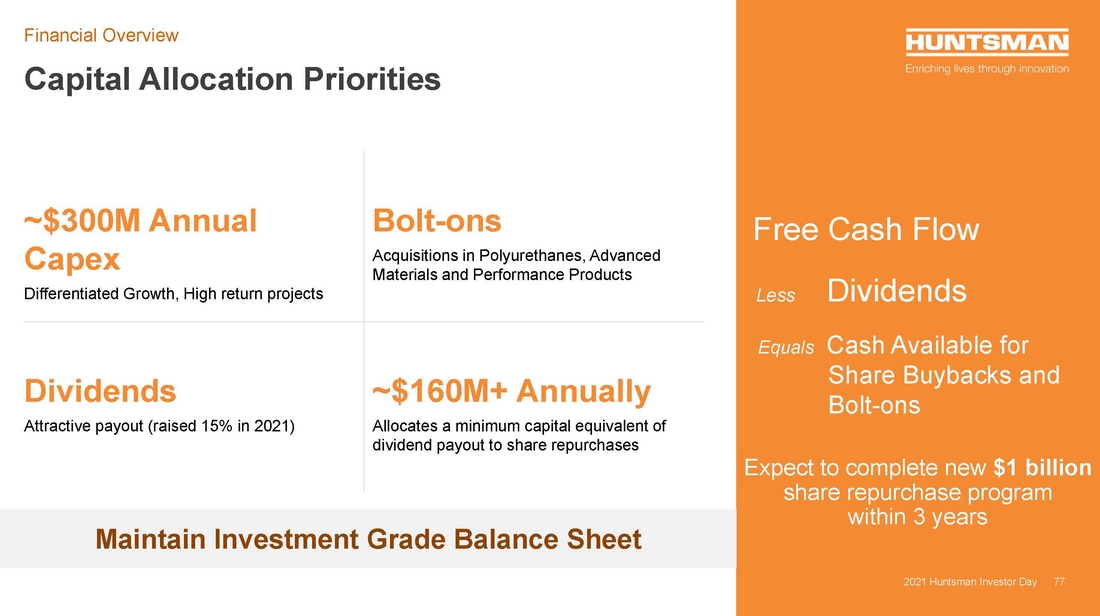
| 77 Capital Allocation Priorities Financial Overview 2021 Huntsman Investor Day Free Cash Flow 2021 Huntsman Investor Day 77 Less Dividends Maintain Investment Grade Balance Sheet ~$300M Annual Capex Differentiated Growth, High return projects Bolt-ons Acquisitions in Polyurethanes, Advanced Materials and Performance Products Dividends Attractive payout (raised 15% in 2021) ~$160M+ Annually Allocates a minimum capital equivalent of dividend payout to share repurchases Equals Cash Available for Share Buybacks and Bolt-ons Expect to complete new $1 billion share repurchase program within 3 years |
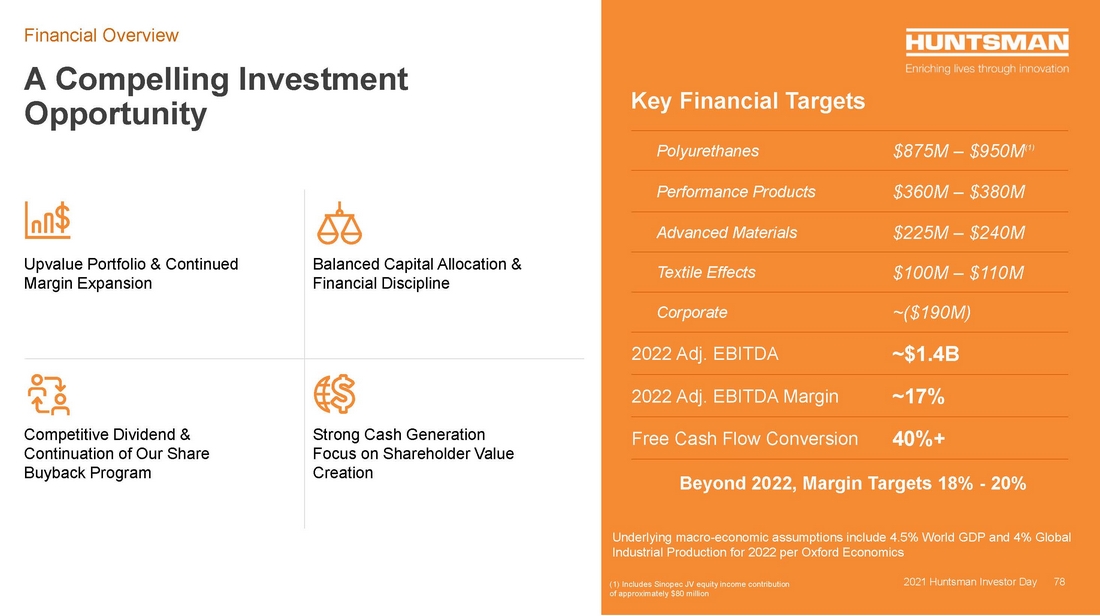
| 78 Upvalue Portfolio & Continued Margin Expansion Balanced Capital Allocation & Financial Discipline Competitive Dividend & Continuation of Our Share Buyback Program Strong Cash Generation Focus on Shareholder Value Creation A Compelling Investment Opportunity Financial Overview 2021 Huntsman Investor Day Key Financial Targets Polyurethanes $875M – $950M(1) Performance Products $360M – $380M Advanced Materials $225M – $240M Textile Effects $100M – $110M Corporate ~($190M) 2022 Adj. EBITDA ~$1.4B 2022 Adj. EBITDA Margin ~17% Free Cash Flow Conversion 40%+ 2021 Huntsman Investor Day 78 Underlying macro-economic assumptions include 4.5% World GDP and 4% Global Industrial Production for 2022 per Oxford Economics (1) Includes Sinopec JV equity income contribution of approximately $80 million Beyond 2022, Margin Targets 18% - 20% |
| 79 Q&A Investor Day 2021 79 2021 Huntsman Investor Day |

| 80 Thank you |