| The Huntsman Story: The Right Strategy, The Right Execution, The Right Board Huntsman Corporation (NYSE – HUN) March 2022 |
| A. Unnecessary: Starboard has publicly supported Huntsman’s financial targets, capital allocation, and portfolio transformation B. Unwise: Starboard’s nominees do not offer incremental or relevant expertise to oversee transformed business C. Risks Value Destruction: Starboard’s disastrous history in chemical sector demonstrates that its playbook does not work D. Ill-timed: Risks losing substantial momentum coming out of record year A. Assembled experience, expertise, and diversity critical to overseeing Huntsman’s transformed portfolio and continuing long-term success B. Appointed eight new independent directors since 2018, completing refresh underway long before Starboard appeared C. Ensured alignment and accountability through shareholder-friendly and peer-leading corporate governance profile D. Implemented new compensation plan to ensure delivery of 2021 Investor Day targets A. Exited volatile commodity businesses, made organic investments, and targeted bolt-on acquisitions in differentiated markets B. Targeted higher-growth end markets while addressing customer needs for innovation, sustainability, and reduced carbon footprints C. Drove margin improvement across business lines through relentless focus on pricing, cost, and prioritizing value over volume D. Created clear path to deliver incremental +300bps of Adj. EBITDA margin expansion over next 24-36 months A. Deleveraged balance sheet to achieve investment grade rating – improving financial flexibility and enabling balanced cash allocation strategy B. Built track record of setting – and achieving – robust financial and operational targets C. Record results validate strategy and execution, exceeding analyst and investor expectations even amid pandemic D. Delivered industry-leading 5-year TSR – and continue to significantly outperform despite Starboard’s distraction Huntsman Aggressively And Successfully Transformed The Portfolio, Enhanced The Financial Profile, And Refreshed The Board Transformational Strategy to Deliver Higher Margin Differentiated and Sustainable Solutions 1 Operational, Portfolio, and Financial Transformation Executed By Management and Overseen by the Board 2 Refreshed and Fit-for- Purpose Board Overseeing Differentiated, Downstream Focus and Driving Further Transformation 3 Starboard’s Campaign is Unnecessary, Unwise, and Risks Value Destruction 4 2 |

| Transformational Strategy To Deliver Higher Margin Differentiated And Sustainable Solutions 1 |
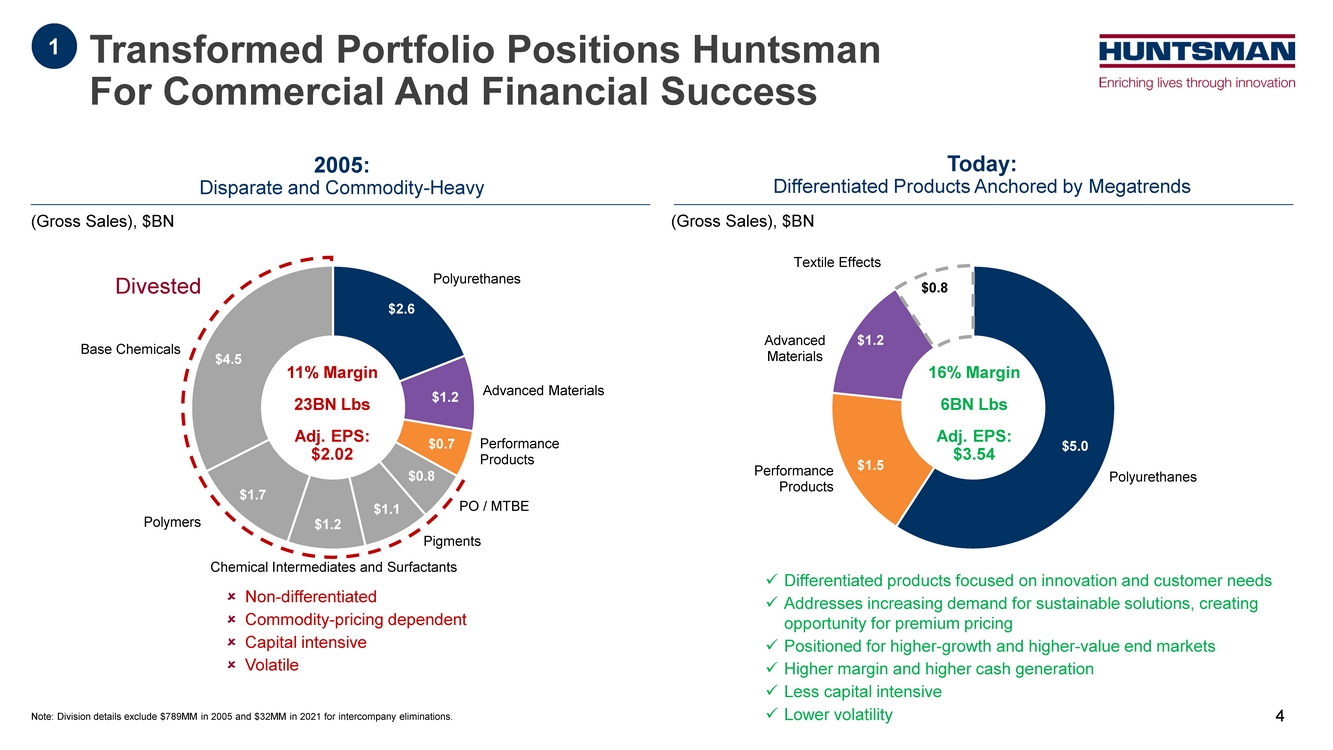
| 16% Margin 6BN Lbs Adj. EPS: $3.54 11% Margin 23BN Lbs Adj. EPS: $2.02 Polyurethanes Advanced Materials Performance Products PO / MTBE Pigments Chemical Intermediates and Surfactants Polymers Base Chemicals Polyurethanes Performance Products Advanced Materials Textile Effects Non-differentiated Commodity-pricing dependent Capital intensive Volatile Divested Differentiated products focused on innovation and customer needs Addresses increasing demand for sustainable solutions, creating opportunity for premium pricing Positioned for higher-growth and higher-value end markets Higher margin and higher cash generation Less capital intensive Lower volatility 1 Note: Division details exclude $789MM in 2005 and $32MM in 2021 for intercompany eliminations. (Gross Sales), $BN (Gross Sales), $BN $2.6 $1.2 $0.7 $0.8 $1.1 $1.2 $1.7 $4.5 $5.0 $1.5 $1.2 $0.8 Transformed Portfolio Positions Huntsman For Commercial And Financial Success Today: Differentiated Products Anchored by Megatrends 2005: Disparate and Commodity-Heavy 4 |
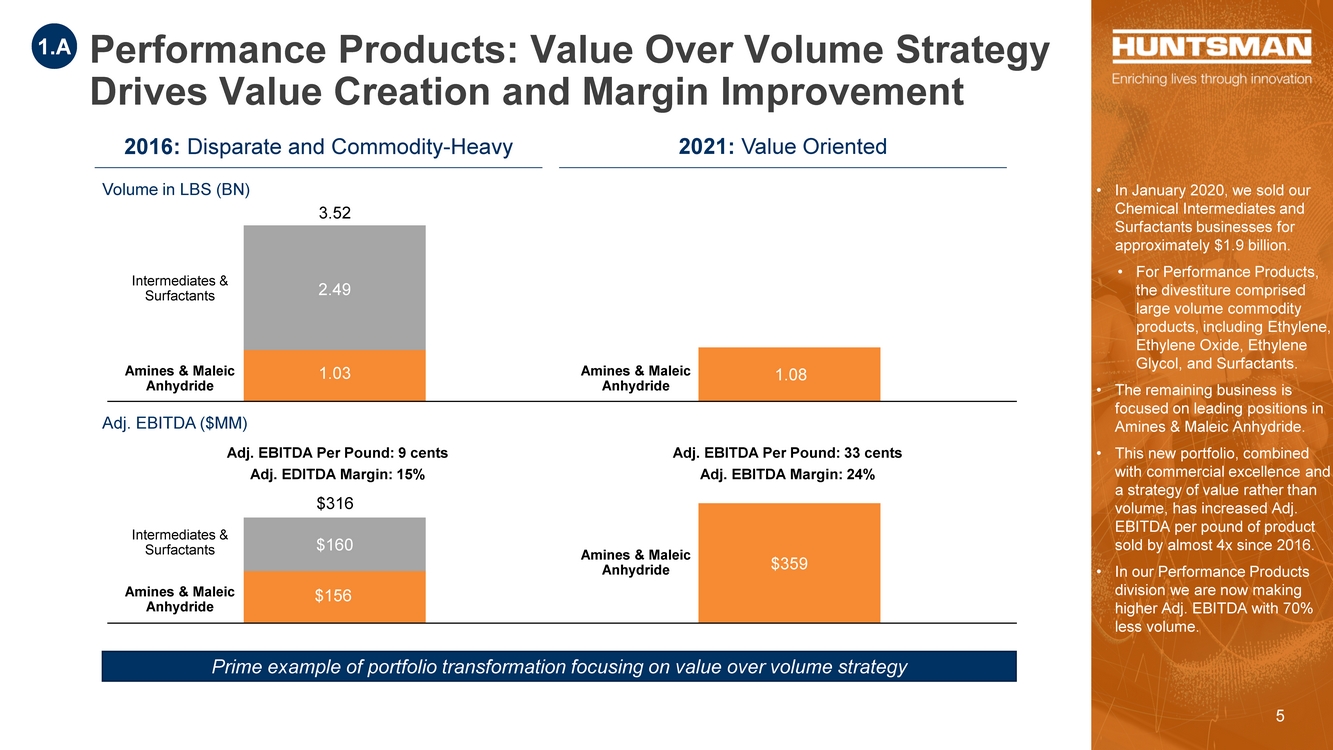
| $156 $359 $160 $359 2016 2021 1.03 1.08 2.49 2016 2021 Performance Products: Value Over Volume Strategy Drives Value Creation and Margin Improvement 1.A 5 2016: Disparate and Commodity-Heavy 2021: Value Oriented Volume in LBS (BN) Adj. EBITDA ($MM) Margin: 18% Adj. EBITDA Per Pound: 9 cents Adj. EDITDA Margin: 15% Adj. EBITDA Per Pound: 33 cents Adj. EBITDA Margin: 24% • In January 2020, we sold our Chemical Intermediates and Surfactants businesses for approximately $1.9 billion. • For Performance Products, the divestiture comprised large volume commodity products, including Ethylene, Ethylene Oxide, Ethylene Glycol, and Surfactants. • The remaining business is focused on leading positions in Amines & Maleic Anhydride. • This new portfolio, combined with commercial excellence and a strategy of value rather than volume, has increased Adj. EBITDA per pound of product sold by almost 4x since 2016. • In our Performance Products division we are now making higher Adj. EBITDA with 70% less volume. Prime example of portfolio transformation focusing on value over volume strategy Intermediates & Surfactants Amines & Maleic Anhydride Amines & Maleic Anhydride Amines & Maleic Anhydride Intermediates & Surfactants Amines & Maleic Anhydride 3.52 $316 |
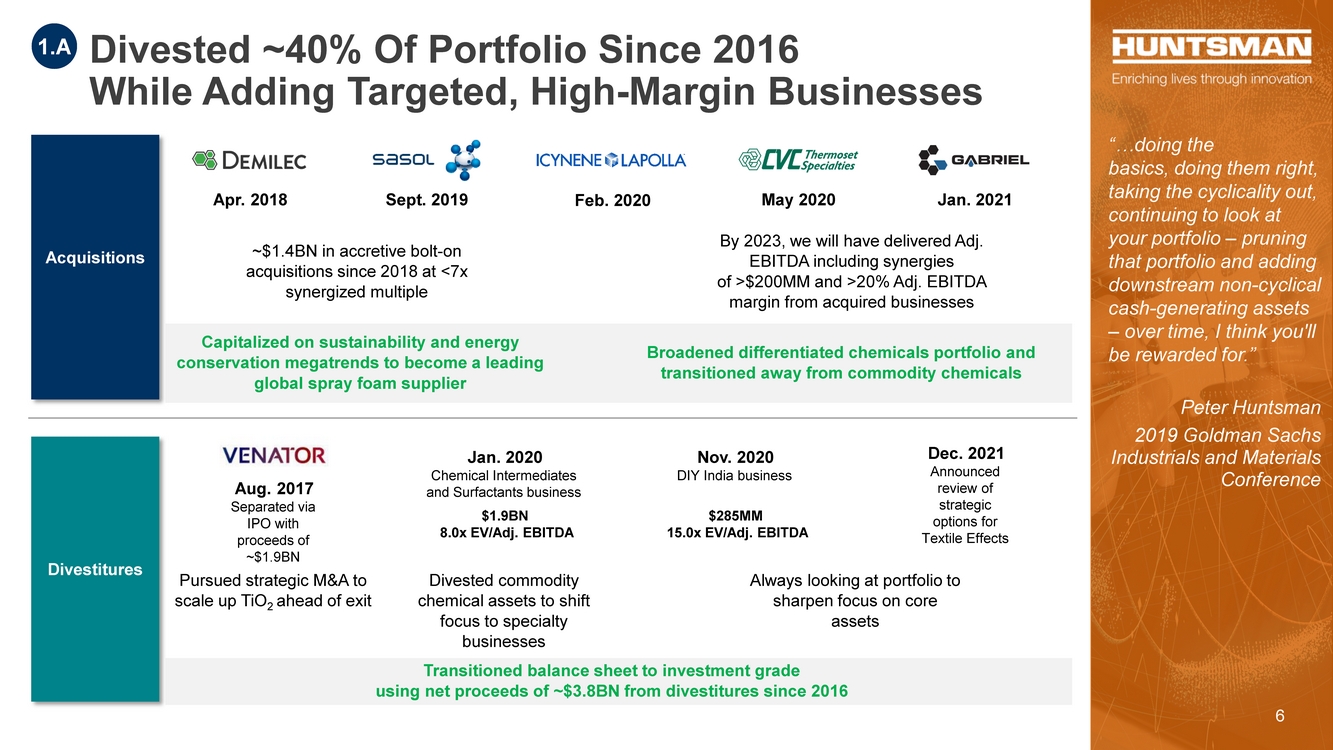
| Acquisitions Divestitures Feb. 2020 May 2020 Apr. 2018 Sept. 2019 Jan. 2021 ~$1.4BN in accretive bolt-on acquisitions since 2018 at <7x synergized multiple By 2023, we will have delivered Adj. EBITDA including synergies of >$200MM and >20% Adj. EBITDA margin from acquired businesses Capitalized on sustainability and energy conservation megatrends to become a leading global spray foam supplier Broadened differentiated chemicals portfolio and transitioned away from commodity chemicals Transitioned balance sheet to investment grade using net proceeds of ~$3.8BN from divestitures since 2016 Jan. 2020 Chemical Intermediates and Surfactants business $1.9BN 8.0x EV/Adj. EBITDA Divested commodity chemical assets to shift focus to specialty businesses Dec. 2021 Announced review of strategic options for Textile Effects Aug. 2017 Separated via IPO with proceeds of ~$1.9BN Pursued strategic M&A to scale up TiO2 ahead of exit “…doing the basics, doing them right, taking the cyclicality out, continuing to look at your portfolio – pruning that portfolio and adding downstream non-cyclical cash-generating assets – over time, I think you'll be rewarded for.” Peter Huntsman 2019 Goldman Sachs Industrials and Materials Conference Nov. 2020 DIY India business $285MM 15.0x EV/Adj. EBITDA Always looking at portfolio to sharpen focus on core assets Divested ~40% Of Portfolio Since 2016 While Adding Targeted, High-Margin Businesses 1.A 6 |
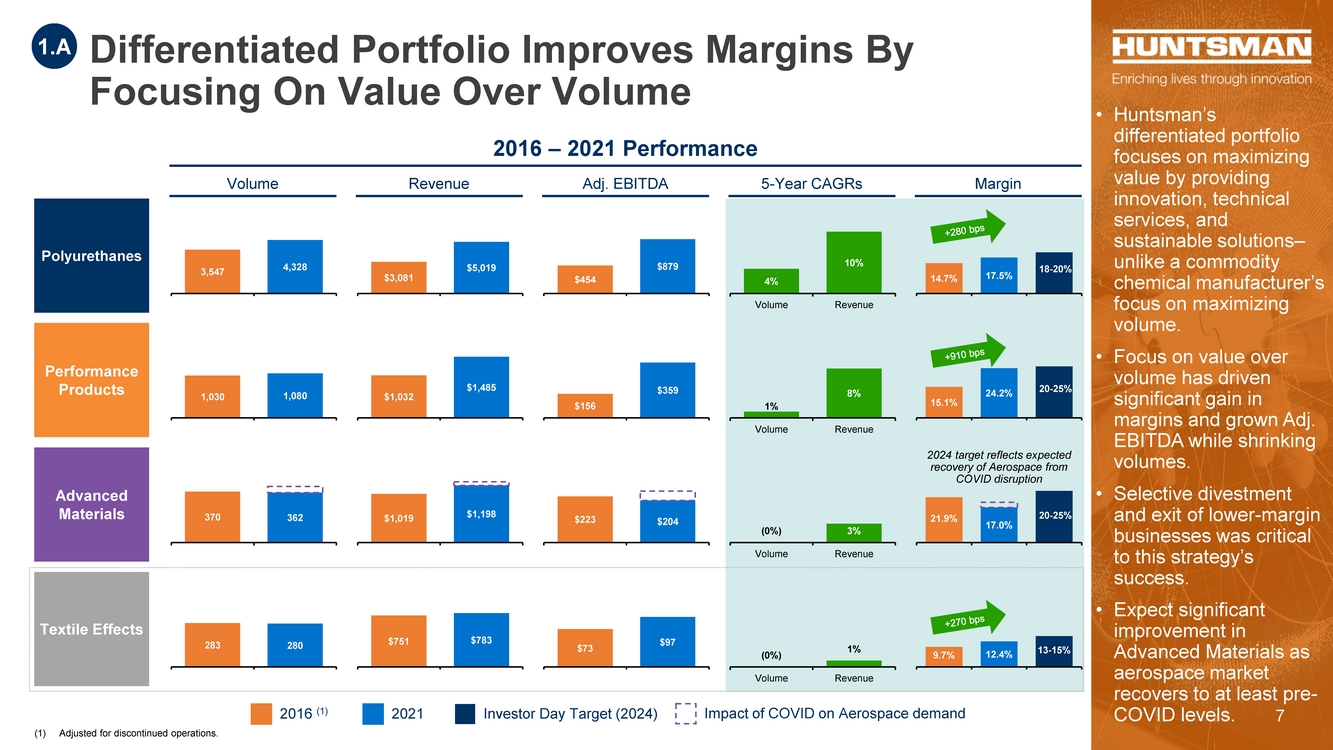
| (1) Adjusted for discontinued operations. Advanced Materials Performance Products Polyurethanes Differentiated Portfolio Improves Margins By Focusing On Value Over Volume Textile Effects Volume Revenue Adj. EBITDA 5-Year CAGRs • Huntsman’s differentiated portfolio focuses on maximizing value by providing innovation, technical services, and sustainable solutions– unlike a commodity chemical manufacturer’s focus on maximizing volume. • Focus on value over volume has driven significant gain in margins and grown Adj. EBITDA while shrinking volumes. • Selective divestment and exit of lower-margin businesses was critical to this strategy’s success. • Expect significant improvement in Advanced Materials as aerospace market recovers to at least pre- COVID levels. 1.A Margin 2016 – 2021 Performance 2016 (1) 2021 Investor Day Target (2024) 3,547 4,328 $3,081 $5,019 $454 $879 4% 10% Volume Revenue 14.7% 17.5% 18-20% 1,030 1,080 $1,032 $1,485 $156 $359 1% 8% Volume Revenue 15.1% 24.2% 20-25% 362 370 (0%) 3% Volume Revenue $1,198 $1,019 $204 $223 283 280 $751 $783 $73 $97 (0%) 1% Volume Revenue 9.7% 12.4% 13-15% 2024 target reflects expected recovery of Aerospace from COVID disruption 17.0% 21.9% 20-25% Impact of COVID on Aerospace demand 7 |
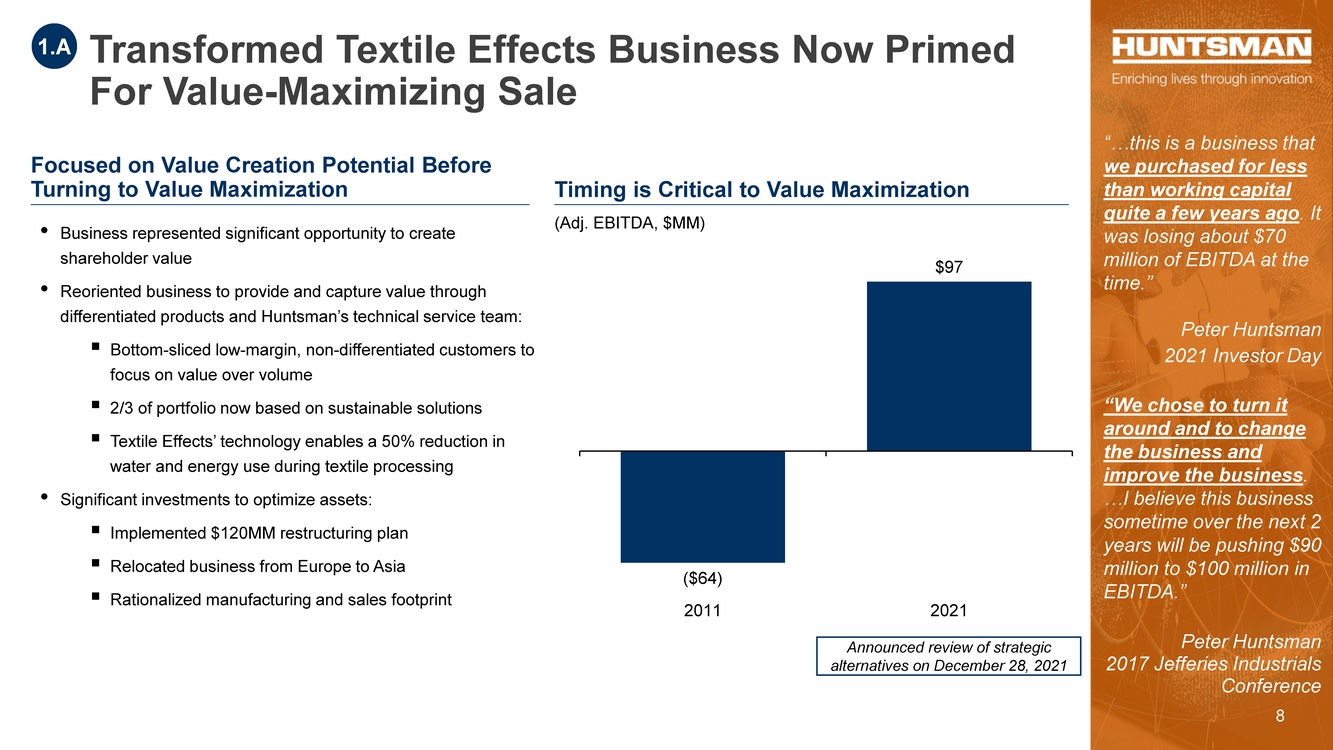
| Transformed Textile Effects Business Now Primed For Value-Maximizing Sale “…this is a business that we purchased for less than working capital quite a few years ago. It was losing about $70 million of EBITDA at the time.” Peter Huntsman 2021 Investor Day “We chose to turn it around and to change the business and improve the business. …I believe this business sometime over the next 2 years will be pushing $90 million to $100 million in EBITDA.” Peter Huntsman 2017 Jefferies Industrials Conference Focused on Value Creation Potential Before Turning to Value Maximization Timing is Critical to Value Maximization ($64) $97 2011 2021 (Adj. EBITDA, $MM) 1.A • Business represented significant opportunity to create shareholder value • Reoriented business to provide and capture value through differentiated products and Huntsman’s technical service team: .. Bottom-sliced low-margin, non-differentiated customers to focus on value over volume .. 2/3 of portfolio now based on sustainable solutions .. Textile Effects’ technology enables a 50% reduction in water and energy use during textile processing • Significant investments to optimize assets: .. Implemented $120MM restructuring plan .. Relocated business from Europe to Asia .. Rationalized manufacturing and sales footprint Announced review of strategic alternatives on December 28, 2021 8 |
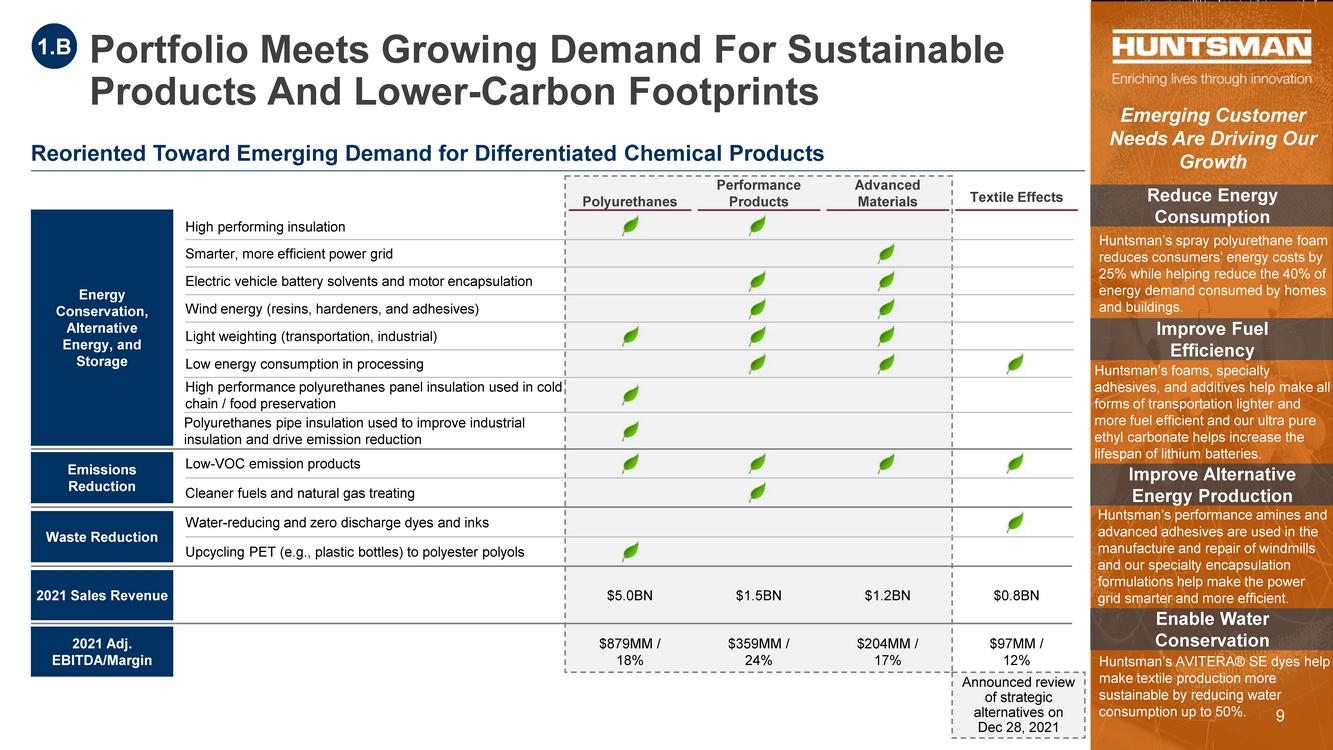
| Portfolio Meets Growing Demand For Sustainable Products And Lower-Carbon Footprints Reoriented Toward Emerging Demand for Differentiated Chemical Products Reduce Energy Consumption Huntsman’s spray polyurethane foam reduces consumers’ energy costs by 25% while helping reduce the 40% of energy demand consumed by homes and buildings. Improve Fuel Efficiency Improve Alternative Energy Production Enable Water Conservation Huntsman’s foams, specialty adhesives, and additives help make all forms of transportation lighter and more fuel efficient and our ultra pure ethyl carbonate helps increase the lifespan of lithium batteries. Huntsman’s performance amines and advanced adhesives are used in the manufacture and repair of windmills and our specialty encapsulation formulations help make the power grid smarter and more efficient. Huntsman’s AVITERA® SE dyes help make textile production more sustainable by reducing water consumption up to 50%. Emerging Customer Needs Are Driving Our Growth High performing insulation Energy Conservation, Alternative Energy, and Storage Smarter, more efficient power grid Wind energy (resins, hardeners, and adhesives) Light weighting (transportation, industrial) Low energy consumption in processing Electric vehicle battery solvents and motor encapsulation Emissions Reduction Low-VOC emission products Cleaner fuels and natural gas treating 2021 Sales Revenue 2021 Adj. EBITDA/Margin Water-reducing and zero discharge dyes and inks Upcycling PET (e.g., plastic bottles) to polyester polyols Waste Reduction $5.0BN $879MM / 18% $1.2BN $204MM / 17% $1.5BN $359MM / 24% Polyurethanes Advanced Materials Performance Products Textile Effects $0.8BN $97MM / 12% Announced review of strategic alternatives on Dec 28, 2021 1.B High performance polyurethanes panel insulation used in cold chain / food preservation Polyurethanes pipe insulation used to improve industrial insulation and drive emission reduction 9 |
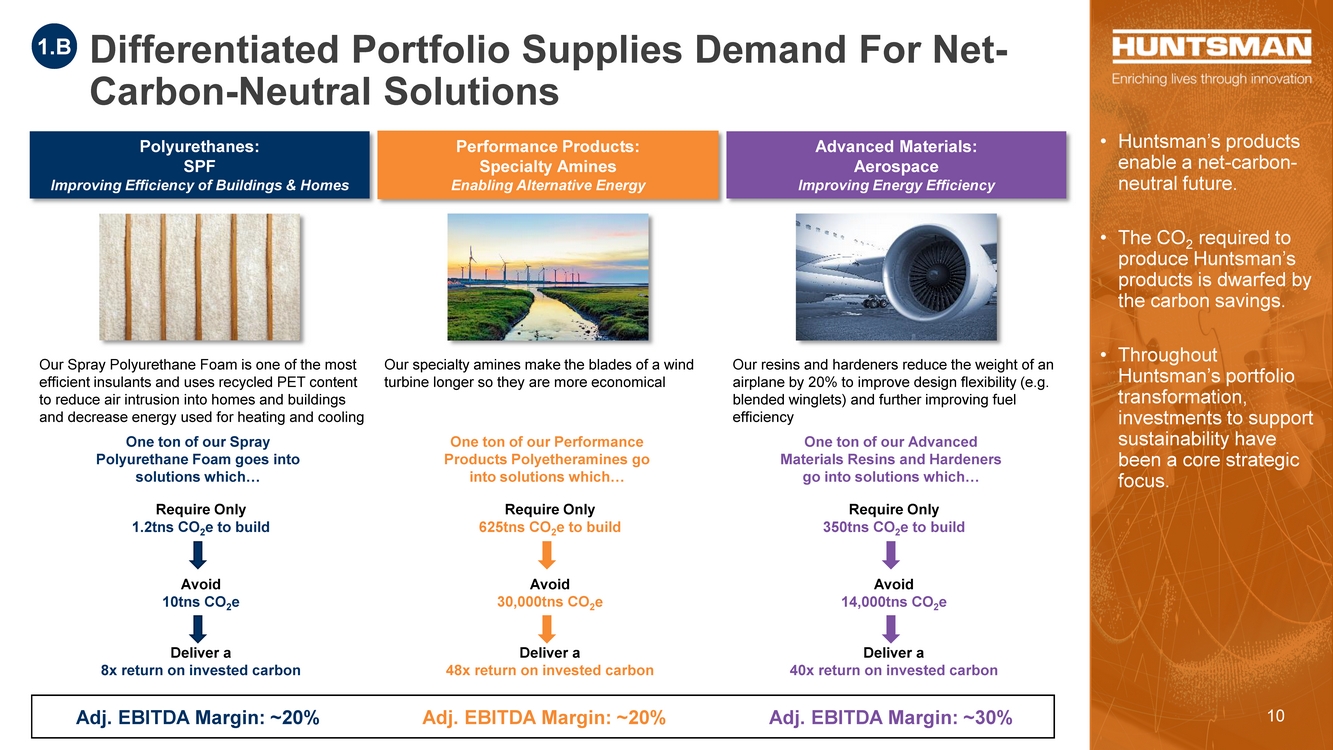
| Avoid 10tns CO2e Require Only 625tns CO2e to build Avoid 30,000tns CO2e Avoid 14,000tns CO2e Deliver a 40x return on invested carbon Differentiated Portfolio Supplies Demand For Net- Carbon-Neutral Solutions Polyurethanes: SPF Improving Efficiency of Buildings & Homes Advanced Materials: Aerospace Improving Energy Efficiency Performance Products: Specialty Amines Enabling Alternative Energy Our Spray Polyurethane Foam is one of the most efficient insulants and uses recycled PET content to reduce air intrusion into homes and buildings and decrease energy used for heating and cooling Our specialty amines make the blades of a wind turbine longer so they are more economical Our resins and hardeners reduce the weight of an airplane by 20% to improve design flexibility (e.g. blended winglets) and further improving fuel efficiency Require Only 1.2tns CO2e to build Require Only 350tns CO2e to build • Huntsman’s products enable a net-carbon- neutral future. • The CO2 required to produce Huntsman’s products is dwarfed by the carbon savings. • Throughout Huntsman’s portfolio transformation, investments to support sustainability have been a core strategic focus. 1.B One ton of our Spray Polyurethane Foam goes into solutions which… One ton of our Performance Products Polyetheramines go into solutions which… One ton of our Advanced Materials Resins and Hardeners go into solutions which… Adj. EBITDA Margin: ~20% Adj. EBITDA Margin: ~20% Adj. EBITDA Margin: ~30% Deliver a 48x return on invested carbon Deliver a 8x return on invested carbon 10 |
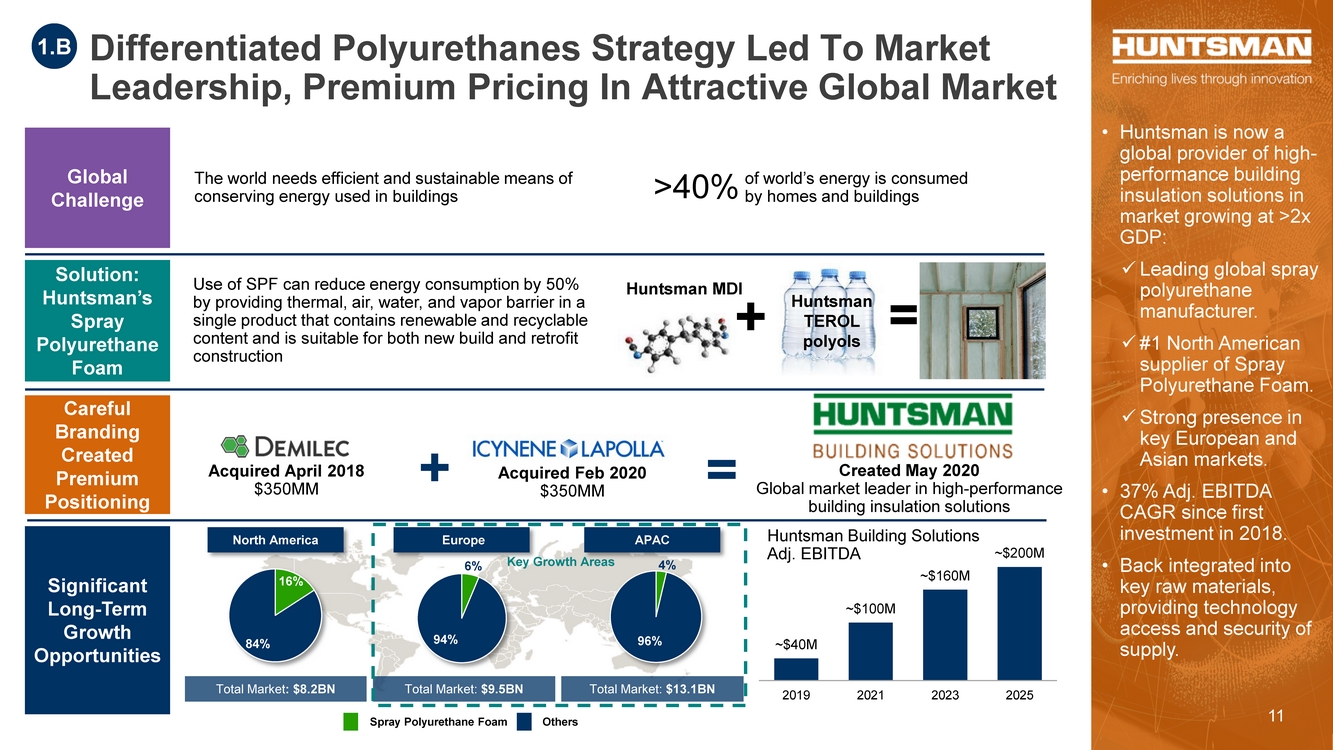
| = Huntsman MDI Huntsman TEROL polyols + • Huntsman is now a global provider of high- performance building insulation solutions in market growing at >2x GDP: Leading global spray polyurethane manufacturer. #1 North American supplier of Spray Polyurethane Foam. Strong presence in key European and Asian markets. • 37% Adj. EBITDA CAGR since first investment in 2018. • Back integrated into key raw materials, providing technology access and security of supply. of world’s energy is consumed by homes and buildings >40% Solution: Huntsman’s Spray Polyurethane Foam 6% 94% 4% 96% APAC Europe North America Spray Polyurethane Foam Others Total Market: $13.1BN Total Market: $9.5BN Total Market: $8.2BN Global Challenge The world needs efficient and sustainable means of conserving energy used in buildings Careful Branding Created Premium Positioning Significant Long-Term Growth Opportunities 16% 84% Key Growth Areas Differentiated Polyurethanes Strategy Led To Market Leadership, Premium Pricing In Attractive Global Market 1.B Acquired April 2018 $350MM Acquired Feb 2020 $350MM ~$40M ~$100M ~$160M ~$200M 2019 2021 2023 2025 Huntsman Building Solutions Adj. EBITDA Created May 2020 Global market leader in high-performance building insulation solutions + = Use of SPF can reduce energy consumption by 50% by providing thermal, air, water, and vapor barrier in a single product that contains renewable and recyclable content and is suitable for both new build and retrofit construction 11 |
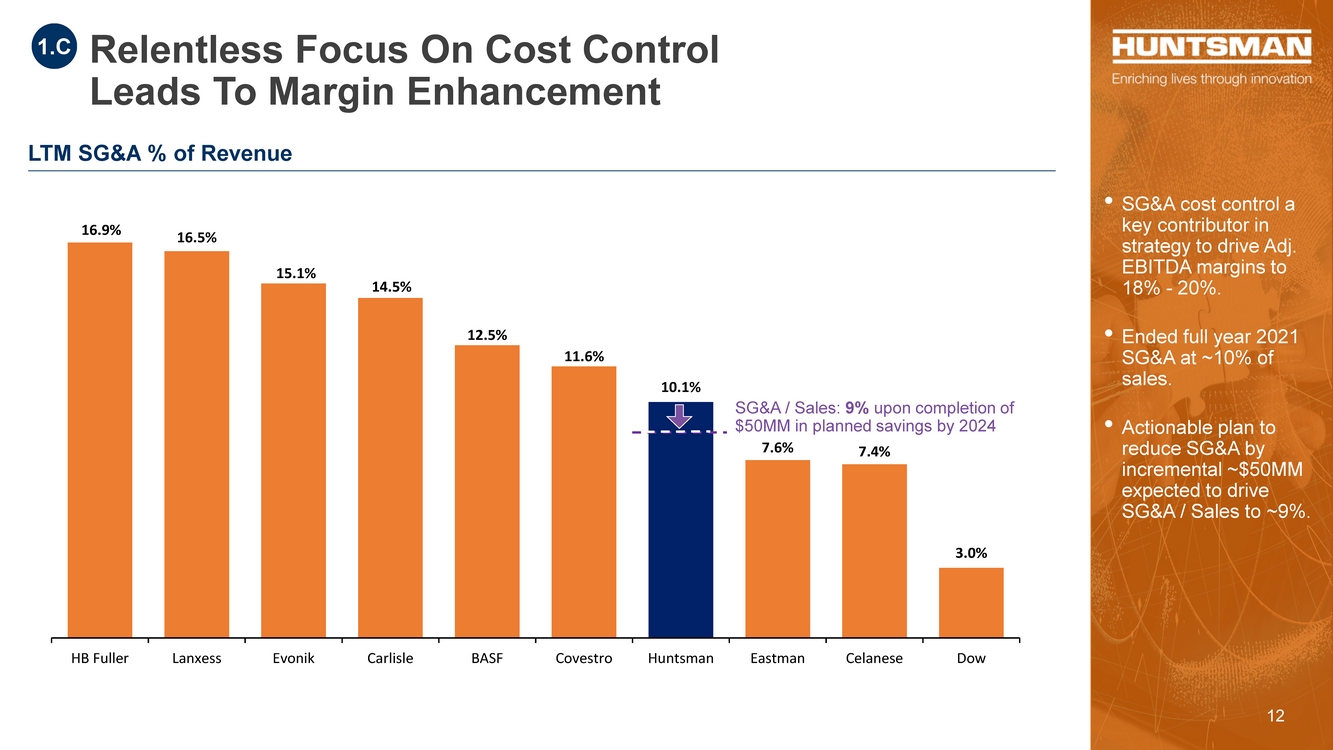
| 16.9% 16.5% 15.1% 14.5% 12.5% 11.6% 10.1% 7.6% 7.4% 3.0% 0.0% 2.0% 4.0% 6.0% 8.0% 10.0% 12.0% 14.0% 16.0% 18.0% 20.0% HB Fuller Lanxess Evonik Carlisle BASF Covestro Huntsman Eastman Celanese Dow Relentless Focus On Cost Control Leads To Margin Enhancement • SG&A cost control a key contributor in strategy to drive Adj. EBITDA margins to 18% - 20%. • Ended full year 2021 SG&A at ~10% of sales. • Actionable plan to reduce SG&A by incremental ~$50MM expected to drive SG&A / Sales to ~9%. SG&A / Sales: 9% upon completion of $50MM in planned savings by 2024 1.C LTM SG&A % of Revenue 12 |
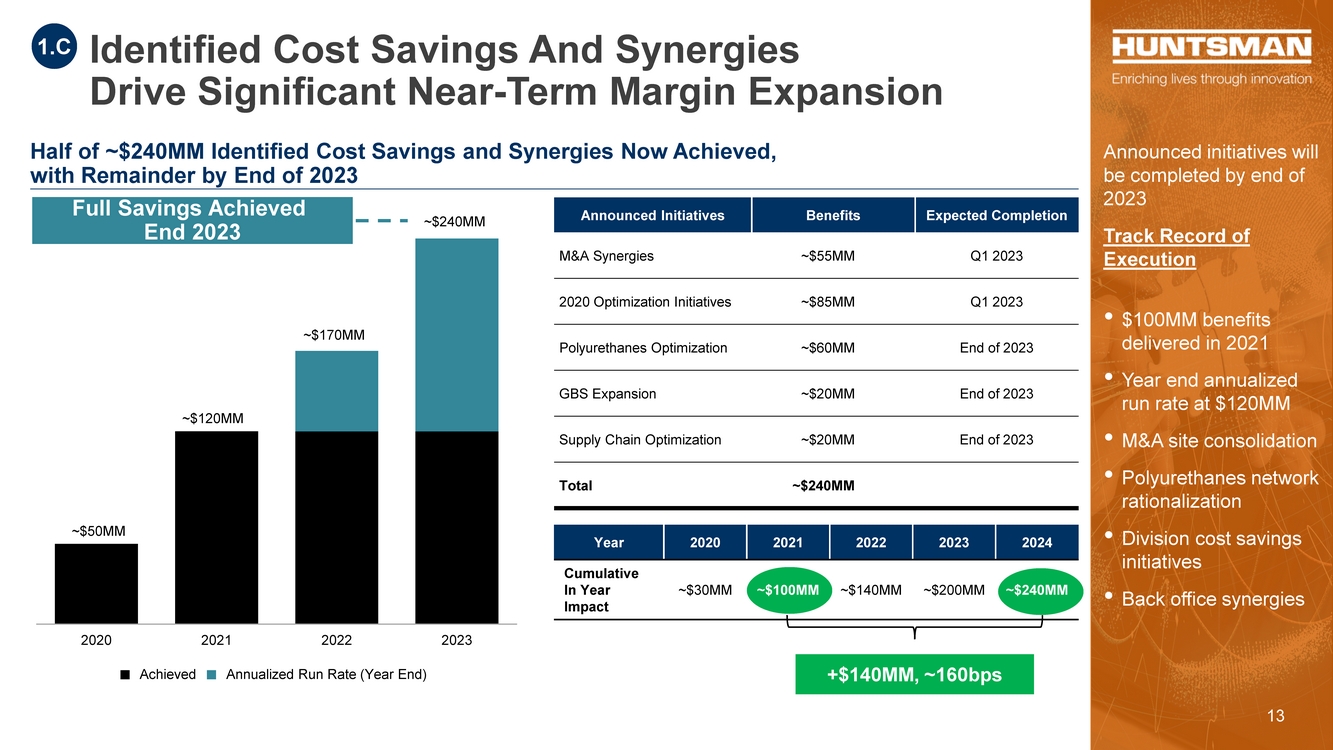
| +$140MM, ~160bps 2020 2021 2022 2023 ~$170MM ~$120MM ~$50MM ~$240MM Identified Cost Savings And Synergies Drive Significant Near-Term Margin Expansion Announced initiatives will be completed by end of 2023 Track Record of Execution • $100MM benefits delivered in 2021 • Year end annualized run rate at $120MM • M&A site consolidation • Polyurethanes network rationalization • Division cost savings initiatives • Back office synergies Half of ~$240MM Identified Cost Savings and Synergies Now Achieved, with Remainder by End of 2023 Announced Initiatives Benefits Expected Completion M&A Synergies ~$55MM Q1 2023 2020 Optimization Initiatives ~$85MM Q1 2023 Polyurethanes Optimization ~$60MM End of 2023 GBS Expansion ~$20MM End of 2023 Supply Chain Optimization ~$20MM End of 2023 Total ~$240MM 1.C Annualized Run Rate (Year End) Achieved Year 2020 2021 2022 2023 2024 Cumulative In Year Impact ~$30MM ~$100MM ~$140MM ~$200MM ~$240MM Full Savings Achieved End 2023 13 |
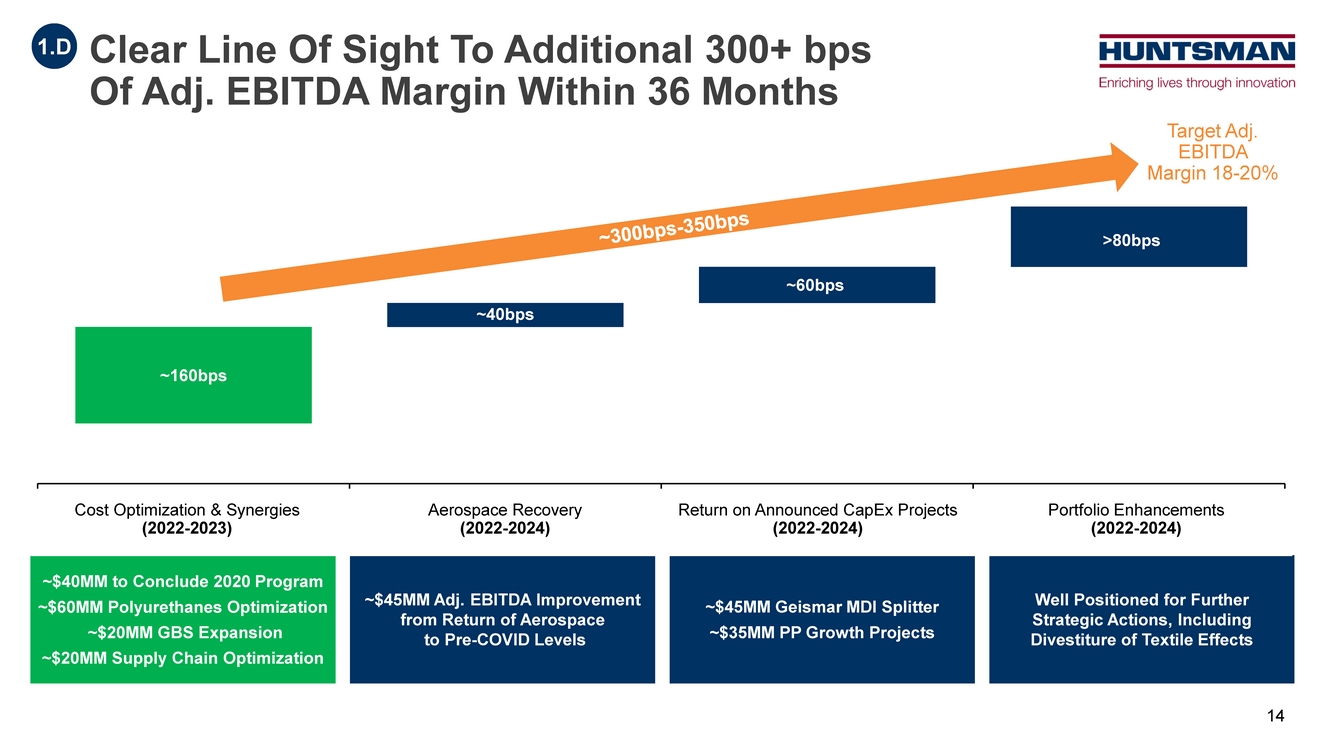
| ~160bps ~40bps ~60bps >80bps Cost Optimization & Synergies Aerospace Recovery Return on Announced CapEx Projects Portfolio Enhancements (2022-2024) (2022-2024) (2022-2024) (2022-2024) ~$40MM to Conclude 2020 Program ~$60MM Polyurethanes Optimization ~$20MM GBS Expansion ~$20MM Supply Chain Optimization ~$45MM Adj. EBITDA Improvement from Return of Aerospace to Pre-COVID Levels ~$45MM Geismar MDI Splitter ~$35MM PP Growth Projects Well Positioned for Further Strategic Actions, Including Divestiture of Textile Effects Target Adj. EBITDA Margin 18-20% Clear Line Of Sight To Additional 300+ bps Of Adj. EBITDA Margin Within 36 Months 1.D Cost Optimization & Synergies Aerospace Recovery Return on Announced CapEx Projects Portfolio Enhancements (2022-2023) (2022-2024) (2022-2024) (2022-2024) 14 |
| Operational, Portfolio, And Financial Transformation Executed By Management And Overseen By Board 2 |
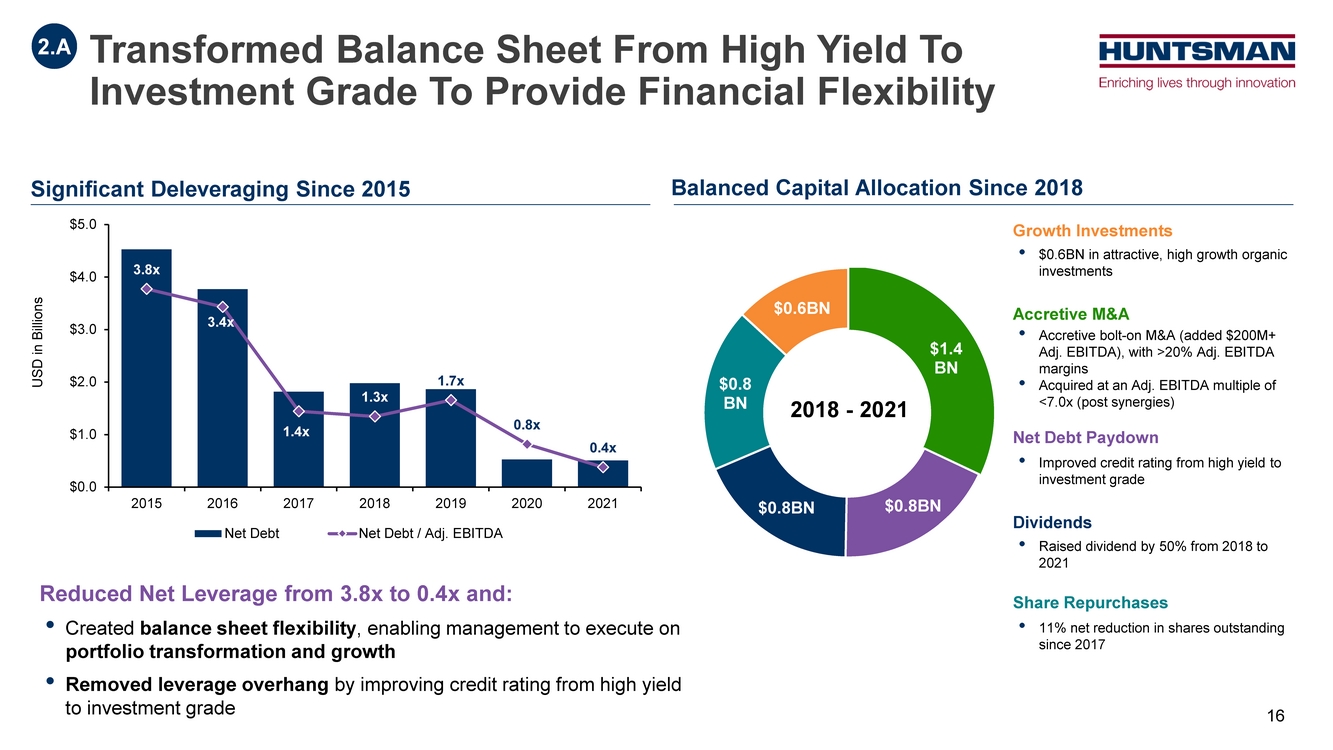
| Share Repurchases • 11% net reduction in shares outstanding since 2017 Growth Investments • $0.6BN in attractive, high growth organic investments Balanced Capital Allocation Since 2018 Significant Deleveraging Since 2015 $1.4 BN $0.8BN $0.8BN $0.8 BN $0.6BN Accretive M&A • Accretive bolt-on M&A (added $200M+ Adj. EBITDA), with >20% Adj. EBITDA margins • Acquired at an Adj. EBITDA multiple of <7.0x (post synergies) Dividends • Raised dividend by 50% from 2018 to 2021 Net Debt Paydown • Improved credit rating from high yield to investment grade Reduced Net Leverage from 3.8x to 0.4x and: • Created balance sheet flexibility, enabling management to execute on portfolio transformation and growth • Removed leverage overhang by improving credit rating from high yield to investment grade 3.8x 3.4x 1.4x 1.3x 1.7x 0.8x 0.4x 0.0x 1.0x 2.0x 3.0x 4.0x 5.0x $0.0 $1.0 $2.0 $3.0 $4.0 $5.0 2015 2016 2017 2018 2019 2020 2021 Net Debt Net Debt / Adj. EBITDA USD in Billions 2018 - 2021 Transformed Balance Sheet From High Yield To Investment Grade To Provide Financial Flexibility 2.A 16 |
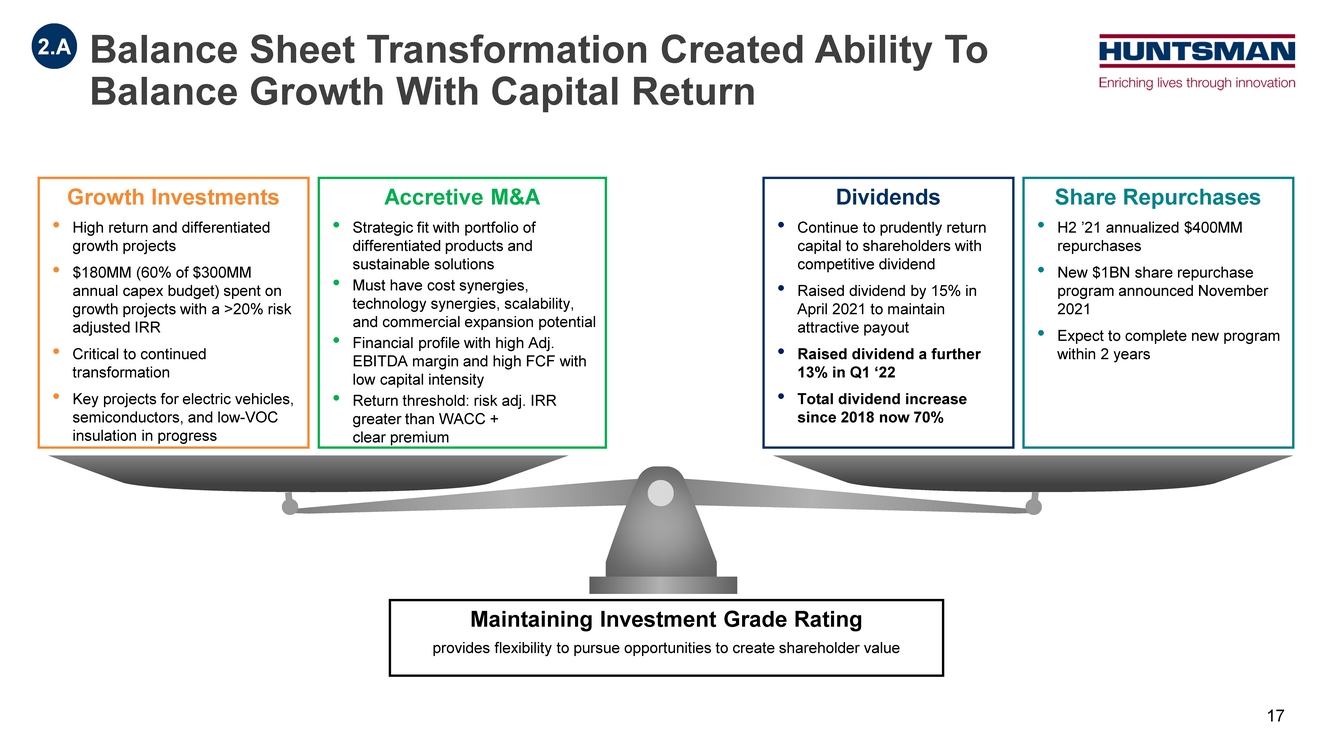
| Dividends • Continue to prudently return capital to shareholders with competitive dividend • Raised dividend by 15% in April 2021 to maintain attractive payout • Raised dividend a further 13% in Q1 ‘22 • Total dividend increase since 2018 now 70% Accretive M&A • Strategic fit with portfolio of differentiated products and sustainable solutions • Must have cost synergies, technology synergies, scalability, and commercial expansion potential • Financial profile with high Adj. EBITDA margin and high FCF with low capital intensity • Return threshold: risk adj. IRR greater than WACC + clear premium Growth Investments • High return and differentiated growth projects • $180MM (60% of $300MM annual capex budget) spent on growth projects with a >20% risk adjusted IRR • Critical to continued transformation • Key projects for electric vehicles, semiconductors, and low-VOC insulation in progress Share Repurchases • H2 ’21 annualized $400MM repurchases • New $1BN share repurchase program announced November 2021 • Expect to complete new program within 2 years Maintaining Investment Grade Rating provides flexibility to pursue opportunities to create shareholder value Balance Sheet Transformation Created Ability To Balance Growth With Capital Return 2.A 17 |
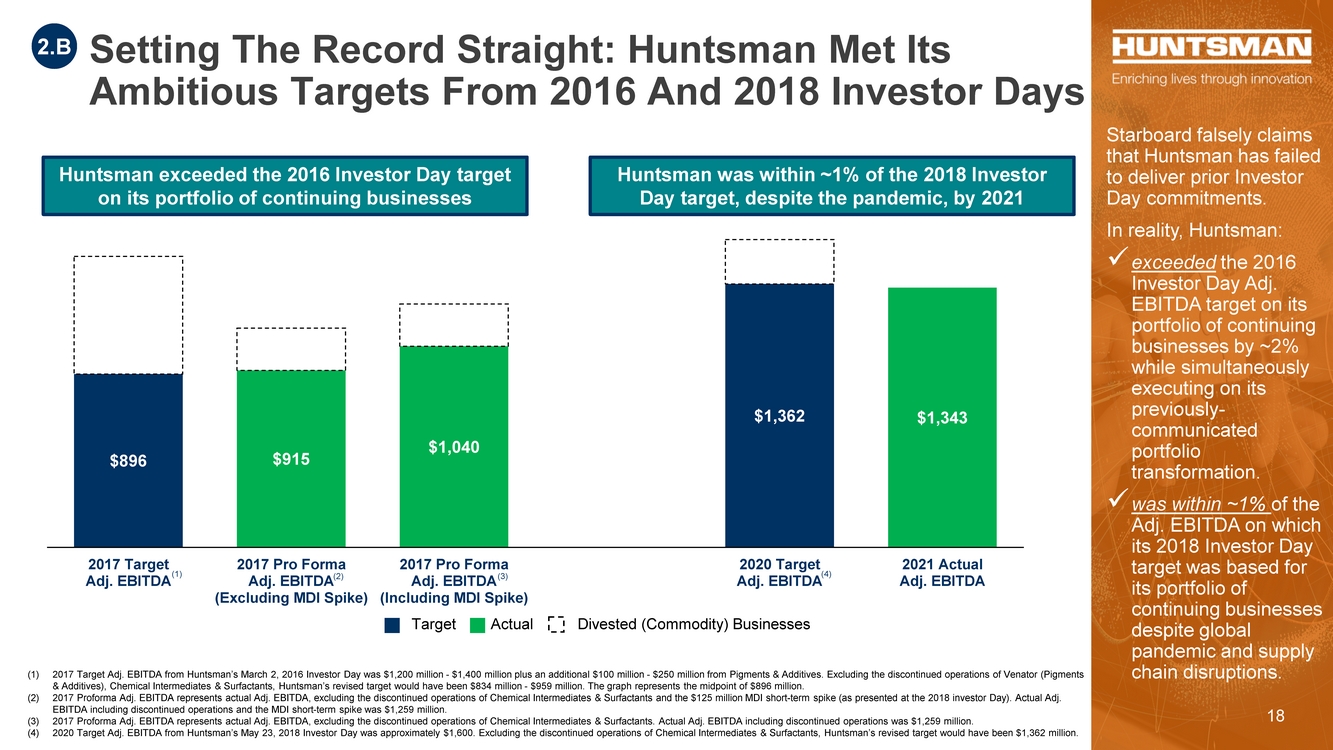
| $896 $915 $1,040 $1,362 $1,343 $0 $200 $400 $600 $800 $1, 000 $1, 200 $1, 400 $1, 600 $1, 800 2017 Target Adj. EBITDA 2017 Pro Forma Adj. EBITDA (Excluding MDI Spike) 2017 Pro Forma Adj. EBITDA (Including MDI Spike) 2020 Target Adj. EBITDA 2021 Actual Adj. EBITDA Target Setting The Record Straight: Huntsman Met Its Ambitious Targets From 2016 And 2018 Investor Days Huntsman exceeded the 2016 Investor Day target on its portfolio of continuing businesses Huntsman was within ~1% of the 2018 Investor Day target, despite the pandemic, by 2021 (1) 2017 Target Adj. EBITDA from Huntsman’s March 2, 2016 Investor Day was $1,200 million - $1,400 million plus an additional $100 million - $250 million from Pigments & Additives. Excluding the discontinued operations of Venator (Pigments & Additives), Chemical Intermediates & Surfactants, Huntsman’s revised target would have been $834 million - $959 million. The graph represents the midpoint of $896 million. (2) 2017 Proforma Adj. EBITDA represents actual Adj. EBITDA, excluding the discontinued operations of Chemical Intermediates & Surfactants and the $125 million MDI short-term spike (as presented at the 2018 investor Day). Actual Adj. EBITDA including discontinued operations and the MDI short-term spike was $1,259 million. (3) 2017 Proforma Adj. EBITDA represents actual Adj. EBITDA, excluding the discontinued operations of Chemical Intermediates & Surfactants. Actual Adj. EBITDA including discontinued operations was $1,259 million. (4) 2020 Target Adj. EBITDA from Huntsman’s May 23, 2018 Investor Day was approximately $1,600. Excluding the discontinued operations of Chemical Intermediates & Surfactants, Huntsman’s revised target would have been $1,362 million. Starboard falsely claims that Huntsman has failed to deliver prior Investor Day commitments. In reality, Huntsman: exceeded the 2016 Investor Day Adj. EBITDA target on its portfolio of continuing businesses by ~2% while simultaneously executing on its previously- communicated portfolio transformation. was within ~1% of the Adj. EBITDA on which its 2018 Investor Day target was based for its portfolio of continuing businesses despite global pandemic and supply chain disruptions. Divested (Commodity) Businesses Actual 2.B (1) (4) (2) (3) 18 |
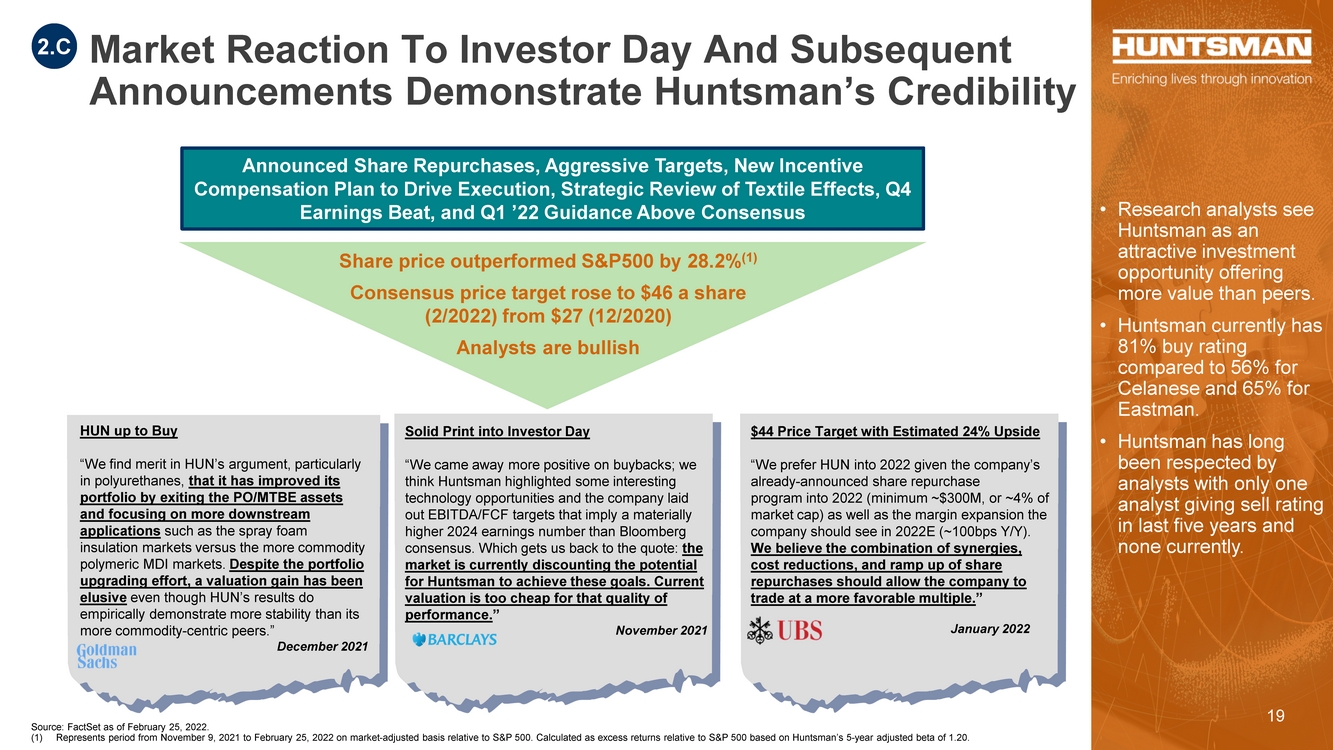
| Announced Share Repurchases, Aggressive Targets, New Incentive Compensation Plan to Drive Execution, Strategic Review of Textile Effects, Q4 Earnings Beat, and Q1 ’22 Guidance Above Consensus Source: FactSet as of February 25, 2022. (1) Represents period from November 9, 2021 to February 25, 2022 on market-adjusted basis relative to S&P 500. Calculated as excess returns relative to S&P 500 based on Huntsman’s 5-year adjusted beta of 1.20. Share price outperformed S&P500 by 28.2%(1) Consensus price target rose to $46 a share (2/2022) from $27 (12/2020) Analysts are bullish Solid Print into Investor Day “We came away more positive on buybacks; we think Huntsman highlighted some interesting technology opportunities and the company laid out EBITDA/FCF targets that imply a materially higher 2024 earnings number than Bloomberg consensus. Which gets us back to the quote: the market is currently discounting the potential for Huntsman to achieve these goals. Current valuation is too cheap for that quality of performance.” November 2021 • Research analysts see Huntsman as an attractive investment opportunity offering more value than peers. • Huntsman currently has 81% buy rating compared to 56% for Celanese and 65% for Eastman. • Huntsman has long been respected by analysts with only one analyst giving sell rating in last five years and none currently. $44 Price Target with Estimated 24% Upside “We prefer HUN into 2022 given the company’s already-announced share repurchase program into 2022 (minimum ~$300M, or ~4% of market cap) as well as the margin expansion the company should see in 2022E (~100bps Y/Y). We believe the combination of synergies, cost reductions, and ramp up of share repurchases should allow the company to trade at a more favorable multiple.” January 2022 Market Reaction To Investor Day And Subsequent Announcements Demonstrate Huntsman’s Credibility 2.C HUN up to Buy “We find merit in HUN’s argument, particularly in polyurethanes, that it has improved its portfolio by exiting the PO/MTBE assets and focusing on more downstream applications such as the spray foam insulation markets versus the more commodity polymeric MDI markets. Despite the portfolio upgrading effort, a valuation gain has been elusive even though HUN’s results do empirically demonstrate more stability than its more commodity-centric peers.” December 2021 19 |
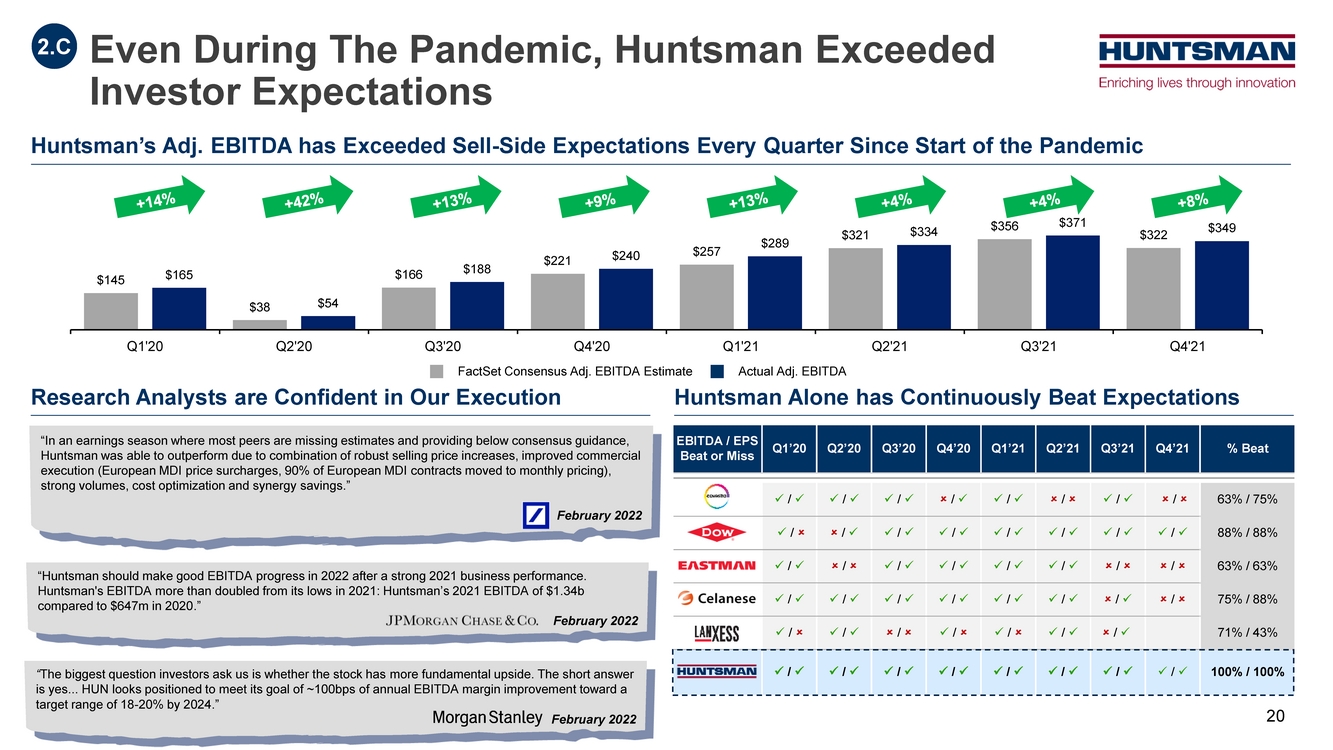
| “In an earnings season where most peers are missing estimates and providing below consensus guidance, Huntsman was able to outperform due to combination of robust selling price increases, improved commercial execution (European MDI price surcharges, 90% of European MDI contracts moved to monthly pricing), strong volumes, cost optimization and synergy savings.” February 2022 EBITDA / EPS Beat or Miss Q1’20 Q2’20 Q3’20 Q4’20 Q1’21 Q2’21 Q3’21 Q4’21 % Beat Covestro / / / / / / / / 75% / 75% Dow / / / / / / / / 88% / 88% Eastman / / / / / / / / 63% / 63% Celanese / / / / / / / / 75% / 88% Lanxess / / / / / / / 71% / 43% / / / / / / / / 100% / 100% Even During The Pandemic, Huntsman Exceeded Investor Expectations Huntsman’s Adj. EBITDA has Exceeded Sell-Side Expectations Every Quarter Since Start of the Pandemic $145 $38 $166 $221 $257 $321 $356 $322 $165 $54 $188 $240 $289 $334 $371 $349 Q1'20 Q2'20 Q3'20 Q4'20 Q1'21 Q2'21 Q3'21 Q4'21 Research Analysts are Confident in Our Execution Huntsman Alone has Continuously Beat Expectations “Huntsman should make good EBITDA progress in 2022 after a strong 2021 business performance. Huntsman's EBITDA more than doubled from its lows in 2021: Huntsman’s 2021 EBITDA of $1.34b compared to $647m in 2020.” February 2022 FactSet Consensus Adj. EBITDA Estimate Actual Adj. EBITDA 2.C “The biggest question investors ask us is whether the stock has more fundamental upside. The short answer is yes... HUN looks positioned to meet its goal of ~100bps of annual EBITDA margin improvement toward a target range of 18-20% by 2024.” February 2022 20 |
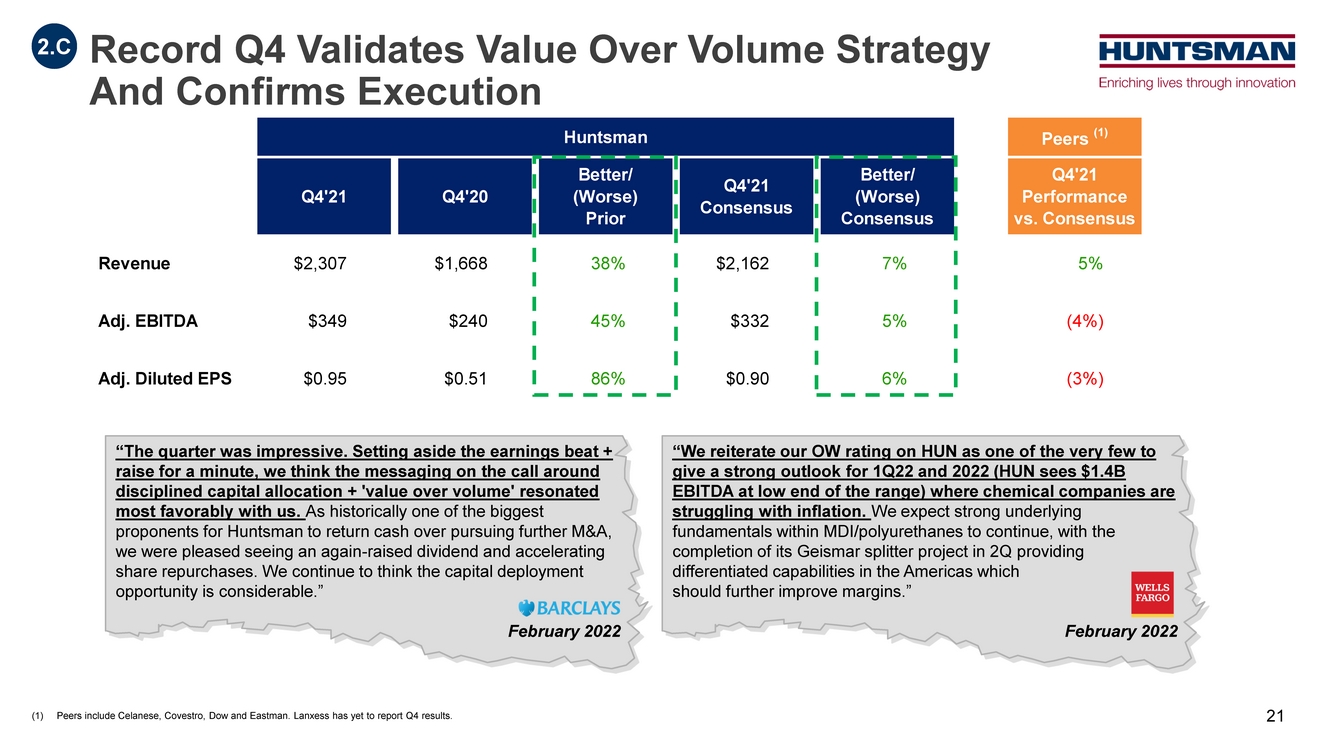
| Record Q4 Validates Value Over Volume Strategy And Confirms Execution 2.C “The quarter was impressive. Setting aside the earnings beat + raise for a minute, we think the messaging on the call around disciplined capital allocation + 'value over volume' resonated most favorably with us. As historically one of the biggest proponents for Huntsman to return cash over pursuing further M&A, we were pleased seeing an again-raised dividend and accelerating share repurchases. We continue to think the capital deployment opportunity is considerable.” February 2022 “We reiterate our OW rating on HUN as one of the very few to give a strong outlook for 1Q22 and 2022 (HUN sees $1.4B EBITDA at low end of the range) where chemical companies are struggling with inflation. We expect strong underlying fundamentals within MDI/polyurethanes to continue, with the completion of its Geismar splitter project in 2Q providing differentiated capabilities in the Americas which should further improve margins.” February 2022 (1) Peers include Celanese, Covestro, Dow and Eastman. Lanxess has yet to report Q4 results. Huntsman Peers (1) Revenue $2,307 $1,668 38% $2,162 7% 4% Adj. EBITDA $349 $240 45% $332 5% (1%) Adj. Diluted EPS $0.95 $0.51 86% $0.90 6% (0%) Q4'21 Performance vs. Consensus Better/ (Worse) Consensus Q4'21 Q4'20 Better/ (Worse) Prior Q4'21 Consensus 21 |
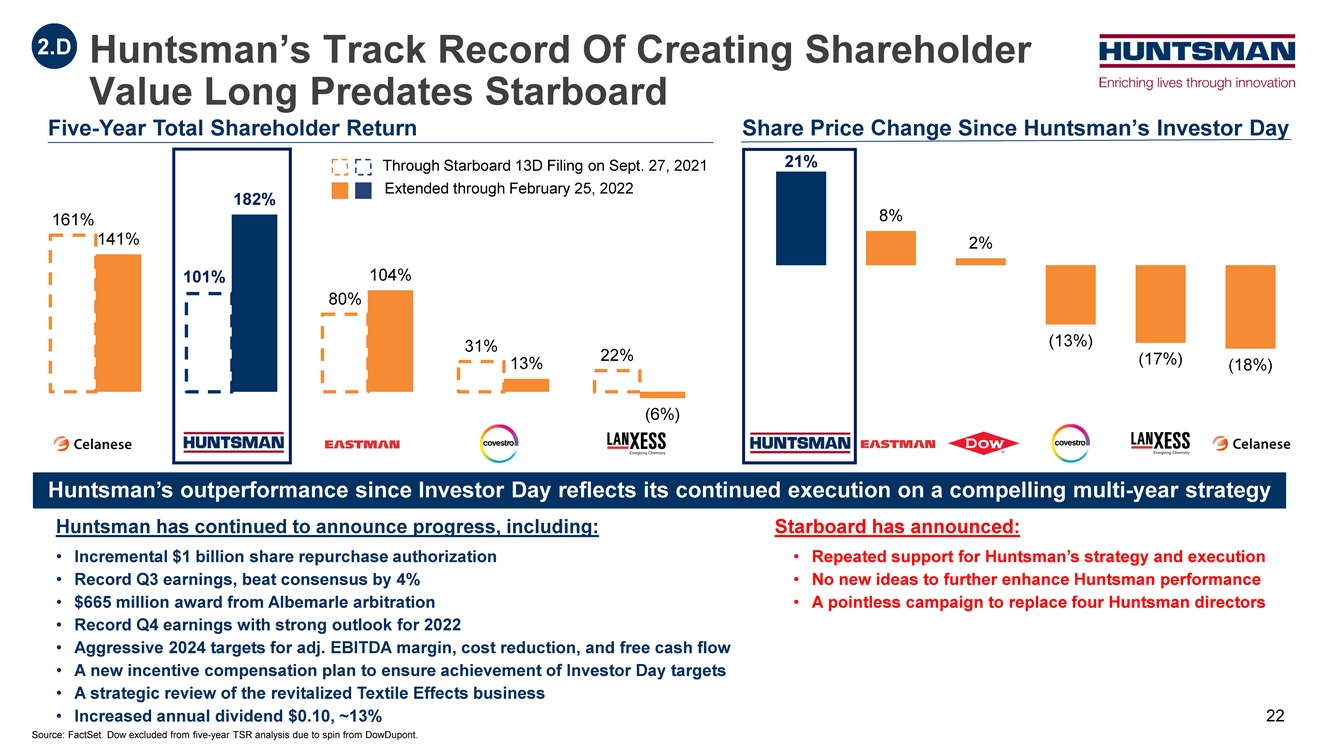
| 161% 141% 101% 182% 80% 104% 31% 13% 22% (6%) Huntsman’s Track Record Of Creating Shareholder Value Long Predates Starboard 2.D Five-Year Total Shareholder Return Huntsman has continued to announce progress, including: • Incremental $1 billion share repurchase authorization • Record Q3 earnings, beat consensus by 4% • $665 million award from Albemarle arbitration • Record Q4 earnings with strong outlook for 2022 • Aggressive 2024 targets for adj. EBITDA margin, cost reduction, and free cash flow • A new incentive compensation plan to ensure achievement of Investor Day targets • A strategic review of the revitalized Textile Effects business • Increased annual dividend $0.10, ~13% Starboard has announced: • Repeated support for Huntsman’s strategy and execution • No new ideas to further enhance Huntsman performance • A pointless campaign to replace four Huntsman directors Source: FactSet. Dow excluded from five-year TSR analysis due to spin from DowDupont. Share Price Change Since Huntsman’s Investor Day 21% 8% 2% (13%) (17%) (18%) Huntsman Eastman Dow Covestro Lanxess Celanese Through Starboard 13D Filing on Sept. 27, 2021 Extended through February 25, 2022 Huntsman’s outperformance since Investor Day reflects its continued execution on a compelling multi-year strategy 22 |
| $204 $288 $367 Q1 2019 (Pre-Covid) Q1 2021 Q1 2022E Consensus Adjusted EBITDA ($MM) Adjusted EBITDA Margin (%) Financial Results Demonstrate Compelling Execution 12% 16% 17% Q1 2019 (Pre-Covid) Q1 2021 Q1 2022E Consensus 2.D 23 |

| Refreshed and Fit-for-Purpose Board Overseeing Differentiated and Downstream Focus and Driving Further Transformation 3 |
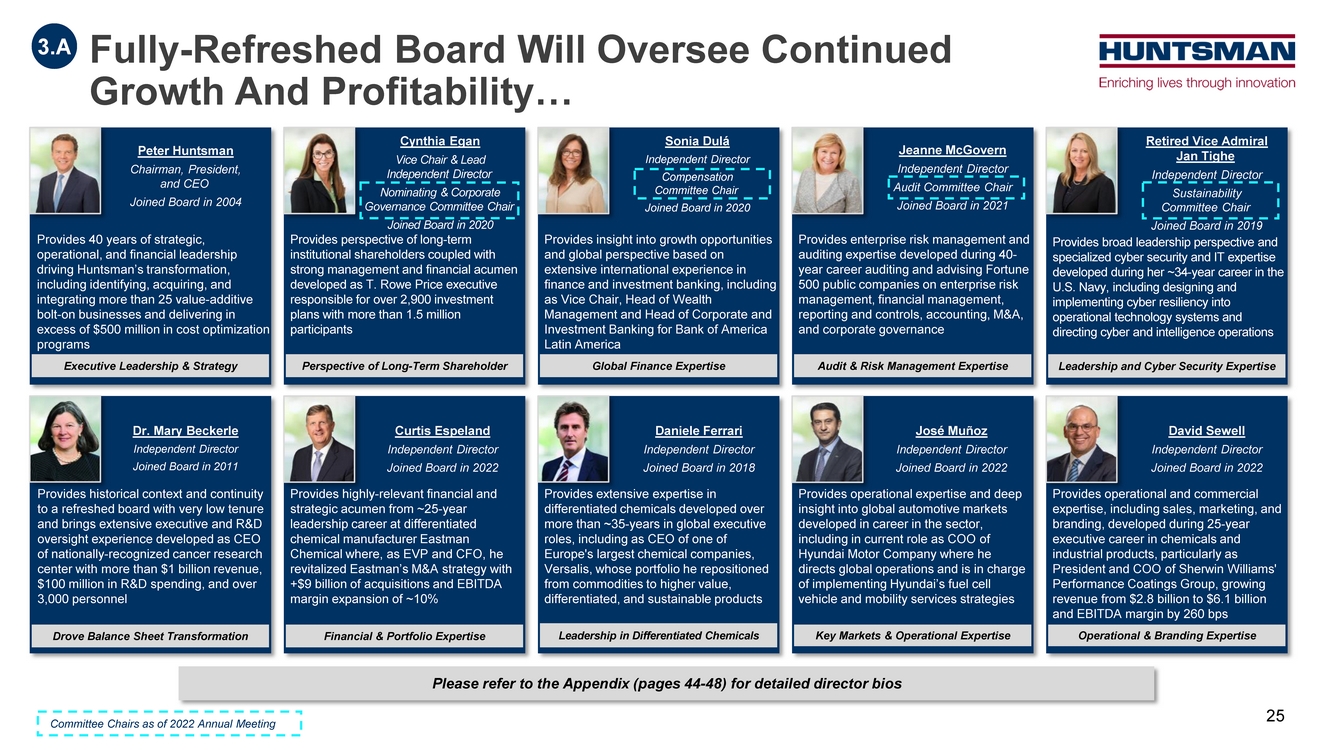
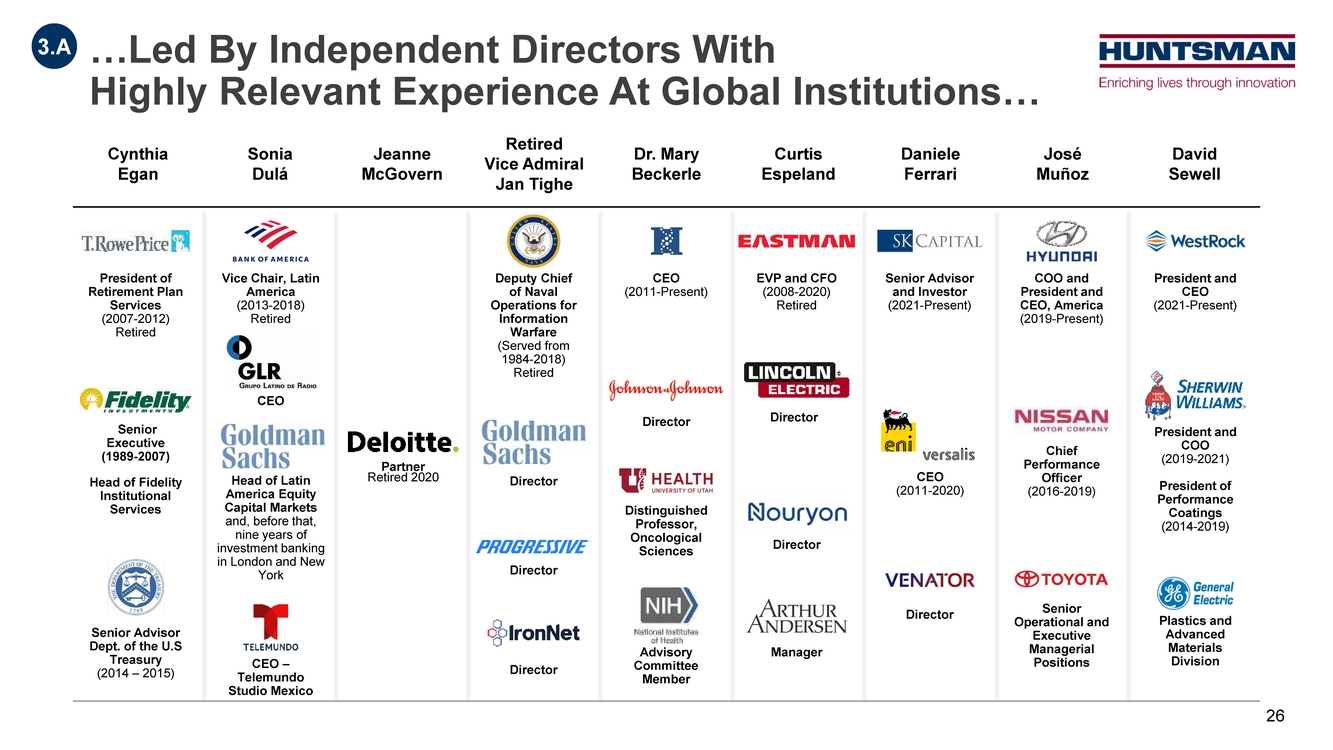
| Fully-Refreshed Board Will Oversee Continued Growth And Profitability… Peter Huntsman Chairman, President, and CEO Joined Board in 2004 Provides 40 years of strategic, operational, and financial leadership driving Huntsman’s transformation, including identifying, acquiring, and integrating more than 25 value-additive bolt-on businesses and delivering in excess of $500 million in cost optimization programs Dr. Mary Beckerle Independent Director Joined Board in 2011 Provides historical context and continuity to a refreshed board with very low tenure and brings extensive executive and R&D oversight experience developed as CEO of nationally-recognized cancer research center with more than $1 billion revenue, $100 million in R&D spending, and over 3,000 personnel Executive Leadership & Strategy Drove Balance Sheet Transformation Cynthia Egan Vice Chair & Lead Independent Director Nominating & Corporate Governance Committee Chair Joined Board in 2020 Provides perspective of long-term institutional shareholders coupled with strong management and financial acumen developed as T. Rowe Price executive responsible for over 2,900 investment plans with more than 1.5 million participants Curtis Espeland Independent Director Joined Board in 2022 Provides highly-relevant financial and strategic acumen from ~25-year leadership career at differentiated chemical manufacturer Eastman Chemical where, as EVP and CFO, he revitalized Eastman’s M&A strategy with +$9 billion of acquisitions and EBITDA margin expansion of ~10% Perspective of Long-Term Shareholder Financial & Portfolio Expertise Sonia Dulá Independent Director Compensation Committee Chair Joined Board in 2020 Provides insight into growth opportunities and global perspective based on extensive international experience in finance and investment banking, including as Vice Chair, Head of Wealth Management and Head of Corporate and Investment Banking for Bank of America Latin America Daniele Ferrari Independent Director Joined Board in 2018 Provides extensive expertise in differentiated chemicals developed over more than ~35-years in global executive roles, including as CEO of one of Europe's largest chemical companies, Versalis, whose portfolio he repositioned from commodities to higher value, differentiated, and sustainable products Global Finance Expertise Leadership in Differentiated Chemicals Provides enterprise risk management and auditing expertise developed during 40- year career auditing and advising Fortune 500 public companies on enterprise risk management, financial management, reporting and controls, accounting, M&A, and corporate governance José Muñoz Independent Director Joined Board in 2022 Provides operational expertise and deep insight into global automotive markets developed in career in the sector, including in current role as COO of Hyundai Motor Company where he directs global operations and is in charge of implementing Hyundai’s fuel cell vehicle and mobility services strategies Jeanne McGovern Independent Director Audit Committee Chair Joined Board in 2021 Audit & Risk Management Expertise Key Markets & Operational Expertise Retired Vice Admiral Jan Tighe Independent Director Sustainability Committee Chair Joined Board in 2019 Provides broad leadership perspective and specialized cyber security and IT expertise developed during her ~34-year career in the U.S. Navy, including designing and implementing cyber resiliency into operational technology systems and directing cyber and intelligence operations Provides operational and commercial expertise, including sales, marketing, and branding, developed during 25-year executive career in chemicals and industrial products, particularly as President and COO of Sherwin Williams' Performance Coatings Group, growing revenue from $2.8 billion to $6.1 billion and EBITDA margin by 260 bps David Sewell Independent Director Joined Board in 2022 Leadership and Cyber Security Expertise Operational & Branding Expertise Please refer to the Appendix (pages 44-48) for detailed director bios 3.A Committee Chairs as of 2022 Annual Meeting 25 |
| Cynthia Egan Sonia Dulá Jeanne McGovern Retired Vice Admiral Jan Tighe Dr. Mary Beckerle Curtis Espeland Daniele Ferrari José Muñoz David Sewell President of Retirement Plan Services (2007-2012) Retired Director EVP and CFO (2008-2020) Retired Manager CEO (2011-2020) COO and President and CEO, America (2019-Present) President and CEO (2021-Present) Plastics and Advanced Materials Division Vice Chair, Latin America (2013-2018) Retired CEO – Telemundo Studio Mexico Deputy Chief of Naval Operations for Information Warfare (Served from 1984-2018) Retired Director Director CEO (2011-Present) Advisory Committee Member Director Director Senior Advisor Dept. of the U.S Treasury (2014 – 2015) Senior Advisor and Investor (2021-Present) Distinguished Professor, Oncological Sciences …Led By Independent Directors With Highly Relevant Experience At Global Institutions… Partner Senior Operational and Executive Managerial Positions Senior Executive (1989-2007) Head of Fidelity Institutional Services Chief Performance Officer (2016-2019) President and COO (2019-2021) President of Performance Coatings (2014-2019) Director 3.A CEO Director Retired 2020 26 Head of Latin America Equity Capital Markets and, before that, nine years of investment banking in London and New York |
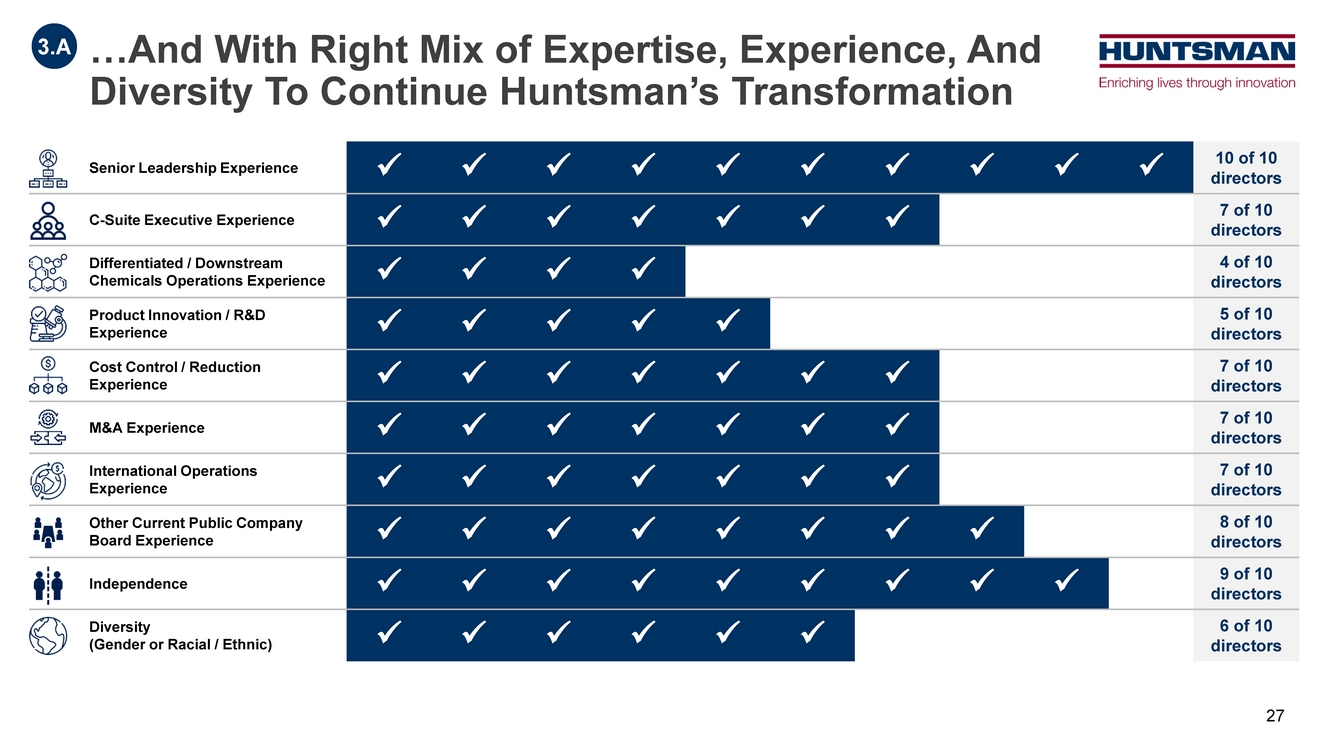
| Senior Leadership Experience 10 of 10 directors C-Suite Executive Experience 7 of 10 directors Differentiated / Downstream Chemicals Operations Experience 4 of 10 directors Product Innovation / R&D Experience 5 of 10 directors Cost Control / Reduction Experience 7 of 10 directors M&A Experience 7 of 10 directors International Operations Experience 7 of 10 directors Other Current Public Company Board Experience 8 of 10 directors Independence 9 of 10 directors Diversity (Gender or Racial / Ethnic) 6 of 10 directors …And With Right Mix of Expertise, Experience, And Diversity To Continue Huntsman’s Transformation 3.A 27 |
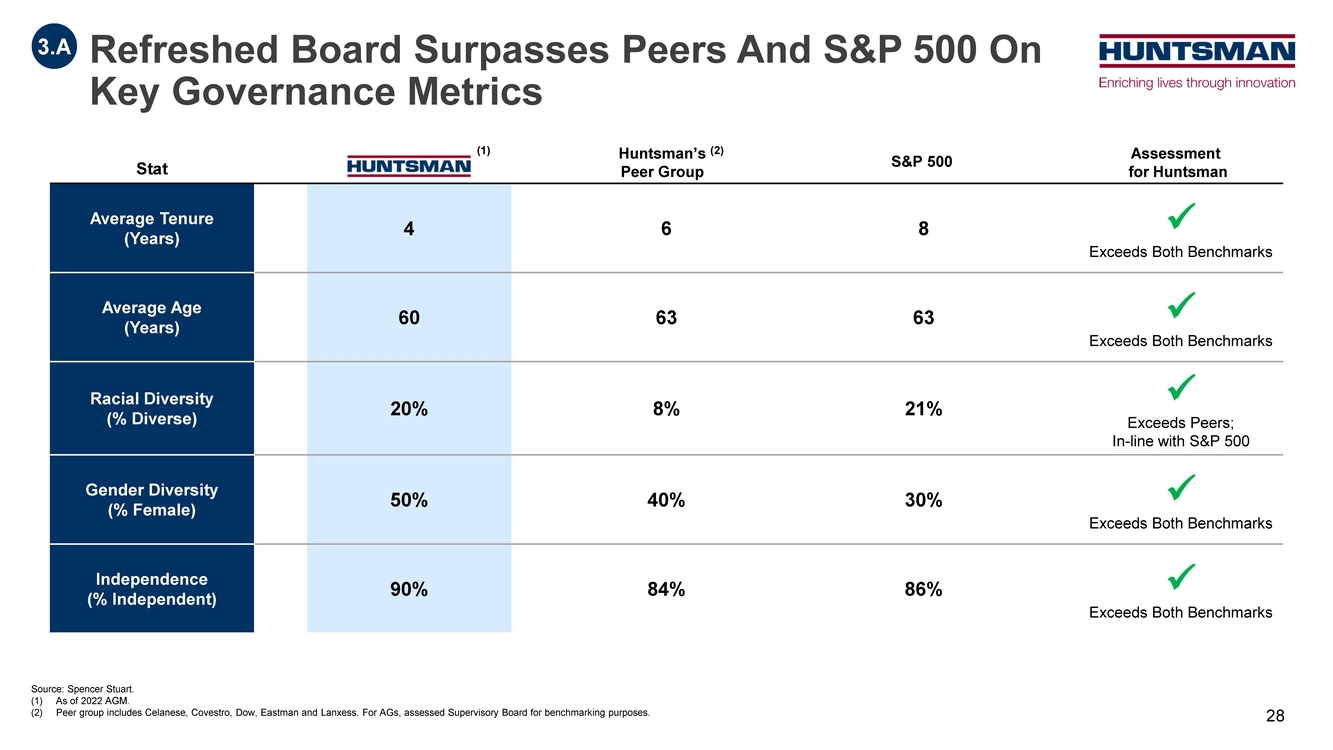
| Stat Average Tenure (Years) 4 6 8 Exceeds Both Benchmarks Average Age (Years) 60 63 63 Exceeds Both Benchmarks Racial Diversity (% Diverse) 20% 8% 21% Exceeds Peers; In-line with S&P 500 Gender Diversity (% Female) 50% 40% 30% Exceeds Both Benchmarks Independence (% Independent) 90% 84% 86% Exceeds Both Benchmarks (1) Huntsman’s Peer Group Assessment for Huntsman (2) S&P 500 Source: Spencer Stuart. (1) As of 2022 AGM. (2) Peer group includes Celanese, Covestro, Dow, Eastman and Lanxess. For AGs, assessed Supervisory Board for benchmarking purposes. Refreshed Board Surpasses Peers And S&P 500 On Key Governance Metrics 3.A 28 |
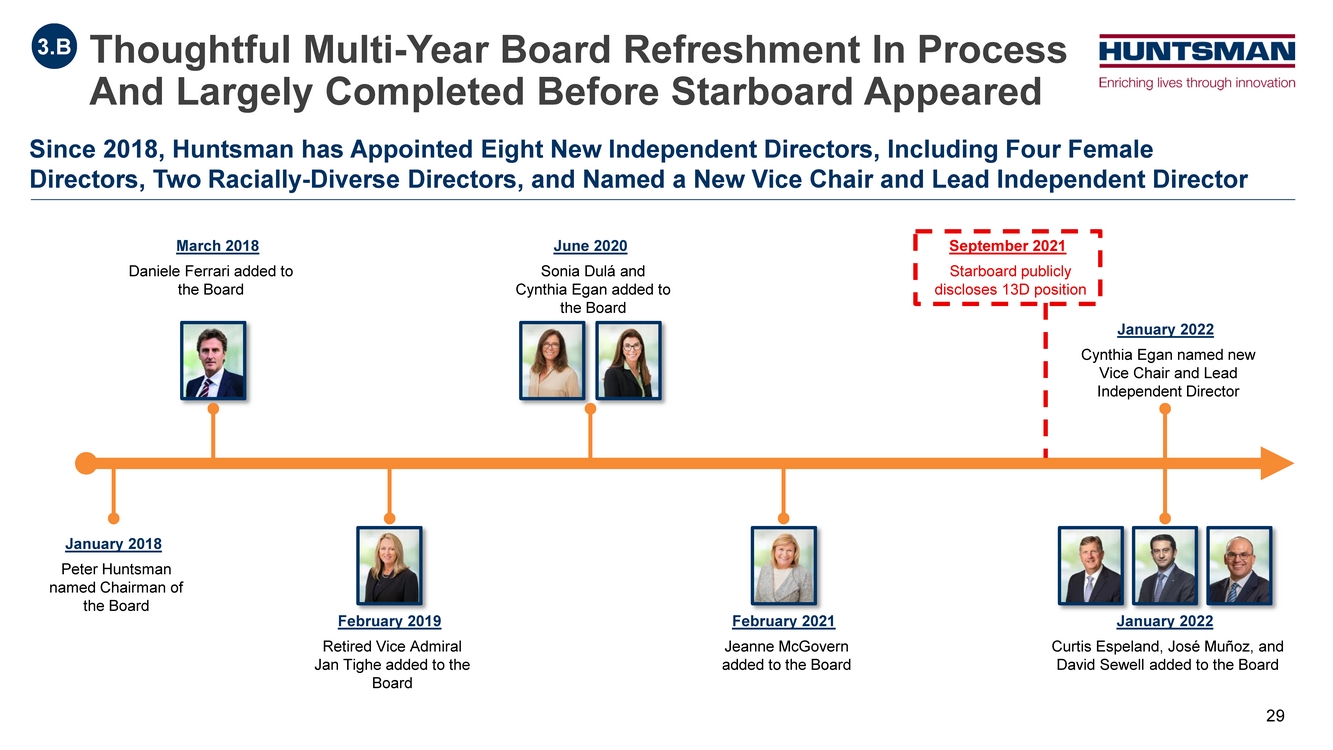
| January 2018 Peter Huntsman named Chairman of the Board Since 2018, Huntsman has Appointed Eight New Independent Directors, Including Four Female Directors, Two Racially-Diverse Directors, and Named a New Vice Chair and Lead Independent Director January 2022 Curtis Espeland, José Muñoz, and David Sewell added to the Board Thoughtful Multi-Year Board Refreshment In Process And Largely Completed Before Starboard Appeared 3.B January 2022 Cynthia Egan named new Vice Chair and Lead Independent Director September 2021 Starboard publicly discloses 13D position March 2018 Daniele Ferrari added to the Board June 2020 Sonia Dulá and Cynthia Egan added to the Board February 2021 Jeanne McGovern added to the Board February 2019 Retired Vice Admiral Jan Tighe added to the Board 29 |
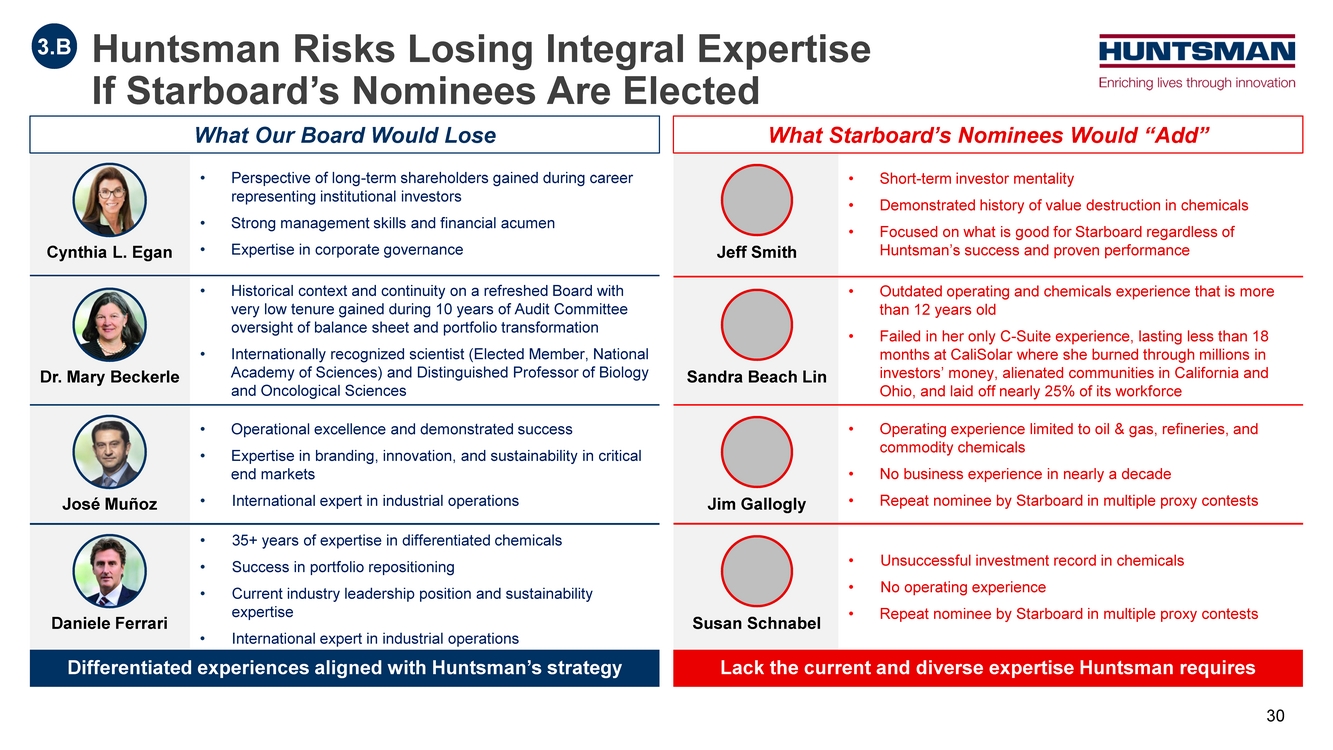
| Huntsman Risks Losing Integral Expertise If Starboard’s Nominees Are Elected • Perspective of long-term shareholders gained during career representing institutional investors • Strong management skills and financial acumen • Expertise in corporate governance • Historical context and continuity on a refreshed Board with very low tenure gained during 10 years of Audit Committee oversight of balance sheet and portfolio transformation • Internationally recognized scientist (Elected Member, National Academy of Sciences) and Distinguished Professor of Biology and Oncological Sciences • Operational excellence and demonstrated success • Expertise in branding, innovation, and sustainability in critical end markets • International expert in industrial operations • 35+ years of expertise in differentiated chemicals • Success in portfolio repositioning • Current industry leadership position and sustainability expertise • International expert in industrial operations • Short-term investor mentality • Demonstrated history of value destruction in chemicals • Focused on what is good for Starboard regardless of Huntsman’s success and proven performance • Outdated operating and chemicals experience that is more than 12 years old • Failed in her only C-Suite experience, lasting less than 18 months at CaliSolar where she burned through millions in investors’ money, alienated communities in California and Ohio, and laid off nearly 25% of its workforce • Operating experience limited to oil & gas, refineries, and commodity chemicals • No business experience in nearly a decade • Repeat nominee by Starboard in multiple proxy contests • Unsuccessful investment record in chemicals • No operating experience • Repeat nominee by Starboard in multiple proxy contests What Our Board Would Lose What Starboard’s Nominees Would “Add” Differentiated experiences aligned with Huntsman’s strategy Lack the current and diverse expertise Huntsman requires 3.B Cynthia L. Egan Dr. Mary Beckerle José Muñoz Daniele Ferrari Jeff Smith Sandra Beach Lin Jim Gallogly Susan Schnabel 30 |
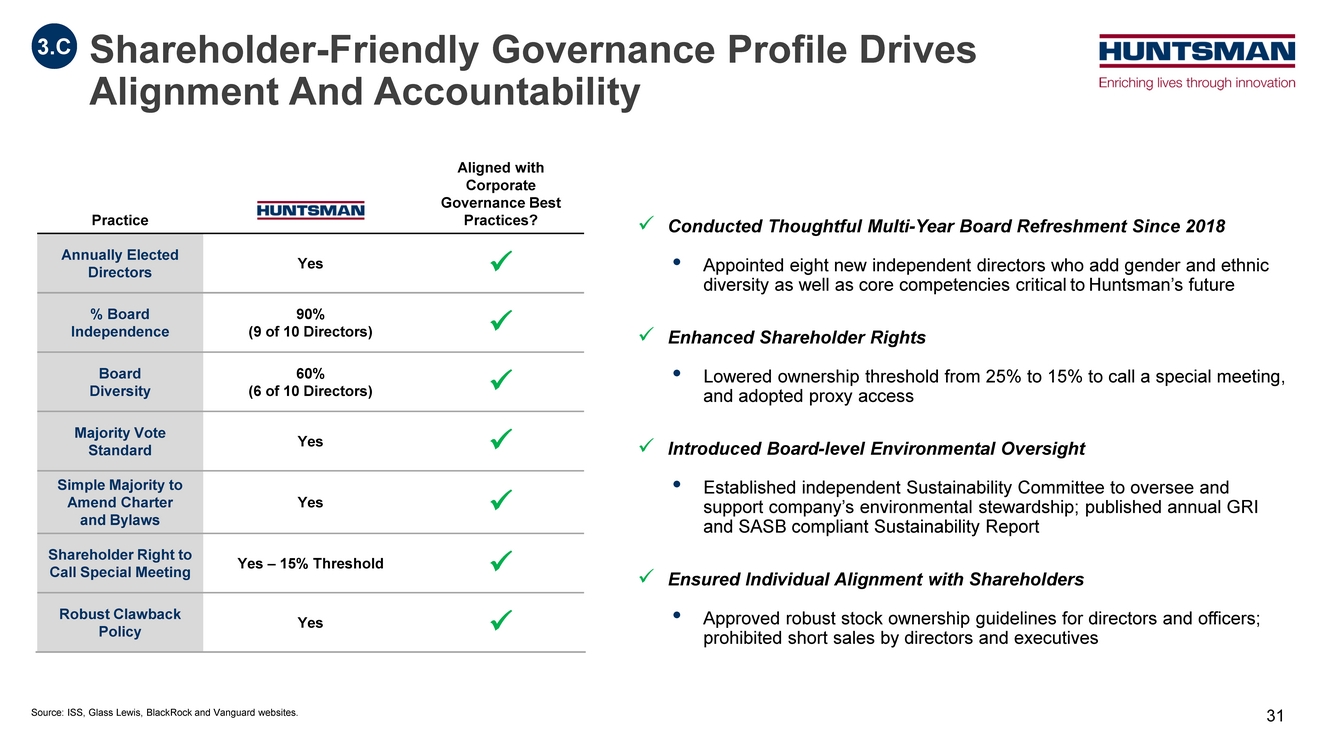
| Practice Aligned with Corporate Governance Best Practices? Annually Elected Directors Yes % Board Independence 90% (9 of 10 Directors) Board Diversity 60% (6 of 10 Directors) Majority Vote Standard Yes Simple Majority to Amend Charter and Bylaws Yes Shareholder Right to Call Special Meeting Yes – 15% Threshold Robust Clawback Policy Yes Conducted Thoughtful Multi-Year Board Refreshment Since 2018 • Appointed eight new independent directors who add gender and ethnic diversity as well as core competencies critical to Huntsman’s future Enhanced Shareholder Rights • Lowered ownership threshold from 25% to 15% to call a special meeting, and adopted proxy access Introduced Board-level Environmental Oversight • Established independent Sustainability Committee to oversee and support company’s environmental stewardship; published annual GRI and SASB compliant Sustainability Report Ensured Individual Alignment with Shareholders • Approved robust stock ownership guidelines for directors and officers; prohibited short sales by directors and executives Source: ISS, Glass Lewis, BlackRock and Vanguard websites. Shareholder-Friendly Governance Profile Drives Alignment And Accountability 3.C 31 |
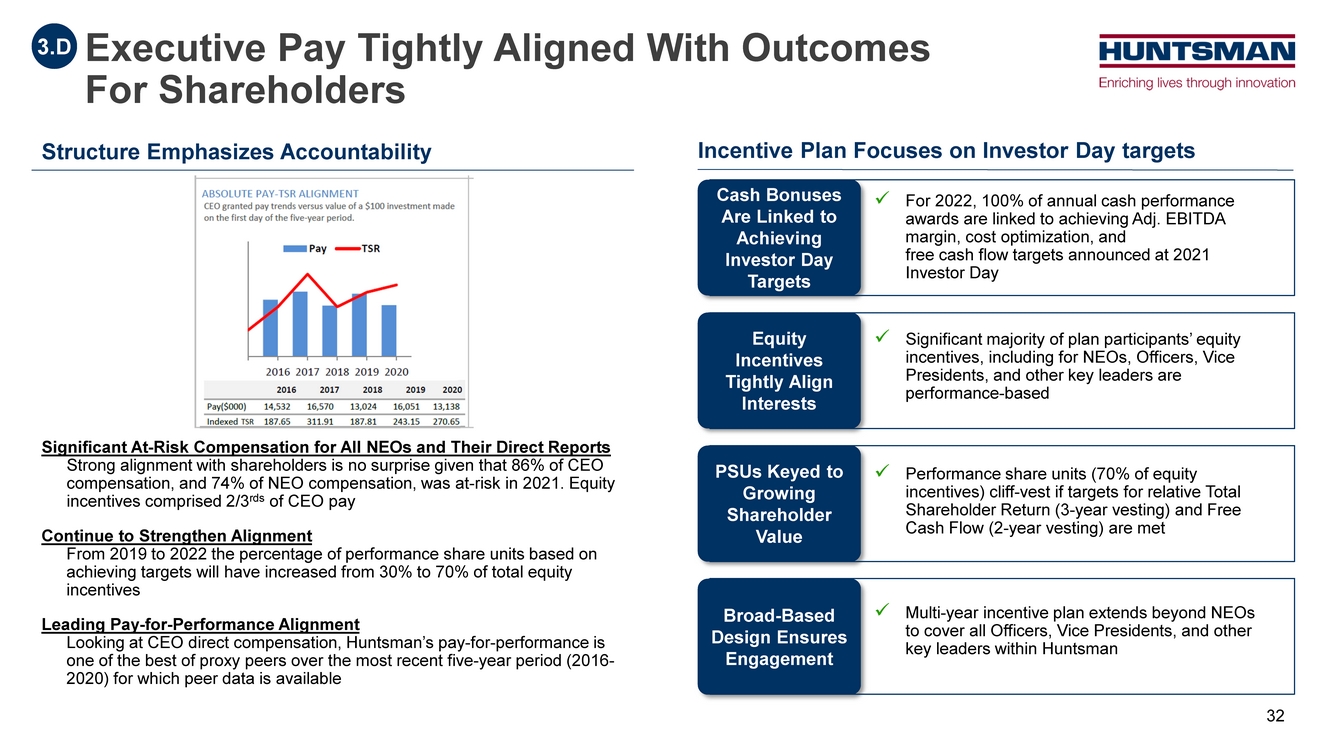
| Executive Pay Tightly Aligned With Outcomes For Shareholders Significant At-Risk Compensation for All NEOs and Their Direct Reports Strong alignment with shareholders is no surprise given that 86% of CEO compensation, and 74% of NEO compensation, was at-risk in 2021. Equity incentives comprised 2/3rds of CEO pay Continue to Strengthen Alignment From 2019 to 2022 the percentage of performance share units based on achieving targets will have increased from 30% to 70% of total equity incentives Leading Pay-for-Performance Alignment Looking at CEO direct compensation, Huntsman’s pay-for-performance is one of the best of proxy peers over the most recent five-year period (2016- 2020) for which peer data is available Structure Emphasizes Accountability 3.D Incentive Plan Focuses on Investor Day targets Broad-Based Design Ensures Engagement Multi-year incentive plan extends beyond NEOs to cover all Officers, Vice Presidents, and other key leaders within Huntsman Cash Bonuses Are Linked to Achieving Investor Day Targets For 2022, 100% of annual cash performance awards are linked to achieving Adj. EBITDA margin, cost optimization, and free cash flow targets announced at 2021 Investor Day Equity Incentives Tightly Align Interests Significant majority of plan participants’ equity incentives, including for NEOs, Officers, Vice Presidents, and other key leaders are performance-based PSUs Keyed to Growing Shareholder Value Performance share units (70% of equity incentives) cliff-vest if targets for relative Total Shareholder Return (3-year vesting) and Free Cash Flow (2-year vesting) are met 32 |
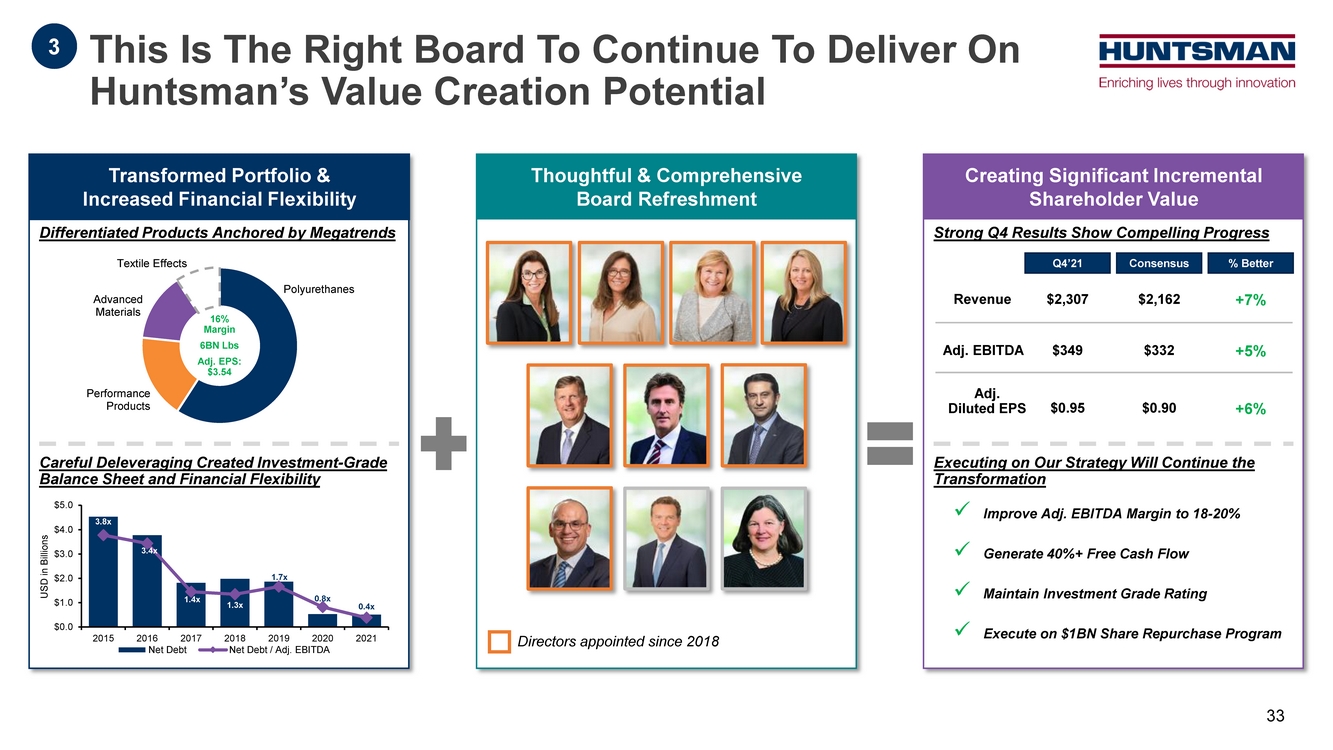
| 16% Margin 6BN Lbs Adj. EPS: $3.54 Transformed Portfolio & Increased Financial Flexibility Thoughtful & Comprehensive Board Refreshment Creating Significant Incremental Shareholder Value Directors appointed since 2018 This Is The Right Board To Continue To Deliver On Huntsman’s Value Creation Potential 3 Careful Deleveraging Created Investment-Grade Balance Sheet and Financial Flexibility Differentiated Products Anchored by Megatrends 3.8x 3.4x 1.4x 1.3x 1.7x 0.8x 0.4x 0.0x 1.0x 2.0x 3.0x 4.0x 5.0x $0.0 $1.0 $2.0 $3.0 $4.0 $5.0 2015 2016 2017 2018 2019 2020 2021 Net Debt Net Debt / Adj. EBITDA USD in Billions Polyurethanes Performance Products Advanced Materials Textile Effects Executing on Our Strategy Will Continue the Transformation Strong Q4 Results Show Compelling Progress Q4’21 Consensus % Better Revenue $2,307 $2,162 +7% Adj. EBITDA $349 $332 +5% Adj. Diluted EPS $0.95 $0.90 +6% Improve Adj. EBITDA Margin to 18-20% Generate 40%+ Free Cash Flow Maintain Investment Grade Rating Execute on $1BN Share Repurchase Program 33 |
| Starboard’s Campaign is Unnecessary, Unwise, and Risks Value Destruction 4 |
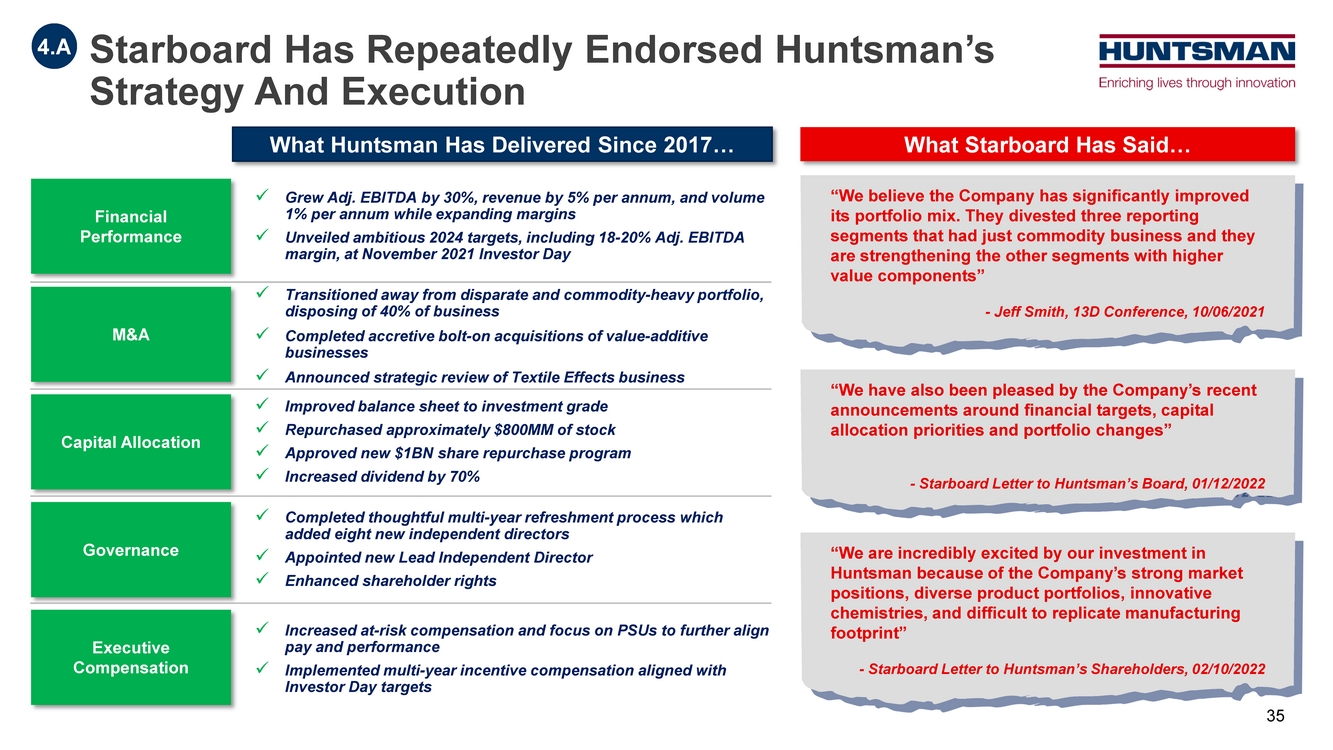
| Starboard Has Repeatedly Endorsed Huntsman’s Strategy And Execution 4.A “We believe the Company has significantly improved its portfolio mix. They divested three reporting segments that had just commodity business and they are strengthening the other segments with higher value components” - Jeff Smith, 13D Conference, 10/06/2021 “We have also been pleased by the Company’s recent announcements around financial targets, capital allocation priorities and portfolio changes” - Starboard Letter to Huntsman’s Board, 01/12/2022 “We are incredibly excited by our investment in Huntsman because of the Company’s strong market positions, diverse product portfolios, innovative chemistries, and difficult to replicate manufacturing footprint” - Starboard Letter to Huntsman’s Shareholders, 02/10/2022 Financial Performance M&A Capital Allocation Governance Grew Adj. EBITDA by 30%, revenue by 5% per annum, and volume 1% per annum while expanding margins Unveiled ambitious 2024 targets, including 18-20% Adj. EBITDA margin, at November 2021 Investor Day Transitioned away from disparate and commodity-heavy portfolio, disposing of 40% of business Completed accretive bolt-on acquisitions of value-additive businesses Announced strategic review of Textile Effects business Executive Compensation What Huntsman Has Delivered Since 2017… What Starboard Has Said… Improved balance sheet to investment grade Repurchased approximately $800MM of stock Approved new $1BN share repurchase program Increased dividend by 70% Completed thoughtful multi-year refreshment process which added eight new independent directors Appointed new Lead Independent Director Enhanced shareholder rights Increased at-risk compensation and focus on PSUs to further align pay and performance Implemented multi-year incentive compensation aligned with Investor Day targets 35 |
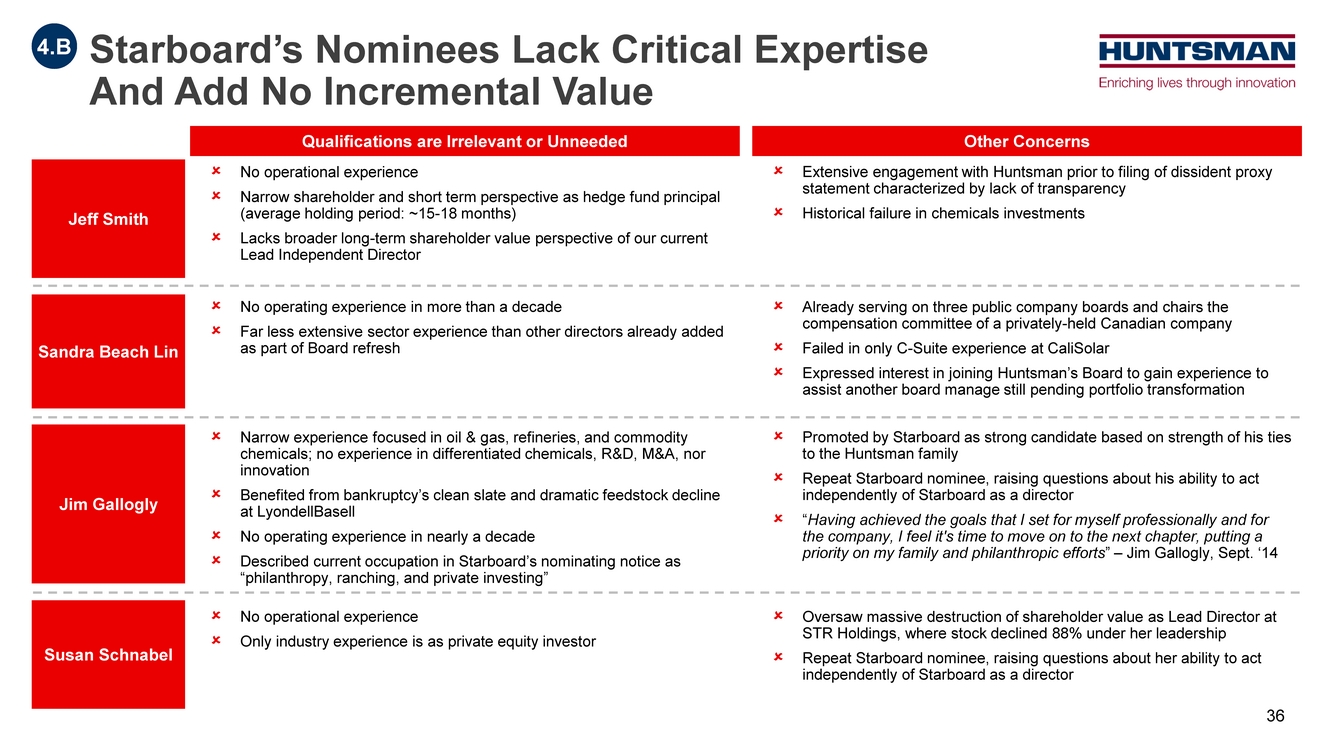
| Starboard’s Nominees Lack Critical Expertise And Add No Incremental Value No operational experience Narrow shareholder and short term perspective as hedge fund principal (average holding period: ~15-18 months) Lacks broader long-term shareholder value perspective of our current Lead Independent Director Extensive engagement with Huntsman prior to filing of dissident proxy statement characterized by lack of transparency Historical failure in chemicals investments Jeff Smith Qualifications are Irrelevant or Unneeded Other Concerns Sandra Beach Lin Jim Gallogly Narrow experience focused in oil & gas, refineries, and commodity chemicals; no experience in differentiated chemicals, R&D, M&A, nor innovation Benefited from bankruptcy’s clean slate and dramatic feedstock decline at LyondellBasell No operating experience in nearly a decade Described current occupation in Starboard’s nominating notice as “philanthropy, ranching, and private investing” Promoted by Starboard as strong candidate based on strength of his ties to the Huntsman family Repeat Starboard nominee, raising questions about his ability to act independently of Starboard as a director “Having achieved the goals that I set for myself professionally and for the company, I feel it's time to move on to the next chapter, putting a priority on my family and philanthropic efforts” – Jim Gallogly, Sept. ‘14 Susan Schnabel No operational experience Only industry experience is as private equity investor Oversaw massive destruction of shareholder value as Lead Director at STR Holdings, where stock declined 88% under her leadership Repeat Starboard nominee, raising questions about her ability to act independently of Starboard as a director 4.B No operating experience in more than a decade Far less extensive sector experience than other directors already added as part of Board refresh Already serving on three public company boards and chairs the compensation committee of a privately-held Canadian company Failed in only C-Suite experience at CaliSolar Expressed interest in joining Huntsman’s Board to gain experience to assist another board manage still pending portfolio transformation 36 |
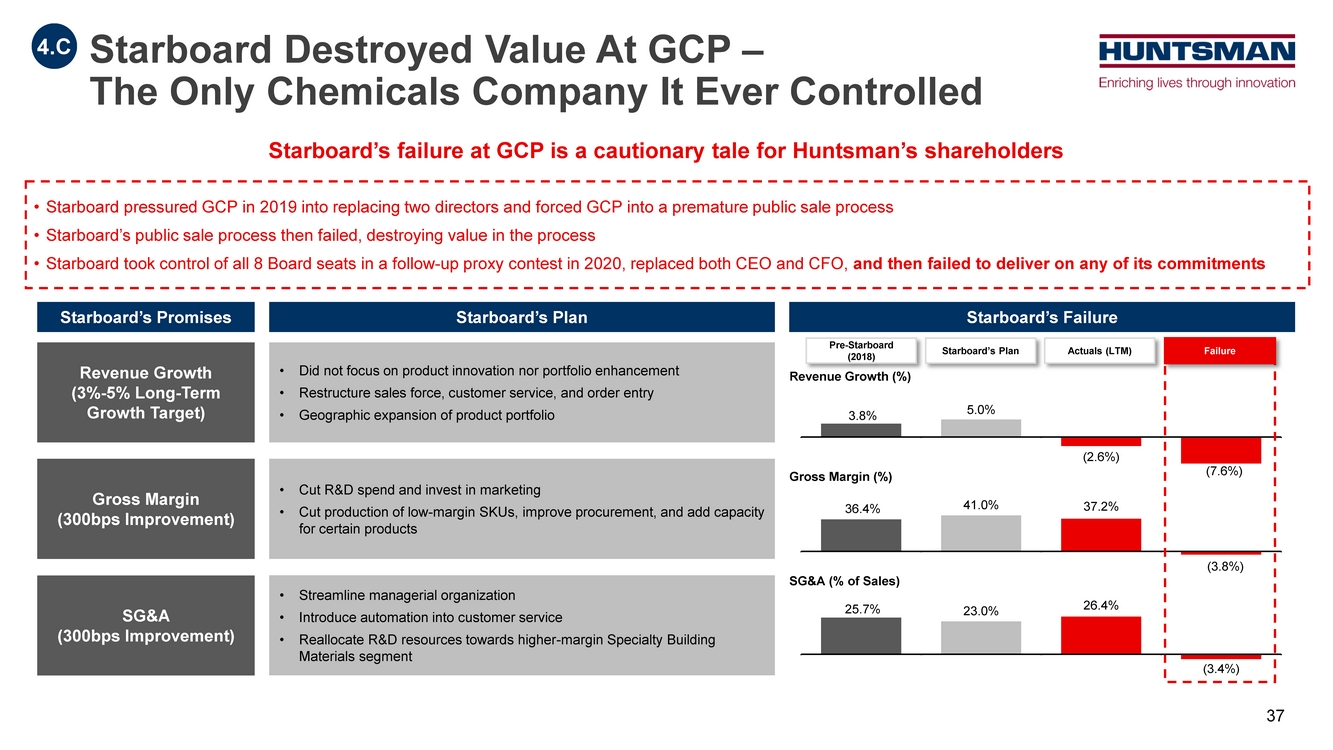
| (2.6%) 3.8% 5.0% 2018 (Pre Starboard) Starboard's Plan Actual Starboard Underperformance 37.2% 36.4% 41.0% (3.8%) 2018 (Pre Starboard) Starboard's Plan Actual Starboard Underperformance • Starboard pressured GCP in 2019 into replacing two directors and forced GCP into a premature public sale process • Starboard’s public sale process then failed, destroying value in the process • Starboard took control of all 8 Board seats in a follow-up proxy contest in 2020, replaced both CEO and CFO, and then failed to deliver on any of its commitments Revenue Growth (3%-5% Long-Term Growth Target) Starboard’s failure at GCP is a cautionary tale for Huntsman’s shareholders Gross Margin (300bps Improvement) SG&A (300bps Improvement) • Did not focus on product innovation nor portfolio enhancement • Restructure sales force, customer service, and order entry • Geographic expansion of product portfolio Starboard’s Promises Starboard’s Plan • Cut R&D spend and invest in marketing • Cut production of low-margin SKUs, improve procurement, and add capacity for certain products • Streamline managerial organization • Introduce automation into customer service • Reallocate R&D resources towards higher-margin Specialty Building Materials segment Starboard’s Failure Starboard Destroyed Value At GCP – The Only Chemicals Company It Ever Controlled Pre-Starboard (2018) 26.4% 25.7% 23.0% (3.4%) 2018 (Pre Starboard) Starboard's Plan Actual Starboard Underperformance Starboard’s Plan Actuals (LTM) Failure Revenue Growth (%) Gross Margin (%) SG&A (% of Sales) 4.C (7.6%) 37 |
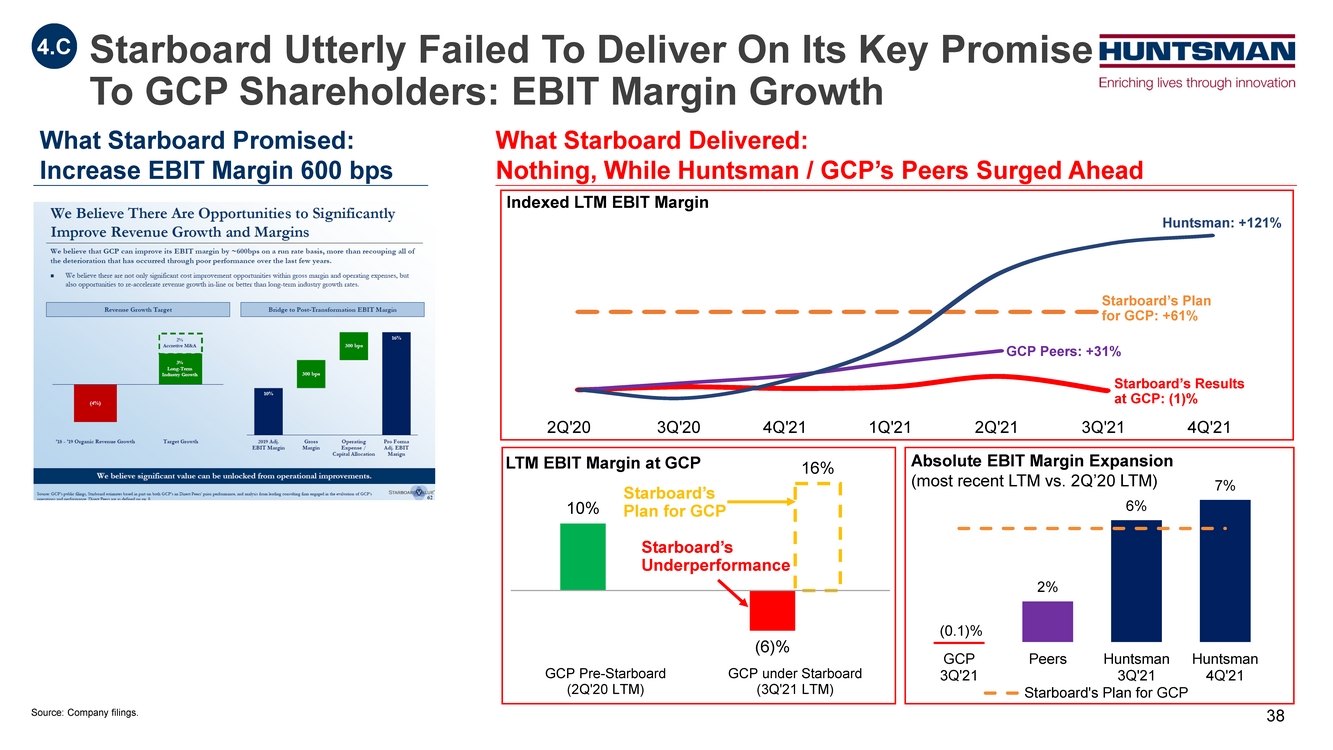
| (0.1)% 2% 6% 7% GCP 3Q'21 Peers Huntsman 3Q'21 Huntsman 4Q'21 Starboard's Plan for GCP 10% (6)% 16% GCP Pre-Starboard (2Q'20 LTM) GCP under Starboard (3Q'21 LTM) What Starboard Promised: Increase EBIT Margin 600 bps What Starboard Delivered: Nothing, While Huntsman / GCP’s Peers Surged Ahead Huntsman: +121% Starboard’s Plan for GCP: +61% GCP Peers: +31% Starboard’s Results at GCP: (1)% 4.C Starboard Utterly Failed To Deliver On Its Key Promise To GCP Shareholders: EBIT Margin Growth LTM EBIT Margin at GCP Indexed LTM EBIT Margin Absolute EBIT Margin Expansion (most recent LTM vs. 2Q’20 LTM) Starboard’s Underperformance 2Q'20 3Q'20 4Q'21 1Q'21 2Q'21 3Q'21 4Q'21 Starboard’s Plan for GCP Source: Company filings. 38 |
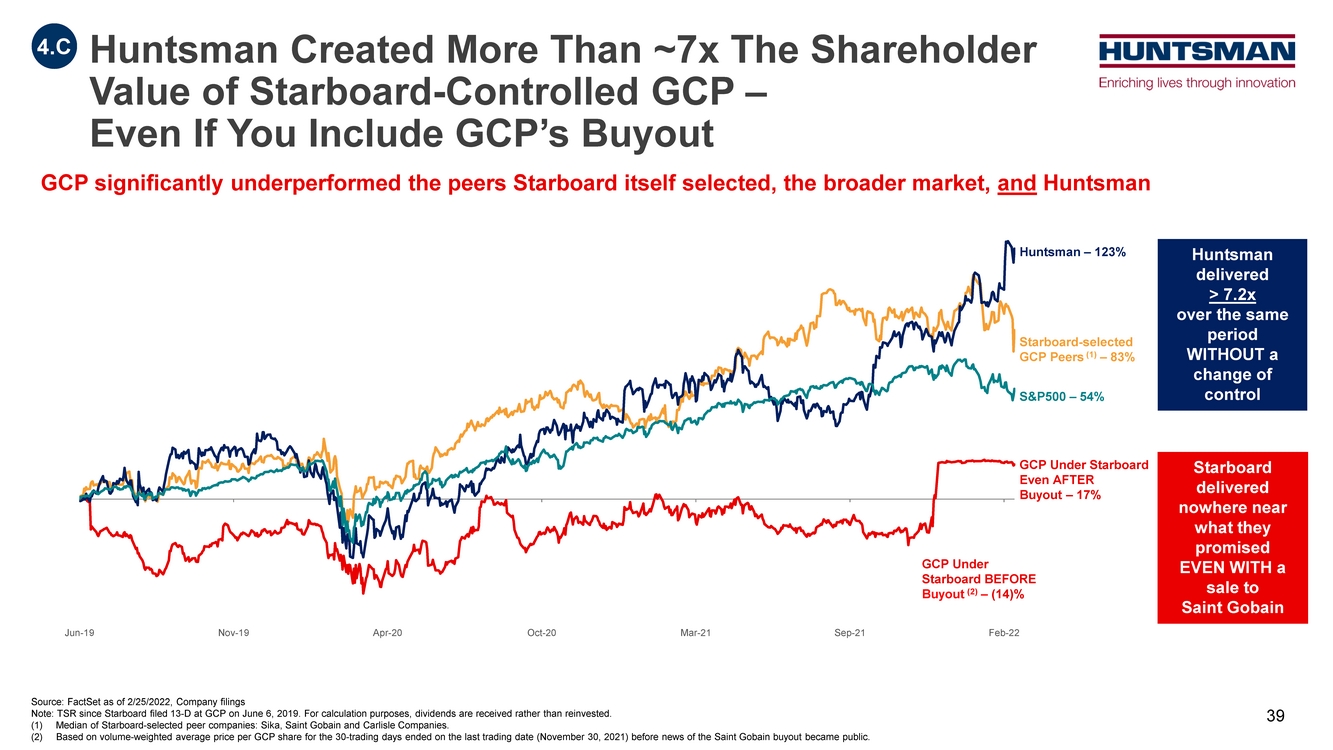
| Source: FactSet as of 2/25/2022, Company filings Note: TSR since Starboard filed 13-D at GCP on June 6, 2019. For calculation purposes, dividends are received rather than reinvested. (1) Median of Starboard-selected peer companies: Sika, Saint Gobain and Carlisle Companies. (2) Based on volume-weighted average price per GCP share for the 30-trading days ended on the last trading date (November 30, 2021) before news of the Saint Gobain buyout became public. GCP significantly underperformed the peers Starboard itself selected, the broader market, and Huntsman Starboard delivered nowhere near what they promised EVEN WITH a sale to Saint Gobain Huntsman Created More Than ~7x The Shareholder Value of Starboard-Controlled GCP – Even If You Include GCP’s Buyout 4.C Starboard-selected GCP Peers (1) – 83% Huntsman – 123% S&P500 – 54% GCP Under Starboard Even AFTER Buyout – 17% GCP Under Starboard BEFORE Buyout (2) – (14)% Huntsman delivered > 7.2x over the same period WITHOUT a change of control Jun-19 Nov-19 Apr-20 Oct-20 Mar-21 Sep-21 Feb-22 39 |
| Conclusion |

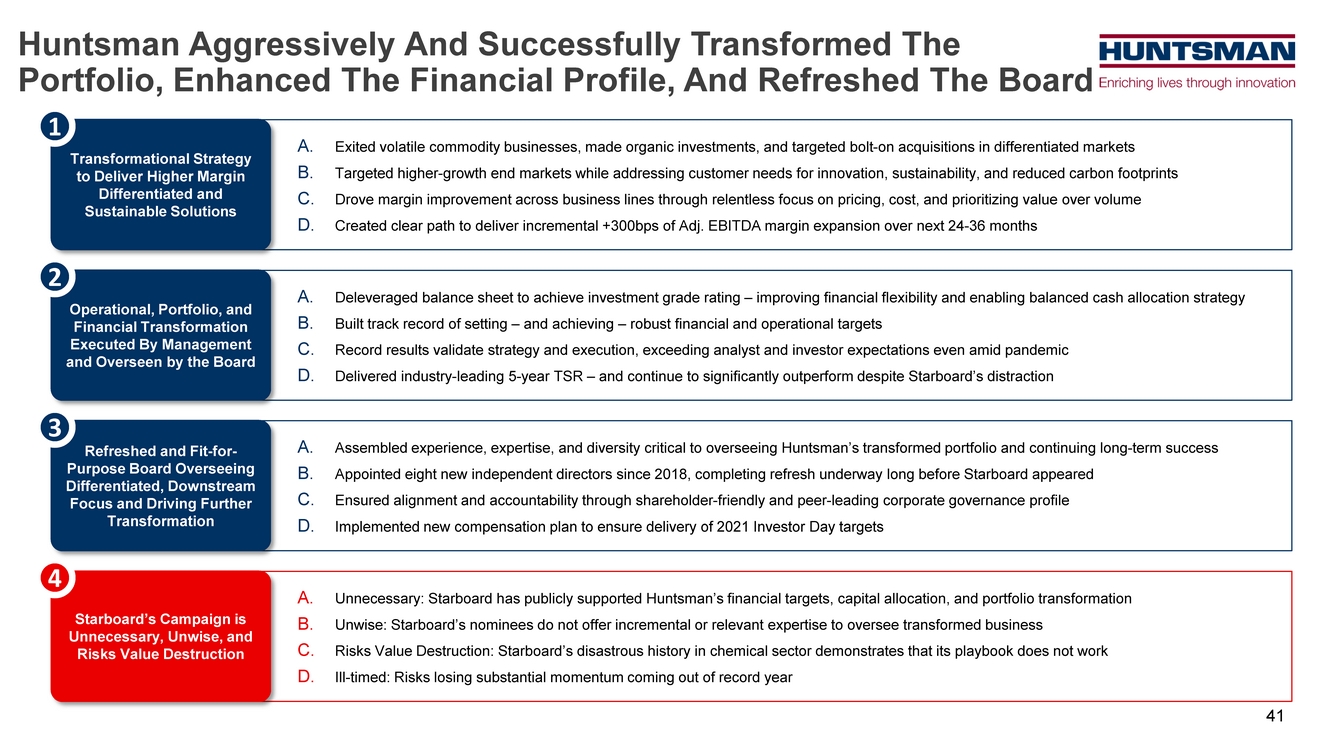
| A. Unnecessary: Starboard has publicly supported Huntsman’s financial targets, capital allocation, and portfolio transformation B. Unwise: Starboard’s nominees do not offer incremental or relevant expertise to oversee transformed business C. Risks Value Destruction: Starboard’s disastrous history in chemical sector demonstrates that its playbook does not work D. Ill-timed: Risks losing substantial momentum coming out of record year A. Assembled experience, expertise, and diversity critical to overseeing Huntsman’s transformed portfolio and continuing long-term success B. Appointed eight new independent directors since 2018, completing refresh underway long before Starboard appeared C. Ensured alignment and accountability through shareholder-friendly and peer-leading corporate governance profile D. Implemented new compensation plan to ensure delivery of 2021 Investor Day targets A. Exited volatile commodity businesses, made organic investments, and targeted bolt-on acquisitions in differentiated markets B. Targeted higher-growth end markets while addressing customer needs for innovation, sustainability, and reduced carbon footprints C. Drove margin improvement across business lines through relentless focus on pricing, cost, and prioritizing value over volume D. Created clear path to deliver incremental +300bps of Adj. EBITDA margin expansion over next 24-36 months A. Deleveraged balance sheet to achieve investment grade rating – improving financial flexibility and enabling balanced cash allocation strategy B. Built track record of setting – and achieving – robust financial and operational targets C. Record results validate strategy and execution, exceeding analyst and investor expectations even amid pandemic D. Delivered industry-leading 5-year TSR – and continue to significantly outperform despite Starboard’s distraction Huntsman Aggressively And Successfully Transformed The Portfolio, Enhanced The Financial Profile, And Refreshed The Board Transformational Strategy to Deliver Higher Margin Differentiated and Sustainable Solutions 1 Operational, Portfolio, and Financial Transformation Executed By Management and Overseen by the Board 2 Refreshed and Fit-for- Purpose Board Overseeing Differentiated, Downstream Focus and Driving Further Transformation 3 Starboard’s Campaign is Unnecessary, Unwise, and Risks Value Destruction 4 41 |
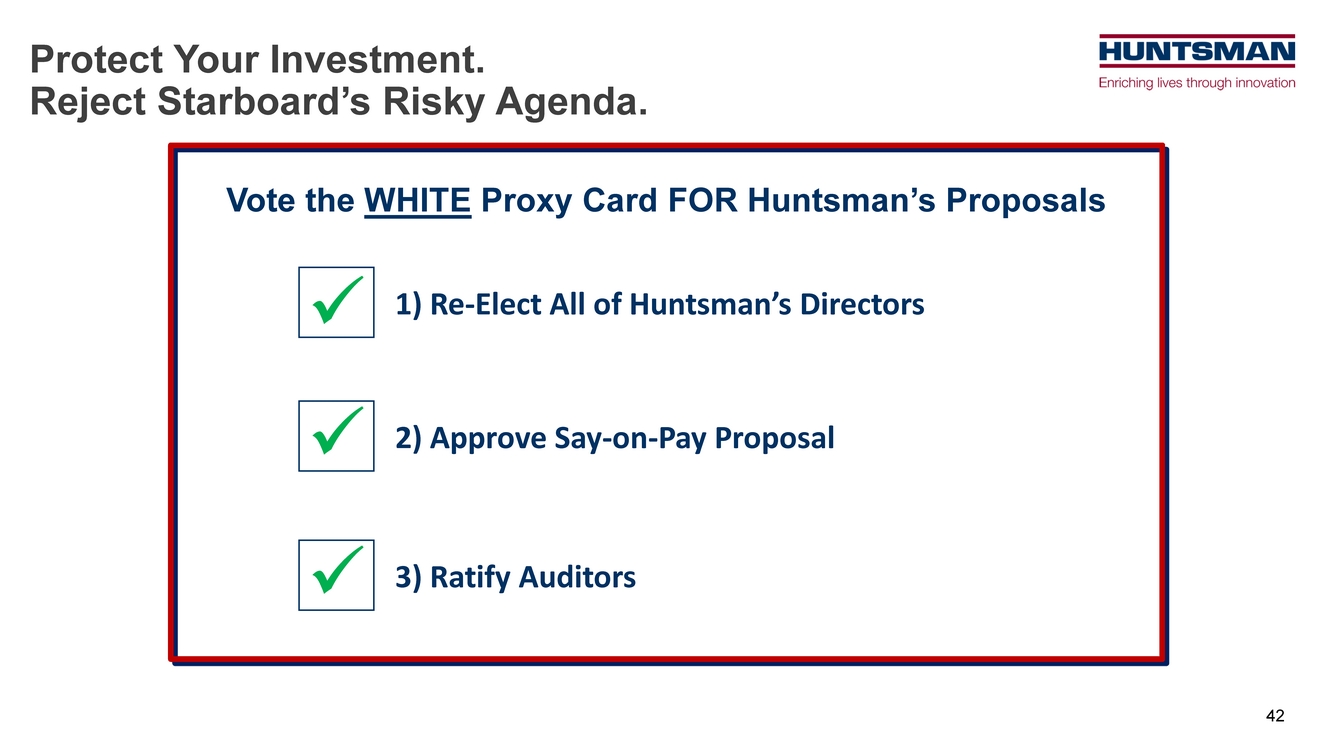
| Vote the WHITE Proxy Card FOR Huntsman’s Proposals 1) Re-Elect All of Huntsman’s Directors 2) Approve Say-on-Pay Proposal 3) Ratify Auditors Protect Your Investment. Reject Starboard’s Risky Agenda. 42 |
| Appendix |

| Peter Huntsman Chairman, President, and CEO of Huntsman Joined Board in 2004 Elected Chairman in 2018 Provides 40 years of strategic, operational, and financial leadership driving Huntsman’s transformation, including identifying, acquiring, and integrating more than 25 value-additive bolt-on businesses and delivering in excess of $500 million in cost optimization programs .. Developed broad and deep experience across the many facets of the global chemical industry while serving in both operational and executive leadership positions in the United States and abroad .. Built valuable and enduring relationships with customers, suppliers, labor unions, political leaders, NGO's and the communities in which the Company operates around the world .. Spearheaded Huntsman’s transformation through his executive leadership and strategic insight .. Current Public Directorships: Director of Venator Materials .. Other Notable Memberships: Chairman of the American Chemistry Council; Director of the Memorial Hermann Health Systems Cynthia Egan Vice Chair & Lead Independent Director of Huntsman Nominating & Corporate Governance Chair Joined Board in 2020 Provides perspective of long-term institutional shareholders coupled with strong management and financial acumen developed as T. Rowe Price executive responsible for over 2,900 investment plans with more than 1.5 million participants .. Spent one year as a Senior Advisor to the U.S. Department of the Treasury (following her time at T. Rowe Price), where she advised senior level agency employees on domestic employment retirement security .. Brings a unique perspective and helps align with the Company's long- term strategy to ensure the Board and management remain focused on the priorities of Company shareholders, including leading institutions .. Current Public Directorships: Chair of Hanover Insurance Group; Director of Unum Group .. Other Notable Memberships: Founding Co-Chair of the Council of Women of Boston College; Director of BlackRock’s Innovation and Growth Trust and Science and Technology Trust II Our Qualified Board’s Bios Executive Leadership & Strategy Perspective of Long-Term Shareholder 44 |

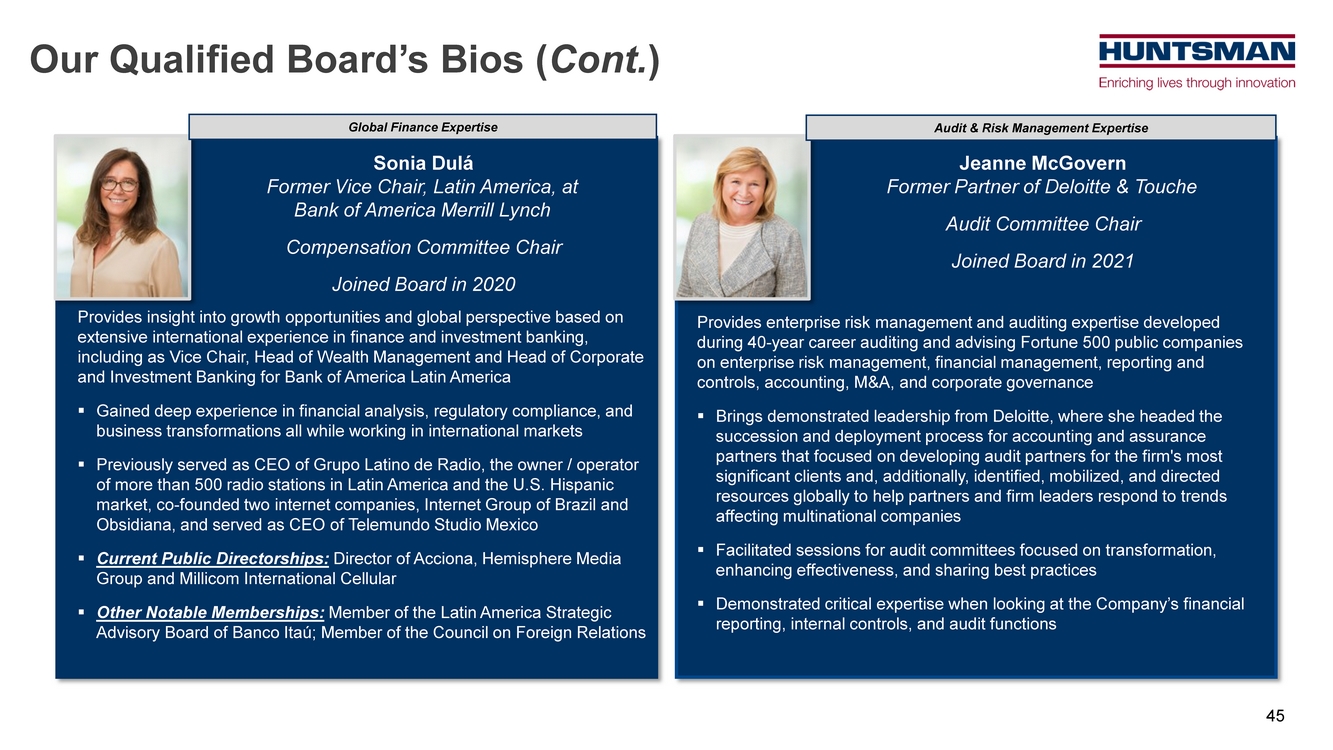
| Sonia Dulá Former Vice Chair, Latin America, at Bank of America Merrill Lynch Compensation Committee Chair Joined Board in 2020 Provides insight into growth opportunities and global perspective based on extensive international experience in finance and investment banking, including as Vice Chair, Head of Wealth Management and Head of Corporate and Investment Banking for Bank of America Latin America .. Gained deep experience in financial analysis, regulatory compliance, and business transformations all while working in international markets .. Previously served as CEO of Grupo Latino de Radio, the owner / operator of more than 500 radio stations in Latin America and the U.S. Hispanic market, co-founded two internet companies, Internet Group of Brazil and Obsidiana, and served as CEO of Telemundo Studio Mexico .. Current Public Directorships: Director of Acciona, Hemisphere Media Group and Millicom International Cellular .. Other Notable Memberships: Member of the Latin America Strategic Advisory Board of Banco Itaú; Member of the Council on Foreign Relations Jeanne McGovern Former Partner of Deloitte & Touche Audit Committee Chair Joined Board in 2021 Provides enterprise risk management and auditing expertise developed during 40-year career auditing and advising Fortune 500 public companies on enterprise risk management, financial management, reporting and controls, accounting, M&A, and corporate governance .. Brings demonstrated leadership from Deloitte, where she headed the succession and deployment process for accounting and assurance partners that focused on developing audit partners for the firm's most significant clients and, additionally, identified, mobilized, and directed resources globally to help partners and firm leaders respond to trends affecting multinational companies .. Facilitated sessions for audit committees focused on transformation, enhancing effectiveness, and sharing best practices .. Demonstrated critical expertise when looking at the Company’s financial reporting, internal controls, and audit functions Our Qualified Board’s Bios (Cont.) Global Finance Expertise Audit & Risk Management Expertise 45 |
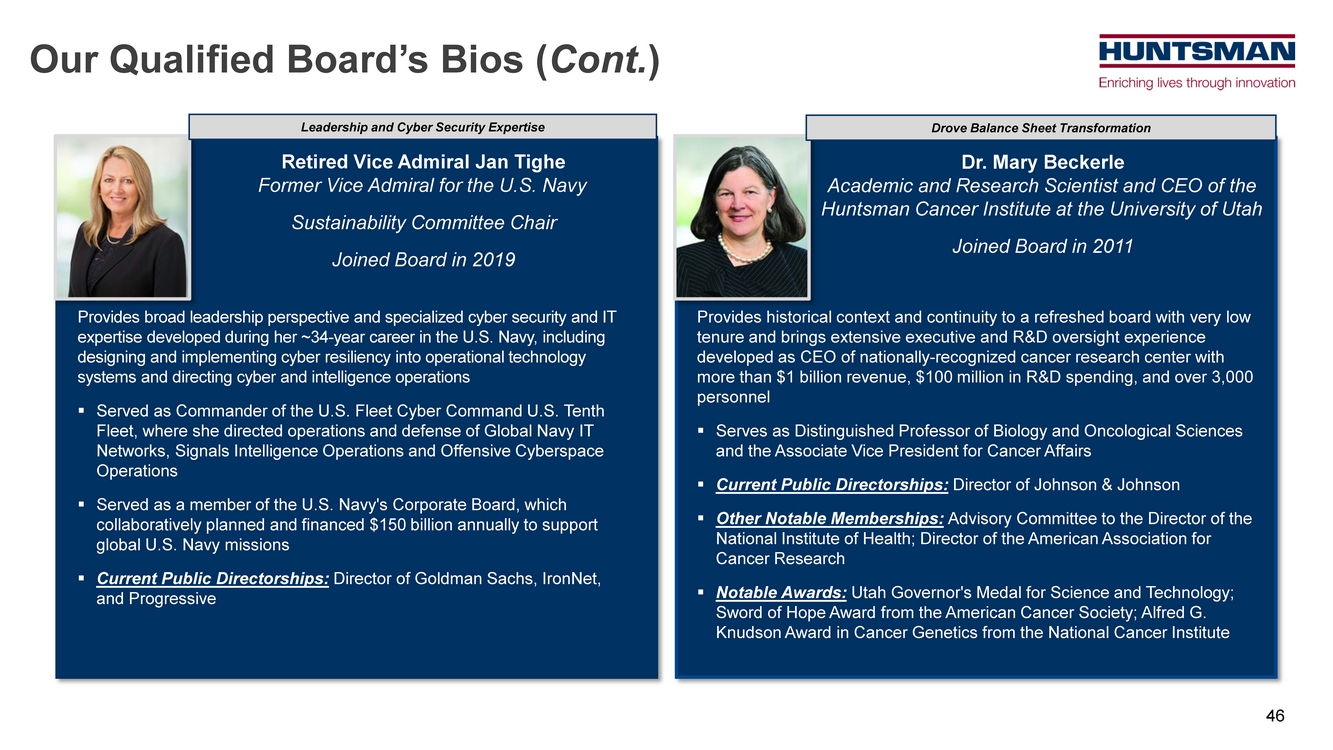
| Retired Vice Admiral Jan Tighe Former Vice Admiral for the U.S. Navy Sustainability Committee Chair Joined Board in 2019 Provides broad leadership perspective and specialized cyber security and IT expertise developed during her ~34-year career in the U.S. Navy, including designing and implementing cyber resiliency into operational technology systems and directing cyber and intelligence operations .. Served as Commander of the U.S. Fleet Cyber Command U.S. Tenth Fleet, where she directed operations and defense of Global Navy IT Networks, Signals Intelligence Operations and Offensive Cyberspace Operations .. Served as a member of the U.S. Navy's Corporate Board, which collaboratively planned and financed $150 billion annually to support global U.S. Navy missions .. Current Public Directorships: Director of Goldman Sachs, IronNet, and Progressive Dr. Mary Beckerle Academic and Research Scientist and CEO of the Huntsman Cancer Institute at the University of Utah Joined Board in 2011 Provides historical context and continuity to a refreshed board with very low tenure and brings extensive executive and R&D oversight experience developed as CEO of nationally-recognized cancer research center with more than $1 billion revenue, $100 million in R&D spending, and over 3,000 personnel .. Serves as Distinguished Professor of Biology and Oncological Sciences and the Associate Vice President for Cancer Affairs .. Current Public Directorships: Director of Johnson & Johnson .. Other Notable Memberships: Advisory Committee to the Director of the National Institute of Health; Director of the American Association for Cancer Research .. Notable Awards: Utah Governor's Medal for Science and Technology; Sword of Hope Award from the American Cancer Society; Alfred G. Knudson Award in Cancer Genetics from the National Cancer Institute Our Qualified Board’s Bios (Cont.) Leadership and Cyber Security Expertise Drove Balance Sheet Transformation 46 |
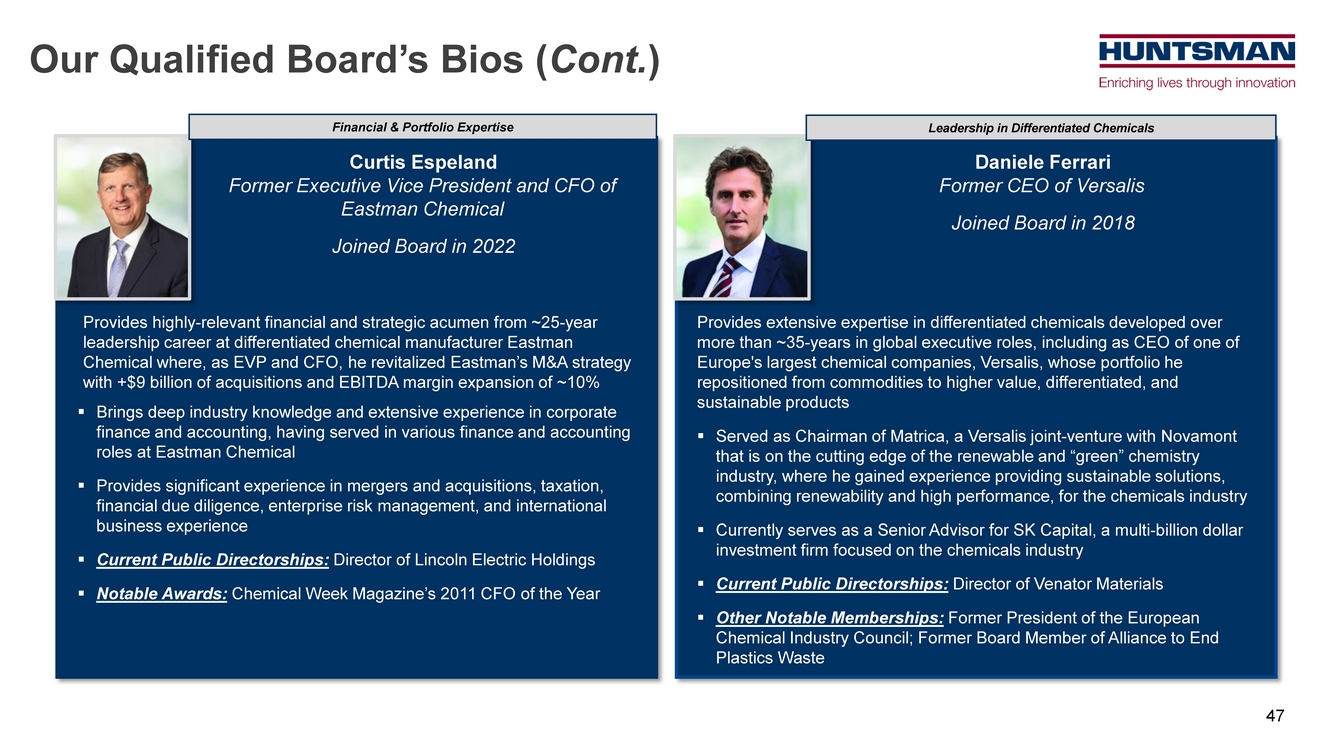
| Curtis Espeland Former Executive Vice President and CFO of Eastman Chemical Joined Board in 2022 Provides highly-relevant financial and strategic acumen from ~25-year leadership career at differentiated chemical manufacturer Eastman Chemical where, as EVP and CFO, he revitalized Eastman’s M&A strategy with +$9 billion of acquisitions and EBITDA margin expansion of ~10% .. Brings deep industry knowledge and extensive experience in corporate finance and accounting, having served in various finance and accounting roles at Eastman Chemical .. Provides significant experience in mergers and acquisitions, taxation, financial due diligence, enterprise risk management, and international business experience .. Current Public Directorships: Director of Lincoln Electric Holdings .. Notable Awards: Chemical Week Magazine’s 2011 CFO of the Year Daniele Ferrari Former CEO of Versalis Joined Board in 2018 Provides extensive expertise in differentiated chemicals developed over more than ~35-years in global executive roles, including as CEO of one of Europe's largest chemical companies, Versalis, whose portfolio he repositioned from commodities to higher value, differentiated, and sustainable products .. Served as Chairman of Matrica, a Versalis joint-venture with Novamont that is on the cutting edge of the renewable and “green” chemistry industry, where he gained experience providing sustainable solutions, combining renewability and high performance, for the chemicals industry .. Currently serves as a Senior Advisor for SK Capital, a multi-billion dollar investment firm focused on the chemicals industry .. Current Public Directorships: Director of Venator Materials .. Other Notable Memberships: Former President of the European Chemical Industry Council; Former Board Member of Alliance to End Plastics Waste Our Qualified Board’s Bios (Cont.) Financial & Portfolio Expertise Leadership in Differentiated Chemicals 47 |
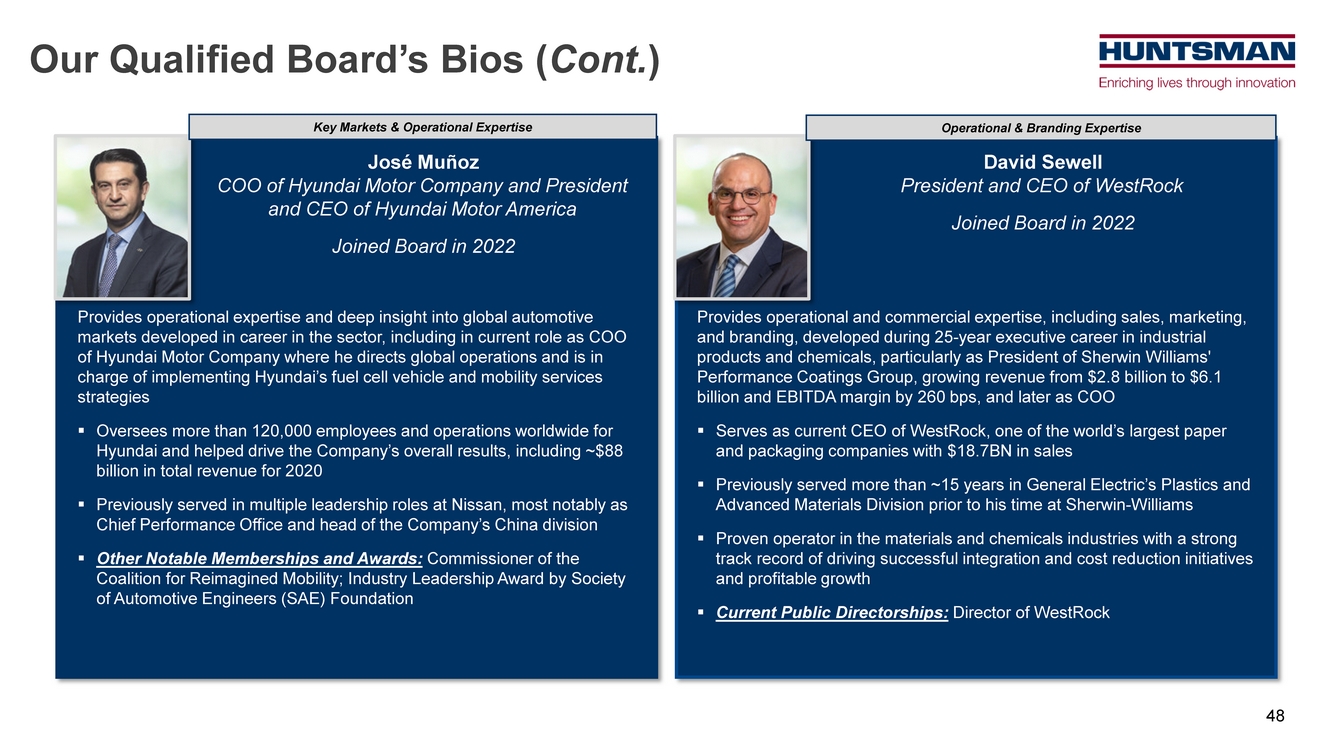
| David Sewell President and CEO of WestRock Joined Board in 2022 Provides operational and commercial expertise, including sales, marketing, and branding, developed during 25-year executive career in industrial products and chemicals, particularly as President of Sherwin Williams' Performance Coatings Group, growing revenue from $2.8 billion to $6.1 billion and EBITDA margin by 260 bps, and later as COO .. Serves as current CEO of WestRock, one of the world’s largest paper and packaging companies with $18.7BN in sales .. Previously served more than ~15 years in General Electric’s Plastics and Advanced Materials Division prior to his time at Sherwin-Williams .. Proven operator in the materials and chemicals industries with a strong track record of driving successful integration and cost reduction initiatives and profitable growth .. Current Public Directorships: Director of WestRock José Muñoz COO of Hyundai Motor Company and President and CEO of Hyundai Motor America Joined Board in 2022 Provides operational expertise and deep insight into global automotive markets developed in career in the sector, including in current role as COO of Hyundai Motor Company where he directs global operations and is in charge of implementing Hyundai’s fuel cell vehicle and mobility services strategies .. Oversees more than 120,000 employees and operations worldwide for Hyundai and helped drive the Company’s overall results, including ~$88 billion in total revenue for 2020 .. Previously served in multiple leadership roles at Nissan, most notably as Chief Performance Office and head of the Company’s China division .. Other Notable Memberships and Awards: Commissioner of the Coalition for Reimagined Mobility; Industry Leadership Award by Society of Automotive Engineers (SAE) Foundation Our Qualified Board’s Bios (Cont.) Key Markets & Operational Expertise Operational & Branding Expertise 48 |
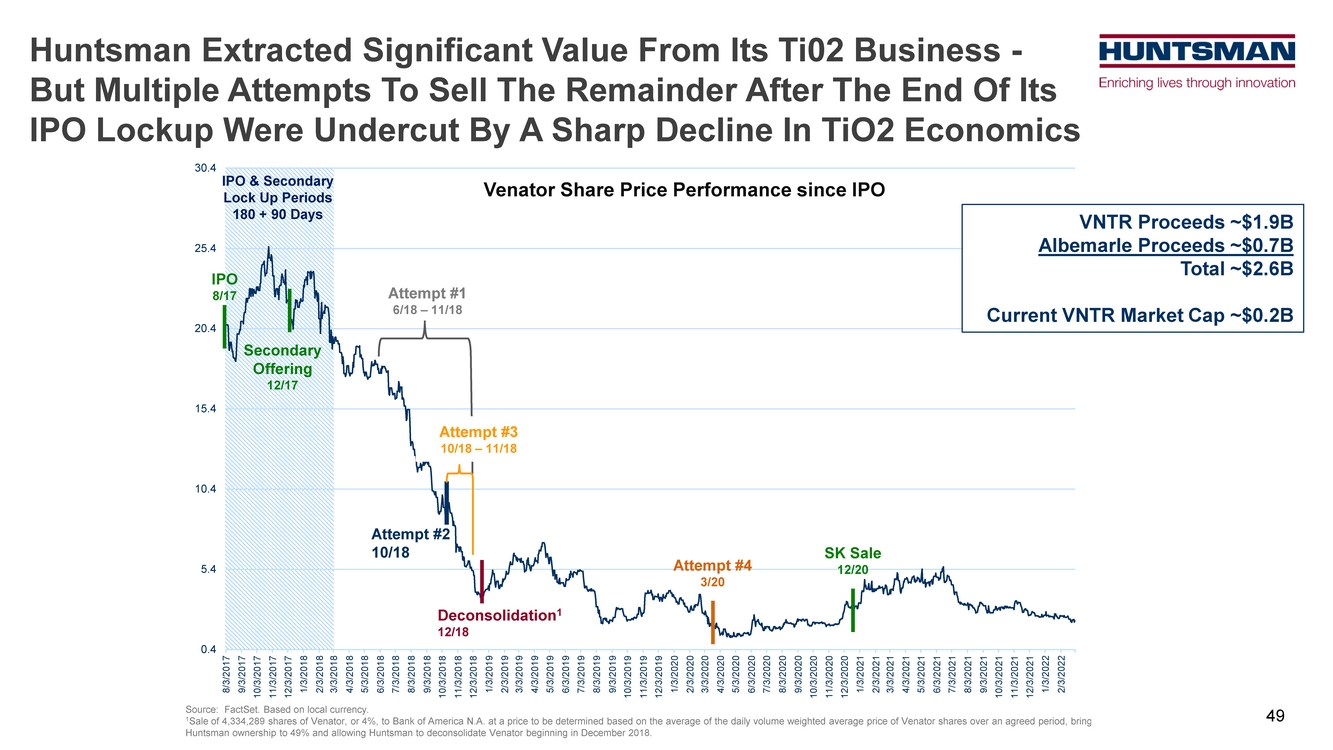
| 0.4 5.4 10.4 15.4 20.4 25.4 30.4 8/3/2017 9/3/2017 10/3/2017 11/3/2017 12/3/2017 1/3/2018 2/3/2018 3/3/2018 4/3/2018 5/3/2018 6/3/2018 7/3/2018 8/3/2018 9/3/2018 10/3/2018 11/3/2018 12/3/2018 1/3/2019 2/3/2019 3/3/2019 4/3/2019 5/3/2019 6/3/2019 7/3/2019 8/3/2019 9/3/2019 10/3/2019 11/3/2019 12/3/2019 1/3/2020 2/3/2020 3/3/2020 4/3/2020 5/3/2020 6/3/2020 7/3/2020 8/3/2020 9/3/2020 10/3/2020 11/3/2020 12/3/2020 1/3/2021 2/3/2021 3/3/2021 4/3/2021 5/3/2021 6/3/2021 7/3/2021 8/3/2021 9/3/2021 10/3/2021 11/3/2021 12/3/2021 1/3/2022 2/3/2022 Venator Share Price Performance since IPO Huntsman Extracted Significant Value From Its Ti02 Business - But Multiple Attempts To Sell The Remainder After The End Of Its IPO Lockup Were Undercut By A Sharp Decline In TiO2 Economics Source: FactSet. Based on local currency. 1Sale of 4,334,289 shares of Venator, or 4%, to Bank of America N.A. at a price to be determined based on the average of the daily volume weighted average price of Venator shares over an agreed period, bringing Huntsman ownership to 49% and allowing Huntsman to deconsolidate Venator beginning in December 2018. IPO 8/17 Secondary Offering 12/17 Attempt #1 6/18 – 11/18 Attempt #2 10/18 Deconsolidation1 12/18 IPO & Secondary Lock Up Periods 180 + 90 Days Attempt #4 3/20 SK Sale 12/20 VNTR Proceeds ~$1.9B Albemarle Proceeds ~$0.7B Total ~$2.6B Current VNTR Market Cap ~$0.2B Huntsman Attempt #3 10/18 – 11/18 49 |
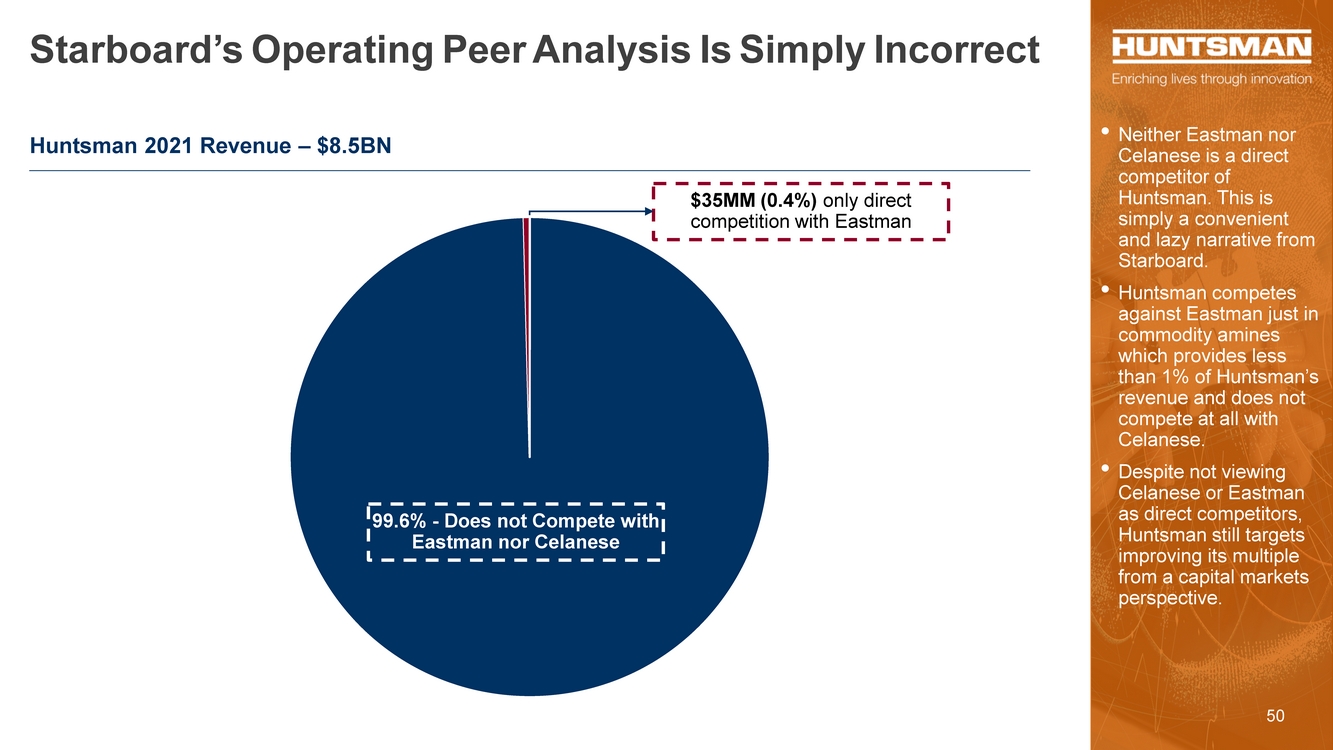
| Starboard’s Operating Peer Analysis Is Simply Incorrect • Neither Eastman nor Celanese is a direct competitor of Huntsman. This is simply a convenient and lazy narrative from Starboard. • Huntsman competes against Eastman just in commodity amines which provides less than 1% of Huntsman’s revenue and does not compete at all with Celanese. • Despite not viewing Celanese or Eastman as direct competitors, Huntsman still targets improving its multiple from a capital markets perspective. Huntsman 2021 Revenue – $8.5BN 99.6% - Does not Compete with Eastman nor Celanese $35MM (0.4%) only direct competition with Eastman 50 |
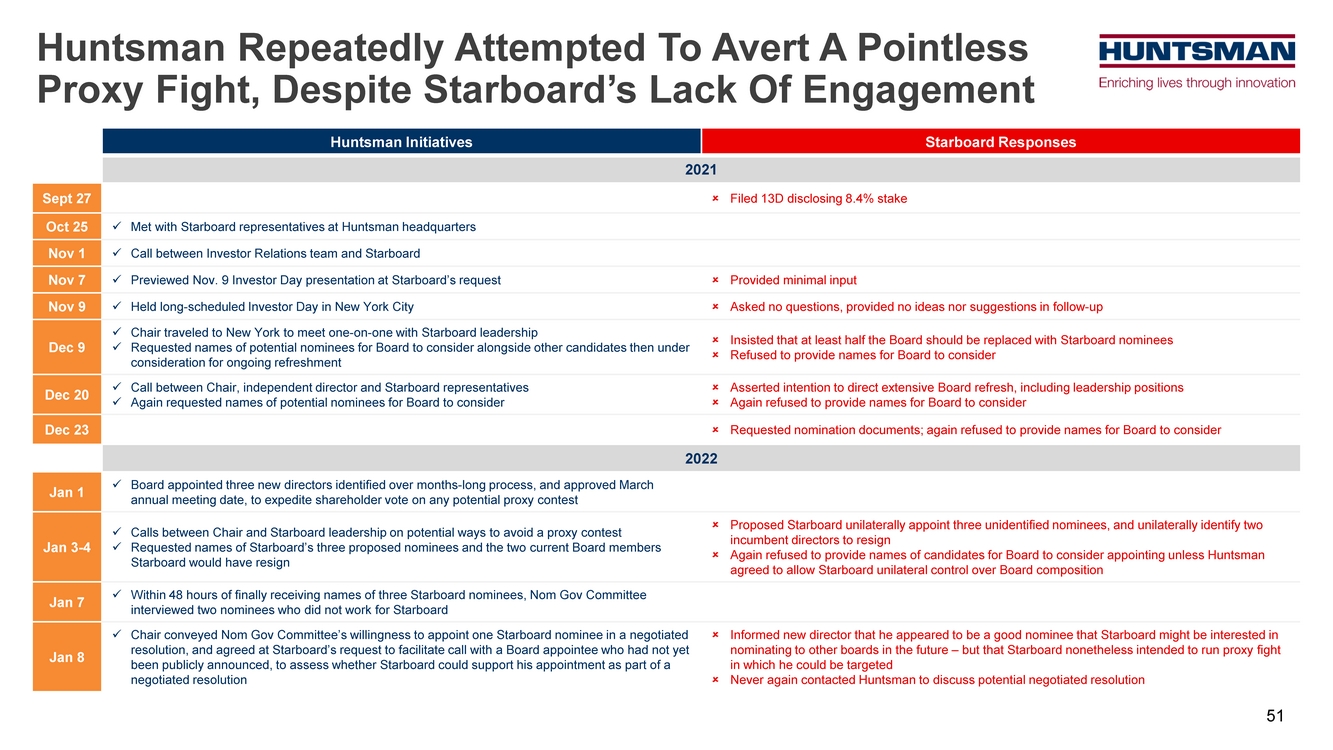
| Huntsman Initiatives Starboard Responses 2021 Sept 27 Filed 13D disclosing 8.4% stake Oct 25 Met with Starboard representatives at Huntsman headquarters Nov 1 Call between Investor Relations team and Starboard Nov 7 Previewed Nov. 9 Investor Day presentation at Starboard’s request Provided minimal input Nov 9 Held long-scheduled Investor Day in New York City Asked no questions, provided no ideas nor suggestions in follow-up Dec 9 Chair traveled to New York to meet one-on-one with Starboard leadership Requested names of potential nominees for Board to consider alongside other candidates then under consideration for ongoing refreshment Insisted that at least half the Board should be replaced with Starboard nominees Refused to provide names for Board to consider Dec 20 Call between Chair, independent director and Starboard representatives Again requested names of potential nominees for Board to consider Asserted intention to direct extensive Board refresh, including leadership positions Again refused to provide names for Board to consider Dec 23 Requested nomination documents; again refused to provide names for Board to consider 2022 Jan 1 Board appointed three new directors identified over months-long process, and approved March annual meeting date, to expedite shareholder vote on any potential proxy contest Jan 3-4 Calls between Chair and Starboard leadership on potential ways to avoid a proxy contest Requested names of Starboard’s three proposed nominees and the two current Board members Starboard would have resign Proposed Starboard unilaterally appoint three unidentified nominees, and unilaterally identify two incumbent directors to resign Again refused to provide names of candidates for Board to consider appointing unless Huntsman agreed to allow Starboard unilateral control over Board composition Jan 7 Within 48 hours of finally receiving names of three Starboard nominees, Nom Gov Committee interviewed two nominees who did not work for Starboard Jan 8 Chair conveyed Nom Gov Committee’s willingness to appoint one Starboard nominee in a negotiated resolution, and agreed at Starboard’s request to facilitate call with a Board appointee who had not yet been publicly announced, to assess whether Starboard could support his appointment as part of a negotiated resolution Informed new director that he appeared to be a good nominee that Starboard might be interested in nominating to other boards in the future – but that Starboard nonetheless intended to run proxy fight in which he could be targeted Never again contacted Huntsman to discuss potential negotiated resolution Huntsman Repeatedly Attempted To Avert A Pointless Proxy Fight, Despite Starboard’s Lack Of Engagement 51 |
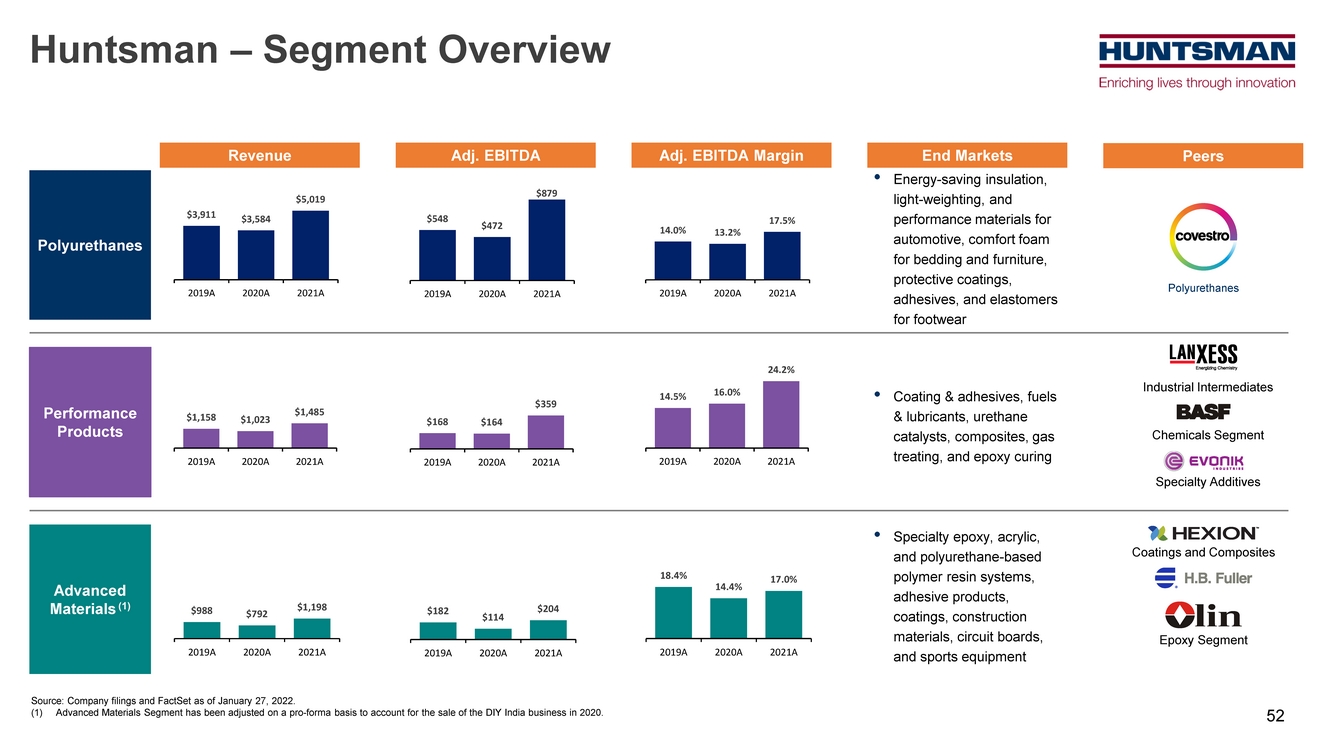
| Huntsman – Segment Overview Polyurethanes Performance Products Advanced Materials (1) Revenue Adj. EBITDA Adj. EBITDA Margin End Markets Peers • Energy-saving insulation, light-weighting, and performance materials for automotive, comfort foam for bedding and furniture, protective coatings, adhesives, and elastomers for footwear • Coating & adhesives, fuels & lubricants, urethane catalysts, composites, gas treating, and epoxy curing • Specialty epoxy, acrylic, and polyurethane-based polymer resin systems, adhesive products, coatings, construction materials, circuit boards, and sports equipment Polyurethanes Industrial Intermediates Chemicals Segment Specialty Additives Coatings and Composites Epoxy Segment $3,911 $3,584 $5,019 2019A 2020A 2021A $548 $472 $879 2019A 2020A 2021A 14.0% 13.2% 17.5% 2019A 2020A 2021A $1,158 $1,023 $1,485 2019A 2020A 2021A $168 $164 $359 2019A 2020A 2021A 14.5% 16.0% 24.2% 2019A 2020A 2021A $988 $792 $1,198 2019A 2020A 2021A $182 $114 $204 2019A 2020A 2021A 18.4% 14.4% 17.0% 2019A 2020A 2021A Source: Company filings and FactSet as of January 27, 2022. (1) Advanced Materials Segment has been adjusted on a pro-forma basis to account for the sale of the DIY India business in 2020. 52 |
| Huntsman Is Well-Positioned To Create Sustainable Long-Term Shareholder Value In 2022 And Beyond Grow Differentiated • High return and differentiated growth projects • Up-value portfolio through accretive M&A and bolt-on acquisitions • Focus on value over volume • Continue to drive innovation and sustainable solutions Generate 40%+ Free Cash Flow • Capital expenditure discipline • Increase operating leverage • Working capital management Improve Adj. EBITDA Margin • Unrelenting pricing excellence • Cost optimization and synergies • Up-valuing lower margin products • Drive to 18% – 20% margin Commitment to Capital Return & Investment Grade • Attractive and competitive dividend payout • New share repurchase program of $1BN expected to be complete within two years • Maintain investment grade balance sheet 53 |
| Forward Looking Statements This presentation includes “forward-looking statements” within the meaning of Section 27A of the Securities Act of 1933 and Section 21E of the Securities Exchange Act of 1934. These forward-looking statements include statements concerning our plans, objectives, goals, financial targets, strategies, future events, future revenue or performance, capital expenditures, financing needs, plans or intentions relating to acquisitions, divestitures or strategic transactions, including the review of the Textile Effects Division, business trends and any other information that is not historical information. When used in this presentation, the words “estimates,” “expects,” “anticipates,” “likely,” “projects,” “outlook,” “plans,” “intends,” “believes,” “forecasts,” “targets,” or future or conditional verbs, such as “will,” “should,” “could” or “may,” and variations of such words or similar expressions are intended to identify forward-looking statements. These forward-looking statements, including, without limitation, management’s examination of historical operating trends and data, are based upon our current expectations and various assumptions and beliefs. In particular, such forward-looking statements are subject to uncertainty and changes in circumstances and involve risks and uncertainties that may affect the Company’s operations, markets, products, prices and other factors as discussed in the Company’s filings with the Securities and Exchange Commission (the “SEC”). In addition, there can be no assurance that the review of the Textile Effects Division will result in one or more transactions or other strategic change or outcome. Significant risks and uncertainties may relate to, but are not limited to, ongoing impact of COVID-19 on our operations and financial results, volatile global economic conditions, cyclical and volatile product markets, disruptions in production at manufacturing facilities, timing of proposed transactions, reorganization or restructuring of the Company’s operations, including any delay of, or other negative developments affecting the ability to implement cost reductions and manufacturing optimization improvements in the Company’s businesses and to realize anticipated cost savings, and other financial, operational, economic, competitive, environmental, political, legal, regulatory and technological factors. Any forward-looking statement should be considered in light of the risks set forth under the caption “Risk Factors” in our Annual Report on Form 10-K for the year ended December 31, 2021, which may be supplemented by other risks and uncertainties disclosed in any subsequent reports filed or furnished by the Company from time to time. All forward-looking statements apply only as of the date made. Except as required by law, the Company undertakes no obligation to update or revise forward-looking statements to reflect events or circumstances that arise after the date made or to reflect the occurrence of unanticipated events. Non-GAAP Financial Measures This presentation contains financial measures that are not in accordance with generally accepted accounting principles in the U.S. (“GAAP”), including adjusted EBITDA. For more information on the non-GAAP financial measures used by the Company and referenced in this presentation, including definitions and reconciliations of non-GAAP measures to GAAP, please refer to “Non-GAAP Reconciliation” hyperlink available in the “Financials” section of the Company’s website at www.huntsman.com/investors. The Company does not provide reconciliations of forward-looking non-GAAP financial measures to the most comparable GAAP financial measures on a forward-looking basis because the Company is unable to provide a meaningful or accurate calculation or estimation of reconciling items and the information is not available without unreasonable effort. This is due to the inherent difficulty of forecasting the timing and amount of certain items, such as, but not limited to, (a) business acquisition and integration expenses, (b) merger costs, and (c) certain legal and other settlements and related costs. Each of such adjustments has not yet occurred, are out of the Company's control and/or cannot be reasonably predicted. For the same reasons, the Company is unable to address the probable significance of the unavailable information. Forward-looking Statements & Non-GAAP Financial Measures 54 |