UNITED STATES
SECURITIES AND EXCHANGE COMMISSION
WASHINGTON, D.C. 20549
Form
| (Mark One) |
| | ANNUAL REPORT PURSUANT TO SECTION 13 OR 15(d) OF THE SECURITIES EXCHANGE ACT OF 1934 FOR THE FISCAL YEAR ENDED |
| OR |
| | TRANSITION REPORT PURSUANT TO SECTION 13 OR 15(d) OF THE SECURITIES EXCHANGE ACT OF 1934 |
| Commission | Exact Name of Registrant as Specified in its Charter, | State of | I.R.S. Employer | |||
| |
| | | |||
| |
| | |
Securities registered pursuant to Section 12(b) of the Exchange Act:
| Registrant |
| Title of each class |
| Trading Symbol | Name of each exchange on which registered | |
| Huntsman Corporation |
| |
| | | |
| Huntsman International LLC |
| |
| | |
Securities registered pursuant to Section 12(g) of the Exchange Act:
| Registrant | Title of each class | |
| Huntsman Corporation/Huntsman International LLC | None |
Indicate by check mark if the registrant is a well-known seasoned issuer, as defined in Rule 405 of the Securities Act.
| Huntsman Corporation/Huntsman International LLC | | No ☐ |
Indicate by check mark if the registrant is not required to file reports pursuant to Section 13 or Section 15(d) of the Exchange Act.
| Huntsman Corporation/Huntsman International LLC | Yes ☐ | |
Indicate by check mark whether the registrant: (1) has filed all reports required to be filed by Section 13 or 15(d) of the Exchange Act during the preceding 12 months (or for such shorter period that the registrant was required to file such reports) and (2) has been subject to such filing requirements for the past 90 days.
| Huntsman Corporation/Huntsman International LLC | | No ☐ |
Indicate by check mark whether the registrant has submitted electronically every Interactive Data File required to be submitted pursuant to Rule 405 of Regulation S-T during the preceding 12 months (or for such shorter period that the registrant was required to submit such files).
| Huntsman Corporation/Huntsman International LLC | | No ☐ |
Indicate by check mark whether the registrant is a large accelerated filer, an accelerated filer, a non-accelerated filer, a smaller reporting company, or an emerging growth company. See the definitions of “large accelerated filer,” “accelerated filer” “smaller reporting company,” and “emerging growth company” in Rule 12b-2 of the Exchange Act. Huntsman Corporation
| Huntsman Corporation | | Accelerated filer ☐ | Non-accelerated filer ☐ | Smaller reporting company | Emerging Growth Companies |
| Huntsman International LLC | Large accelerated filer ☐ | Accelerated filer ☐ | | Smaller reporting company | Emerging Growth Companies |
Indicate by check mark whether the registrant has filed a report on and attestation to its management’s assessment of the effectiveness of its internal control over financial reporting under Section 404(b) of the Sarbanes-Oxley Act (15 U.S.C.7262(b)) by the registered public accounting firm that prepared or issued.
| Huntsman Corporation | Yes | No ☐ |
| Huntsman International LLC | Yes ☐ | No ☒ |
If an emerging growth company, indicate by check mark if the registrant has elected not to use the extended transition period for complying with any new or revised financial accounting standards provided pursuant to Section 7(a)(2)(B) of the Securities Act.
| Huntsman Corporation/Huntsman International LLC | Yes ☐ | No ☐ |
Indicate by check mark whether the registrant is a shell company (as defined in Rule 12b-2 of the Exchange Act).
| Huntsman Corporation/Huntsman International LLC | Yes | No ☒ |
On June 30, 2021, the last business day of the registrants’ most recently completed second fiscal quarter, the aggregate market value of voting and non-voting common equity held by non-affiliates was as follows:
| Registrant | Common Equity | Market Value Held by Nonaffiliates | ||
| Huntsman Corporation | Common Stock | $ | ||
| Huntsman International LLC | Units of Membership Interest | NA(2) |
| (1) | Based on the closing price of $26.52 per share of common stock as quoted on the New York Stock Exchange. |
| (2) | All units of membership interest are held by Huntsman Corporation, an affiliate. |
On January 31, 2022, the number of shares outstanding of each of the registrant’s classes of common equity were as follows:
| Registrant | Common Equity | Outstanding | ||
| Huntsman Corporation | Common Stock | | ||
| Huntsman International LLC | Units of Membership Interest | 2,728 |
This Annual Report on Form 10-K presents information for two registrants: Huntsman Corporation and Huntsman International LLC. Huntsman International LLC is a wholly owned subsidiary of Huntsman Corporation and is the principal operating company of Huntsman Corporation. The information reflected in this Annual Report on Form 10-K is equally applicable to both Huntsman Corporation and Huntsman International LLC, except where otherwise indicated.
Huntsman International LLC meets the conditions set forth in General Instructions (I)(1)(a) and (b) of Form 10-K and, to the extent applicable, is therefore filing this form with a reduced disclosure format.
Documents Incorporated by Reference
Part III: Proxy Statement for the 2022 Annual Meeting of Stockholders to be filed within 120 days of Huntsman Corporation’s fiscal year ended December 31, 2021.
HUNTSMAN CORPORATION AND SUBSIDIARIES
HUNTSMAN INTERNATIONAL LLC AND SUBSIDIARIES
2021 ANNUAL REPORT ON FORM 10-K
TABLE OF CONTENTS
HUNTSMAN CORPORATION AND SUBSIDIARIES
HUNTSMAN INTERNATIONAL LLC AND SUBSIDIARIES
2021 ANNUAL REPORT ON FORM 10-K
This report includes information with respect to market share, industry conditions and forecasts that we obtained from internal industry research, publicly available information (including industry publications and surveys), and surveys and market research provided by consultants. The publicly available information and the reports, forecasts and other research provided by consultants generally state that the information contained therein has been obtained from sources believed to be reliable. We have not independently verified any of the data from third-party sources, nor have we ascertained the underlying economic assumptions relied upon therein. Similarly, our internal research and forecasts are based upon our management’s understanding of industry conditions, and such information has not been verified by any independent sources.
For convenience in this report, the terms “Company,” “our,” “us,” or “we” may be used to refer to Huntsman Corporation and, unless the context otherwise requires, its subsidiaries and predecessors. In this report, “Huntsman International” refers to Huntsman International LLC (our wholly-owned subsidiary) and, unless the context otherwise requires, its subsidiaries; “AAC” refers to Arabian Amines Company, our consolidated manufacturing joint venture with the Zamil Group; “HPS” refers to Huntsman Polyurethanes Shanghai Ltd. (our consolidated splitting joint venture with Shanghai Chlor-Alkali Chemical Company, Ltd); and “SLIC” refers to Shanghai Liengheng Isocyanate Investment BV (an unconsolidated manufacturing joint venture with BASF and three Chinese chemical companies).
In this report, we may use, without definition, the common names of competitors or other industry participants. We may also use the common names or abbreviations for certain chemicals or products. Many of these terms are defined in the Glossary of Chemical Terms found at the conclusion of “Part I. Item 1. Business” below.
Forward-Looking Statements
With respect to Huntsman Corporation, certain information set forth in this report contains “forward-looking statements” within the meaning the Private Securities Litigation Reform Act of 1995, Section 27A of the Securities Act of 1933 and Section 21E of the Securities Exchange Act of 1934. All statements other than historical factual information are forward-looking statements, including without limitation statements regarding: projections of revenue, expenses, profit, profit margins, tax rates, tax provisions, cash flows, pension and benefit obligations and funding requirements, our liquidity position or other projected financial measures; projected impact of COVID-19 on our operations and future financial results; management’s plans and strategies for future operations, including statements relating to anticipated operating performance, cost reductions, restructuring activities, new product and service developments, competitive strengths or market position, acquisitions, divestitures, spin-offs or other distributions, strategic opportunities, securities offerings, stock repurchases, dividends and executive compensation; growth, declines and other trends in markets we sell into; new or modified laws, regulations and accounting pronouncements; outstanding claims, legal proceedings, tax audits and assessments and other contingent liabilities; foreign currency exchange rates and fluctuations in those rates; general economic and capital markets conditions; the timing of any of the foregoing; assumptions underlying any of the foregoing; and any other statements that address events or developments that we intend or believe will or may occur in the future. In some cases, forward-looking statements can be identified by terminology such as “believes,” “expects,” “may,” “will,” “should,” “anticipates” or “intends” or the negative of such terms or other comparable terminology, or by discussions of strategy. We may also make additional forward-looking statements from time to time. All such subsequent forward-looking statements, whether written or oral, by us or on our behalf, are also expressly qualified by these cautionary statements.
All forward-looking statements, including without limitation management’s examination of historical operating trends, are based upon our current expectations and various assumptions. Our expectations, beliefs and projections are expressed in good faith and we believe there is a reasonable basis for them, but there can be no assurance that management’s expectations, beliefs and projections will result or be achieved. All forward-looking statements apply only as of the date made. We undertake no obligation to publicly update or revise forward-looking statements whether because of new information, future events or otherwise, except as required by securities and other applicable law.
There are a number of risks and uncertainties that could cause our actual results to differ materially from the forward-looking statements contained in or contemplated by this report. Any forward-looking statements should be considered in light of the risks set forth in “Part I. Item 1A. Risk Factors” and elsewhere in this report.
General
We are a global manufacturer of differentiated organic chemical products. Our Company, a Delaware corporation, was formed in 2004 to hold the Huntsman businesses, which were founded by Jon M. Huntsman. Mr. Huntsman founded the predecessor to our Company in 1970 as a small polystyrene plastics packaging company. Since then, we have grown through a series of acquisitions and now own a global portfolio of businesses.
We operate all of our businesses through Huntsman International, our wholly-owned subsidiary. Huntsman International is a Delaware limited liability company and was formed in 1999.
Our principal executive offices are located at 10003 Woodloch Forest Drive, The Woodlands, Texas 77380, and our telephone number at that location is (281) 719-6000.
Recent Developments
Dividend Increase
On February 14, 2022, our Board of Directors declared a $0.2125 per share cash dividend on our common stock. This represents a 13% increase from the previous dividend.
Strategic Review of Textile Effects
In December 2021, we initiated a strategic review of our Textile Effects segment, which is headquartered in Singapore, including a possible sale of the segment. We have not set a timetable or a deadline for the conclusion of this evaluation of strategic alternatives.
Albemarle Settlement
On October 28, 2021, we won an arbitration award in excess of $600 million against Albemarle Corporation (“Albemarle”) for fraud and breach of contract (“Albemarle Settlement”). On November 4, 2021, Albemarle agreed to waive any appeal and pay $665 million, of which we received $332.5 million on December 2, 2021 and expect to receive a final payment of $332.5 million by early May 2022. We agreed to terminate all proceedings relating to the dispute after receipt of the final payment. We expect to receive, on a pretax basis, a total of approximately $465 million after related legal fees, which was recognized as income associated with the Albemarle Settlement, net in our consolidated statements of operations.
Share Repurchase Program
On October 26, 2021, our Board of Directors approved a new share repurchase program of $1 billion. In conjunction with the inception of this new share repurchase program, we retired our prior share repurchase program. See “Note 22. Huntsman Corporation Stockholders’ Equity—Share Repurchase Program” to our consolidated financial statements.
Other Significant Developments During 2021
Other significant developments that occurred during 2021 were as follows:
| ● |
On July 1, 2021, we entered into amendments to our U.S. accounts receivable securitization program (“U.S. A/R Program”) and our European accounts receivable securitization program (“EU A/R Program” and collectively with the U.S. A/R Program, “A/R Programs”) that, among other things, extended the scheduled termination dates of our A/R Programs from April 2022 to July 2024. For additional information, see “Note 14. Debt—Direct and Subsidiary Debt—A/R Programs” to our consolidated financial statements. |
| ● |
On May 26, 2021, Huntsman International completed a $400 million offering of its 2.95% senior notes due 2031 (“2031 Senior Notes”). On June 23, 2021, Huntsman International applied the net proceeds from the offering, along with cash on hand, to redeem in full $400 million in aggregate principal amount of its 5.125% senior notes due 2022 (“2022 Senior Notes”) and to pay accrued but unpaid interest of approximately $2 million. In addition, we paid redemption premiums and related fees and expenses of approximately $25 million and recognized a corresponding loss on early extinguishment of debt of $26 million in the second quarter of 2021. For additional information, see “Note 14. Debt—Direct and Subsidiary Debt—Senior Notes” to our consolidated financial statements. |
| ● |
On November 3, 2020, we completed the sale of the India-based do-it yourself consumer adhesives (“DIY”) business, part of our Advanced Materials segment to Pidilite Industries Ltd. and received cash of approximately $257 million. In the second quarter of 2021, we received the full payment of $28 million pursuant to an earnout provision based on the DIY business’s achievement, within 18 months, of certain sales revenue targets in line with its 2019 performance. As a result, we recognized an additional pretax gain of $28 million in the second quarter of 2021, which was recorded in gain on sale of India-based DIY business in our consolidated statements of operations. |
| ● |
On January 15, 2021, we completed the acquisition of Gabriel Performance Products, a North American specialty chemical manufacturer of specialty additives and epoxy curing agents for the coatings, adhesives, sealants and composite end-markets (“Gabriel Acquisition”), from funds affiliated with Audax Private Equity in an all-cash transaction of approximately $249 million, subject to customary closing adjustments, funded from available liquidity. The acquired business is being integrated into our Advanced Materials segment. See “Note 3. Business Combinations and Acquisitions—Acquisition of Gabriel Performance Products” to our consolidated financial statements. |
| ● |
On January 15, 2021, we redeemed in full €445 million (approximately $541 million) in aggregate principal amount of our 5.125% senior notes due 2021 (“2021 Senior Notes”) at the redemption price equal to 100% of the principal amount of the notes, plus accrued and unpaid interest to, but not including, the redemption date. In connection with this redemption, we incurred an incremental cash tax liability of approximately $15 million in the first quarter of 2021 related to foreign currency exchange gains. See “Note 14. Debt—Direct and Subsidiary Debt—Senior Notes” to our consolidated financial statements. |
Overview
We are a global manufacturer of differentiated organic chemical products. Our products comprise a broad range of chemicals and formulations, which we market globally to a diversified group of consumer and industrial customers. Our products are used in a wide range of applications, including those in the adhesives, aerospace, automotive, construction products, durable and non-durable consumer products, electronics, insulation, medical, packaging, coatings and construction, power generation, refining, synthetic fiber, textile chemicals and dyes industries. We are a leading global producer in many of our key product lines, including MDI, amines, maleic anhydride, epoxy-based polymer formulations, textile chemicals and dyes. Our revenues for the years ended December 31, 2021, 2020 and 2019 were $8,453 million, $6,018 million and $6,797 million, respectively.
We operate in four segments: Polyurethanes, Performance Products, Advanced Materials and Textile Effects. In August 2017, we separated our Titanium Dioxide and Performance Additives business (the “P&A Business”) through an initial public offering (“IPO”) of ordinary shares of Venator. In December 2020, we began to account for our remaining ownership of 9,688,761 Venator ordinary shares as an investment in equity securities that are marked to fair value with changes in fair value reported in earnings. For more information, see “Note 4. Discontinued Operations and Business Dispositions—Separation and Deconsolidation of Venator” to our consolidated financial statements. On January 3, 2020, we completed the sale of our chemical intermediates businesses, which included PO/MTBE, and our surfactants businesses (collectively, “Chemical Intermediates Businesses”) to Indorama Venture Holdings L.P. (“Indorama”), and beginning in the third quarter of 2019, we reported the results of our Chemical Intermediates Businesses as discontinued operations. For more information, see “Note 4. Discontinued Operations and Business Dispositions—Sale of Chemical Intermediates Businesses” to our consolidated financial statements.
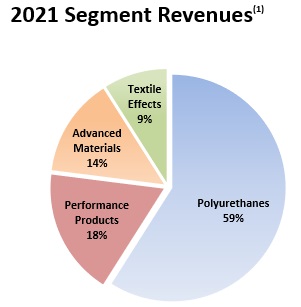
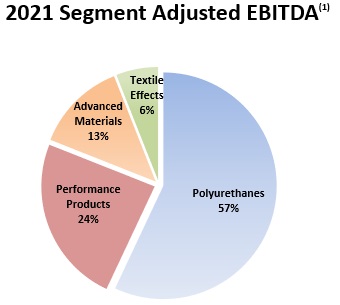
Our Products
All four of our segments produce differentiated organic chemical products. Growth in our differentiated products has been driven by the substitution of our products for other materials and by the level of global economic activity. Accordingly, the profitability of our differentiated products has been somewhat less influenced by the cyclicality that typically impacts the petrochemical industry as a whole.
|
|
|
| (1) |
Percentage allocations in this chart do not give effect to Corporate and other unallocated items and eliminations. For a reconciliation of adjusted EBITDA to net income attributable to Huntsman Corporation and cash provided by operating activities, see “Part II. Item 7. Management’s Discussion and Analysis of Financial Condition and Results of Operations—Results of Operations.” |
The following table identifies the key products, principal end markets and applications, representative customers, raw materials and representative competitors of each of our business segments:
| Product Line |
End Markets / Applications |
Representative Customers |
Raw Materials |
Representative Competitors |
|
|
MDI |
Polyurethane chemicals are used to produce rigid and flexible foams, as well as coatings, adhesives, sealants and elastomers. They are also used in refrigeration and appliance insulation, construction products, automotive, footwear, furniture, cushioning and specialized engineering applications. |
|
|
Benzene =>Nitrobenzene and Aniline |
|||||||||||
| Polyurethanes | Polyols |
Polyols are combined with MDI and other isocyanates to create a broad spectrum of polyurethane products, such as rigid flexible foam and other non-foam applications. |
Adient, Autoneum, Henkel, LafargeHolcim, Lear, Leggett & Platt, Louisiana Pacific, Magna, Pursell, Recticel and West Fraser | PO, polyester polyols and EO |
BASF, Carlisle Construction Materials, Covestro, Dow, Lubrizol and Wanhua Chemical Group |
|||||||||||
| TPU |
TPU is a high-quality, fully-formulated thermal plastic that can be tailored with unique qualities. It can be used in injection molding and small components for automotive and footwear. It is also extruded into films, wires and cables for use in the coatings, adhesives, sealants and elastomers markets. |
Isocyanate (such as MDI) and a polyol |
||||||||||||||
| Performance Products |
Amines |
Amines are a family of intermediate chemicals that are valued for their properties as a reactive agent, emulsifier, dispersant, detergent, solvent or corrosion inhibitor. Amines are used in polyurethane foam, fuel and lubricant additives, paints and coatings, composites, gas treatment, construction materials and semiconductors. |
Afton, Bayer, Chevron Oronite, DuPont, Evonik, Hexion, Infineum, Ingevity, Lubrizol, Olin, PPG, Sherwin-Williams and Quadra | EO, PO, glycols, ethylene dichloride, caustic soda, ammonia, hydrogen, methylamines and acrylonitrile |
BASF, Delamine, Dow, Evonik, Nouryon and Tosoh |
||||||||||
| Maleic anhydride |
Maleic anhydride is an intermediate chemical used primarily to produce unsaturated polyester resins (UPRs). UPRs are mainly used in the production of fiberglass reinforced resins for marine, automotive and construction products. Maleic anhydride is also used in the production of lubricants, food additives and food acidulants. |
Andercol, Chevron Oronite, Cranston, Dixie, Ingevity, Lubrizol, MFG Chemical, Polynt-Reichhold and Tate & Lyle |
Normal butane |
AOC, Bartek, INEOS and Lanxess |
|||||||||||
| Advanced Materials |
Technologically- advanced epoxy, phenoxy, acrylic, polyurethane and acrylonitrile-butadiene-based polymer formulations |
Aerospace and industrial adhesives; composites for aerospace, automotive and oil and gas; electrical power transmission and electric vehicles; automotive industrial and consumer electronics; civil engineering. | Bodo Moeller, Freeman, GMZ, Hilti, Motic (Xiamen), Pidilite, Sherwin-Williams, Siemens, Speed Fair and Syngenta | BLR, epichlorohydrin, amines, polyols, isocyanates, acrylic materials, hardeners, fillers, butadiene and acrylonitrile | 3M, DuPont, Elantas, HB Fuller, Henkel, Hexion, Olin, Sika, Taiyo and Xiongrum | |||||||||||
| High performance thermoset resins and curing agents and toughening agents, and carbon nanotubes additives |
High performance chemical building blocks sold to formulators who develop formulations for aerospace, automotive, oil and gas, coatings, construction, electronics and electrical insulation applications. |
Hexcel, Henkel, Hilti, Omya and Solvay |
Epichlorohydrin, amines, phenols, aminophenols, fatty acids, butadiene and acrylonitrile | BASF, Cardolite, Evonik, Hexion, Kaneka, Mitsubishi, Olin, Solvay and Sumitomo | ||||||||||||
| Textile Effects |
Textile chemicals and dyes |
Textile chemicals improve the performance characteristics of textiles from cotton, polyester, wool, acrylic and nylon, while textile dyes add color to the textiles. These are used in apparel, home and technical textiles. Apparel textiles includes performance apparel, casual wear, formal and intimate apparel. Home and hospitality textiles include textiles that are used within the home or institutions such as hotels. Functional and technical textiles include automotive textiles, carpet, military fabrics protective wear, nonwoven and other technical fabrics. | Esquel Group, Fruit of the Loom, Guilford Mills, Hanesbrands, Kahatex, Nice Dyeing, Sage Automotive, Tencate, Toray Group, Welspun Group, Y.R.C. Textiles and Zaber and Zubair |
Thousands of raw materials, with no one representing more than 7% of raw material costs |
Textile chemicals: Archroma, CHT, Nicca, Rudolf and Transfar/Tannatex Dyes: Archroma, DyStar, Jihua, Longsheng and Runtu
|
|||||||||||
Polyurethanes
General
We are a leading global manufacturer and marketer of a broad range of polyurethane chemicals, including MDI products, polyols and TPU (each discussed in more detail below under “—Products and Markets”). Polyurethane chemicals are used to produce rigid and flexible foams, as well as coatings, adhesives, sealants and elastomers. We focus on the higher-margin, higher-growth markets for specialty MDI and MDI-based polyurethane systems. Volume growth in our Polyurethanes segment has been driven primarily by global economic activity and the continued substitution of MDI-based products for other materials across a broad range of applications. We operate three major polyurethane manufacturing facilities in the U.S., Europe and China. We also operate 29 strategically located downstream facilities, 24 of them are polyurethane formulation facilities, commonly referred to in the chemical industry as “systems houses,” located in close proximity to our customers worldwide, which enables us to focus on customer support, technical service and a differentiated product offering. We also operate two specialty polyester polyol manufacturing facilities focused on the insulation market, three downstream TPU manufacturing facilities in the U.S., Europe and China and two spray foam manufacturing sites located in the U.S. and Canada.
Our customers produce polyurethane products through the combination of an isocyanate, such as MDI, with polyols, which are derived largely from PO and EO. We are able to produce over 2,800 distinct MDI-based polyurethane products by modifying the MDI molecule through varying the proportion and type of polyol used and by introducing other chemical additives to our MDI formulations. As a result, polyurethane products, especially those derived from MDI, are continuing to replace traditional products in a wide range of end-use markets, including insulation in construction and appliances, cushioning for automotive and furniture, coatings, adhesives, wood binders for construction and furniture, footwear and other specialized engineering applications.
We operate a world-scale integrated polyurethane formulations facility and a world-scale research and development campus in China to service our customers in the critical Chinese market, the largest MDI market in the world, and we will support the long-term demand growth that we believe this region will continue to experience. Additionally, we entered into an agreement with Sinopec to form a joint venture to build and operate a world-scale PO/MTBE plant in Nanjing, China utilizing proprietary PO/MTBE manufacturing technology. We own a 49% interest in the joint venture and account for our interest in the joint venture as an equity method investment.
In May 2020, we rebranded our leading spray polyurethane foam (“SPF”) business as Huntsman Building Solutions (“HBS”). HBS was formed through our acquisitions of Icynene-Lapolla, a leading North American manufacturer and distributor of spray polyurethane foam insulation systems for residential and commercial applications, in 2020 (“Icynene-Lapolla Acquisition”) and Demilec (USA) Inc. and Demilec Inc. in 2018. Our SPF products offer significant environmental benefits, as our proprietary manufacturing process transforms low quality PET plastic bottles into highly effective energy-saving polyurethane insulation. HBS offers attractive growth potential as the business turns our lower margin polymeric MDI, the other key ingredient in SPF formulations, into higher margin specialized SPF products.
Products and Markets
MDI is used primarily in rigid foam applications and in a wide variety of customized, higher-value flexible foam as well as coatings, adhesives, sealants and elastomers. Polyols, including polyether and polyester polyols, are used in conjunction with MDI in rigid foam, flexible foam and other non-foam applications. The following chart illustrates the range of product types and end uses for polyurethane chemicals. We produce MDI, polyols and TPU products and do not produce TDI products.
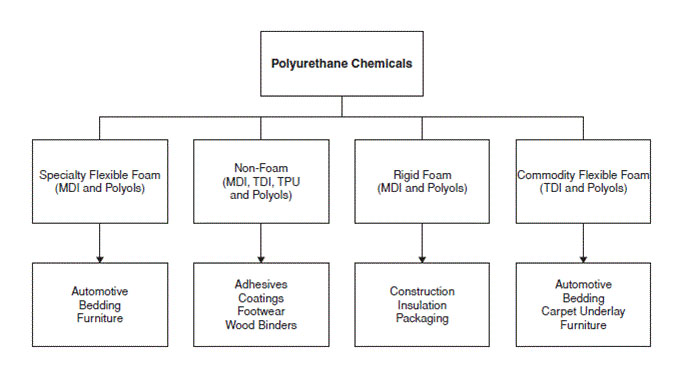
Polyurethane chemicals are sold to customers who combine the chemicals to produce polyurethane products. Depending on their needs, customers will use either component polyurethane chemicals produced for mass sales or polyurethane systems tailored for their specific requirements. By varying the blend, additives and specifications of the polyurethane chemicals, manufacturers are able to develop and produce a breadth and variety of polyurethane products.
Our strategy is focused on growing our differentiated product offering (specialty MDI and polyols, formulated MDI systems and TPU), which requires a greater emphasis on formulating capability to help our downstream customers to meet the desired effect required in their applications. These differentiated products tend to require technical solutions, offer higher margins, lower volatility and are less dependent on industry utilization rates compared to sales of component MDI or component polyols.
MDI. MDI has grown substantially over the past three decades, increasing by a factor of 6% CAGR, well in excess of global GDP. MDI has a substantially larger market size and a higher growth rate than other polyurethane isocyanates. This is primarily because MDI can be used to make polyurethanes with a broader range of properties and can therefore be used in a wider range of applications. We believe that MDI and formulated MDI systems, which combine MDI and polyols, will continue to grow at approximately double the rate of global GDP driven by the mega trends of energy management, food preservation, demographics and urbanization/transportation. MDI offers key products benefits of energy efficiency, comfort and durability aligned with these megatrends. We believe that MDI and formulated MDI systems will continue to substitute for alternative materials such as fiberglass in insulation, phenol formaldehyde in wood binders and TDI in automotive and furniture. Specialty cushioning and insulation applications, thermoplastic polyurethanes and adhesives and coatings will further contribute to the continued growth of MDI. MDI experiences some seasonality in its sales reflecting its exposure to seasonal construction-related end markets such as insulation and composite wood products. Sales generally peak during the spring and summer months in the northern hemisphere, resulting in greater sales volumes during the second and third quarters of the year.
TPU. TPU is a high-quality, fully formulated thermal plastic derived from the reaction of MDI or an aliphatic isocyanate with polyols to produce unique qualities such as durability, flexibility, strength, abrasion-resistance, shock absorbency and chemical resistance. We can tailor the performance characteristics of TPU to help meet the specific requirements of our customers. TPU is used in injection molding and small components for the automotive and footwear industries. It is also extruded into films for apparel, wires and cables for industrial use and in a wide variety of applications in the coatings, adhesives, sealants and elastomers markets.
Polyols. Polyols are combined with MDI and other isocyanates to create a broad spectrum of formulated polyurethane systems. Demand for specialty polyols has been growing at approximately the same rate at which MDI consumption has grown.
Aniline. Aniline is an intermediate chemical used primarily to manufacture MDI. The majority of our aniline is consumed internally with some sold to third parties. We believe that the lack of a significant spot market for aniline means that in order to remain competitive, MDI manufacturers must either be integrated with an aniline manufacturing facility or have a long-term, cost-competitive aniline supply contract.
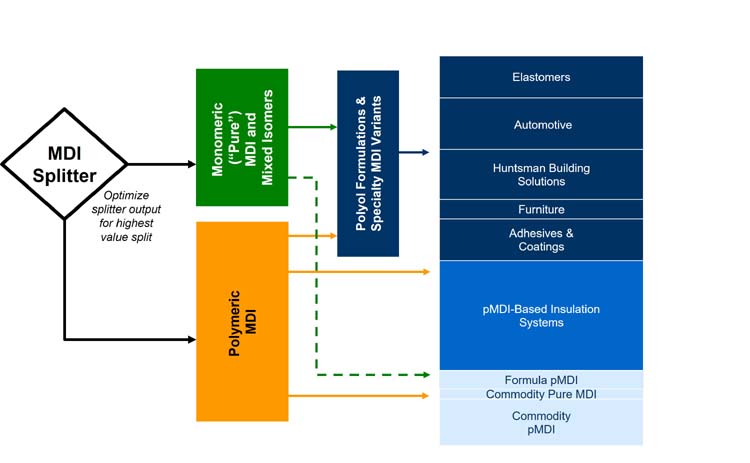
Our strategic focus is on growing our differentiated (specialty MDI and polyols, formulated MDI-based systems and TPU) product offerings and the diagram below provides an overview of that focus with an upgrading of our product portfolio from low margin volumes to higher EBITDA businesses leveraging our technology and experience with the MDI Splitter.
Sales and Marketing
We market our polyurethane chemicals to over 7,500 customers in more than 95 countries. Our sales, marketing and technical resources are organized to support major regional markets and key end-use markets, some of which require a coordinated global approach, such as key accounts across the automotive sector. These key end-use markets include the commercial and residential insulation, appliance, automotive, footwear, furniture and coatings, adhesives, sealants and elastomers industries. We sell both directly and indirectly to customers, the latter via a network of distributors and agents who in turn sell our products to customers who cannot be served as cost effectively by our internal sales groups.
We provide a wide variety of polyurethane solutions as components (i.e., the isocyanate or the polyol) or in the form of “systems”, in which we provide the total isocyanate and polyol formulation to our customers. Our ability to deliver a range of polyurethane solutions and technical support, which can be tailored for the needs of our customers, is critical to our long-term success. We have strategically located our downstream polyurethane systems houses close to our customers, enabling us to focus on customer support and technical service. We believe this customer support and technical service system contributes to customer retention and also provides opportunities for identifying further product and service needs of customers.
Our strategy is to grow the capabilities of our downstream facilities both organically and inorganically. As a result, we have made a number of “bolt-on” acquisitions in recent years to expand our downstream footprint and align with our strategic intent.
We believe that the extensive market knowledge and industry experience of our sales teams and technical experts, in combination with our strong emphasis on customer relationships, have facilitated our ability to establish and maintain long-term customer supply positions. Our sales strategy is to continue to increase sales to existing customers and to attract new customers by providing innovative solutions, quality products, reliable supply, competitive prices and superior customer service.
Manufacturing and Operations
Our world-scale MDI production facilities are located in Geismar, Louisiana; Rotterdam, The Netherlands; and through our joint ventures in Caojing, China. These facilities receive aniline, which is a primary material used in the production of MDI, from our facilities located in Geismar, Louisiana; Wilton, U.K.; and Caojing, China. We believe that this relative scale and product integration of our large facilities is necessary to provide cost competitiveness in MDI production. The following table sets forth the annual production capacity of polyurethane chemicals at select polyurethanes facilities:
| MDI |
Polyols |
TPU |
Aniline |
Nitrobenzene |
||||||||||||||||
| (millions of pounds) |
||||||||||||||||||||
| Caojing, China |
825 | (1) |
||||||||||||||||||
| Geismar, Louisiana |
1,060 | 160 | 706 | (2) |
1,000 | (2) |
||||||||||||||
| Houston, Texas |
168 | |||||||||||||||||||
| Jinshan, China |
44 | |||||||||||||||||||
| Kuan Yin, Taiwan |
49 | |||||||||||||||||||
| Osnabrück, Germany |
26 | 59 | ||||||||||||||||||
| Ringwood, Illinois |
28 | |||||||||||||||||||
| Rotterdam, The Netherlands |
1,036 | 190 | ||||||||||||||||||
| Wilton, U.K. |
783 | 1,045 | ||||||||||||||||||
| Total |
2,921 | 593 | 131 | 1,489 | 2,045 | |||||||||||||||
(1) Represents our share of capacity from SLIC.
(2) Represents our approximately 78% share of capacity under our consolidated Rubicon LLC manufacturing joint venture with Lanxess AG.
At our Geismar, Rotterdam and Caojing facilities we utilize sophisticated proprietary technology to produce MDI. This technology contributes to our position as a low-cost MDI producer.
Key Joint Ventures
Rubicon Joint Venture. Lanxess AG (“Lanxess”) is our joint venture partner in Rubicon LLC (“Rubicon”), which owns aniline, nitrobenzene and DPA manufacturing facilities in Geismar, Louisiana. We are entitled to approximately 78% of the nitrobenzene and aniline production capacity of Rubicon, and Lanxess is entitled to 100% of the DPA production. In addition to operating the joint venture’s aniline, nitrobenzene and DPA facilities, Rubicon operates our wholly-owned MDI, polyol and maleic anhydride facilities at Geismar and is responsible for providing other auxiliary services to the entire Geismar complex. As a result of this joint venture, we are able to achieve greater scale and lower costs for our products than we would otherwise have been able to obtain. Rubicon is consolidated in our financial statements.
Chinese MDI Joint Ventures. We are involved in two related joint ventures which operate MDI production facilities in Caojing, China. SLIC, our manufacturing joint venture with BASF and three Chinese chemical companies, produces MNB, aniline and crude MDI. We effectively own 35% of SLIC and account for our investment under the equity method. HPS, our splitting joint venture with Shanghai Chlor-Alkali Chemical Company, Ltd, manufactures pure MDI, polymeric MDI, MDI variants and formulated MDI systems. We own 70% of HPS and it is consolidated in our financial statements. These projects have been funded by a combination of equity invested by the joint venture partners and borrowed funds.
Chinese PO/MTBE Joint Venture. In November 2012, we entered into an agreement to form a joint venture with Sinopec. The joint venture involved the construction and operation of a PO/MTBE facility in China. Under the joint venture agreement, we hold a 49% interest in the joint venture and Sinopec holds a 51% interest.
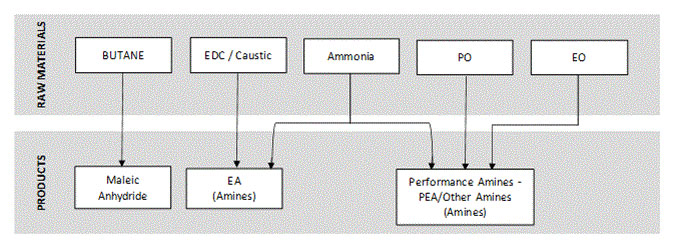
Raw Materials
The primary raw materials for MDI-based polyurethane chemicals are benzene and PO. Benzene is a widely available commodity that is the primary feedstock for the production of MDI and aniline. Historically, benzene has been the largest component of our raw material costs. We purchase benzene from third parties to manufacture nitrobenzene and aniline, almost all of which we then use to produce MDI.
In connection with the sale of the Chemical Intermediates Businesses to Indorama, we entered into a strategic agreement for the supply of PO in North America. In China, the Chinese PO/MTBE joint venture supplies PO into our downstream China business. The strategic supply of PO gives us access to competitively priced PO and the opportunity to develop polyols that enhance our range of MDI products.
Competition
Our major competitors in the polyurethane chemicals market include BASF, Covestro, Dow, Lubrizol and Wanhua Chemical Group. While these competitors and others produce various types and quantities of polyurethane chemicals, we focus on MDI and MDI-based formulated polyurethane systems. Our downstream business is fragmented with different competitors in various markets and regions. Our competitors in downstream markets include Carlisle, Coim and Kingspan. Our polyurethane chemicals business competes in two basic ways: (1) where price is the dominant element of competition, our polyurethane chemicals business differentiates itself by its high level of customer support, including cooperation on technical and safety matters; and (2) elsewhere, we compete on the basis of product performance, our ability to react quickly to changing customer needs and providing customers with innovative solutions to their needs.
Performance Products
General
Our Performance Products segment has leading global positions in the manufacture and sale of amines and maleic anhydride and serves a wide variety of consumer and industrial end markets. Our Performance Products segment is organized by region and product family: amines and maleic anhydride (including licensing).
We produce a wide range of amines, many of which are sold into specialty markets such as epoxy curing agents, oil exploration and production, agrochemicals, and fuel and lubricant additives. We believe we are the largest global producer of polyetheramines, one of the largest producers of 2-(2-amino ethoxy) ethanol, sold under our DGA™ brand, the largest global producer making the full range of ethyleneamines, the second largest producer of morpholine and a leading global producer of low emission polyurethane catalysts. We are the only producer and largest supplier of propylene carbonate and ethylene carbonate in North America. Many of the markets for these products have growth rates in excess of global GDP.
We believe we are the largest global producer of maleic anhydride, a highly versatile chemical intermediate that is used to produce UPRs, which are mainly used in the production of fiberglass reinforced resins for marine, automotive and construction products. Maleic anhydride is also used in the production of lubricants, food additives and artificial sweeteners. We are also a leading licensor of maleic anhydride manufacturing technology.
We produce a variety of products at 10 Performance Products manufacturing facilities in North America, Europe, the Middle East and Asia.
Products and Markets
Amines. Amines are a family of intermediate chemicals that are produced by reacting ammonia, or an alkylamine, with various ethylene and propylene derivatives. Generally, amines are valued for their properties as a reactive agent, emulsifier, dispersant, solvent or corrosion inhibitor. Growth in demand for amines is highly correlated with GDP growth. However, certain segments of the amines market, such as polyetheramines, have historically grown at rates in excess of GDP growth due to new product development, technical innovation and end-use substitution. As amines are generally sold based upon the performance characteristics that they provide to customer-specific end-use applications, pricing does not generally fluctuate directly with movements in underlying raw materials. Our amines business is organized around the following product groups:
| Product Group |
|
Applications |
| Polyetheramines |
Epoxy composites, polyurethane foams and insulation, construction and flooring, paints and coatings, lubricant and fuel additives, adhesives, agrochemicals, oilfield chemicals, printing inks and pigment dispersion |
|
| Ethyleneamines |
Chemical building block used in lubricant and fuel additives, epoxy hardeners, wet strength resins, chelating agents and fungicides |
|
| Specialty amines, including DGA™ Agent and JEFFCAT® catalysts |
Gas treating, agricultural chemicals, personal care, lubricant and fuel additives, polyurethane foams, fabric softeners, paints and coatings, refinery processing and water treating |
Polyetheramines are produced by reacting polyol with ammonia. They provide sophisticated performance characteristics as an additive in the manufacture of highly customized epoxy formulations, enabling customers to penetrate new markets and substitute for traditional curing materials.
Our ethyleneamines are manufactured by reacting EDC and caustic soda with ammonia to produce a range of various ethyleneamines homologues having different molecular weights. Most other producers utilize a reductive amination process, which yields a light slate of ethyleneamines. We believe our heavier slate of homologues allows access to a greater range of markets.
Our amines are used in a wide variety of mainly industrial applications, including composites, paints and coatings, polyurethane foam, fuel and lubricant additives, and solvents. Our key amines customers include Afton, Bayer, Chevron Oronite, DuPont, Evonik, Hexion, Infineum, Ingevity, Lubrizol, Olin, PPG, Sherwin-Williams and Quadra.
Maleic Anhydride (including licensing). Maleic anhydride is a highly versatile chemical intermediate that is used to produce UPRs, which are the main ingredient in fiberglass reinforced resins used for marine and automotive applications and commercial and residential construction products. Maleic anhydride is also used in the production of lubricants, food additives and artificial sweeteners.
| Product Group |
|
Applications |
| Maleic anhydride |
Boat hulls, automotive, construction, lubricant and fuel additives, countertops, agrochemicals, paper and food additives |
|
| Maleic anhydride and other technology licensing |
Maleic anhydride and 1-4 butanediol (BDO) and other process technologies |
Maleic anhydride is produced by oxidizing either benzene or normal butane through the use of a catalyst. Our maleic anhydride technology is a proprietary fixed bed butane-based process with a solvent recovery and refining system. We believe that our process is superior in the areas of feedstock and energy efficiency and solvent recovery. The maleic anhydride-based route to BDO manufacture is currently the preferred process technology and is favored over the other routes, which utilize PO, butadiene or acetylene as feedstocks. As a result, the growth in demand for BDO supports growing demand for our maleic anhydride technology. Generally, changes in price have resulted from a combination of changes in industry capacity utilization and underlying raw material costs.
We license our maleic anhydride technology and other technologies worldwide. Revenue from licensing comes from new plant commissioning, as well as current plant retrofits. Our licensing group also supports licensing efforts for our other segments.
Our key maleic anhydride customers include Andercol, Chevron Oronite, Cranston, Dixie, Ingevity, Lubrizol, MFG Chemical, Polynt-Reichhold and Tate & Lyle.
Sales and Marketing
We sell approximately 250 products to over 950 customers globally through our Performance Products regional sales and marketing organizations, which have extensive market knowledge, considerable chemical industry experience and well-established customer relationships.
In more specialty products for certain markets (e.g., lubricants, coatings, construction, agrochemicals, oilfield, automotive, gas treating and insulation), our marketing efforts are focused on how our product offerings perform in certain customer applications. We believe that this approach enhances the value of our product offerings and creates opportunities for ongoing differentiation in our development activities with our customers.
We provide extensive pre- and post-sales technical service support to our customers where our technical service professionals work closely with our research and development functions to tailor our product offerings to meet our customers unique and changing requirements. These technical service professionals interact closely with our marketing managers and business leadership teams to help guide future offerings and market approach strategies. In addition to our focused direct sales efforts, we maintain an extensive global network of distributors and agents that also sell our products. These distributors and agents typically promote our products to smaller end-use customers who cannot be served cost effectively by our direct sales forces.
Manufacturing and Operations
Our Performance Products segment has the capacity to produce a variety of products at 10 manufacturing locations in North America, EAME and Asia. These production capacities are as follows:
| North |
||||||||||||||||
| Product Area |
America |
EAME |
APAC |
Total |
||||||||||||
| (millions of pounds) |
||||||||||||||||
| Amines |
550 | 227 | (1) | 107 | 884 | (1) | ||||||||||
| Maleic anhydride |
340 | 231 | — | 571 | ||||||||||||
|
|
|
| (1) | Includes 70 million pounds from AAC, our consolidated 50%-owned joint venture, located in Jubail, Saudi Arabia. |
Our amines facilities are located globally. These facilities have a competitive cost base and use modern manufacturing units that allow for flexibility in production capabilities and technical innovation.
A number of our facilities are located within large integrated petrochemical manufacturing complexes. We believe this results in greater scale and lower costs for our products than we would be able to obtain if these facilities were stand-alone operations. These include our maleic anhydride facilities in Pensacola, Florida, Geismar, Louisiana and Moers, Germany and our ethyleneamines facility in Freeport, Texas.
Joint Venture
We consolidate the results of AAC, our 50%-owned joint venture with the Zamil Group. AAC operates an ethyleneamines manufacturing plant in Jubail, Saudi Arabia. The plant has an approximate annual capacity of 70 million pounds. We purchase and sell all of the production from this joint venture.
Raw Materials
The main raw materials used in the production of our amines are EO, PO, glycols, EDC, caustic soda, ammonia, hydrogen, methylamines and acrylonitrile. The majority of these raw materials are available from multiple sources in the merchant market at competitive prices.
Maleic anhydride is produced by the reaction of normal butane with oxygen. The principal raw material is normal butane, which is purchased pursuant to long-term contracts and delivered to our Pensacola, Florida site by barge, to our facility in Geismar, Louisiana via pipeline and to our Moers, Germany site by railcar.
Competition
There are a small number of competitors for many of our amines due to the considerable customization of product formulations, the proprietary nature of many of our product applications and manufacturing processes and the relatively high research and development and technical costs involved. Our global competitors include BASF, Delamine, Dow, Evonik, Nouryon and Tosoh. We compete primarily on the basis of product performance, new product innovation and, to a lesser extent, on the basis of price.
In our maleic anhydride market, we compete primarily on the basis of price, customer service, technical support and logistics management. Our competitors include AOC, Bartek, INEOS and Lanxess. In our maleic anhydride technology licensing market, our primary competitor is Conser. We compete primarily on the basis of technological performance and service.
Advanced Materials
General
Our Advanced Materials segment is a leading global manufacturer and marketer of technologically-advanced epoxy, phenoxy, acrylic, polyurethane, mercaptan and acrylonitrile butadiene-based polymer products. We focus on formulations and systems that are used to address customer-specific needs in a wide variety of industrial and consumer applications. Our products are used either as replacements for traditional materials or in applications where traditional materials do not meet demanding engineering specifications. For example, structural adhesives are used to replace metal rivets and advanced composites are used to replace traditional aluminum panels and other steel materials to lighten structures in aerospace, automotive and other transportation. Our Advanced Materials segment is characterized by the breadth of our product offering, our expertise in complex chemistry, our long-standing relationships with our customers, our ability to develop and adapt our technology and our applications expertise for new markets and new applications.
We operate synthesis, formulating and production facilities in North America, Europe, Asia and South America. We sell to over 2,400 customers in the following end markets: aerospace, automotive, oil and gas, liquid natural gas transport, coatings and construction, printed circuit boards, consumer, industrial and automotive electronics, consumer and industrial appliances, electrical power transmission and distribution, recreational sports equipment, medical appliances and food and beverage packaging.
Products and Markets
Aerospace. Our Advanced Materials segment is a leading global supplier of advanced, high-performance materials for the fabrication and repair of aircraft components. We supply leading aerospace companies with innovations in composites, adhesives, laminating and repair systems, alongside innovative carbon nanotube technologies.
We offer a wide range of materials to the aerospace market under the ARALDITE®, EPIBOND®, EPOCAST®, URALANE® and MIRALON® brands. Many of these products are qualified under the specification of major aerospace original equipment manufacturers (“OEM”), complying with appropriate regulations governing large civil aircraft.
Transportation and Industrial. We offer to the automotive, recreational sports equipment and industrial composite markets, including leading automotive OEM’s and Tier 1 suppliers, high end composite formulations, specialty resins and toughening agents. Lightweight, strength, flexibility, shorter cycle time and fatigue resistance are key requirements of our industrial partners.
ARALDITE® is an important brand in high-performance adhesive technologies. We offer formulation expertise in various chemistries, including epoxies, polyurethanes, methacrylates, phenolics, mercaptan and acrylonitrile-butadiene-based polymer products. Our materials address requirements such as long open times for large area applications, fast-curing adhesives for early removal and rapid through-put, resistance to high temperature, water and chemicals, thixotropy for gap-filling or vertical applications, and toughness, impact-resistance and elasticity to cope with different thermal expansions when bonding larger structures. Our adhesives are used in a large variety of industrial applications.
Electrical Engineering and Electronics. We are a leading global supplier of insulating materials for motors, generators, switchgears, distribution and instrument transformers, and insulators and bushings for utility and industrial applications. The products formulated by our Advanced Materials segment are designed to provide an extended service life and meet specific industry requirements for electrical insulation in indoor and outdoor environments.
In the field of electronics, our Advanced Materials segment has a long history delivering a wide range of solutions meeting stringent requirements for electronics applications, such as high temperature and chemical resistance, flame-retardancy and excellent mechanical and dielectric properties.
The strong global push for e-vehicles opens new opportunities in e-motor thermal management and battery performance enhancement with our innovative encapsulants, toughening agents and carbon materials.
Coatings and Construction. We offer expertise in curing and toughening technologies and a portfolio of specialized resins and additives to the manufacturers of paints and construction materials. Our specialty resins and additives, including epoxy hardeners, phenoxy and acrylonitrile-butadiene reactive liquid polymers and high solid or water-based components, enable customers to address challenging industry requirements such as resistance to aggressive chemicals and high temperature, adhesion to difficult substrates, excellent mechanical properties, high drying speed and easy re-coatability, low temperature and sub-zero cure. Our product technologies enhance performance and productivity at low VOC and environmental impact in several coatings and construction applications, like heavy duty protection, marine, transportation, food packaging, flooring and chemical anchoring.
Sales and Marketing
We maintain multiple routes to market to service our diverse and fragmented customer base throughout the world. These routes to market range from using our own direct sales force, technically-oriented distribution to mass distribution. Our direct sales force focuses on engineering solutions for our major customers who purchase significant amount of product. We use technically-oriented specialist distributors to augment our sales effort in niche markets and applications where we do not believe it is appropriate to develop direct sales resources. We use mass general distribution channels to sell our products into a wide range of general applications where technical expertise is less important, which reduces our overall selling expenses. We believe our use of multiple routes to market enables us to reach a broader customer base at an efficient cost.
We conduct sales activities through dedicated regional sales teams in EMEAI, Asia and the Americas. Our global customers are covered by key account managers who are familiar with the specific requirements of these customers. The management of long-standing customer relationships is critical to the sales and marketing process.
Manufacturing and Operations
We are a global business serving customers in three principal geographic regions: EAMEI, Asia and the Americas. To service our customers efficiently, we maintain manufacturing plants around the world with a strategy of global, regional and local manufacturing employed to optimize the level of service and minimize the cost to our customers. The following table summarizes the plants that we operate:
| Description of Facility |
||
| Location |
Synthesis |
Formulations |
| Akron, Ohio | ✓ | |
| Ashtabula, Ohio | ✓ | ✓ |
| Bad Säckingen, Germany |
✓ |
|
| Bergkamen, Germany |
✓ |
|
| Duxford, U.K. |
✓ |
✓ |
| East Lansing, Michigan |
✓ |
|
| Harrison City, Pennsylvania | ✓ | |
| Ho Chi Minh City, Vietnam |
✓ |
|
| Los Angeles, California |
✓ |
|
| McIntosh, Alabama |
✓ |
✓ |
| Maple Shade, New Jersey | ✓ | |
| Monthey, Switzerland |
✓ |
✓ |
| Pamplona, Spain |
✓ |
|
| Panyu, China(1) |
✓ |
✓ |
| Rock Hill, South Carolina | ✓ | ✓ |
| Taboão da Serra, Brazil |
✓ |
|
(1) 95%-owned and consolidated manufacturing joint venture with Guangzhou Sheng’an Package Company Limited.
Raw Materials
The principal raw materials we purchase for the manufacture of basic and advanced epoxy resins are epichlorohydrin, bisphenol A, MDA, phenol and aminophenols. We also purchase amines, polyols, isocyanates, acrylic materials, hardeners and fillers for the production of our formulated polymer systems and complex chemicals and additives. In our specialty nitrile latexes and carboxyl terminated acrylonitrile-butadiene copolymer product lines, acrylonitrile and butadiene are the main raw materials purchased. For production of mercaptan curatives, we purchase polyols, epichlorohydrin and hydrogen sulfide. Raw material costs constitute a sizeable percentage of the costs for certain applications. We have supply contracts with a number of suppliers. The terms of our supply contracts vary, but, in general, these contracts contain provisions that set forth the quantities of product to be supplied and purchased. Formula pricing is sometimes used if advantageous for the business.
Additionally, we produce large volumes of some of our most important raw materials, such as BLR and its basic derivatives, which are the basic building blocks of many of our products.
We consume certain amines produced by our Performance Products segment and isocyanates produced by our Polyurethanes segment, which we use to formulate Advanced Materials products.
Competition
The markets in which our Advanced Materials segment competes are diverse and require an appropriate human capital and asset footprint to compete effectively. The competitive intensity, capital investment and development of proprietary technology and maintenance of product research and development are all market specific. We operate dedicated technology centers in Basel, Switzerland; The Woodlands, Texas; Merrimack, New Hampshire, and Shanghai, China in support of our product and technology development. Among our competitors are some of the world’s largest chemical companies with integrated raw material value chains to formulation companies that leverage intellectual and highly proprietary technology for problem solving.
Aerospace. Our leading market position is driven by our specialty resins, curing and toughening agents and formulations offerings backed by customer-specific certifications, quality and consistency. These products are value-added, and differentiated, backed by many years of reliable global supply and service. Our major competitors include 3M, Henkel, Hexion, Kaneka, Solvay, Sumitomo and Wakayama Seika.
Transportation and Industrial. Our composite and adhesive markets are being driven by light weighting, cost effective production and assembling, and are serviced by our leading positions in systems formulations, curing and toughening technologies, backed by application and process manufacturing knowledge. Our product offering allows for reliable and competitive solutions, with a strong ARALDITE® brand reputation, a robust supply chain and a specialized distribution channel to fulfill customers’ expectant demand for service and quality. Our major competitors include 3M, DuPont, HB Fuller, Henkel, Hexion, Kaneka, Mitsubishi and Sika.
Electrical Engineering and Electronics. Our competitive position in these diverse markets is primarily based on formulations expertise, product reliability and performance, process expertise and technical support. Our competitive strengths result from our focus on defined market segment needs, our long-standing customer relationships, product reliability and technical performance, and reputation and recognition as a quality supplier. Our major competitors in these markets are 3M, Elantas, Hexion, Hitachi, Lord, Nagase, Peters, Taiyo and Xiongrun.
Coatings and Construction. Our long-standing position in these markets is served by our specialty resins and additives. Our additives and specialty resins offerings, including epoxy hardeners, phenoxy and acrylonitrile-butadiene reactive liquid polymers and high solid or water-based components, are value-added products that allow our customers to differentiate their own products. Our major competitors include Allnex, BASF, EMS, Evonik, Hexion, Kaneka, Kukdo and Nissan.
Textile Effects
Our Textile Effects segment is a major global solutions provider in the wet processing of textiles across pretreatment, coloration, printing and finishing and provides a diverse portfolio of textile chemicals and dyes. Our textile solutions provide color and enhance the aesthetic, durability and performance of finished textiles, including functionality such as wrinkle resistance and water and stain repellence. Our Textile Effects segment is characterized by the breadth of our product offering and long-standing relationships with our customers and downstream brands and retailers and OEMs (e.g., in the automotive sector).
We market products to customers in multiple end-markets, including consumer fashion apparel, sportswear, career and uniform apparel, military, automotive, home and hospitality textiles and furnishings, carpet and other functional textiles. Competition within these markets is generally fragmented with few competitors who can offer complete solutions for each market. We develop and adapt our technology and our applications expertise for new markets and new applications to improve our competitive offering. Increased environmental regulations, particularly in many parts of Asia, and consumer awareness about the environmental impact of the apparel industry has resulted in increased demand for sustainably produced textiles. We are at the forefront of developing sustainable textiles with advanced technology such as non-fluorinated durable water repellence, and eco-friendly digital printing. Our award-winning AVITERA® reactive dyeing technology meets global industry environmental standards and helps textile mills increase yield, improve productivity and reduce processing costs by significantly reducing water and energy consumption. We operate 10 synthesis and formulation production sites in Asia, Europe and the Americas.
Products and Markets
Textile Chemicals. Our product offering in textile chemicals covers process and effect chemicals for the entire wet processing of textiles, such as pretreatment, optical brightener, dyeing and printing processes and finishing effects such as UV-protection, flame-retardancy, wrinkle resistance, water and oil repellency, moisture management and enhanced textile comfort.
We own a portfolio of textile chemical brands such as PHOBOTEX®, which is used in the sportswear sector and for outdoor textiles for products that provide non-fluorinated durable water repellency, UVITEX®, which is used for products that provide lasting white in the apparel sector to T-shirts and formal shirts as well as in in the home textile sector for towels and bed sheeting, and PYROVATEX®, which is used for products that provide non-halogenated flame-retardancy to functional textiles like protective workwear and textile insulation material used in the automotive sector.
Dyes. We provide dyes for all major fibers, including cotton, polyester, wool, nylon, silk and acrylic, each of which requires different dye chemistry for optimum results. We develop and offer processes for technological applications of dyes that enable our customers to improve their production yield and reduce their water and energy consumption. We focus on high-quality specialty dyes, which sets us apart from our Asian competitors who are primarily focused on commodity dyes. We are able to differentiate ourselves from industry competitors by providing solutions for a broad range of fiber blended fabrics.
We own a portfolio of dye brands such as AVITERA®, for dyes used in T-shirts, formal shirts and towels for achieving sustainability, NOVACRON®, for dyes used widely across casual wear and home textiles, LANASOL®, for dyes used in wool formal suits, TERASIL®, for dyes used in sportswear, outerwear, home textiles and furnishings, ERIOFAST®, for dyes used in high-end intimate apparel and lingerie, TERATOP®, for dyes used across the automotive industry and NOVASOL®, for dyes used across military, protective wear and other technical textiles.
Markets. Textiles generally involve a complex matrix of fibers, colors, effects and functionality, and the resulting products range from fashion apparel to bulletproof vests, home and hospitality textiles to carpet, and upholstery to automotive interiors. Our broad range of dyes and chemicals enhance both the aesthetic appearance of these products and the functionality needed to ensure that they perform in their end-use markets. Since the requirements for these markets vary dramatically, our business strategy focuses on three major end markets—apparel, home and hospitality furnishings and functional and technical textiles. We work to provide the right balance of products and service to meet the technical and environmental challenges in each of these markets.
The apparel market focuses on products that provide an aesthetic effect through colors, as well as comfort and performance effects. Our solutions also extend to improving the processing efficiency within the textile mill. We offer a complete range of colors for cotton, polyester, wool and nylon that cover the range of shades needed for casualwear, sportswear, intimate apparel and formal wear. Our dyes have been developed to ensure that they offer the highest levels of color durability currently available in the market. Our Textile Effects segment’s AVITERA® dyes meet global industry environmental standards and helps textile mills increase yield, improve productivity and reduce processing costs by reducing water and energy consumption. Pretreatment and dyeing auxiliaries ensure that these fabrics are processed efficiently and effectively—cleaning the fabrics with fewer chemicals, less energy and less water and thereby minimizing the environmental footprint and reducing the processing costs. Silicone softeners may be used to enhance the feel of products. Our Textile Effects segment has developed advanced non-fluorinated durable water repellent technology that enhances the performance levels of sportswear and outdoor wear offering comfort and durability.
Home and hospitality textiles include bed linen, towels, curtains, carpets, upholstery, mattress ticking and other textiles that are used within the home or institutions, such as hotels. Dyes and chemicals technology for these applications enhance color and shape durability, comfort, prevent color fading and enable limitless design possibilities for consumers. Optical brighteners and other pretreatment products provide “bright white” effects for towels and sheeting.
Functional and technical textiles include automotive textiles, carpet, military fabrics protective wear, nonwoven and other technical fabrics. Though the product groups may differ in their end uses, the articles must provide a high-level of functionality, durability and performance in their respective markets. High-lightfast dyes and UV absorbers are used in automotive interiors and outdoor furnishings to provide colors that do not fade when exposed to sunlight and heat. Powerful stain repellent and release technology imparts durable protection for upholstery, military and medical fabrics, without affecting the color, breathability or feel of the fabric. Specialized dyes and prints create unique camouflage patterns for military uniforms, backpacks and tarps that will not fade through wash and wear or during exposure to the elements.
Sales and Marketing
During 2021, approximately 62% of our sales were generated with more than 1,500 direct customers through our global sales and technical services network and the remaining 38% is generated through our distribution partners. Our sales and technical services representatives work directly with our existing customers forming strong relationships and uncovering new opportunities. Demand for our products is subject to fabric trends and seasonal changes in connection with summer and winter fashion trends. Traditionally, sales generally peak in the second quarter of the year as textile mills prepare for the winter fashion trends which tend to use darker shades and heavier fabric, thereby using more of our products.
In determining the markets on which we focus, we look at growth opportunity and value proposition. Consumption markets are primarily in developed economies, such as Europe and North America, while production markets are primarily in Asia, particularly China, India, Taiwan, Vietnam, Indonesia and Bangladesh. Our downstream marketing team engages with leading brands and retailers in developed economies while our sales force and manufacturing footprint are primarily in Asia, closer to the manufacturing and sourcing base for textiles. We believe that this set-up also enables us to take advantage of continuous demand growth due to demographic and lifestyle changes in emerging markets.
For our textile effects products, we focus on providing effect competence and process competence to our customers. Effect competence, which we define as delivering value-added effects to our customers’ products, enables us to capitalize on new and innovative technologies and to assist our customers in their efforts to differentiate themselves from competitors. Process competence, which we define as applying know-how and expertise to improve customers’ processes, allows us to utilize our technical service to reduce cost, enhance efficiency and offer recommendations to improve the ecological and environmental footprint in the wet processing of textiles.
We maintain strong customer relationships through the delivery of high levels of technical service and product innovation. There are 12 technical services laboratories in North America, South America, Europe and Asia that are close to our customers in these markets, which enables us to serve our customers with greater speed and flexibility.
Manufacturing and Operations
We are a global business serving customers in three principal geographic regions: EAME, the Americas and Asia. To service our customers efficiently, we maintain manufacturing plants around the world with a strategy of global, regional and local manufacturing employed to optimize the level of service and minimize the cost to our customers. The following table summarizes the capabilities of each of the plants that we operate:
| Description of Facility |
||||||||
| Textile Chemicals |
Dyes |
|||||||
| Location |
|
Synthesis |
|
Formulation |
|
Synthesis |
|
Formulation |
| Atotonilquillo, Mexico |
✓ |
✓ |
✓ |
✓ |
||||
| Baroda, India |
✓ |
✓ |
✓ |
|||||
| Bogota, Colombia |
✓ |
|||||||
| Charlotte, North Carolina |
✓ |
|||||||
| Fraijanes, Guatemala |
✓ |
|||||||
| Gandaria, Jakarta, Indonesia |
✓ |
✓ |
||||||
| Langweid am Leich, Germany |
✓ |
✓ |
||||||
| Panyu, China(1) |
✓ |
✓ |
||||||
| Samutsakorn (Mahachai), Thailand |
✓ | ✓ |
✓ |
|||||
| Taboão da Serra, Brazil |
✓ |
|||||||
|
|
|
| (1) |
95%-owned and consolidated manufacturing joint venture with Guangzhou Sheng’an Package Company Limited. |
Raw Materials
The manufacture of textile effects products requires a wide selection of raw materials (more than 1,000 different chemicals), including amines, ethoxylates, acrylics and sulfones. No one raw material represents greater than 7% of our textile effects raw material expenditures. Raw material costs constitute a sizeable percentage of sales for certain applications. We have tolling arrangements with several Chinese suppliers, but the majority of our raw materials are not purchased under long-term contracts. The terms of our supply contracts vary, but in general, these contracts contain provisions that set forth the quantities of product to be supplied and purchased.
Competition
We are a major global solutions provider for textile chemicals and dyes in our chosen markets. Competition within the textile chemicals and dyes markets is generally fragmented with few competitors who can offer complete solutions for the entire textile markets. Key competitors within textile chemicals include Archroma, CHT, Nicca, Rudolf and Transfar/Tannatex. Key competitors within dyes include Archroma, DyStar, Jihua, Longsheng and Runtu.
We believe that our competitive strengths include our product offering, which is characterized by its broad and deep technology range, high quality, significant integration between products and service, reliable technical expertise, long-standing relationships with customers, and strong business infrastructure in Asia. We are a leader in environmentally sustainable chemistry with products that help customers enhance efficiency and reduce their environmental footprint. We believe that we have more customer service capability and account management capability than any of our competitors worldwide. In addition, we engage regularly with downstream brands and retailers on industry and sustainability issues.
RESEARCH AND DEVELOPMENT
We support our businesses with a major commitment to research and development, technical services and process engineering improvement. Our research and development centers are located in The Woodlands, Texas; Everberg, Belgium; Basel, Switzerland; Merrimack, New Hampshire; and Shanghai, China. Other process development/technical service centers are located in Deggendorf, Germany, Auburn Hills, Michigan and Derry, New Hampshire (Polyurethanes); Monthey, Switzerland, MacIntosh, Alabama and Akron, Ohio (Advanced Materials); Panyu, China (Advanced Materials and Textile Effects); and Mumbai, India (Textile Effects).
INTELLECTUAL PROPERTY RIGHTS
Proprietary protection of our processes, apparatuses and other technology and inventions is important to our businesses. We own approximately 3,080 unexpired patents and have approximately 1,055 patent applications (including provisionals) currently pending. While a presumption of validity exists with respect to issued U.S. patents, we cannot assure that any of our patents will not be challenged, invalidated, circumvented or rendered unenforceable. Furthermore, we cannot assure the issuance of any pending patent application, or that if patents do issue, that these patents will provide meaningful protection against competitors or against competitive technologies. Additionally, our competitors or other third parties may obtain patents that restrict or preclude our ability to lawfully produce or sell our products in a competitive manner.
We also rely upon unpatented proprietary know-how and continuing technological innovation and other trade secrets to develop and maintain our competitive position. There can be no assurance, however, that confidentiality and other agreements into which we enter and have entered will not be breached, that they will provide meaningful protection for our trade secrets or proprietary know-how, or that adequate remedies will be available in the event of an unauthorized use or disclosure of such trade secrets and know-how. In addition, there can be no assurance that others will not obtain knowledge of these trade secrets through independent development or other access by legal means.
In addition to our own patents and patent applications and proprietary trade secrets and know-how, we are a party to certain licensing arrangements and other agreements authorizing us to use trade secrets, know-how and related technology and/or operate within the scope of certain patents owned by other entities. We also have licensed or sub-licensed intellectual property rights to third parties.
We have associated brand names with a number of our products, and we have approximately 4,600 trademark registrations and 395 pending trademark applications globally. These registrations and applications include extensions of protection under the Madrid system for the international registration of marks. However, there can be no assurance that the trademark registrations will provide meaningful protection against the use of similar trademarks by competitors, or that the value of our trademarks will not be diluted.
Because of the breadth and nature of our intellectual property rights and our business, we do not believe that any single intellectual property right (other than certain trademarks for which we intend to maintain the applicable registrations) is material to our business. Moreover, we do not believe that the termination of intellectual property rights expected to occur over the next several years, either individually or in the aggregate, will materially adversely affect our business, financial condition or results of operations.
HUMAN CAPITAL MANAGEMENT
As of December 31, 2021, we employed approximately 9,000 associates in our operations around the world. Approximately 2,000 of these employees are located in the U.S., while approximately 7,000 are located in other countries.
We believe our employees are the foundation of our success. Our overall talent acquisition and retention strategy is designed to attract and retain diverse and qualified candidates to meet our performance goals on an ongoing basis and enable the success of our Company. Our key areas of focus include:
Health and Safety: Our global health and safety programs are designed around dedicated environmental, health and safety ("EHS") Standards and Procedures specifically tailored at the facility level to address the different jurisdictions and regulations, specific operating hazards and unique working environments. The Company’s objectives focus on regulatory compliance and protection of people and the environment. Compliance with the EHS Standards and Procedures are evaluated through site self-audits as well as regularly scheduled Corporate EHS audits. In addition, other management systems applicable to many of our sites include third party verification of Responsible Care® and ISO 14001. A key metric used to assess the safety performance of our operations is the ASTM 2920 Level 1 injury rate, which follows a uniform international method for recording occupational injuries and illnesses. In the years ended December 31, 2021 and 2020, we had injury rates of 0.10 and 0.11, respectively.
Ethics and Compliance: At Huntsman our commitment to our values of Honesty, Integrity, Respect and Responsibility unite us globally and fosters high ethical standards in our relationships with each other, with our customers and with all those we do business with. Our Business Conduct Guidelines, along with the policies and procedures referenced within the guidelines, provide guidance for all employees on topics such as anti-corruption and bribery, anti-trust and competition law, discrimination including our policy on harassment and retaliation, privacy, appropriate use of company assets, protecting confidential information and reporting concerns and violations. The guidelines are used to reinforce our commitment to operating in a fair, honest, responsible and ethical manner and to emphasize the importance of having an open and welcoming environment in which all employees feel empowered to do what is right. Should potential violations of the guidelines, policies, procedures or the law occur, employees are encouraged to voice concerns promptly and are reminded that we do not tolerate retaliation against anyone who reports a potential violation in good faith. All employees are required to complete the training on the Business Conduct Guidelines annually, and our Chief Compliance Officer reports matters related to the Business Conduct Guidelines to the Audit Committee of our Board of Directors on a quarterly basis.
Compensation and Benefits: Our policy is to competitively compensate our associates and to appropriately motivate associates to provide value to our shareholders. Our compensation philosophy is to align both short-term and long-term incentives with our strategic objectives and to take into account market forces, best practices, and the performance of our Company and the employee. We offer employees benefits that vary by country and are designed to meet or exceed local laws and to be competitive in the marketplace. Examples of benefits offered in the U.S. include a 401(k) plan with employer contributions, health benefits, business travel and life/disability insurance, supplemental voluntary insurance and paid time off.
Training and Talent Development: We are committed to the continued development of our workforce. We provide technical and leadership training to our associates, customers and suppliers who work for or with our products and services. Training is provided in a number of formats to accommodate the learner’s style, pace, location, technological knowledge and access.
ENVIRONMENTAL, HEALTH AND SAFETY MATTERS
General
We are subject to extensive federal, state, local and international laws, regulations, rules and ordinances relating to occupational health and safety, process safety, pollution, protection of the environment and natural resources, product management and distribution, and the generation, storage, handling, transportation, treatment, disposal and remediation of hazardous substances and waste materials. In the ordinary course of business, we are subject to frequent environmental inspections and monitoring and occasional investigations by governmental enforcement authorities. In addition, our production facilities require operating permits that are subject to renewal, modification and, in certain circumstances, revocation. Actual or alleged violations of safety laws, environmental laws or permit requirements could result in restrictions or prohibitions on plant operations or product distribution, substantial civil or criminal sanctions, or injunctions limiting or prohibiting our operations altogether. In addition, some environmental laws may impose liability on a strict, joint and several basis. Moreover, changes in environmental regulations could inhibit or interrupt our operations, or require us to modify our facilities or operations and make significant environmental compliance expenditures. Accordingly, environmental or regulatory matters may cause us to incur significant unanticipated losses, costs or liabilities. Information related to EHS matters may also be found in other areas of this report including “—Item 1A. Risk Factors,” “Note 2. Summary of Significant Accounting Policies—Environmental Expenditures” to our consolidated financial statements and “Note 21. Environmental Health and Safety Matters” to our consolidated financial statements.
Environmental, Health and Safety Systems
We are committed to achieving and maintaining compliance with all applicable EHS legal requirements, and we have developed policies and management systems that are intended to identify the multitude of EHS legal requirements applicable to our operations, enhance compliance with applicable legal requirements, improve the safety of our employees, contractors, community neighbors and customers and minimize the production and emission of wastes and other pollutants. We cannot guarantee, however, that these policies and systems will always be effective or that we will be able to manage EHS legal requirements without incurring substantial costs. Although EHS legal requirements are constantly changing and are frequently difficult to comply with, these EHS management systems are designed to assist us in our compliance goals while also fostering efficiency and improvement and reducing overall risk to us. For the years ended December 31, 2021, 2020 and 2019, our capital expenditures for EHS matters totaled $45 million, $28 million and $42 million, respectively, and our estimated capital expenditures for 2022 is expected to be $65 million.
Environmental Remediation
We have incurred, and we may in the future incur, liabilities to investigate and clean up waste or contamination at our current or former facilities or facilities operated by third parties at which we may have disposed of waste or other materials. Similarly, we may incur costs for the cleanup of waste that was disposed of prior to the purchase of our businesses. Under some circumstances, the scope of our liabilities may extend to damages to natural resources.
In cases where our potential liabilities arise from historical contamination based on operations and other events occurring prior to our ownership of a business or specific facility, we frequently obtain an indemnity agreement from the prior owner addressing remediation liabilities arising from pre-closing conditions. We have successfully exercised our rights under these contractual covenants for a number of sites and, where applicable, mitigated our ultimate remediation liabilities. We cannot assure you, however, that the liabilities for all such matters subject to indemnity will be honored by the prior owner or that our existing indemnities will be sufficient to cover our liabilities for such matters.
Based on available information and the indemnification rights we believe are likely to be available, we believe that the costs to investigate and remediate known contamination will not have a material effect on our financial statements. However, if such indemnities are not honored or do not fully cover the costs of investigation and remediation or we are required to contribute to such costs, then such expenditures may have a material effect on our financial statements. At the current time, we are unable to estimate the total cost, exclusive of indemnification benefits, to remediate contaminated sites.
Regulatory Matters
Greenhouse Gas Regulation and Climate Change
Globally, our operations are increasingly subject to regulations that seek to reduce emissions of greenhouse gases (“GHGs”), such as carbon dioxide and methane, which may be contributing to changes in the earth’s climate. At the Durban negotiations of the Conference of the Parties to the Kyoto Protocol in 2012, a limited group of nations, including the European Union (the “EU”), agreed to a second commitment period for the Kyoto Protocol, an international treaty that provides for reductions in GHG emissions. More significantly, the EU GHG Emissions Trading System (“ETS”), established pursuant to the Kyoto Protocol to reduce GHG emissions in the EU, continues in its fourth phase. The European Commission established a market stability reserve to address a surplus of allowances and improve the system’s resilience that started operating in 2019. In addition, the EU has set a binding target to reduce domestic GHG emissions by at least 40% below the 1990 level by 2030 and a binding target to increase the share of renewable energy to at least 32% of the EU’s energy consumption by 2030. In July 2021, the European Commission proposed legislation to increase the greenhouse gas emission reduction target to at least 55% and the renewable energy target to 40%.
In addition, at the 2015 United Nations Framework Convention on Climate Change in Paris, the U.S. and nearly 200 other nations entered into an international climate agreement, which went into effect in November 2016 (the “Paris Agreement”). Although the agreement does not create any binding obligations for nations to limit their GHG emissions, it does include pledges to voluntarily limit or reduce future emissions. On June 1, 2017, former U.S. President Trump announced that the U.S. would withdraw from the Paris Agreement, and the U.S. completed the process of withdrawing from the Paris Agreement on November 4, 2020. However, on January 20, 2021, U.S. President Biden issued written notification to the United Nations of the United States’ intention to rejoin the Paris Agreement, which became effective on February 19, 2021. In addition, in September 2021, U.S. President Biden publicly announced the Global Methane Pledge, a pact that aims to reduce global methane emissions at least 30% below 2020 levels by 2030. Since its formal launch at the United Nations Climate Change Conference (COP26), over 100 countries have joined the pledge.
Domestic efforts to curb GHG emissions are being led by the U.S. Environmental Protection Agency’s (the “EPA”) GHG regulations and similar programs of certain states. To the extent that our domestic operations are subject to the EPA’s GHG regulations, we may face increased capital and operating costs associated with new or expanded facilities. Significant expansions of our existing facilities or construction of new facilities may be subject to the Clean Air Act’s (the “CAA”) requirements for pollutants regulated under the Prevention of Significant Deterioration and Title V programs. Some of our facilities are also subject to the EPA’s Mandatory Reporting of Greenhouse Gases rule, and any further regulation may increase our operational costs.
We are already managing and reporting GHG emissions, to varying degrees, as required by law for our sites in locations subject to U.S. federal and state requirements, Kyoto Protocol obligations and/or ETS requirements. Although these sites are subject to existing GHG legislation, few have experienced or anticipate significant cost increases as a result of these programs, although it is possible that GHG emission restrictions may increase over time. Potential consequences of such restrictions include capital requirements to modify assets to meet GHG emission restrictions and/or increases in energy costs above the level of general inflation, as well as direct compliance costs. Currently, however, it is not possible to estimate the likely financial impact of potential future regulation on any of our sites.
Finally, most scientists have concluded that increasing concentrations of GHGs in the earth’s atmosphere may produce climate changes that have significant physical effects, such as increased frequency and severity of storms, droughts, and floods and other climatic events. If any of those effects were to occur, they could have an adverse effect on our assets and operations.
AVAILABLE INFORMATION
We maintain an internet website at http://www.huntsman.com. Our annual reports on Form 10-K, quarterly reports on Form 10-Q, current reports on Form 8-K and amendments to these reports are available free of charge through our website as soon as reasonably practicable after we file these materials with the SEC. We also provide electronic or paper copies of our SEC filings free of charge upon request.
GLOSSARY OF CHEMICAL TERMS
BDO—butane diol
BLR—base liquid resin
DGA® Agent—DIGLYCOLAMINE® agent
DPA—diphenylamine
EDC—ethylene dichloride
EG—ethylene glycol
EO—ethylene oxide
MDA—methylene dioxy amphetamine
MDI—methyl diphenyl diisocyanate
MNB—mononitrobenzene
MTBE—methyl tertiary-butyl ether
PBT—polybutylene terephthalate
PO—propylene oxide
Polyols—a substance containing several hydroxyl groups. A diol, triol and tetrol contain two, three and four hydroxyl groups, respectively.
TDI—toluene diisocyanate
TPU—thermoplastic polyurethane
UPR—unsaturated polyester resin
Any of the following risks could materially and adversely affect our business, results of operations, financial condition and liquidity.
RISKS RELATED TO OUR BUSINESS AND OPERATIONS
Our results of operations and financial condition have been and, we believe, will in the future be adversely impacted by the COVID-19 pandemic, and the duration and extent of such impact remains uncertain.
The outbreak of the coronavirus disease (COVID-19) has adversely affected the global economies and financial markets. COVID-19 has significantly impacted our operations and financial results by slowing down the global economy for a period of time and depressing demand in many of our markets, and causing a negative impact on many of our customers, as well as the end customers of products for which our products serve as materials and inputs. In particular, certain of our key end markets, including aerospace, have been disproportionally impacted by the effects of COVID-19 and have experienced relatively slow recoveries.
In the first quarter of 2022, multiple variants of the virus that causes COVID-19 have been circulating globally, and some of these variants are known to spread more easily and quickly, which have led to more cases of COVID-19. As a result, the number of known COVID-19 cases in the U.S. and certain key parts of Europe remains elevated. It is not currently known what the effect of these existing or future variants will have on the effectiveness of existing and future therapies and vaccines.
The extent to which COVID-19 may continue to adversely impact our business depends on future developments, which are highly uncertain and unpredictable, including:
| ● |
the duration, scope, severity and geographic spread of the outbreak, including the extent of any current and future resurgences; |
| ● |
governmental, business and individual actions that have been and continue to be taken in response to the outbreak, including social distancing, work-at-home, stay-at-home and shelter-in-place orders and shutdowns, travel restrictions and quarantines; |
| ● |
the effect of the outbreak on our customers, suppliers, supply chain and other business partners; |
| ● |
our ability during the outbreak to provide our products and protect the health and well-being of our employees; |
| ● | our ability to increase prices and pass along to customers the additional cost we have experienced since the beginning of the COVID-19 pandemic; |
| ● |
business disruptions caused by actual or potential plant, workplace and office closures, and an increased reliance on employees working from home, disruptions to or delays in ongoing product development, operations, staffing shortages, travel limitations, employee health issues, cyber security and data accessibility, or communication or mass transit disruptions, any of which could adversely impact our business operations or delay necessary interactions with local regulators, manufacturing sites and other important agencies and contractors; |
| ● |
the risk that we could be exposed to liability, negative publicity or reputational harm related to any incidents of actual or perceived transmission of COVID-19 among employees at our facilities; |
| ● |
the ability of our customers to pay for our products during and following the outbreak; |
| ● | the ability of our suppliers to provide raw materials; |
| ● |
the impact of the outbreak on the financial markets and economic activity generally; |
| ● |
our ability to access usual sources of liquidity on reasonable terms; and |
| ● | our ability to comply with the financial covenants in our debt agreements if a material and prolonged economic downturn results in increased indebtedness or substantially lower adjusted EBITDA. |
Our industry is affected by global economic factors, including risks associated with volatile economic conditions.
Our financial results are substantially dependent on overall economic conditions in the U.S., Europe and Asia. Declining economic conditions in all or any of these locations—or negative perceptions about economic conditions—could result in a substantial decrease in demand for our products and could adversely affect our business. The timing and extent of any changes to currently prevailing market conditions is uncertain, and supply and demand may be unbalanced at any time. Uncertain economic conditions and market instability make it particularly difficult for us to forecast demand trends. As a consequence, we may not be able to accurately predict future economic conditions or the effect of such conditions on our financial condition or results of operations. We can give no assurances as to the timing, extent or duration of the current or future economic cycles impacting the industries in which we operate.
Disruptions in production at our manufacturing facilities may have a material adverse impact on our business, results of operations and/or financial condition.
Manufacturing facilities in our industry are subject to planned and unplanned production shutdowns, turnarounds, outages and other disruptions. Any serious disruption at any of our facilities could impair our ability to use our facilities and have a material adverse impact on our revenues and increase our costs and expenses. Alternative facilities with sufficient capacity may not be available, may cost substantially more or may take a significant time to increase production or qualify with our customers, any of which could negatively impact our business, results of operations and/or financial condition. Long-term production disruptions may cause our customers to seek alternative supply which could further adversely affect our profitability.
Unplanned production disruptions may occur for external reasons including natural disasters, weather, disease, strikes, transportation interruption, government regulation, political unrest or terrorism, or internal reasons, such as fire, unplanned maintenance or other manufacturing problems. Any significant production disruption could have a material impact on our operations, operating results and financial condition.
In addition, we rely on a number of vendors, suppliers, and in some cases sole-source suppliers, service providers, toll manufacturers and collaborations with other industry participants to provide us with chemicals, feedstocks and other raw materials, along with energy sources and, in certain cases, facilities that we need to operate our business. If the business of these third parties is disrupted, some of these companies could be forced to reduce their output, shut down their operations or file for bankruptcy protection. If this were to occur, it could adversely affect their ability to provide us with the raw materials, energy sources or facilities that we need, which could materially disrupt our operations, including the production of certain of our products. Moreover, it could be difficult to find replacements for certain of our business partners without incurring significant delays or cost increases. If we are required to obtain alternate sources for raw materials because a supplier is unwilling or unable to perform under raw material supply agreements, if a supplier terminates its agreements with us, if we are unable to renew our existing contracts, or if we are unable to obtain new long-term supply agreements, we may not be able to obtain these raw materials in sufficient quantities, on economic terms, or in a timely manner, and we may not be able to enter into supply agreements on terms as favorable to us as our existing supply agreements, if at all. All of these risks could have a material adverse effect on our business, results of operations, financial condition and liquidity.
While we maintain business recovery plans that are intended to allow us to recover from natural disasters or other events that could disrupt our business, we cannot provide assurances that our plans would fully protect us from the effects of all such disasters or from events that might increase in frequency or intensity due to climate change. In addition, insurance may not adequately compensate us for any losses incurred as a result of natural or other disasters. In areas prone to frequent natural or other disasters, insurance may become increasingly expensive or not available at all. Furthermore, some potential climate-driven losses, particularly inundation due to sea-level rise, may pose long-term risks to our physical facilities such that operations cannot be restored in their current locations.
The markets for many of our products are cyclical and volatile, and we may experience depressed market conditions for such products.
The cyclicality in the markets for many of our products occurs as a result of alternating periods of tight supply, causing prices and margins to increase, followed by periods of lower capacity utilization, resulting in oversupply and declining prices and margins. The volatility these markets experience occurs as a result of changes in the demand for products as a consequence of global economic activity, changes in energy prices and changes in customers’ requirements. For example, demand for our products depends in part on aerospace, housing and construction industries, which are cyclical in nature and have historically been impacted by downturns in the economy. The supply-demand balance is also impacted by capacity additions or reductions that result in changes in utilization rates. The cyclicality and volatility of our industry results in significant fluctuations in profits and cash flow from period to period and over the business cycle.
Our results of operations may be adversely affected by international business risks, including fluctuations in currency exchange rates, legal restrictions and taxes.
We conduct a majority of our business operations outside the U.S., and these operations are subject to risks normally associated with international operations. These risks include the need to convert currencies that may be received for our products into currencies in which we purchase raw materials or pay for services, which could result in a gain or loss depending on fluctuations in exchange rates. We transact business in many foreign currencies, including euros, Swiss francs, Chinese renminbi, Indian rupees, Brazilian reals and Thai bahts. We translate our local currency financial results into U.S. dollars based on average exchange rates prevailing during the reporting period or the exchange rate at the end of that period. During times of a strengthening U.S. dollar, our reported international sales and earnings may be reduced because the local currency may translate into fewer U.S. dollars. Because we currently have significant operations located outside the U.S., we are exposed to fluctuations in global currency rates which may result in gains or losses on our financial statements.
Other risks of international operations include trade barriers, tariffs, exchange controls, cash repatriation restrictions, national and regional labor strikes, social and political risks, general economic risks and required compliance with a variety of U.S. and foreign laws, including monetary policies, tax laws, the Foreign Corrupt Practices Act (and foreign equivalents), export controls and regulations administered by the Office of Foreign Assets Control. Any changes in tariffs or trade barriers could make our products less competitive compared to other producers not subject to the same tariffs or trade barriers. Any decision to repatriate cash as dividends could subject us to foreign and U.S. federal and state income taxes without any offsetting foreign tax credit relief. Although we maintain an anti-corruption compliance program throughout our company, violations of our compliance program may result in criminal or civil sanctions, including material monetary fines, penalties and other costs against us or our employees, and may have a material adverse effect on our business. Furthermore, in foreign jurisdictions where legal processes may vary from country to country, we may experience difficulty in enforcing agreements. In jurisdictions where bankruptcy laws and practices vary, we may experience difficulty collecting foreign receivables through foreign legal systems. The occurrence of these risks, among others, could disrupt the businesses of our international subsidiaries, which could significantly affect their ability to make distributions to us.
We operate in a significant number of jurisdictions, which contributes to the volatility of our effective tax rate. Changes in tax laws or the interpretation of tax laws in the jurisdictions in which we operate may affect our effective tax rate. In addition, generally accepted accounting principles in the U.S. (“GAAP” or “U.S. GAAP”) have required us to place valuation allowances against our net operating losses and other deferred tax assets in certain tax jurisdictions. These valuation allowances result from analysis of positive and negative evidence supporting the realization of tax benefits. Negative evidence includes a cumulative history of pre-tax operating losses in specific tax jurisdictions. Changes in valuation allowances have resulted in material fluctuations in our effective tax rate. Economic conditions or changes in tax laws may dictate the continued imposition of current valuation allowances and, potentially, the establishment of new valuation allowances. While significant valuation allowances remain, our effective tax rate will likely continue to experience significant fluctuations. Furthermore, certain foreign jurisdictions may take actions to delay our ability to collect value-added tax refunds.
Significant price volatility or interruptions in supply of our raw materials may result in increased costs that we may be unable to pass on to our customers, which could reduce our profitability.
We purchase a substantial portion of our raw materials from third-party suppliers and the cost of these raw materials represents a substantial portion of our operating expenses. The prices for a number of these raw materials generally follow price trends of, and vary with market conditions for, crude oil and natural gas feedstocks, which are highly volatile and cyclical. In particular, the effect of the COVID-19 pandemic has disrupted nearly every aspect of the global supply chain in 2020 and 2021, and the resulting scarcity of raw materials has increased the cost of operating our business. While we attempt to match cost increases with corresponding product price increases or surcharges, we are not always able to raise product prices immediately or at all. Timing differences between raw material prices, which may change daily, and contract product prices, which in many cases are negotiated only monthly or less often, have had and may continue to have a negative effect on our cash flow. Any cost increase that we are not able to pass on to our customers could have a material adverse effect on our business, results of operations, financial condition and liquidity.
In general, the feedstocks and other raw materials we consume are organic chemical commodity products that are readily available at market prices. There are, however, several raw materials for which there are only a limited number of suppliers or a single supplier. To mitigate potential supply constraints, we frequently enter into supply agreements with particular suppliers, evaluate alternative sources of supply and evaluate alternative technologies to avoid reliance on limited or sole-source suppliers. In addition, where supply relationships are concentrated, particular attention is paid by the parties to ensure strategic intentions are aligned to facilitate long-term planning. If certain of our suppliers are unable to meet their obligations under present supply agreements, we may be forced to pay higher prices to obtain the necessary raw materials from other sources and we may not be able to increase prices for our finished products to recoup the higher raw materials costs. Any interruption in the supply of raw materials could increase our costs or decrease our revenues, which could reduce our cash flow. The inability of a supplier to meet our raw material needs could have a material adverse effect on our financial statements and results of operations.
The number of sources for and availability of certain raw materials is also specific to the particular geographical region in which a facility is located. Political and economic instability in the countries from which we purchase our raw material supplies could adversely affect their availability. In addition, if raw materials become unavailable within a geographic area from which they are now sourced, then we may not be able to obtain suitable or cost-effective substitutes. We may also experience higher operating costs such as energy costs, which could affect our profitability. We may not always be able to increase our selling prices to offset the impact of any higher production costs or reduced production levels, which could reduce our earnings and decrease our liquidity.
Our efforts to grow and transform our businesses may require significant investments; if our strategies are unsuccessful, our business, results of operations and/or financial condition may be materially adversely affected.
We continuously evaluate opportunities for growth and change. These initiatives may involve making acquisitions, entering into partnerships and joint ventures, divesting assets, restructuring our existing operations and assets, creating new financial structures and building new facilities—any of which could require a significant investment and subject us to new kinds of risks. We may incur additional indebtedness to finance these opportunities. If our strategies for growth and change are not successful, we could face increased financial pressure, such as increased cash flow demands, reduced liquidity and diminished access to financial markets, and the equity value of our businesses could be diluted.
The implementation of strategies for growth and change may create additional risks, including:
| ● |
diversion of management time and attention away from existing operations; |
| ● |
requiring capital investment that could otherwise be used for the operation and growth of our existing businesses; |
| ● |
disruptions to important business relationships; |
| ● |
increased operating costs; |
| ● |
limitations imposed by various governmental entities; and |
| ● |
difficulties due to lack of or limited prior experience in any new markets we may enter. |
Our inability to mitigate these risks or other problems encountered in connection with our strategies for growth and change could have a material adverse effect on our business, results of operations and financial condition. In addition, we may fail to fully achieve the savings or growth projected for current or future initiatives notwithstanding the expenditure of substantial resources in pursuit thereof.
In addition, we initiated a strategic review of our Textile Effects segment in December 2021, including a possible sale of the segment. We have not set a timetable or a deadline for the conclusion of this evaluation of strategic alternatives, and there can be no assurance that such evaluation will result in one or more transactions or other strategic change or outcome.
We may have difficulties integrating acquired businesses and as a result, our business, results of operations and/or financial condition may be materially adversely affected.
We have completed a number of acquisitions, and we expect to continue to acquire additional businesses and enter into joint ventures as part of our business strategy. Growth through acquisitions and joint ventures involves risks, including:
| ● |
inability to efficiently operate new businesses or to integrate acquired businesses and products; |
| ● |
inability to accurately predict delays in realizing the costs and benefits of acquisitions, partnerships, or joint ventures; |
| ● |
unexpected losses of customers or suppliers of an acquired or existing business; |
| ● |
difficulties in retaining key employees of acquired businesses; |
| ● |
difficulties in realizing projected synergies; |
| ● |
inability to efficiently operate new businesses or to integrate acquired businesses and products; |
| ● |
inability to accurately predict delays in realizing the costs and benefits of acquisitions, partnerships, or joint ventures; |
| ● |
unexpected losses of customers or suppliers of an acquired or existing business; |
| ● |
difficulties in retaining key employees of acquired businesses; |
| ● |
difficulties in realizing projected synergies; and |
| ● |
exposure to unanticipated liabilities, including unexpected environmental exposures, product liability or illegal activities conducted by an acquired company or a joint venture partner. |
Our inability to address these risks could cause us to fail to realize the anticipated benefits of such acquisitions or joint ventures and could have a material adverse effect on our business, results of operations and financial condition.
The industries in which we compete are highly competitive, and we may not be able to compete effectively with our competitors that have greater financial resources, which could have a material adverse effect on our business, results of operations and financial condition.
The industries in which we operate are highly competitive. Among our competitors are some of the world’s largest chemical companies and major integrated petroleum companies that have their own raw material resources. Changes in the competitive landscape could make it difficult for us to retain our competitive position in various products and markets throughout the world. Some of the companies with whom we compete may be able to produce products more economically than we can. Furthermore, some of our competitors have greater financial resources, which may enable them to invest significant capital into their businesses, including expenditures for research and development.
While we are engaged in a range of research and development programs to develop new products and processes, to improve and refine existing products and processes, and to develop new applications for existing products, the failure to develop new products, processes or applications could make us less competitive. Moreover, if any of our current or future competitors develops proprietary technology that enables them to produce products at a significantly lower cost, our technology could be rendered uneconomical or obsolete.
Further, it is possible that we could abandon certain products, processes, or applications due to potential infringement of third party intellectual property rights or that we could be named in future litigation for the infringement or misappropriation of a competitor’s or other third party’s intellectual property rights, which could include a claim for injunctive relief and damages, and, if so, such adverse results could have a material adverse effect on our business, results of operations and financial position. In addition, certain of our competitors in various countries in which we do business, including China, may be owned by or affiliated with members of local governments and political entities.
These competitors may get special treatment with respect to regulatory compliance and product registration, while certain of our products, including those based on new technologies, may be delayed or even prevented from entering into the local market.
Certain of our businesses use technology that is widely available. Accordingly, barriers to entry, apart from capital availability, may be low in certain product segments of our business. The entrance of new competitors into any of our businesses may reduce our ability to maintain margins or capture improving margins in circumstances where capacity utilization in the industry is increasing. Further, petroleum-rich countries have become more significant participants in the petrochemical industry and may expand their roles significantly in the future. Increased competition in any of our businesses could compel us to reduce the prices of our products, which could result in reduced margins and loss of market share and have a material adverse effect on our business, results of operations, financial condition and liquidity.
We are subject to risks relating to our information technology systems, and any technology disruption or cybersecurity incident could negatively affect our operations.
We rely on information technology systems across our operations, including for management, supply chain and financial information and various other processes and transactions. Our ability to effectively manage our business depends on the security, reliability and capacity of these systems. Our technology systems or the technology systems of third parties on which we rely, are vulnerable to disruption from circumstances beyond our control including fire, natural disasters, power outages, system failures, security breaches, espionage, cyber-attacks, viruses, theft and inadvertent release of information. Any such disruption to these Information technology systems could disrupt our operations or result in the disclosure of proprietary information about our business or confidential information concerning our customers or employees which could result in negative publicity/brand damage, violation of privacy laws, potential liability, including litigation/investigation/remediation or other legal actions against us or the imposition of penalties, fines, fees or liabilities, which may not be covered by our insurance policies. Any or all the above would potentially cause delays or cancellations of customer orders or impede the manufacture or shipment of products, processing of transactions or reporting of financial results.
While we have invested and will continue to invest in technology security initiatives and disaster recovery plans, we may not be able to implement measures that will protect against all the significant risks to our information technology systems. We have put in place security measures designed to protect against the misappropriation or corruption of our systems, intentional or unintentional disclosure of confidential information, or disruption of our operations. Current employees have, and former employees may have, access to a significant amount of information regarding our operations which could be disclosed to our competitors or otherwise used to harm us. Moreover, our operations in certain locations, such as China, may be particularly vulnerable to security attacks or other problems. Any breach of our security measures could result in unauthorized access to and misappropriation of our information, corruption of data or disruption of operations or transactions, any of which could have a material adverse effect on our business. In addition, we could be required to expend significant additional efforts to respond to information technology issues or to protect against threatened or actual security breaches.
Finally, data privacy is subject to frequently changing rules and regulations in countries where we do business. For example, the EU adopted a new regulation that became effective in May 2018, the General Data Protection Regulation (“GDPR”), which requires companies to meet new regulations regarding the handling of personal data. Our failure to successfully implement or comply with appropriate processes to adhere to the GDPR requirements could result in substantial fines or penalties and legal liability which could tarnish our reputation.
Our operations involve risks that may increase our operating costs, which could reduce our profitability.
Although we take precautions to enhance the safety of our operations and minimize the risk of disruptions, our operations are subject to hazards inherent in the manufacturing and marketing of chemical and other products. These hazards include: chemical spills, pipeline leaks and ruptures, storage tank leaks, discharges or releases of toxic or hazardous substances or gases and other hazards incident to the manufacturing, processing, handling, transportation and storage of dangerous chemicals. We are also potentially subject to other hazards, including natural disasters and severe weather; explosions and fires; transportation problems, including interruptions, spills and leaks; mechanical failures; unscheduled downtimes; labor difficulties; remediation complications; and other risks. In addition, some equipment and operations at our facilities are owned or controlled by third parties who may not be fully integrated into our safety programs and over whom we are able to exercise limited control. Many potential hazards can cause bodily injury and loss of life, severe damage to or destruction of property and equipment and environmental damage, and may result in suspension of operations and the imposition of civil or criminal penalties and liabilities. Furthermore, we are subject to present and future claims with respect to workplace exposure, exposure of contractors on our premises as well as other persons located nearby, workers’ compensation and other matters.
We maintain property, business interruption, products liability and casualty insurance policies which we believe are in accordance with customary industry practices, as well as insurance policies covering other types of risks, including pollution legal liability insurance, but we are not fully insured against all potential hazards and risks incident to our business. Each of these insurance policies is subject to customary exclusions, deductibles and coverage limits, in accordance with industry standards and practices. As a result of market conditions, premiums and deductibles for certain insurance policies can increase substantially and, in some instances, certain insurance may become unavailable or available only for reduced amounts of coverage. If we were to incur a significant liability for which we were not fully insured, it could have a material adverse effect on our business, results of operations, financial condition and liquidity.
In addition, we are subject to various claims and litigation in the ordinary course of business. We are a party to various pending lawsuits and proceedings. For more information, see “—Item 3. Legal Proceedings” below.
Our operations, financial condition and liquidity could be adversely affected by legal claims against us, including antitrust claims.
We face risks arising from various legal actions, including matters relating to antitrust, product liability, intellectual property and environmental claims. It is possible that judgments could be rendered against us in these cases or others for which we could be uninsured or not covered by indemnity, or which may be beyond the amounts that we currently have reserved or anticipate incurring for such matters. Over the past few years, antitrust claims have been made against chemical companies. In this type of litigation, the plaintiffs generally seek injunctive relief, treble damages or the maximum damages allowed by state law, costs of suit and attorneys’ fees, which may result in significant liabilities. An adverse outcome in any antitrust claim could be material and significantly impact our operations, financial condition, liquidity and business reputation.
Our business is exposed to risks associated with the creditworthiness of our suppliers, customers and business partners and the industries in which our suppliers, customers and business partners participate are cyclical in nature, both of which may adversely affect our business and results of operations.
Our business is exposed to risks associated with the creditworthiness of our key suppliers, customers and business partners and reductions in demand for our customers’ products. During periods of economic disruption, more of our customers than normal may experience financial difficulties, including bankruptcies, restructurings and liquidations, which could affect our business by reducing sales, increasing our risk in extending trade credit to customers and reducing our profitability. A significant adverse change in a customer relationship or in a customer’s financial position could cause us to limit or discontinue business with that customer, require us to assume more credit risk relating to that customer’s receivables or limit our ability to collect accounts receivable from that customer.
Our business is dependent on our intellectual property. If our intellectual property rights cannot be enforced or our trade secrets become known to our competitors, our ability to compete may be adversely affected.
Proprietary protection of our processes, apparatuses and other technology is important to our business. While a presumption of validity exists with respect to patents issued to us in the U.S., there can be no assurance that any of our patents will not be challenged, invalidated, circumvented or rendered unenforceable. Furthermore, if any pending patent application filed by us does not result in an issued patent, or if patents are issued to us, but such patents do not provide meaningful protection of our intellectual property, then our ability to compete may be adversely affected. Additionally, our competitors or other third parties may obtain patents that restrict or preclude our ability to lawfully produce or sell our products in a competitive manner, which could have a material adverse effect on our business, results of operations, financial condition and liquidity.
We also rely upon unpatented proprietary know-how and continuing technological innovation and other trade secrets to develop and maintain our competitive position. While it is our policy to enter into agreements imposing confidentiality obligations upon our employees and third parties to protect our intellectual property, these confidentiality obligations may be breached, may not provide meaningful protection for our trade secrets or proprietary know-how, or adequate remedies may not be available in the event of an unauthorized access, use or disclosure of our trade secrets and know-how. In addition, others could obtain knowledge of our trade secrets through independent development or other access by legal means.
We may have to rely on judicial enforcement of our patents and other proprietary rights. We may not be able to effectively protect our intellectual property rights from misappropriation or infringement in countries where effective patent, trademark, trade secret and other intellectual property laws and judicial systems may be unavailable, or may not protect our proprietary rights to the same extent as U.S. law.
The failure of our patents or confidentiality agreements to protect our processes, apparatuses, technology, trade secrets or proprietary know-how or the failure of adequate legal remedies for related actions could have a material adverse effect on our business, results of operations, financial condition and liquidity.
Conflicts, military actions, terrorist attacks, political events and general instability, along with increased security regulations related to our industry, could adversely affect our business.
Conflicts, military actions, terrorist attacks and political events have precipitated economic instability and turmoil in international commerce and the global economy. The uncertainty and economic disruption resulting from hostilities, military action or acts of terrorism may impact any or all of our facilities and operations or those of our suppliers or customers. Accordingly, any conflict, military action or terrorist attack that impacts us or any of our suppliers or customers, could have a material adverse effect on our business, results of operations, financial condition and liquidity. Furthermore, instability and turmoil, particularly in energy-producing nations, may result in raw material cost increases.
Changes in social, political, regulatory and economic conditions or in laws and policies governing foreign trade, manufacturing, development and investment in the territories and countries where we currently develop and sell products, could adversely affect our business. For example, a number of governments have instituted regulations attempting to increase the security of chemical plants and the transportation of hazardous chemicals, which could result in higher operating costs and could have a material adverse effect on our financial condition and liquidity.
Our pension and postretirement benefit plan obligations are currently underfunded, and under certain circumstances we may have to significantly increase the level of cash funding to some or all of these plans, which would reduce the cash available for our business.
We have unfunded and underfunded obligations under some of our domestic and foreign pension and postretirement benefit plans. The funded status of our pension plans is dependent upon many factors, including returns on invested assets, the level of certain market interest rates and the discount rates used to determine pension obligations. Unfavorable returns on the plan assets or unfavorable changes in applicable laws or regulations could materially change the timing and amount of required plan funding, which would reduce the cash available for our business. In addition, a decrease in the discount rate used to determine pension obligations could result in an increase in the valuation of pension obligations, which could affect the reported funding status of our pension plans and future contributions, as well as the periodic pension cost in subsequent fiscal years.
With respect to our domestic pension and postretirement benefit plans, the Pension Benefit Guaranty Corporation (“PBGC”) has the authority to terminate an underfunded tax-qualified pension plan under limited circumstances in accordance with the Employee Retirement Income Security Act of 1974, as amended. In the event our tax-qualified pension plans are terminated by the PBGC, we could be liable to the PBGC for the entire amount of the underfunding and, under certain circumstances, the liability could be senior to our notes. With respect to our foreign pension and postretirement benefit plans, the effects of underfunding depend on the country in which the pension and postretirement benefit plan is established. For example, in the U.K. and Germany semi-public pension protection programs have the authority in certain circumstances to assume responsibility for underfunded pension schemes, including the right to recover the amount of the underfunding from us.
RISKS RELATED TO REGULATION AND ENVIRONMENTAL ACTION
We are subject to many EHS regulations that may result in unanticipated costs or liabilities, which could reduce our profitability.
We are subject to extensive federal, state, local and foreign laws, regulations, rules and ordinances relating to pollution, protection of the environment and human health and safety, and the generation, storage, handling, transportation, treatment, disposal and remediation of hazardous substances and waste materials. Actual or alleged violations of EHS laws or permit requirements could result in restrictions or prohibitions on plant operations and substantial civil or criminal sanctions, as well as, under some EHS laws, the assessment of strict liability and/or joint and several liability.
Many of our products and operations are subject to the chemical control laws of the countries in which they are located. These laws include the regulation of chemical substances and inventories under the Toxic Substances Control Act (“TSCA”) in the U.S. and the Registration, Evaluation and Authorization of Chemicals (“REACH”) and the Classification, Labeling and Packaging of substances and mixtures (“CLP”) regulations in Europe. Analogous regimes exist in other parts of the world, including China, South Korea, and Taiwan. In addition, a number of countries where we operate, including the U.K., have adopted rules to conform chemical labeling in accordance with the globally harmonized system. Many of these foreign regulatory regimes are in the process of a multi-year implementation period for these rules.
Additional new laws and regulations may be enacted or adopted by various regulatory agencies globally. For example, in the U.S., the EPA finalized revisions to its Risk Management Program in January 2017. The revisions include new requirements for certain facilities to perform hazard analyses, third-party auditing, incident investigations and root cause analyses, emergency response exercises, and to publicly share chemical and process information. The EPA proposed to delay the rule’s effect until February 2019; however, a ruling by the U.S. Court of Appeals for the D.C. Circuit on September 21, 2018 made the Risk Management Program rule amendment effective immediately. The EPA finalized a reconsideration rule on November 20, 2019 that rescinded several of the 2017 revisions to the Risk Management Program rule. Environmental organizations and attorneys general of fourteen states and the District of Columbia challenged the reconsideration rule in the D.C. Circuit. That litigation is held in abeyance while the EPA reviews the 2019 reconsideration rule in response to an executive order issued by the Biden Administration. The U.S. Occupational Safety and Health Administration had announced in 2013 that it was considering changes to its Process Safety Management standards that parallel EPA’s Risk Management Program, but no rule changes have been issued. In June and July 2021, the EPA and OSHA held public listening sessions to solicit comments on the Risk Management Program rule and Process Safety Management standards. In addition, TSCA reform legislation was enacted in June 2016, and the EPA has begun the process of issuing new chemical control regulations. EPA issued several final rules in 2017 and 2018 under the revised TSCA related to existing chemicals, including the following: (i) a rule to establish EPA’s process and criteria for identifying chemicals for risk evaluation; (ii) a rule to establish EPA’s process for evaluating high priority chemicals and their uses to determine whether or not they present an unreasonable risk to health or the environment; and (iii) a rule to require industry reporting of chemicals manufactured or processed in the U.S. over the past 10 years. In April 2020, EPA finalized revisions to its Chemical Data Reporting rule under TSCA, which changes reporting requirements. The EPA has also released its framework for approving new chemicals and new uses of existing chemicals. Under the framework, a new chemical or use presents an unreasonable risk if it exceeds set standards. Such a finding could result in either the issuance of rules restricting the use of the chemical being evaluated or in the need for additional testing. The costs of compliance with any new laws or regulations cannot be estimated until the manner in which they will be implemented has been more precisely defined.
Furthermore, governmental, regulatory and societal demands for increasing levels of product safety and environmental protection could result in increased pressure for more stringent regulatory control with respect to the chemical industry. In addition, these concerns could influence public perceptions regarding our products and operations, the viability of certain products, our reputation, the cost to comply with regulations, and the ability to attract and retain employees. Moreover, changes in EHS regulations could inhibit or interrupt our operations, or require us to modify our facilities or operations. Accordingly, environmental or regulatory matters may cause us to incur significant unanticipated losses, costs or liabilities, which could reduce our profitability. For example, several of our products are being evaluated under REACH and CLP regulations and actions thereunder could negatively impact sales.
We could incur significant expenditures in order to comply with existing or future EHS laws. Capital expenditures and costs relating to EHS matters will be subject to evolving regulatory requirements and will depend on the timing of the promulgation and enforcement of specific standards which impose requirements on our operations. Capital expenditures and costs beyond those currently anticipated may therefore be required under existing or future EHS laws.
Furthermore, we may be liable for the costs of investigating and cleaning up environmental contamination on or from our properties or at off-site locations where we disposed of or arranged for the disposal or treatment of hazardous materials, or from disposal activities that pre-dated our purchase of our businesses. We may therefore incur additional costs and expenditures beyond those currently anticipated to address all such known and unknown situations under existing and future EHS laws.
Regulatory requirements to reduce GHG emissions could have an adverse effect on our results of operations.
Our operations are increasingly subject to regulations that seek to reduce emissions of GHGs, such as carbon dioxide and methane, which may be contributing to changes in the Earth’s climate. There are existing efforts to address GHG emissions at the international, national, and regional levels. For example, the Paris Agreement, which entered into force in November 2016, resulted in voluntary commitments by numerous countries to reduce their GHG emissions. On June 1, 2017, former U.S. President Trump announced that the U.S. would withdraw from the Paris Agreement, and the U.S. completed the process of withdrawing on November 4, 2020. On January 20, 2021, U.S. President Biden issued written notification to the United Nations of the U.S.’s intention to rejoin the Paris Agreement, which became effective on February 19, 2021. In addition, in September 2021, U.S. President Biden publicly announced the Global Methane Pledge, a pact that aims to reduce global methane emissions at least 30% below 2020 levels by 2030. Since its formal launch at the United Nations Climate Change Conference (COP26), over 100 countries have joined the pledge. The EU also regulates GHGs under the EU ETS and China has established its own country-wide GHG cap and trade program. Domestically, the EPA issued its final Clean Power Plan rule in 2015 that established carbon pollution standards for power plants, called CO2 emission performance rates. The Clean Power Plan never took effect before being replaced by the Affordable Clean Energy (“ACE”) Rule in 2019. The ACE Rule established emission guidelines for states to develop plans to address GHG emissions from existing coal-fired power plants. The ACE rule was challenged by a coalition of states and environmental groups. On January 19, 2021, the D.C. Circuit struck down the ACE Rule; litigation challenging both the Clean Power Plan and the ACE Rule is pending before the U.S. Supreme Court. The Biden Administration has said it plans to enact new rules to address power plant GHG emissions. Therefore, the regulation of GHG emissions is uncertain at this time. Such rules and agreements may affect the long-term price and supply of electricity and natural gas and demand for products that contribute to energy efficiency and renewable energy. These various regulations and agreements may result in increased costs to purchased energy, additional capital costs for installation or modification of GHG emitting equipment, and additional costs associated directly with GHG emissions (such as cap and trade systems or carbon taxes), which are primarily related to energy use. Compliance with these regulations and any more stringent restrictions in the future may increase our operational costs.
In addition, most scientists have concluded that increasing concentrations of GHGs in the Earth’s atmosphere may produce climate changes, such as increased frequency and severity of storms, droughts, floods and other climatic events. If any such effects were to occur in areas where we or our clients operate, they could have an adverse effect on our assets and operations.
We could incur significant expenditures in order to comply with existing or future EHS laws. Capital expenditures and costs relating to EHS matters will be subject to evolving regulatory requirements and will depend on the timing of the promulgation and enforcement of specific standards which impose requirements on our operations. Capital expenditures and costs beyond those currently anticipated may therefore be required under existing or future EHS laws.
Furthermore, we may be liable for the costs of investigating and cleaning up environmental contamination on or from our properties or at off-site locations where we disposed of or arranged for the disposal or treatment of hazardous materials or from disposal activities that pre-dated our purchase of our businesses. We may therefore incur additional costs and expenditures beyond those currently anticipated to address all such known and unknown situations under existing and future EHS laws.
RISKS RELATED TO INDEBTEDNESS
Our debt level, a portion of which is subject to variable interest rates, makes us vulnerable to downturns and may limit our ability to respond to market conditions, to obtain additional financing or to refinance our debt.
As of December 31, 2021, our total consolidated outstanding debt was $1,550 million (including current portion of debt), our debt to total capitalization ratio was approximately 25%, our combined outstanding variable rate borrowings were approximately $45 million and our current portion of debt totaled $12 million. Additionally, future borrowings under our $1.2 billion senior unsecured revolving credit facility will be subject to variable interest rates. Our debt level and the fact that a portion of our cash flow is required to make payments on our debt could have important consequences for our business, including but not limited to the following:
| ● |
we may be more vulnerable to business, industry or economic downturns, making it more difficult to respond to market conditions; |
|
| ● |
cash flow available for other purposes, including the growth of our business, may be reduced; |
|
| ● |
our ability to refinance or obtain additional financing may be constrained, particularly during periods when the capital markets are unsettled; |
|
| ● |
our competitors with lower debt levels may have a competitive advantage relative to us; and |
|
| ● |
part of our debt is subject to variable interest rates, which makes us more vulnerable to increases in interest rates. |
Our debt level also impacts our credit ratings. Any decision by credit rating agencies to downgrade our debt ratings could restrict our ability to obtain additional financing and could result in increased interest and other costs.
Agreements governing our debt may restrict our ability to engage in certain business activities or to obtain additional financing.
The agreements governing our debt arrangements contain certain restrictive covenants. These covenants may limit or prohibit our ability to among other things, incur additional indebtedness; make investments; create liens; enter into transactions with affiliates; enter into sale and leaseback transactions; merge or consolidate; and transfer or sell assets. Some of our strategies may necessitate receiving consents or waivers under our debt arrangements, which could be withheld.
Our failure to comply with any of our debt covenants, or our failure to make payments of principal or interest on our debt, could result in a default, or trigger cross-default or acceleration provisions, under our debt agreements. An event of default could result in our debt obligations becoming immediately due and payable, cause our creditors to terminate their lending commitments. Any of the foregoing occurrences could have a material adverse effect on our business, results of operations and financial condition. For more information regarding our debt covenants, see “Note 14. Debt—Compliance with Covenants” to our consolidated financial statements.
If our subsidiaries do not make sufficient distributions to us, then we will not be able to make payment on our debts.
Our debt is generally the exclusive obligation of Huntsman International. Our subsidiaries are separate legal entities and have no obligation, contingent or otherwise, to pay any amounts due on our debt or to make any funds available for those amounts, whether by dividends, loans, distributions or other payments, and do not guarantee the payment of interest on, or principal of, our debt. Any right that we have to receive any assets of any of our subsidiaries upon the liquidation or reorganization of any such subsidiary, and the consequent right of holders of notes to realize proceeds from the sale of their assets, will be structurally subordinated to the claims of that subsidiary’s creditors, including trade creditors and holders of debt issued by that subsidiary.
GENERAL RISK FACTORS
Certain provisions contained in our certificate of incorporation and bylaws could discourage a takeover attempt, which may reduce or eliminate the likelihood of a change of control transaction and, therefore, limit your ability to sell our common stock at a price higher than the current market value.
Certain provisions contained in our certificate of incorporation and bylaws, as well as certain provisions of Delaware law, could make it more difficult for a third party to acquire control of our Company, even if some of our stockholders were to consider such a change of control to be beneficial. Our certificate of incorporation also authorizes our Board of Directors to issue preferred stock without stockholder approval. Therefore, our Board of Directors could elect to issue preferred stock that has special voting or other rights that could make it even more difficult for a third party to acquire us, which may reduce or eliminate your ability to sell our common stock at a price higher than the current market value.
We have purchased, and may continue to purchase, a portion of our equity and debt securities, which could impact the market for our equity and debt securities and likely would negatively affect our liquidity.
Consistent with past practices, we may from time to time seek to repurchase or redeem our equity and debt securities in open market purchases, accelerated repurchase programs, privately negotiated transactions, tender offers, partial or full calls for redemption or otherwise. Any such repurchases or redemptions and the timing and amount thereof would depend on prevailing market conditions, liquidity requirements, contractual restrictions and other factors. Such transactions could negatively affect our liquidity.
ITEM 1B. UNRESOLVED STAFF COMMENTS
As of the date of this filing, we did not have any unresolved comments from the staff of the SEC.
We own or lease chemical manufacturing and research facilities in the locations indicated in the list below, which we believe are adequate for our short-term and anticipated long-term needs. We own or lease office space and storage facilities throughout the U.S. and in many foreign countries. Our principal executive offices are located at 10003 Woodloch Forest Drive, The Woodlands, Texas 77380. The following is a list of our principal physical properties where manufacturing, research and main office facilities are located.
| Location |
|
Business Segment |
|
Description of Facility |
| Kuala Lumpur, Malaysia(1) |
Various |
Shared Services Center |
||
| Mumbai, India(1) |
Various |
Technology Center, Administrative Offices, Labs and Shared Services Center |
||
| The Woodlands, Texas(1) |
Various |
Executive Offices, Operating Headquarters, Global Technology Center and Shared Services Center |
||
| Wynyard, U.K.(1) |
Various |
Administrative Offices |
||
| Caojing, China |
Polyurethanes |
MDI Finishing Facilities |
||
| Caojing, China(2) |
Polyurethanes |
Precursor MDI Manufacturing Facility |
||
| Auburn Hills, Michigan(1) |
Polyurethanes |
Polyurethane Research Facility |
||
| Arlington, Texas |
Polyurethanes |
Polyurethane Systems House |
||
| Azeglio, Italy |
Polyurethanes |
Polyurethane Systems House |
||
| Boisbriand, Canada |
Polyurethanes |
Polyurethane Systems House |
||
| Buenos Aires, Argentina(1) |
Polyurethanes |
Polyurethane Systems House |
||
| Cartagena, Colombia |
Polyurethanes |
Polyurethane Systems House |
||
| Castelfranco Emilia, Italy |
Polyurethanes |
Polyurethane Systems House |
||
| Dammam, Saudi Arabia(3) |
Polyurethanes |
Polyurethane Systems House |
||
| Deer Park, Australia(1) |
Polyurethanes |
Polyurethane Systems House |
||
| Dubai, United Arab Emirates |
Polyurethanes |
Polyurethane Systems House |
||
| Georgsmarienhütte, Germany |
Polyurethanes |
Polyurethane Systems House |
||
| Istanbul, Turkey(4) |
Polyurethanes |
Polyurethane Systems House |
||
| King’s Lynn, U.K.(1) |
Polyurethanes |
Polyurethane Systems House |
||
| Kuan Yin, Taiwan |
Polyurethanes |
Polyurethane Systems House |
||
| Obninsk, Russia |
Polyurethanes |
Polyurethane Systems House |
||
| Pune, India(1) |
Polyurethanes |
Polyurethane Systems House |
||
| Samutprakarn, Thailand(1) |
Polyurethanes |
Polyurethane Systems House |
||
| Tianjin, China(1) | Polyurethanes | Polyurethane Systems House | ||
| Tlalnepantla, Mexico |
Polyurethanes |
Polyurethane Systems House |
||
| Deggendorf, Germany |
Polyurethanes |
Polyurethane Systems House and Technology Center |
||
| Jinshan, China(1) |
Polyurethanes |
TPU Manufacturing Facility |
||
| Osnabrück, Germany |
Polyurethanes |
TPU Manufacturing Facility |
||
| Ringwood, Illinois(1) |
Polyurethanes |
TPU Manufacturing Facility |
||
| Derry, New Hampshire(1) |
Polyurethanes |
TPU Research Facility |
||
| Nanjing, China(5) |
Polyurethanes |
PO and MTBE Manufacturing Facilities |
||
| Houston, Texas(1) |
Polyurethanes |
Polyols Manufacturing Facility |
||
| Ho Chi Minh City, Vietnam(1) |
Polyurethanes and Advanced Materials |
Polyurethane Systems House and Formulating Facility |
||
| Wilton, U.K. |
Polyurethanes and other various |
Aniline and Nitrobenzene Manufacturing Facilities |
||
| Rotterdam, The Netherlands(1) |
Polyurethanes and other various |
MDI Manufacturing Facility, Polyols Manufacturing Facilities, Polyurethane Systems House and Accounting Shared Services Center |
||
| Geismar, Louisiana(6) |
Polyurethanes and Performance Products |
MDI, Nitrobenzene(2), Aniline(2), Polyols and Maleic Anhydride Manufacturing Facilities, Polyurethane Systems House |
||
| Everberg, Belgium |
Polyurethanes and Performance Products |
Polyurethane and Performance Products Regional Headquarters, Global Technology Center and Shared Service Center |
||
| Shanghai, China(1) |
Polyurethanes, Performance Products and Advanced Materials |
Polyurethane Systems House, Global Technology Center, Performance Products Regional Headquarters and Shared Services Center |
||
| Conroe, Texas |
Performance Products |
Amines Manufacturing Facility |
||
| Freeport, Texas(1) |
Performance Products |
Amines Manufacturing Facility |
||
| Jubail, Saudi Arabia(7) |
Performance Products |
Amines Manufacturing Facility |
||
| Jurong Island, Singapore(1) |
Performance Products |
Amines Manufacturing Facility |
||
| Llanelli, U.K. |
Performance Products |
Amines Manufacturing Facility |
||
| Petfurdo, Hungary |
Performance Products |
Amines Manufacturing Facility |
||
| Port Neches, Texas |
Performance Products |
Amines Manufacturing Facility |
| Moers, Germany(1) |
Performance Products |
Maleic Anhydride Manufacturing Facility |
||
| Pensacola, Florida(1) |
Performance Products |
Maleic Anhydride Manufacturing Facility |
||
| Ashtabula, Ohio | Advanced Materials | Formulating and Synthesis Facility | ||
| Duxford, U.K. |
Advanced Materials |
Formulating and Synthesis Facility |
||
| McIntosh, Alabama |
Advanced Materials |
Formulating and Synthesis Facility |
||
| Monthey, Switzerland |
Advanced Materials |
Formulating and Synthesis Facility |
||
| Rock Hill, South Carolina | Advanced Materials | Formulating and Synthesis Facility | ||
| Bad Saeckingen, Germany |
Advanced Materials |
Formulating Facility |
||
| East Lansing, Michigan |
Advanced Materials |
Formulating Facility |
||
| Harrison City, Pennsylvania | Advanced Materials | Formulating Facility | ||
| Los Angeles, California |
Advanced Materials |
Formulating Facility |
||
| Akron, Ohio | Advanced Materials | Synthesis Facility | ||
| Bergkamen, Germany |
Advanced Materials |
Synthesis Facility |
||
| Maple Shade, New Jersey | Advanced Materials | Synthesis Facility | ||
| Pamplona, Spain |
Advanced Materials |
Synthesis Facility |
||
| Merrimack, New Hampshire(1) |
Advanced Materials |
Research Facility |
||
| Basel, Switzerland(1) |
Advanced Materials and Textile Effects |
Advanced Materials Regional Headquarters, Technology Center |
||
| Panyu, China(8) |
Advanced Materials and Textile Effects |
Formulating and Synthesis Facility, Technology Center and Shared Services Center |
||
| Taboão da Serra, Brazil |
Advanced Materials, Polyurethanes and Textile Effects |
Formulating Facility, Labs, Polyurethane Systems House and Chemicals Formulations Facility |
||
| Bogota, Colombia |
Textile Effects |
Chemicals Formulations Facility |
||
| Charlotte, North Carolina |
Textile Effects |
Chemicals Formulations Facility |
||
| Fraijanes, Guatemala |
Textile Effects |
Chemicals Formulations Facility |
||
| Langweid am Leich, Germany |
Textile Effects |
Chemicals Synthesis and Formulations Facility |
||
| Atotonilquillo, Mexico |
Textile Effects |
Textile Dyes and Chemicals Synthesis and Formulations Facility |
||
| Baroda, India |
Textile Effects |
Textile Dyes Synthesis and Dyes and Chemicals Formulations Facility |
||
| Samutsakorn (Mahachai), Thailand |
Textile Effects |
Textiles Dyes Synthesis and Dyes and Chemicals Formulations Facility |
||
| Gandaria, Jakarta, Indonesia |
Textile Effects and Polyurethanes |
Textile Dyes and Chemicals Formulations Facility and Polyurethane Systems House |
||
| Singapore(1) |
Textile Effects and other various |
Textile Effects Headquarters and Administrative Offices |
| (1) |
Leased land and/or building. |
| (2) | 35% interest in SLIC, our unconsolidated manufacturing joint venture with BASF and three Chinese chemical companies. |
| (3) |
51%-owned consolidated manufacturing joint venture with Basic Chemicals Industries Ltd. |
| (4) | On September 18, 2019, we experienced a fire at our polyurethane systems house in Istanbul, Turkey, and it is currently not operational. |
| (5) |
49% interest in Nanjing Jinling Huntsman New Material Co., Ltd., our unconsolidated manufacturing joint venture with Sinopec. |
| (6) |
The ownership of the Geismar facility is as follows: we own 100% of the MDI, polyol and maleic anhydride facilities, and Rubicon, a consolidated manufacturing joint venture with Lanxess in which we own a 50% interest, owns the aniline and nitrobenzene facilities. Rubicon is a separate legal entity that operates both the assets that we own jointly with Lanxess and our wholly owned assets at Geismar. |
| (7) |
50% interest in AAC, our consolidated manufacturing joint venture with the Zamil Group. |
| (8) |
95%-owned consolidated manufacturing joint venture with Guangzhou Sheng’an Package Company Limited. |
Rockwood Litigation
On February 6, 2017, we filed a lawsuit in New York state court against Rockwood Specialties Group, Inc., Rockwood Holdings, Inc. (collectively, “Rockwood”), Albemarle (as Rockwood’s successor) and certain former Rockwood executives to recover damages for fraud and breach of contract in connection with our purchase of Rockwood’s pigments businesses, including its Color Pigments Division, for $1.1 billion in 2014. The case was ordered to arbitration under the rules of the American Arbitration Association and, after a two-week trial in May 2021, a panel consisting of three former federal judges awarded us in excess of $600 million for the fraud and breach, inclusive of punitive damages and statutory interest at 9%. On November 4, 2021, Albemarle agreed to waive any appeal and pay $665 million, of which we received $332.5 million on December 2, 2021 and expect to receive a final payment of $332.5 million by early May 2022. We agreed to terminate all proceedings relating to the dispute after receipt of the final payment. Net of legal fees but before taxes, we expect to receive approximately $465 million in total.
Texas Emissions Enforcement
On July 26, 2021, the Attorney General of the State of Texas filed a civil suit in the District Court of Travis County, Texas seeking civil penalties and attorney’s fees for alleged violations of the Texas Clean Air Act, Texas Commission on Environmental Quality regulations and facility permit terms. The complaint alleged multiple unauthorized emissions events and reporting discrepancies that occurred between December 2016 and June 2019 at our former manufacturing facility in Port Neches, Texas. The state is seeking monetary relief between $250,000 and $1 million. We completed the sale of our former Port Neches, Texas facility to Indorama Ventures Holdings L.P. on January 3, 2020. We believe that we are contractually indemnified for any defense costs and potential liability that may result from this action.
ITEM 4. MINE SAFETY DISCLOSURES
Not applicable.
INFORMATION ABOUT OUR EXECUTIVE OFFICERS
The following is information concerning our executive officers and significant employees as of the date of this report.
Peter R. Huntsman, age 58, is Chairman of the Board, President and Chief Executive Officer of our Company. Peter R. Huntsman has served as Chairman of the Board since January 2018 and as a director of our company and affiliated companies since 1994. Prior to his appointment in July 2000 as Chief Executive Officer, Mr. Huntsman had served as President and Chief Operating Officer since 1994. In 1987, Mr. Huntsman joined Huntsman Polypropylene Corporation as Vice President before serving as Senior Vice President and General Manager. Mr. Huntsman has also served as President of Olympus Oil, as Senior Vice President of Huntsman Chemical Corporation and as a Senior Vice President of Huntsman Packaging Corporation, a former subsidiary of our Company. Mr. Huntsman is a director or manager, as applicable, of Huntsman International and certain of our other subsidiaries. Mr. Huntsman currently serves as a director of Venator Materials PLC, which separated from our Company in 2017.
Phil Lister, age 49, is Executive Vice President and Chief Financial Officer. Mr. Lister was appointed to this position in July 2021. From May 2019 to June 2021, Mr. Lister served as Vice President, Corporate Development. From April 2011 to April 2019, Mr. Lister served in Huntsman’s Polyurethanes division as Vice President, Global Finance and Controller, a role including divisional leadership of strategic planning as well as mergers and acquisitions. Prior to that, Mr. Lister served in numerous financial and business roles in Polyurethanes both in Europe and in the United States. Mr. Lister joined Huntsman in July 1999 with the ICI acquisition. Mr. Lister is a U.K. Chartered Management Accountant.
David Stryker, age 63, is Executive Vice President, General Counsel and Secretary. Mr. Stryker was appointed to this position in June 2013. Prior to joining Huntsman, Mr. Stryker served as Senior Vice President, General Counsel, Secretary and Chief Compliance Officer of the BASF Corporation since 2004. Previously, he was Associate General Counsel and Chief Compliance Officer at Siemens Corporation and, prior to that, a partner at the law firm of Kirkland & Ellis. Mr. Stryker started his legal career as a judicial clerk to the Honorable Robert H. Bork on the U.S. Court of Appeals for the D.C. Circuit.
Anthony P. Hankins, age 64, is Division President, Polyurethanes and Chief Executive Officer, Asia-Pacific. Mr. Hankins was appointed to these positions in March 2004 and February 2011, respectively. From May 2003 to February 2004, Mr. Hankins served as President, Performance Products, from January 2002 to April 2003, he served as Global Vice President, Rigids Division for our Polyurethanes segment, from October 2000 to December 2001, he served as Vice President—Americas for our Polyurethanes segment, and from March 1998 to September 2000, he served as Vice President—Asia-Pacific for our Polyurethanes segment. Mr. Hankins worked for ICI from 1980 to February 1998, when he joined our Company. At ICI, Mr. Hankins held numerous management positions in the plastics, fibers and polyurethanes businesses. He has extensive international experience, having held senior management positions in Europe, Asia and the U.S.
Rohit Aggarwal, age 54 is Division President, Textile Effects. Prior to his appointment to this position in July 2016, Mr. Aggarwal served as Vice President and Managing Director of Indian Subcontinent since July 2015. Mr. Aggarwal joined Huntsman in 2005 and has held various positions within the Advanced Materials and Textile Effects divisions. Mr. Aggarwal left the Company in 2013 to join Louis Dreyfus Commodities B.V. as Chief Executive Officer of Asia Region, a position he held until his return in 2015.
Chuck Hirsch, age 54, is Division President, Performance Products. Prior to his appointment to this position in July 2020, Mr. Hirsch served as Vice President–Commercial, Textile Effects based in Singapore since April 2014. Mr. Hirsch joined Huntsman in July 2009 and has served in multiple roles of increasing responsibility in the Textile Effects division. Prior to joining Huntsman, Mr. Hirsch held numerous positions with International Textile Group, Ciba Specialty Chemicals and Milliken & Company.
Scott J. Wright, age 50, is Division President, Advanced Materials. Mr. Wright was appointed to this position in June 2016. Prior to that time, Mr. Wright served as Vice President of Huntsman Advanced Materials—Europe, Middle East & Africa since 2011. Before joining Huntsman’s Advanced Materials segment, Mr. Wright spent 15 years in Huntsman’s former P&A Business in a number of roles of increasing responsibility including product development, business planning, marketing and sales. Prior to joining Huntsman in July 1999, Mr. Wright worked with ICI.
Brittany Benko, age 47, is Senior Vice President, Environmental, Health & Safety and Manufacturing Excellence. Prior to joining Huntsman in August 2020, Ms. Benko served as Vice President, Health, Safety, Environment and Regulatory at Southwestern Energy Company. Previously, Ms. Benko served in a variety of EHS roles with increasing responsibility at several companies including Anadarko Petroleum Corporation, Chesapeake Energy Corporation and BP.
R. Wade Rogers, age 56, is Senior Vice President, Global Human Resources and Chief Compliance Officer. Mr. Rogers has held the position of Senior Vice President, Global Human Resources since August 2009. From May 2004 to August 2009, Mr. Rogers served as Vice President, Global Human Resources, from October 2003 to May 2004, Mr. Rogers served as Director, Human Resources—Americas and from August 2000 to October 2003, he served as Director, Human Resources for our Polymers and Base Chemicals businesses. From the time he joined Huntsman in 1994 to August 2000, Mr. Rogers served as Area Manager, Human Resources—Jefferson County Operations. Prior to joining Huntsman, Mr. Rogers held a variety of positions with Texaco Chemical Company.
Steven C. Jorgensen, age 53, is Vice President and Controller. Prior to his appointment to this position in August 2021, Mr. Jorgensen served as Vice President Finance and Controller in Huntsman’s Performance Products division since January 2017, as Vice President of Accounting Shared Services and Internal Controls since February 2012, as Vice President of Internal Audit and Internal Controls since May 2007 and other positions since joining Huntsman in May 2004. Prior to joining Huntsman, Mr. Jorgensen served as an Internal Audit Manager at General Electric Consumer Finance and a Senior Audit Manager at Deloitte & Touche LLP. Mr. Jorgensen is a Certified Public Accountant.
Twila Day, age 60, is Vice President and Chief Information Officer. Ms. Day was appointed to this position upon joining Huntsman in November 2018. Prior to joining Huntsman, Ms. Day was Managing Director, National Practice Lead for Technology Services, and a member of the executive committee at Alvarez & Marsal. Previously, Ms. Day served at SYSCO Corporation for more than 20 years in a variety of positions, culminating in her appointment as Senior Vice President Information Technology and Chief Information Officer.
Kevin C. Hardman, age 58, is Vice President, Tax. Mr. Hardman served as Chief Tax Officer from 1999 until he was appointed to his current position in 2002. Prior to joining Huntsman in 1999, Mr. Hardman was a tax Senior Manager with the accounting firm of Deloitte & Touche LLP, where he worked for 10 years. Mr. Hardman is a Certified Public Accountant and holds a master’s degree in tax accounting.
Ivan Marcuse, age 45, is Vice President, Investor Relations. Prior to joining Huntsman in April 2017, Mr. Marcuse served as Director, Equity Research, Specialty Chemicals for KeyBanc Capital Markets Inc. from August 2011 to February 2017. Previously, he was Vice President, Equity Research, Building Products and Materials, for Northcoast Research. Mr. Marcuse is a CFA charterholder and holds a master’s degree in business administration.
Claire Mei, age 47, is Vice President and Treasurer. Ms. Mei was appointed to this role upon joining Huntsman in August of 2018. Prior to joining Huntsman, Ms. Mei served as Vice President and Treasurer at Chobani Global Holdings since November 2016. Previously, Ms. Mei served in a variety of treasury and financial roles with increasing responsibility at several companies including Kraft Foods, PepsiCo, and Hyatt Corporation. Ms. Mei was also a management consultant with McKinsey & Company in Shanghai, China. Ms. Mei holds a master’s degree in business administration.
Pierre Poukens, age 59, is Vice President, Internal Audit, a position he has held since February 2012. Mr. Poukens was Director of Internal Audit from April 2005 to January 2012 and joined Huntsman as Internal Audit Manager in January 2000. Prior to joining Huntsman, Mr. Poukens held various accounting and auditing positions with European companies in Belgium. Mr. Poukens is a Certified Internal Auditor.
Nooshin Vaughn, age 47, is Vice President, Financial Planning and Analysis. Ms. Vaughn was appointed to this position effective June 2018. Ms. Vaughn previously served as Director, Investor Relations. Prior to that, Ms. Vaughn held numerous roles in finance, accounting and information technology. Prior to joining Huntsman in 1997, Ms. Vaughn worked for the accounting firm of Deloitte & Touche LLP. Ms. Vaughn is a Certified Public Accountant.
ITEM 5. MARKET FOR REGISTRANT’S COMMON EQUITY, RELATED STOCKHOLDER MATTERS AND ISSUER PURCHASES OF EQUITY SECURITIES
Market Information And Holders
Our common stock is listed on the New York Stock Exchange under the symbol “HUN.” As of January 31, 2022, there were approximately 88 stockholders of record and the closing price of our common stock on the New York Stock Exchange was $35.83 per share.
Dividends
The payment of dividends is a business decision made by our Board of Directors from time to time based on our earnings, financial position and prospects, and such other considerations as our Board of Directors considers relevant. Accordingly, while management currently expects that we will continue to pay the quarterly cash dividend, our dividend practice may change at any time.
Securities Authorized For Issuance Under Equity Compensation Plans
See “Part III. Item 11. Executive Compensation” for information relating to our equity compensation plans.
Purchases Of Equity Securities By The Company
The following table provides information with respect to shares of our common stock that we repurchased as part of our share repurchase program and shares of restricted stock granted under our stock incentive plans that we withheld upon vesting to satisfy our tax withholding obligations during the three months ended December 31, 2021.
| Total number of |
Approximate |
|||||||||||||||
| shares purchased |
dollar value of |
|||||||||||||||
| Total number |
Average |
as part of publicly |
shares that may yet |
|||||||||||||
| of shares |
price paid |
announced plans |
be purchased under |
|||||||||||||
| purchased |
per share(1) |
or programs(2) |
the plans or programs(2) |
|||||||||||||
| October 1 - October 31 |
— | $ | — | — | $ | 1,000,000,000 | ||||||||||
| November 1 - November 30 |
1,323,213 | 32.94 | 1,322,689 | 956,000,000 | ||||||||||||
| December 1 - December 31 |
1,759,925 | 32.62 | 1,759,925 | 899,000,000 | ||||||||||||
| Total |
3,083,138 | 32.76 | 3,082,614 | |||||||||||||
| (1) |
Represents net purchase price per share, exclusive of any fees or commissions. |
| (2) |
On October 26, 2021, our Board of Directors announced a new share repurchase program of $1 billion. In conjunction with the inception of this program, we retired our prior share repurchase program. Similar to our prior share repurchase program, the share repurchase program will be supported by our free cash flow generation. Repurchases may be made in the open market, including through accelerated share repurchase programs, or in privately negotiated transactions, and repurchases may be commenced or suspended from time to time without prior notice. Shares of common stock acquired through the repurchase program are held in treasury at cost. During the fourth quarter of 2021, we repurchased 3,082,614 shares of our common stock for approximately $101 million, excluding commissions. From January 1, 2022 through January 31, 2022, we repurchased an additional 851,000 shares of our common stock for approximately $31 million, excluding commissions. |
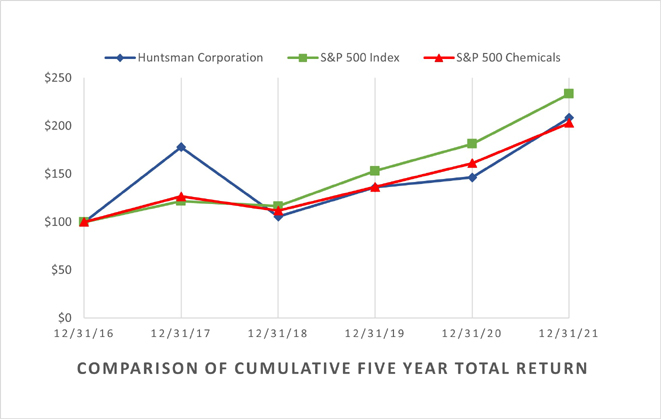
ITEM 6. SELECTED FINANCIAL DATA
[RESERVED]
ITEM 7. MANAGEMENT’S DISCUSSION AND ANALYSIS OF FINANCIAL CONDITION AND RESULTS OF OPERATIONS
Recent Developments
See “Part I. Item 1. Business—Recent Developments” for important updates that occurred in our businesses for the year ended December 31, 2021.
Outlook
We expect the following factors to impact our operating segments in the first quarter of 2022:
Polyurethanes:
| ● |
First quarter 2022 adjusted EBITDA estimated to be between $200 million and $220 million |
|
| ● |
Positive trends in construction and energy efficiency demand |
|
| ● |
Higher costs, specifically in Europe, remain a headwind |
|
| ● | Construction of new MDI splitter in Geismar, Louisiana is progressing and on track for completion in second quarter of 2022 |
Performance Products:
| ● |
First quarter 2022 adjusted EBITDA estimated to be between $115 million and $120 million |
|
| ● |
Commercial initiatives and solid demand drive year-over-year improvement |
Advanced Materials:
| ● |
First quarter 2022 adjusted EBITDA estimated to be between $58 million and $62 million | |
| ● |
Aerospace continues to recover | |
| ● |
Price increases offset higher raw material costs |
Textile Effects:
| ● |
First quarter 2022 adjusted EBITDA estimated to be between $26 million and $28 million |
|
| ● |
Favorable trends in sustainable solutions and strong order patterns |
In 2021, our effective tax rate was 16% and our adjusted effective tax rate was 19%. For 2022, our adjusted effective tax rate is expected to be approximately 22% to 24%. For further information, see “—Non-GAAP Financial Measures” and “Note 19. Income Taxes” to our consolidated financial statements.
Refer to “Item 1A. Risk Factors” for a discussion of the factors that may impact our business, results of operations, financial condition or liquidity and “Forward-Looking Statements” for a discussion of our use of forward-looking statements.
ReSULTS OF OPERATIONS
For each of our Company and Huntsman International, the following tables set forth our consolidated results of operations for the years ended December 31, 2021, 2020 and 2019 (dollars in millions, except per share amounts).
Huntsman Corporation
| December 31, |
Percent Change |
|||||||||||||||||||
| 2021 |
2020 |
2019 |
2021 vs 2020 |
2020 vs 2019 |
||||||||||||||||
| Revenues |
$ | 8,453 | $ | 6,018 | $ | 6,797 | 40 | % | (11 | )% | ||||||||||
| Cost of goods sold |
6,678 | 4,918 | 5,415 | 36 | % | (9 | )% | |||||||||||||
| Gross profit |
1,775 | 1,100 | 1,382 | 61 | % | (20 | )% | |||||||||||||
| Operating expenses |
940 | 618 | 954 | 52 | % | (35 | )% | |||||||||||||
| Restructuring, impairment and plant closing costs (credits) |
40 | 49 | (41 | ) | (18 | )% | NM | |||||||||||||
| Operating income |
795 | 433 | 469 | 84 | % | (8 | )% | |||||||||||||
| Interest expense, net |
(67 | ) | (86 | ) | (111 | ) | (22 | )% | (23 | )% | ||||||||||
| Equity in income of investment in unconsolidated affiliates |
143 | 42 | 54 | 240 | % | (22 | )% | |||||||||||||
| Fair value adjustments to Venator investment and related loss on disposal |
(28 | ) | (88 | ) | (18 | ) | (68 | )% | 389 | % | ||||||||||
| Loss on early extinguishment of debt |
(27 | ) | — | (23 | ) | NM | (100 | )% | ||||||||||||
| Income associated with the Albemarle Settlement, net |
465 | — | — | NM | — | |||||||||||||||
| Other income, net |
32 | 36 | 20 | (11 | )% | 80 | % | |||||||||||||
| Income from continuing operations before income taxes |
1,313 | 337 | 391 | 290 | % | (14 | )% | |||||||||||||
| Income tax (expense) benefit |
(209 | ) | (46 | ) | 38 | 354 | % | NM | ||||||||||||
| Income from continuing operations |
1,104 | 291 | 429 | 279 | % | (32 | )% | |||||||||||||
| Income from discontinued operations, net of tax |
— | 775 | 169 | (100 | )% | 359 | % | |||||||||||||
| Net income |
1,104 | 1,066 | 598 | 4 | % | 78 | % | |||||||||||||
| Reconciliation of net income to adjusted EBITDA: |
||||||||||||||||||||
| Net income attributable to noncontrolling interests |
(59 | ) | (32 | ) | (36 | ) | 84 | % | (11 | )% | ||||||||||
| Interest expense, net from continuing operations |
67 | 86 | 111 | (22 | )% | (23 | )% | |||||||||||||
| Income tax expense (benefit) from continuing operations |
209 | 46 | (38 | ) | 354 | % | NM | |||||||||||||
| Income tax expense from discontinued operations |
3 | 242 | 35 | (99 | )% | 591 | % | |||||||||||||
| Depreciation and amortization of continuing operations |
296 | 283 | 270 | 5 | % | 5 | % | |||||||||||||
| Depreciation and amortization of discontinued operations |
— | — | 61 | — | (100 | )% | ||||||||||||||
| Other adjustments: |
||||||||||||||||||||
| Business acquisition and integration expenses and purchase accounting inventory adjustments |
22 | 31 | 5 | |||||||||||||||||
| EBITDA from discontinued operations(2) |
(3 | ) | (1,017 | ) | (265 | ) | ||||||||||||||
| Fair value adjustments to Venator investment and related loss on disposal |
28 | 88 | 18 | |||||||||||||||||
| Loss on early extinguishment of debt |
27 | — | 23 | |||||||||||||||||
| Certain legal and other settlements and related expenses |
13 | 5 | 6 | |||||||||||||||||
| Income associated with the Albemarle Settlement, net |
(465 | ) | — | — | ||||||||||||||||
| (Gain) loss on sale of businesses/assets |
(30 | ) | (280 | ) | 21 | |||||||||||||||
| Income from transition services arrangements |
(8 | ) | (7 | ) | — | |||||||||||||||
| Certain nonrecurring information technology project implementation costs |
8 | 6 | 4 | |||||||||||||||||
| Amortization of pension and postretirement actuarial losses |
86 | 76 | 66 | |||||||||||||||||
| Plant incident remediation costs |
— | 2 | 8 | |||||||||||||||||
| Restructuring, impairment and plant closing and transition costs (credits)(3) |
45 | 52 | (41 | ) | ||||||||||||||||
| Adjusted EBITDA(1) |
$ | 1,343 | $ | 647 | $ | 846 | 108 | % | (24 | )% | ||||||||||
| Net cash provided by operating activities from continuing operations |
$ | 953 | $ | 277 | $ | 656 | 244 | % | (58 | )% | ||||||||||
| Net cash (used in) provided by investing activities from continuing operations |
(524 | ) | 1,462 | (201 | ) | NM | NM | |||||||||||||
| Net cash used in financing activities |
(977 | ) | (655 | ) | (450 | ) | 49 | % | 46 | % | ||||||||||
| Capital expenditures from continuing operations |
(342 | ) | (249 | ) | (274 | ) | 37 | % | (9 | )% | ||||||||||
Huntsman International
| December 31, |
Percent Change |
|||||||||||||||||||
| 2021 |
2020 |
2019 |
2021 vs 2020 |
2020 vs 2019 |
||||||||||||||||
| Revenues |
$ | 8,453 | $ | 6,018 | $ | 6,797 | 40 | % | (11 | )% | ||||||||||
| Cost of goods sold |
6,678 | 4,918 | 5,415 | 36 | % | (9 | )% | |||||||||||||
| Gross profit |
1,775 | 1,100 | 1,382 | 61 | % | (20 | )% | |||||||||||||
| Operating expenses |
933 | 612 | 949 | 52 | % | (36 | )% | |||||||||||||
| Restructuring, impairment and plant closing costs (credits) |
40 | 49 | (41 | ) | (18 | )% | NM | |||||||||||||
| Operating income |
802 | 439 | 474 | 83 | % | (7 | )% | |||||||||||||
| Interest expense, net |
(67 | ) | (88 | ) | (126 | ) | (24 | )% | (30 | )% | ||||||||||
| Equity in income of investment in unconsolidated affiliates |
143 | 42 | 54 | 240 | % | (22 | )% | |||||||||||||
| Fair value adjustments to Venator investment and related loss on disposal |
(28 | ) | (88 | ) | (18 | ) | (68 | )% | 389 | % | ||||||||||
| Loss on early extinguishment of debt |
(27 | ) | — | (23 | ) | NM | (100 | )% | ||||||||||||
| Income associated with the Albemarle Settlement, net |
465 | — | — | NM | — | |||||||||||||||
| Other income, net |
29 | 33 | 16 | (12 | )% | 106 | % | |||||||||||||
| Income from continuing operations before income taxes |
1,317 | 338 | 377 | 290 | % | (10 | )% | |||||||||||||
| Income tax (expense) benefit |
(210 | ) | (46 | ) | 41 | 357 | % | NM | ||||||||||||
| Income from continuing operations |
1,107 | 292 | 418 | 279 | % | (30 | )% | |||||||||||||
| Income from discontinued operations, net of tax |
— | 775 | 169 | (100 | )% | 359 | % | |||||||||||||
| Net income |
1,107 | 1,067 | 587 | 4 | % | 82 | % | |||||||||||||
| Reconciliation of net income to adjusted EBITDA: |
||||||||||||||||||||
| Net income attributable to noncontrolling interests |
(59 | ) | (32 | ) | (36 | ) | 84 | % | (11 | )% | ||||||||||
| Interest expense, net from continuing operations |
67 | 88 | 126 | (24 | )% | (30 | )% | |||||||||||||
| Income tax expense (benefit) from continuing operations |
210 | 46 | (41 | ) | 357 | % | NM | |||||||||||||
| Income tax expense from discontinued operations |
3 | 242 | 35 | (99 | )% | 591 | % | |||||||||||||
| Depreciation and amortization of continuing operations |
296 | 283 | 270 | 5 | % | 5 | % | |||||||||||||
| Depreciation and amortization of discontinued operations |
— | — | 61 | — | (100 | )% | ||||||||||||||
| Other adjustments: |
||||||||||||||||||||
| Business acquisition and integration expenses and purchase accounting inventory adjustments |
22 | 31 | 5 | |||||||||||||||||
| EBITDA from discontinued operations(2) |
(3 | ) | (1,017 | ) | (265 | ) | ||||||||||||||
| Fair value adjustments to Venator investment and related loss on disposal |
28 | 88 | 18 | |||||||||||||||||
| Loss on early extinguishment of debt |
27 | — | 23 | |||||||||||||||||
| Certain legal and other settlements and related expenses |
13 | 5 | 6 | |||||||||||||||||
| Income associated with the Albemarle Settlement, net |
(465 | ) | — | — | ||||||||||||||||
| (Gain) loss on sale of businesses/assets |
(30 | ) | (280 | ) | 21 | |||||||||||||||
| Income from transition services arrangements |
(8 | ) | (7 | ) | — | |||||||||||||||
| Certain nonrecurring information technology project implementation costs |
8 | 6 | 4 | |||||||||||||||||
| Amortization of pension and postretirement actuarial losses |
89 | 79 | 70 | |||||||||||||||||
| Plant incident remediation costs |
— | 2 | 8 | |||||||||||||||||
| Restructuring, impairment and plant closing and transition costs (credits)(3) |
45 | 52 | (41 | ) | ||||||||||||||||
| Adjusted EBITDA(1) |
$ | 1,350 | $ | 653 | $ | 851 | 107 | % | (23 | )% | ||||||||||
| Net cash provided by operating activities from continuing operations |
$ | 956 | $ | 279 | $ | 645 | 243 | % | (57 | )% | ||||||||||
| Net cash (used in) provided by investing activities from continuing operations |
(726 | ) | 1,736 | (202 | ) | NM | NM | |||||||||||||
| Net cash used in financing activities |
(778 | ) | (933 | ) | (438 | ) | (17 | )% | 113 | % | ||||||||||
| Capital expenditures from continuing operations |
(342 | ) | (249 | ) | (274 | ) | 37 | % | (9 | )% | ||||||||||
Huntsman Corporation
| Year ended |
Year ended |
Year ended |
||||||||||||||||||||||||||||||||||
| December 31, 2021 |
December 31, 2020 |
December 31, 2019 |
||||||||||||||||||||||||||||||||||
| Tax |
Tax |
Tax |
||||||||||||||||||||||||||||||||||
| Gross |
and other(4) |
Net |
Gross |
and other(4) |
Net |
Gross |
and other(4) |
Net |
||||||||||||||||||||||||||||
| Reconciliation of net income to adjusted net income |
||||||||||||||||||||||||||||||||||||
| Net income |
$ | 1,104 | $ | 1,066 | $ | 598 | ||||||||||||||||||||||||||||||
| Net income attributable to noncontrolling interests |
(59 | ) | (32 | ) | (36 | ) | ||||||||||||||||||||||||||||||
| Business acquisition and integration expenses and purchase accounting inventory adjustments |
$ | 22 | $ | (6 | ) | 16 | $ | 31 | $ | (6 | ) | 25 | $ | 5 | $ | — | 5 | |||||||||||||||||||
| Income from discontinued operations(2)(6) |
(3 | ) | 3 | — | (1,017 | ) | 242 | (775 | ) | (265 | ) | 96 | (169 | ) | ||||||||||||||||||||||
| Fair value adjustments to Venator investment and related loss on disposal |
28 | — | 28 | 88 | (9 | ) | 79 | 18 | — | 18 | ||||||||||||||||||||||||||
| Loss on early extinguishment of debt |
27 | (6 | ) | 21 | — | — | — | 23 | (5 | ) | 18 | |||||||||||||||||||||||||
| Certain legal and other settlements and related expenses |
13 | (3 | ) | 10 | 5 | (1 | ) | 4 | 6 | (1 | ) | 5 | ||||||||||||||||||||||||
| Income associated with the Albemarle Settlement, net |
(465 | ) | 55 | (410 | ) | — | — | — | — | — | — | |||||||||||||||||||||||||
| (Gain) loss on sale of businesses/assets |
(30 | ) | 3 | (27 | ) | (280 | ) | 31 | (249 | ) | 21 | (5 | ) | 16 | ||||||||||||||||||||||
| Income from transition services arrangements |
(8 | ) | 2 | (6 | ) | (7 | ) | 2 | (5 | ) | — | — | — | |||||||||||||||||||||||
| Certain nonrecurring information technology project implementation costs |
8 | (2 | ) | 6 | 6 | (1 | ) | 5 | 4 | (1 | ) | 3 | ||||||||||||||||||||||||
| Amortization of pension and postretirement actuarial losses |
86 | (19 | ) | 67 | 76 | (17 | ) | 59 | 66 | (16 | ) | 50 | ||||||||||||||||||||||||
| Significant activities related to deferred tax assets and liabilities(5) |
— | — | — | — | — | — | — | (128 | ) | (128 | ) | |||||||||||||||||||||||||
| U.S. Tax Reform Act impact on income tax expense |
— | — | — | — | — | — | — | (1 | ) | (1 | ) | |||||||||||||||||||||||||
| Plant incident remediation costs |
— | — | — | 2 | — | 2 | 8 | (2 | ) | 6 | ||||||||||||||||||||||||||
| Restructuring, impairment and plant closing and transition costs (credits)(3) |
45 | (11 | ) | 34 | 52 | (13 | ) | 39 | (41 | ) | 9 | (32 | ) | |||||||||||||||||||||||
| Adjusted net income(1) |
$ | 784 | $ | 218 | $ | 353 | ||||||||||||||||||||||||||||||
| Weighted average shares-basic |
219.2 | 220.6 | 228.9 | |||||||||||||||||||||||||||||||||
| Weighted average shares-diluted |
221.4 | 221.9 | 230.6 | |||||||||||||||||||||||||||||||||
| Basic net income attributable to Huntsman Corporation per share: |
||||||||||||||||||||||||||||||||||||
| Income from continuing operations |
$ | 4.77 | $ | 1.18 | $ | 1.72 | ||||||||||||||||||||||||||||||
| Income from discontinued operations |
— | 3.51 | 0.74 | |||||||||||||||||||||||||||||||||
| Net income |
$ | 4.77 | $ | 4.69 | $ | 2.46 | ||||||||||||||||||||||||||||||
| Diluted net income attributable to Huntsman Corporation per share: |
||||||||||||||||||||||||||||||||||||
| Income from continuing operations |
$ | 4.72 | $ | 1.17 | $ | 1.70 | ||||||||||||||||||||||||||||||
| Income from discontinued operations |
— | 3.49 | 0.74 | |||||||||||||||||||||||||||||||||
| Net income |
$ | 4.72 | $ | 4.66 | $ | 2.44 | ||||||||||||||||||||||||||||||
| Other non-GAAP measures: |
||||||||||||||||||||||||||||||||||||
| Diluted adjusted net income per share(1) |
$ | 3.54 | $ | 0.98 | $ | 1.53 | ||||||||||||||||||||||||||||||
| Net cash provided by operating activities from continuing operations |
$ | 953 | $ | 277 | $ | 656 | ||||||||||||||||||||||||||||||
| Capital expenditures from continuing operations |
(342 | ) | (249 | ) | (274 | ) | ||||||||||||||||||||||||||||||
| Free cash flow from continuing operations(1) |
$ | 611 | $ | 28 | $ | 382 | ||||||||||||||||||||||||||||||
| Effective tax rate |
16 | % | 14 | % | (10 | )% | ||||||||||||||||||||||||||||||
| Impact of non-GAAP adjustments |
3 | % | 5 | % | 32 | % | ||||||||||||||||||||||||||||||
| Adjusted effective tax rate(7) |
19 | % | 19 | % | 22 | % | ||||||||||||||||||||||||||||||
| Other cash flow measure: |
||||||||||||||||||||||||||||||||||||
| Net cash proceeds from the Albemarle Settlement(8) |
$ | 333 | $ | — | $ | — | ||||||||||||||||||||||||||||||
| Taxes paid on sale of businesses(9) |
(3 | ) | (257 | ) | — | |||||||||||||||||||||||||||||||
NM—Not meaningful
| (1) |
See “—Non-GAAP Financial Measures.” |
| (2) | Includes the gain on the sale of our Chemical Intermediates Businesses in 2020. |
| (3) |
Includes costs associated with transition activities relating primarily to our Corporate program to optimize our global approach to leverage shared services capabilities as well as our 2020 acquisition of CVC Thermoset Specialties, a North American specialty chemical manufacturer serving the industrial composites, adhesives and coatings markets (“CVC Thermoset Specialties Acquisition”). |
| (4) |
The income tax impacts, if any, are computed on the pre-tax adjustments using a with and without approach. |
| (5) |
During the year ended December 31, 2019, we recorded $153 million of tax benefit relating to the outside basis difference in our investment in Venator, we recorded $18 million of tax benefit relating to realized tax losses on our remaining interest in Venator, we established $11 million of significant income tax valuation allowance in Australia and we recorded $32 million of deferred tax expense due to the reduction of tax rates in Switzerland. |
| (6) |
In addition to income tax impacts, this adjusting item is also impacted by depreciation and amortization expense and interest expense. |
| (7) | For details regarding the tax impacts of our non-GAAP adjustments, please see the reconciliation of our net income to adjusted net income noted above. |
| (8) | Represents net cash proceeds received in connection with the Albemarle Settlement. For more information, see “Part I. Item 1. Business—Recent Developments.” |
| (9) | Represents the taxes paid in connection with the sale of the Chemical Intermediates Businesses and the sale of the India-based DIY business. For more information, see “Note 4. Discontinued Operations and Business Dispositions” to our consolidated financial statements. |
Non-GAAP Financial Measures
Our consolidated financial statements are prepared in accordance with U.S. GAAP, which we supplement with certain non-GAAP financial information. These non-GAAP measures should not be considered in isolation or as a substitute for the related U.S. GAAP measures, and other companies may define such measures differently. We encourage investors to review our financial statements and the reconciliation of the non-GAAP financial measures to the most directly comparable U.S. GAAP financial measures in their entirety and not to rely on any single financial measure. These non-GAAP measures exclude the impact of certain income and expenses that we do not believe are indicative of our core operating results.
Adjusted EBITDA
Our management uses adjusted EBITDA to assess financial performance. Adjusted EBITDA is defined as net income of Huntsman Corporation or Huntsman International, as appropriate, before interest, income tax, depreciation and amortization, net income attributable to noncontrolling interests and certain Corporate and other items, as well as eliminating the following adjustments: (a) business acquisition and integration expenses and purchase accounting inventory adjustments; (b) EBITDA from discontinued operations; (c) fair value adjustments to Venator investment and related loss on disposal; (d) loss on early extinguishment of debt; (e) certain legal and other settlements and related expenses; (f) income associated with the Albemarle Settlement, net; (g) (gain) loss on sale of businesses/assets; (h) income from transition services arrangements related to the sale of our Chemical Intermediates Businesses to Indorama; (i) certain nonrecurring information technology project implementation costs; (j) amortization of pension and postretirement actuarial losses; (k) plant incident remediation costs; and (l) restructuring, impairment and plant closing and transition costs (credits). Starting in the fourth quarter of 2021, we began to include income associated with the Albemarle Settlement, net, in our adjustments since such income represents a one-time legal settlement and does not reflect our ongoing financial performance. We believe that net income of Huntsman Corporation or Huntsman International, as appropriate, is the performance measure calculated and presented in accordance with U.S. GAAP that is most directly comparable to adjusted EBITDA.
We believe adjusted EBITDA is useful to investors in assessing the businesses’ ongoing financial performance and provides improved comparability between periods through the exclusion of certain items that management believes are not indicative of the businesses’ operational profitability and that may obscure underlying business results and trends. However, this measure should not be considered in isolation or viewed as a substitute for net income of Huntsman Corporation or Huntsman International, as appropriate, or other measures of performance determined in accordance with U.S. GAAP. Moreover, adjusted EBITDA as used herein is not necessarily comparable to other similarly titled measures of other companies due to potential inconsistencies in the methods of calculation. Our management believes this measure is useful to compare general operating performance from period to period and to make certain related management decisions. Adjusted EBITDA is also used by securities analysts, lenders and others in their evaluation of different companies because it excludes certain items that can vary widely across different industries or among companies within the same industry. For example, interest expense can be highly dependent on a company’s capital structure, debt levels and credit ratings. Therefore, the impact of interest expense on earnings can vary significantly among companies. In addition, the tax positions of companies can vary because of their differing abilities to take advantage of tax benefits and because of the tax policies of the various jurisdictions in which they operate. As a result, effective tax rates and tax expense can vary considerably among companies. Finally, companies employ productive assets of different ages and utilize different methods of acquiring and depreciating such assets. This can result in considerable variability in the relative costs of productive assets and the depreciation and amortization expense among companies.
Nevertheless, our management recognizes that there are material limitations associated with the use of adjusted EBITDA in the evaluation of our Company as compared to net income of Huntsman Corporation or Huntsman International, as appropriate, which reflects overall financial performance. For example, we have borrowed money in order to finance our operations and interest expense is a necessary element of our costs and ability to generate revenue. Our management compensates for the limitations of using adjusted EBITDA by using this measure to supplement U.S. GAAP results to provide a more complete understanding of the factors and trends affecting the business rather than U.S. GAAP results alone.
Adjusted Net Income
Adjusted net income is computed by eliminating the after tax amounts related to the following from net income attributable to Huntsman Corporation: (a) business acquisition and integration expenses and purchase accounting inventory adjustments; (b) income from discontinued operations; (c) fair value adjustments to Venator investment and related loss on disposal; (d) loss on early extinguishment of debt; (e) certain legal and other settlements and related expenses; (f) income associated with the Albemarle Settlement, net; (g) (gain) loss on sale of businesses/assets; (h) income from transition services arrangements associated with the sale of our Chemical Intermediates Businesses to Indorama; (i) certain nonrecurring information technology project implementation costs; (j) amortization of pension and postretirement actuarial losses; (k) significant activities related to deferred tax assets and liabilities; (l) U.S. Tax Reform Act impact on income tax expense; (m) plant incident remediation costs; and (n) restructuring, impairment and plant closing and transition costs (credits). Basic adjusted net income per share excludes dilution and is computed by dividing adjusted net income by the weighted average number of shares outstanding during the period. Adjusted diluted net income per share reflects all potential dilutive common shares outstanding during the period and is computed by dividing adjusted net income by the weighted average number of shares outstanding during the period increased by the number of additional shares that would have been outstanding as dilutive securities. Adjusted net income and adjusted net income per share amounts are presented solely as supplemental information.
We believe adjusted net income is useful to investors in assessing the businesses’ ongoing financial performance and provides improved comparability between periods through the exclusion of certain items that management believes are not indicative of the businesses’ operational profitability and that may obscure underlying business results and trends.
Free Cash Flow
We believe free cash flow is an important indicator of our liquidity as it measures the amount of cash we generate. Management internally uses a free cash flow measure: (a) to evaluate our liquidity, (b) evaluate strategic investments, (c) plan stock buyback and dividend levels and (d) evaluate our ability to incur and service debt.
Adjusted Effective Tax Rate
We believe that the effective tax rate of Huntsman Corporation or Huntsman International, as appropriate, is the performance measure calculated and presented in accordance with U.S. GAAP that is most directly comparable to adjusted effective tax rate. We believe our adjusted effective tax rate provides improved comparability between periods through the exclusion of certain items, such as, business acquisition and integration expenses and purchase accounting inventory adjustments, certain legal and other settlements and related expenses, gains on sale of businesses/assets and certain tax only items, including tax law changes not yet enacted, that we believe are not indicative of the businesses’ operational profitability and that may obscure underlying business results and trends.
Our forward-looking adjusted effective tax rate is calculated based on our forecast effective tax rate, and the range of our forward-looking adjusted effective tax rate equals the range of our forecast effective tax rate. We disclose forward-looking adjusted effective tax rate because we cannot adequately forecast certain items and events that may or may not impact us in the near future, such as business acquisition and integration expenses and purchase accounting inventory adjustments, certain legal and other settlements and related expenses, gains on sale of businesses/assets and certain tax only items, including tax law changes not yet enacted. Each of such adjustment has not yet occurred, is out of our control and/or cannot be reasonably predicted. In our view, our forward-looking adjusted effective tax rate represents the forecast effective tax rate on our underlying business operations but does not reflect any adjustments related to the items noted above that may occur and can cause our effective tax rate to differ.
Year Ended December 31, 2021 Compared with Year Ended December 31, 2020
For the year ended December 31, 2021, income from continuing operations attributable to Huntsman Corporation was $1,045 million compared with income from continuing operations attributable to Huntsman Corporation of $259 million in the 2020 period. For the year ended December 31, 2021, income from continuing operations attributable to Huntsman International was $1,048 million compared with income from continuing operations attributable to Huntsman International of $260 million in the 2020 period. The increase of $786 million in income from continuing operations attributable to Huntsman Corporation and the increase of $788 million in income from continuing operations attributable to Huntsman International was the result of the following items:
| ● |
Revenues for the year ended December 31, 2021 increased by $2,435 million or 40%, as compared with the 2020 period. The increase was primarily due to higher average selling prices as well as higher sales volumes in all our segments. See “—Segment Analysis” below. |
| ● |
Gross profit for the year ended December 31, 2021 increased by $675 million, or 61%, as compared with the 2020 period. The increase resulted from higher gross profits in all our segments. See “—Segment Analysis” below. |
| ● |
Our operating expenses and the operating expenses of Huntsman International for the year ended December 31, 2021 increased by $322 million and $321 million, respectively, or 52% for both, as compared with the 2020 period, primarily related to higher selling, general and administrative costs and the gain on sale of our India-based DIY business in 2020. See “Note 4. Discontinued Operations and Business Dispositions—Sale of India-Based-Do-It-Yourself Consumer Adhesives Business” to our consolidated financial statements. |
| ● |
Restructuring, impairment and plant closing costs (credits) for the year ended December 31, 2021 decreased by $9 million, or 18%, as compared with the 2020 period. For more information on restructuring activities, see “Note 12. Restructuring, Impairment and Plant Closing Costs (Credits)” to our consolidated financial statements. |
| ● | Our interest expense, net and the interest expense, net of Huntsman International for the year ended December 31, 2021 decreased by $19 million and $21 million, respectively, or 22% and 24%, respectively, as compared with the 2020 period, primarily related to the redemption in full of our 2021 Senior Notes in the first quarter of 2021. |
| ● | Equity in income of investment in unconsolidated affiliates for the year ended December 31, 2020 increased to $143 million from $42 million in the 2020 period. The increase was primarily attributable to an increase in income at our PO/MTBE joint venture in China, in which we hold a 49% interest. |
| ● |
We recorded a loss of $28 million in fair value adjustments to our investment in Venator and related loss on disposal for the year ended December 31, 2021 compared to a loss of $88 million in the 2020 period. For more information, see “Note 4. Discontinued Operations and Business Dispositions—Separation and Deconsolidation of Venator” to our consolidated financial statements. |
| ● |
Loss on early extinguishment of debt for the year ended December 31, 2021 was $27 million compared to nil in the 2020 period, primarily due to the redemption in full of our 2022 Senior Notes in the second quarter of 2021. See “Note. 14. Debt—Notes” to our consolidated financial statements. |
| ● | Income associated with the Albemarle Settlement, net was $465 million for the year ended December 31, 2021 related to our arbitration award against Albemarle Corporation for fraud and breach of contract. On November 4, 2021, Albemarle agreed to waive any appeal and pay $665 million to us. For more information, see “Part I. Item I. Business—Recent Developments—Albemarle Settlement.” |
| ● |
Our income tax expense for the year ended December 31, 2021 increased to $209 million from $46 million in the 2020 period. The income tax expense of Huntsman International for the year ended December 31, 2021 increased to $210 million from $46 million in the 2020 period. The increase in income tax expense was primarily due to an increase in income from continuing operations before income taxes. Our income tax expense is significantly affected by the mix of income and losses in the tax jurisdictions in which we operate, along with the impact of valuation allowances in certain tax jurisdictions. For further information concerning income taxes, see “Note 19. Income Taxes” to our consolidated financial statements. |
Segment Analysis
Year Ended December 31, 2021 Compared with Year Ended December 31, 2020
| Percent |
||||||||||||
| Change |
||||||||||||
| Year ended December 31, |
Favorable |
|||||||||||
| (Dollars in millions) |
2021 |
2020 |
(Unfavorable) |
|||||||||
| Revenues |
||||||||||||
| Polyurethanes |
$ | 5,019 | $ | 3,584 | 40 | % | ||||||
| Performance Products |
1,485 | 1,023 | 45 | % | ||||||||
| Advanced Materials |
1,198 | 839 | 43 | % | ||||||||
| Textile Effects |
783 | 597 | 31 | % | ||||||||
| Total reportable segments’ revenues |
8,485 | 6,043 | 40 | % | ||||||||
| Intersegment eliminations |
(32 | ) | (25 | ) | NM | |||||||
| Total |
$ | 8,453 | $ | 6,018 | 40 | % | ||||||
| Huntsman Corporation |
||||||||||||
| Adjusted EBITDA(1) |
||||||||||||
| Polyurethanes |
$ | 879 | $ | 472 | 86 | % | ||||||
| Performance Products |
359 | 164 | 119 | % | ||||||||
| Advanced Materials |
204 | 130 | 57 | % | ||||||||
| Textile Effects |
97 | 42 | 131 | % | ||||||||
| Total reportable segments’ adjusted EBITDA |
1,539 | 808 | 90 | % | ||||||||
| Corporate and other |
(196 | ) | (161 | ) | (22 | )% | ||||||
| Total |
$ | 1,343 | $ | 647 | 108 | % | ||||||
| Huntsman International |
||||||||||||
| Adjusted EBITDA(1) |
||||||||||||
| Polyurethanes |
$ | 879 | $ | 472 | 86 | % | ||||||
| Performance Products |
359 | 164 | 119 | % | ||||||||
| Advanced Materials |
204 | 130 | 57 | % | ||||||||
| Textile Effects |
97 | 42 | 131 | % | ||||||||
| Total reportable segments’ adjusted EBITDA |
1,539 | 808 | 90 | % | ||||||||
| Corporate and other |
(189 | ) | (155 | ) | (22 | )% | ||||||
| Total |
$ | 1,350 | $ | 653 | 107 | % | ||||||
|
|
|
| NM—Not meaningful |
|
| (1) | For more information, including reconciliation of total reportable segments’ adjusted EBITDA to income from continuing operations before income taxes of Huntsman Corporation or Huntsman International, as appropriate, see “Note 26. Operating Segment Information” to our consolidated financial statements. |
| Year ended December 31, 2021 vs 2020 |
||||||||||||||||
| Average Selling Prices(1) |
||||||||||||||||
| Local |
Foreign Currency |
Mix & |
Sales |
|||||||||||||
| Currency |
Translation Impact |
Other |
Volumes(2) |
|||||||||||||
| Period-Over-Period (Decrease) Increase |
||||||||||||||||
| Polyurethanes |
30 | % | 2 | % | 4 | % | 4 | % | ||||||||
| Performance Products |
35 | % | 3 | % | (4 | )% | 11 | % | ||||||||
| Advanced Materials |
13 | % | 3 | % | 17 | % | 10 | % | ||||||||
| Textile Effects |
5 | % | 3 | % | 3 | % | 20 | % | ||||||||
| Fourth Quarter 2021 vs Third Quarter 2021 |
||||||||||||||||
| Average Selling Prices(1) |
||||||||||||||||
| Local |
Foreign Currency |
Mix & |
Sales |
|||||||||||||
| Currency |
Translation Impact |
Other |
Volumes(2) |
|||||||||||||
| Period-Over-Period (Decrease) Increase |
||||||||||||||||
| Polyurethanes |
6 | % | (1 | )% | (3 | )% | (3 | )% | ||||||||
| Performance Products |
8 | % | (1 | )% | — | (4 | )% | |||||||||
| Advanced Materials |
10 | % | (1 | )% | (4 | )% | (1 | )% | ||||||||
| Textile Effects |
6 | % | (1 | )% | 3 | % | (4 | )% | ||||||||
| (1) |
Excludes revenues from tolling arrangements, byproducts and raw materials. |
| (2) |
Excludes sales volumes of byproducts and raw materials. |
Polyurethanes
The increase in revenues in our Polyurethanes segment for 2021 compared to 2020 was due to higher MDI average selling prices and higher sales volumes. MDI average selling prices increased mostly in China and Europe with increases in our Americas region occurring during the second half of 2021. Sales volumes increased primarily due to stronger demand in relation to the ongoing recovery from the global economic slowdown, partially offset by some unplanned downtime resulting from the U.S. Gulf Coast Winter Storm Uri that occurred in the first quarter of 2021, the scheduled turnaround at our Rotterdam, Netherlands facility during the second quarter of 2021 and the impact of Hurricane Ida at our Geismar, Louisiana facility that occurred in the third quarter of 2021. The increase in segment adjusted EBITDA was primarily due to higher MDI margins resulting from higher MDI pricing and higher sales volumes as well as stronger earnings from our PO/MTBE joint venture in China, partially offset by higher raw material costs
Performance Products
The increase in revenues in our Performance Products segment for 2021 compared to 2020 was due to higher average selling prices and higher sales volumes. Average selling prices increased primarily due to stronger demand in relation to the ongoing recovery from the global economic slowdown as well as in response to an increase in raw material costs. Sales volumes also increased primarily due to stronger demand. The increase in segment adjusted EBITDA was primarily due to increased revenue and margins, partially offset by increased fixed costs.
Advanced Materials
The increase in revenues in our Advanced Materials segment for 2021 compared to 2020 was due to higher sales volumes, higher average selling prices and the favorable net impact of the CVC Thermoset Specialties Acquisition, the Gabriel Acquisition and the sale of the India-based DIY business. See “Note 3. Business Combinations and Acquisitions” and “Note 4. Discontinued Operations and Business Dispositions” to our consolidated financial statements. Excluding our recent acquisitions and divestiture, sales volumes increased across our specialty markets, primarily in relation to the ongoing recovery from the global economic slowdown. Average selling prices increased largely in response to higher raw material costs and due to the impact of a weaker U.S. dollar against major international currencies. The increase in segment adjusted EBITDA was primarily due to higher sales volumes and the benefit from our recent acquisitions.
Textile Effects
The increase in revenues in our Textile Effects segment for 2021 compared to 2020 was due to higher sales volumes and higher average selling prices. Sales volumes increased primarily due to increased demand resulting from the ongoing recovery from the global economic slowdown. Average selling prices increased mainly in response to higher raw material and logistics costs and due to the impact of a weaker U.S. dollar against major international currencies. The increase in segment adjusted EBITDA was primarily due to higher sales revenues, partially offset by higher fixed costs.
Corporate and other
Corporate and other, net includes unallocated corporate overhead, unallocated foreign currency exchange gains and losses, LIFO inventory valuation reserve adjustments, loss on early extinguishment of debt, unallocated restructuring, impairment and plant closing costs, nonoperating income and expense and gains and losses on the disposition of corporate assets. For 2021, adjusted EBITDA from Corporate and other for Huntsman Corporation decreased by $35 million to a loss of $196 million from a loss of $161 million for 2020. For 2021, adjusted EBITDA from Corporate and other for Huntsman International decreased by $34 million to a loss of $189 million from a loss of $155 million for 2020. The decrease in adjusted EBITDA from Corporate and other resulted primarily from a charge from a LIFO inventory reserve adjustment and an increase in corporate overhead costs, partially offset by an increase in unallocated foreign currency exchange gains.
Year Ended December 31, 2020 Compared with Year Ended December 31, 2019
For a comparison of our results of operations for the fiscal years ended December 31, 2020 and 2019, see “Part II. Item 7. Management’s Discussion and Analysis of Financial Condition and Results of Operations” of our Annual Report on Form 10-K for the fiscal year ended December 31, 2020 filed with the SEC on February 12, 2021.
The following is a discussion of our liquidity and capital resources and generally does not include separate information with respect to Huntsman International in accordance with General Instruction I of Form 10-K.
Cash Flows For Year Ended December 31, 2021 Compared with Year Ended December 31, 2020
Net cash provided by operating activities from continuing operations for 2021 and 2020 was $953 million and $277 million, respectively. The increase in net cash provided by operating activities from continuing operations during 2021 compared with 2020 was primarily attributable to increased operating income as described in “—Results of Operations” above, including $332.5 million in proceeds associated with the Albemarle Settlement, partially offset by a net cash outflow of $103 million related to changes in operating assets and liabilities for 2021 as compared with 2020.
Net cash (used in) provided by investing activities from continuing operations for 2021 and 2020 was $(524) million and $1,462 million, respectively. During 2021 and 2020, we paid $342 million and $249 million, respectively, for capital expenditures, including $100 million and $54 million during 2021 and 2020, respectively, on a new MDI splitter in Geismar, Louisiana. During 2021, we received $43 million for the sale of businesses, primarily due to the receipt of $28 million pursuant to an earnout provision in connection with the sale of our India-based DIY business. In January 2020, we received approximately $1.92 billion for the sale of our Chemical Intermediates Businesses, and in November 2020, we received approximately $257 million for the sale of the India-based DIY business. See “Note 4. Discontinued Operations and Business Dispositions—Sale of Chemical Intermediates Businesses” and “Note 4. Discontinued Operations and Business Dispositions—Sale of India-Based Do-It-Yourself Consumer Adhesives Business” to our consolidated financial statements. During 2021, we paid $245 million for the acquisition of businesses, primarily related to approximately $242 million paid for the Gabriel Acquisition, net of cash acquired. During 2020, we paid approximately $650 million in connection with the Icynene-Lapolla Acquisition and the CVC Thermoset Specialties Acquisition, net of cash acquired. See “Note 3. Business Combinations and Acquisitions” to our consolidated financial statements. In December 2020, we completed the sale of approximately 42.4 million ordinary shares of Venator and received approximately $99 million. See “Note 4. Discontinued Operations and Business Dispositions—Separation and Deconsolidation of Venator” to our consolidated financial statements. During the year ended December 31, 2020, we entered into a sale and leaseback agreement to sell certain properties in Basel, Switzerland, for which we received approximately $73 million in proceeds from the sale of assets.
Net cash used in financing activities for 2021 and 2020 was $977 million and $655 million, respectively. The increase in net cash used in financing activities was primarily due to the redemption in full of €445 million (approximately $541 million) in aggregate principal amount of our 2021 Senior Notes and the redemption in full of $400 million in aggregate principal amount of our 2022 Senior Notes during 2021. Additionally, our repurchases of common stock increased by $104 million during 2021 compared with 2020. During 2021, we issued $400 million in aggregate principal amount of our 2031 Senior Notes and received borrowings of approximately 177 million SAR (approximately $47 million) related to funding on a new term loan facility of our consolidated 50%-owned joint venture, AAC. See “Note 14. Debt—Direct and Subsidiary Debt—Variable Interest Entity Debt” to our consolidated financial statements. During 2020 we repaid a total of $203 million on our Revolving Credit Facility and repaid in full $109 million on our 364-day term loan facility (the “2019 Term Loan”).
Free cash flow from continuing operations for 2021 and 2020 were proceeds of cash of $611 million and $28 million, respectively. The increase in free cash flow was primarily attributable to the increase in cash provided by operating activities from continuing operations, partially offset by an increase in cash used for capital expenditures during 2021 as compared with 2020.
Cash Flows For Year Ended December 31, 2020 Compared with Year Ended December 31, 2019
For a comparison of our cash flows for the fiscal years ended December 31, 2020 and 2019, see “Part II. Item 7. Management’s Discussion and Analysis of Financial Condition and Results of Operations” of our Annual Report on Form 10-K for the fiscal year ended December 31, 2020 filed with the SEC on February 12, 2021.
Changes in Financial Condition
The following information summarizes our working capital (dollars in millions):
| December 31, |
Less |
December 31, |
Increase |
Percent |
||||||||||||||||||||
| 2021 |
Acquisition(1) |
Subtotal |
2020 |
(Decrease) |
Change |
|||||||||||||||||||
| Cash and cash equivalents |
$ | 1,041 | $ | (9 | ) | $ | 1,032 | $ | 1,593 | $ | (561 | ) | (35 | )% | ||||||||||
| Accounts and notes receivable, net |
1,186 | (13 | ) | 1,173 | 910 | 263 | 29 | % | ||||||||||||||||
| Inventories |
1,201 | (23 | ) | 1,178 | 848 | 330 | 39 | % | ||||||||||||||||
| Receivable associated with the Albemarle Settlement |
333 | — | 333 | — | 333 | NM | ||||||||||||||||||
| Other current assets |
167 | — | 167 | 217 | (50 | ) | (23 | )% | ||||||||||||||||
| Total current assets |
3,928 | (45 | ) | 3,883 | 3,568 | 315 | 9 | % | ||||||||||||||||
| Accounts payable |
1,208 | (7 | ) | 1,201 | 876 | 325 | 37 | % | ||||||||||||||||
| Accrued liabilities |
780 | (3 | ) | 777 | 458 | 319 | 70 | % | ||||||||||||||||
| Current portion of debt |
12 | — | 12 | 593 | (581 | ) | (98 | )% | ||||||||||||||||
| Current operating lease liabilities |
51 | — | 51 | 52 | (1 | ) | (2 | )% | ||||||||||||||||
| Total current liabilities |
2,051 | (10 | ) | 2,041 | 1,979 | 62 | 3 | % | ||||||||||||||||
| Working capital |
$ | 1,877 | $ | (35 | ) | $ | 1,842 | $ | 1,589 | $ | 253 | 16 | % | |||||||||||
| (1) |
Represents amounts related to the Gabriel Acquisition. For more information, see “Note 3. Business Combinations and Acquisitions —Acquisition of Gabriel Performance Products” to our consolidated financial statements. |
Our working capital increased by $253 million as a result of the net impact of the following significant changes:
| ● |
The decrease in cash and cash equivalents of $561 million resulted from the matters identified on our consolidated statements of cash flows. See also “—Cash Flows Year Ended December 31, 2021 Compared with Year Ended December 31, 2020.” |
| ● |
Accounts and notes receivable increased by $263 million primarily due to higher revenues in the fourth quarter of 2021 compared to the fourth quarter of 2020. |
| ● |
Inventories increased by $330 million primarily due to higher inventory costs and volumes. |
| ● | Receivable associated with the Albemarle Settlement for $665 million, of which we received $332.5 million on December 2, 2021 and expect to receive a final payment of $332.5 million by early May 2022. For more information, see “Part I. Item I. Business—Recent Developments—Albemarle Settlement.” |
| ● | Accounts payable increased by $325 million primarily due to higher inventory purchases. |
| ● | Accrued liabilities increased by $319 primarily related to higher accrued compensation, current income taxes and approximately $200 million of legal fees associated with the Albemarle Settlement. |
| ● |
Current portion of debt decreased by $581 million primarily due to the redemption of our 2021 Senior Notes in the first half of 2021. |
Direct and Subsidiary Debt
See “Note 14. Debt—Direct and Subsidiary Debt” to our consolidated financial statements.
Debt Issuance Costs
See “Note 14. Debt—Direct and Subsidiary Debt—Debt Issuance Costs” to our consolidated financial statements.
Revolving Credit Facility
See “Note 14. Debt—Direct and Subsidiary Debt—Revolving Credit Facility” to our consolidated financial statements.
Term Loan Credit Facility
See “Note 14. Debt—Direct and Subsidiary Debt—Term Loan Credit Facility” to our consolidated financial statements.
A/R Programs
See “Note 14. Debt—Direct and Subsidiary Debt—A/R Programs” to our consolidated financial statements.
Senior Notes
See “Note 14. Debt—Direct and Subsidiary Debt—Senior Notes” to our consolidated financial statements.
Variable Interest Entity Debt
See “Note 14. Debt—Direct and Subsidiary Debt—Variable Interest Entity Debt” to our consolidated financial statements.
Note Payable from Huntsman International to Huntsman Corporation
See “Note 14. Debt—Direct and Subsidiary Debt—Note Payable from Huntsman International to Huntsman Corporation” to our consolidated financial statements.
Compliance With Covenants
See “Note 14. Debt—Compliance with Covenants” to our consolidated financial statements.
Maturities
See “Note 14. Debt—Maturities” to our consolidated financial statements.
Short-Term Liquidity
We depend upon our cash, Revolving Credit Facility, A/R Programs and other debt instruments to provide liquidity for our operations and working capital needs. As of December 31, 2021, we had $2,482 million of combined cash and unused borrowing capacity, consisting of $1,041 million in cash, $1,197 million in availability under our Revolving Credit Facility and $244 million in availability under our A/R Programs. Our liquidity can be significantly impacted by various factors. The following matters had, or are expected to have, a significant impact on our liquidity:
| ● |
Cash invested in our accounts receivable and inventory, net of accounts payable, were approximately $340 million for 2021, as reflected in our consolidated statements of cash flows. We expect volatility in our working capital components to continue. |
| ● |
During 2022, we expect to spend approximately $300 million on capital expenditures. We expect to fund spending on all capital expenditures with cash provided by operations. |
| ● |
During 2021, we made contributions to our pension and postretirement benefit plans of $59 million. During 2022, we expect to contribute an additional amount of approximately $49 million to these plans. |
| ● | On October 28, 2021, we won an arbitration award in excess of $600 million against Albemarle for fraud and breach of contract. On November 4, 2021, Albemarle agreed to waive any appeal and pay $665 million, of which we received $332.5 million on December 2, 2021 and expect to receive a final payment of $332.5 million by early May 2022. We agreed to terminate all proceedings relating to the dispute after receipt of the final payment. We expect to receive, on a pretax basis, a total of approximately $465 million after related legal fees. |
Long-Term Liquidity
| ● | On May 26, 2021, Huntsman International completed a $400 million offering of its 2031 Senior Notes. On June 23, 2021, Huntsman International applied the net proceeds from the offering, along with cash on hand, to redeem in full the $400 million in aggregate principal amount of its 2022 Senior Notes. For additional information, see “Note 14. Debt—Direct and Subsidiary Debt—Senior Notes” to our consolidated financial statements. | |
| ● | On July 1, 2021, we entered into amendments to our A/R Programs that, among other things, extended the scheduled termination dates of our A/R Programs from April 2022 to July 2024. | |
| ● | During 2020, management implemented cost realignment and synergy plans. In connection with these plans, we currently expect to achieve annualized cost savings and synergy benefits of approximately $140 million during 2023, of which we have achieved approximately $100 million to date. Associated with these plans, we expect net cash restructuring and integration costs, including capital expenditures, of approximately $115 million, of which we have spent approximately $80 million to date. | |
| ● | During 2021, management announced additional cost realignment plans. In connection with these plans, we currently expect to achieve annualized cost savings of approximately $100 million by the end of 2023. | |
| ● | On October 26, 2021, our Board of Directors approved a new share repurchase program of $1 billion. In conjunction with the inception of this plan, we retired our prior share repurchase program. During the fourth quarter of 2021, we repurchased 3,082,614 shares of our common stock for approximately $101 million, excluding commissions, under this share repurchase program. Prior to the fourth quarter during 2021, we repurchased 3,971,784 shares of our common stock for approximately $102 million, excluding commissions, under the prior share repurchase program. From January 1, 2022 through January 31, 2022, we repurchased an additional 851,000 shares of our common stock for approximately $31 million, excluding commissions. | |
| ● | On February 14, 2022, our Board of Directors declared a $0.2125 per share cash dividend on our common stock. This represents a 13% increase from the previous dividend. |
As of December 31, 2021, we had $12 million classified as current portion of debt, including debt at our variable interest entities of $10 million and certain other short-term facilities and scheduled amortization payments totaling $2 million. We intend to renew, repay or extend the majority of these short-term facilities in the next twelve months.
As of December 31, 2021, we had approximately $477 million of cash and cash equivalents, including restricted cash, held by our foreign subsidiaries, including our variable interest entities. With the exception of certain amounts that we expect to repatriate in the foreseeable future, we intend to use cash held in our foreign subsidiaries to fund our local operations. Nevertheless, we could repatriate additional cash as dividends and the repatriation of cash as a dividend would generally not be subject to U.S. taxation. However, such repatriation may potentially be subject to limited foreign withholding taxes.
Restructuring, Impairment and Plant Closing Costs
For a discussion of restructuring plans and the costs involved, see “Note 12. Restructuring, Impairment and Plant Closing Costs (Credits)” to our consolidated financial statements.
Recently Issued Accounting Pronouncements
For a discussion of recently issued accounting pronouncements, see “Note 2. Summary of Significant Accounting Policies" to our consolidated financial statements.
Critical Accounting Estimates
This discussion and analysis of financial condition and results of operations is based on our consolidated financial statements, which have been prepared in accordance with accounting principles generally accepted in the United States of America. The preparation of financial statements requires us to make judgments, estimates and assumptions that involve a significant level of estimation and uncertainty and are reasonably likely to have a material impact on our financial condition and/or results of operations. Summarized below are our critical accounting estimates.
Income Taxes
Deferred income taxes reflect the net effects of temporary differences between assets and liabilities for financial and tax reporting purposes. We evaluate deferred tax assets to determine whether it is more likely than not that they will be realized; valuation allowances are recorded to offset deferred tax assets unlikely to be realized. Valuation allowances are reviewed on a tax jurisdiction basis to analyze whether there is sufficient positive or negative evidence to support a change in judgment about the realizability of the related deferred tax assets. These conclusions require significant judgments. In evaluating the objective evidence that historical results provide, we consider the cyclicality of businesses and cumulative income or losses. Cumulative historical losses incurred over periods of time limit our ability to consider more subjective projections of future taxable income. Changes in expected future taxable income and tax planning strategies in applicable jurisdictions affect our assessment of the realization of deferred tax assets. Our judgments regarding valuation allowances are also influenced by factors outside of business results that could impact our ability to utilize a deferred tax asset. As of December 31, 2021, we had total valuation allowances of $131 million, which represents a decrease of $75 million from the prior year, and we have recognized net deferred tax assets of $45 million. See “Note 19. Income Taxes” to our consolidated financial statements for more information regarding our deferred tax assets and valuation allowances.
Employee Benefit Programs
We sponsor several contributory and non-contributory defined benefit plans, covering employees primarily in the U.S., the U.K., The Netherlands, Belgium and Switzerland, but also covering employees in a number of other countries. We fund the material plans through trust arrangements (or local equivalents) where the assets are held separately from us. We also sponsor unfunded postretirement plans which provide medical and, in some cases, life insurance benefits covering certain employees in the U.S. and Canada. Amounts recorded in our consolidated financial statements are recorded based upon actuarial valuations performed by various independent actuaries. Inherent in these valuations are numerous assumptions regarding expected long-term rates of return on plan assets, discount rates, compensation increases, mortality rates and health care cost trends. Each of these critical estimates are subject to uncertainty and are assessed by us using historical data, as well as projections of future conditions. These assumptions and changes during the period are described in “Note 18. Employee Benefit Plans” to our consolidated financial statements.
We retain third party actuaries to assist us with judgments necessary to make assumptions on which our employee pension and postretirement benefit plan obligations and expenses are based. The effect of a 1% change in three key assumptions is summarized as follows (dollars in millions):
| Statement of |
Balance Sheet |
|||||||
| Assumptions |
Operations(1) |
Impact(2) |
||||||
| Discount rate |
||||||||
| —1% increase |
$ | (40 | ) | $ | (481 | ) | ||
| —1% decrease |
46 | 556 | ||||||
| Expected long-term rates of return on plan assets |
||||||||
| —1% increase |
(30 | ) | — | |||||
| —1% decrease |
30 | — | ||||||
| Rate of compensation increase |
||||||||
| —1% increase |
11 | 51 | ||||||
| —1% decrease |
(7 | ) | (46 | ) | ||||
|
|
|
| (1) |
Estimated (decrease) increase on 2021 net periodic benefit cost |
| (2) |
Estimated (decrease) increase on December 31, 2021 pension and postretirement liabilities and accumulated other comprehensive loss |
ITEM 7A. QUANTITATIVE AND QUALITATIVE DISCLOSURES ABOUT MARKET RISK
We are exposed to market risks, such as changes in interest rates, foreign exchange rates and commodity prices. From time to time, we enter into transactions, including transactions involving derivative instruments, to manage certain of these exposures. We also hedge our net investment in certain European operations. Changes in the fair value of the hedge in the net investment of certain European operations are recorded in accumulated other comprehensive loss.
Interest Rate Risks
See “Note 15. Derivative Instruments and Hedging Activities—Interest Rate Risk” to our consolidated financial statements.
Foreign Exchange Rate Risk
See “Note 15. Derivative Instruments and Hedging Activities—Foreign Exchange Rate Risk” to our consolidated financial statements.
Commodity Prices Risk
See “Note 15. Derivative Instruments and Hedging Activities—Commodity Prices Risk” to our consolidated financial statements.
ITEM 8. FINANCIAL STATEMENTS AND SUPPLEMENTARY DATA
Our consolidated financial statements required by this item are included on the pages immediately following the Index to Consolidated Financial Statements appearing on page F-1.
ITEM 9. CHANGES IN AND DISAGREEMENTS WITH ACCOUNTANTS ON ACCOUNTING AND FINANCIAL DISCLOSURE
None.
ITEM 9A. CONTROLS AND PROCEDURES
Evaluation of Disclosure Controls and Procedures
Our management, with the participation of our chief executive officer and chief financial officer, has evaluated the effectiveness of our disclosure controls and procedures (as defined in Rules 13a-15(e) and 15d-15(e) under the Exchange Act) as of December 31, 2021. Based on this evaluation, our chief executive officer and chief financial officer have concluded that, as of December 31, 2021, our disclosure controls and procedures were effective, in that they ensure that information required to be disclosed by us in the reports that we file or submit under the Exchange Act is (1) recorded, processed, summarized and reported within the time periods specified in the SEC’s rules and forms, and (2) accumulated and communicated to our management, including our chief executive officer and chief financial officer, as appropriate to allow timely decisions regarding required disclosure.
Changes in Internal Control Over Financial Reporting
No changes to our internal control over financial reporting (as defined in Rules 13a-15(f) and 15d-15(f) under the Exchange Act) occurred during the quarter ended December 31, 2021 that have materially affected, or are reasonably likely to materially affect, our internal control over financial reporting.
Management’s Report on Internal Control Over Financial Reporting
Management is responsible for establishing and maintaining adequate internal control over financial reporting. Our internal control framework and processes for our Company and Huntsman International are designed to provide reasonable assurance to management, Huntsman International’s Board of Managers and our Board of Directors regarding the reliability of financial reporting and the preparation of our consolidated financial statements in accordance with accounting principles generally accepted in the United States of America.
Our internal control over financial reporting for our Company and Huntsman International includes those policies and procedures that:
| ● |
pertain to the maintenance of records that, in reasonable detail, accurately and fairly reflect the transactions and dispositions of the assets of our Company and Huntsman International; |
| ● |
provide reasonable assurance that transactions are recorded properly to allow for the preparation of financial statements in accordance with generally accepted accounting principles, and that receipts and expenditures of our Company and Huntsman International are being made only in accordance with authorizations of management and Directors of our Company and Huntsman International; |
| ● |
provide reasonable assurance regarding prevention or timely detection of unauthorized acquisition, use or disposition of our assets that could have a material effect on our consolidated financial statements; and |
| ● |
provide reasonable assurance as to the detection of fraud. |
Because of its inherent limitations, a system of internal control over financial reporting can provide only reasonable assurance and may not prevent or detect misstatements. Further, because of changing conditions, effectiveness of internal control over financial reporting may vary over time.
Our management assessed the effectiveness of our internal control over financial reporting for our Company and Huntsman International and concluded that, as of December 31, 2021, such internal control is effective. In making this assessment, management used the criteria set forth by the Committee of Sponsoring Organizations of the Treadway Commission in Internal Control—Integrated Framework (2013).
On January 15, 2021, we completed the Gabriel Acquisition and have integrated certain Gabriel business processes into our existing processes, systems and internal control over financial reporting. Nonetheless, our management excluded from its assessment of our internal control over financial reporting as of December 31, 2021, the internal control over financial reporting of Gabriel. This exclusion is in accordance with the guidance issued by the SEC that permits registrants to exclude a recently acquired business from the scope of management’s report on internal control over financial reporting for the first year after the acquisition is completed. The total assets of Gabriel as of December 31, 2021 represent approximately 3% of our consolidated total assets as of December 31, 2021. The total revenues of Gabriel represent approximately 1% of our consolidated revenues for the year ended December 31, 2021. For more information, see “Note 3. Business Combinations and Acquisitions—Acquisition of Gabriel Performance Products” to our consolidated financial statements.
Our independent registered public accounting firm, Deloitte & Touche LLP, with direct access to our Board of Directors through our Audit Committee, have audited our consolidated financial statements prepared by our Company and have issued an attestation report on internal control over financial reporting for our Company.
REPORT OF INDEPENDENT REGISTERED PUBLIC ACCOUNTING FIRM
To the Stockholders and Board of Directors of Huntsman Corporation
Opinion on Internal Control over Financial Reporting
We have audited the internal control over financial reporting of Huntsman Corporation and subsidiaries (the “Company”) as of December 31, 2021, based on criteria established in Internal Control — Integrated Framework (2013) issued by the Committee of Sponsoring Organizations of the Treadway Commission (COSO). In our opinion, the Company maintained, in all material respects, effective internal control over financial reporting as of December 31, 2021, based on criteria established in Internal Control — Integrated Framework (2013) issued by COSO.
We have also audited, in accordance with the standards of the Public Company Accounting Oversight Board (United States) (PCAOB), the consolidated financial statements as of and for the year ended December 31, 2021, of the Company and our report dated February 15, 2022, expressed an unqualified opinion on those financial statements.
As described in Management’s Report on Internal Control Over Financial Reporting, management excluded from its assessment the internal control over financial reporting at Gabriel Performance Products, which was acquired on January 15, 2021, and whose financial statements constitute 3% of total assets and 1% of revenues of the consolidated financial statement amounts as of and for the year ended December 31, 2021. Accordingly, our audit did not include the internal control over financial reporting at Gabriel Performance Products.
Basis for Opinion
The Company’s management is responsible for maintaining effective internal control over financial reporting and for its assessment of the effectiveness of internal control over financial reporting, included in the accompanying Management’s Report on Internal Control Over Financial Reporting. Our responsibility is to express an opinion on the Company’s internal control over financial reporting based on our audit. We are a public accounting firm registered with the PCAOB and are required to be independent with respect to the Company in accordance with the U.S. federal securities laws and the applicable rules and regulations of the Securities and Exchange Commission and the PCAOB.
We conducted our audit in accordance with the standards of the PCAOB. Those standards require that we plan and perform the audit to obtain reasonable assurance about whether effective internal control over financial reporting was maintained in all material respects. Our audit included obtaining an understanding of internal control over financial reporting, assessing the risk that a material weakness exists, testing and evaluating the design and operating effectiveness of internal control based on the assessed risk, and performing such other procedures as we considered necessary in the circumstances. We believe that our audit provides a reasonable basis for our opinion.
Definition and Limitations of Internal Control over Financial Reporting
A company’s internal control over financial reporting is a process designed to provide reasonable assurance regarding the reliability of financial reporting and the preparation of financial statements for external purposes in accordance with generally accepted accounting principles. A company’s internal control over financial reporting includes those policies and procedures that (1) pertain to the maintenance of records that, in reasonable detail, accurately and fairly reflect the transactions and dispositions of the assets of the company; (2) provide reasonable assurance that transactions are recorded as necessary to permit preparation of financial statements in accordance with generally accepted accounting principles, and that receipts and expenditures of the company are being made only in accordance with authorizations of management and directors of the company; and (3) provide reasonable assurance regarding prevention or timely detection of unauthorized acquisition, use, or disposition of the company’s assets that could have a material effect on the financial statements.
Because of its inherent limitations, internal control over financial reporting may not prevent or detect misstatements. Also, projections of any evaluation of effectiveness to future periods are subject to the risk that controls may become inadequate because of changes in conditions, or that the degree of compliance with the policies or procedures may deteriorate.
/s/ DELOITTE & TOUCHE LLP
Houston, Texas
February 15, 2022
None.
ITEM 9C. DISCLOSURE REGARDING FOREIGN JURISDICTIONS THAT PREVENT INSPECTIONS
Not applicable.
ITEM 10. DIRECTORS, EXECUTIVE OFFICERS AND CORPORATE GOVERNANCE
Information relating to our Directors (including identification of our Audit Committee’s financial expert(s)) and executive officers will be disclosed in the definitive Proxy Statement for our Annual Meeting of Stockholders and is incorporated herein by reference. See also the information regarding executive officers of the registrant set forth in Part I under the caption “Information about Our Executive Officers” in reliance on General Instruction G to Form 10-K.
Code of Ethics
We have adopted a code of ethics, as defined by Item 406(b) of Regulation S-K under the Exchange Act, that applies to our principal executive officer, principal financial officer and principal accounting officer or controller. A copy of the code of ethics is posted on our website, at www.huntsman.com. We intend to disclose any amendments to, or waivers from, our code of ethics on our website.
ITEM 11. EXECUTIVE COMPENSATION
Information relating to executive compensation and our equity compensation plans will be disclosed in the definitive Proxy Statement for our Annual Meeting of Stockholders and is incorporated herein by reference.
ITEM 12. SECURITY OWNERSHIP OF CERTAIN BENEFICIAL OWNERS AND MANAGEMENT AND RELATED STOCKHOLDER MATTERS
Information with respect to beneficial ownership of our common stock by each Director and all Directors and officers of our Company as a group will be disclosed in the definitive Proxy Statement for our Annual Meeting of Stockholders and is incorporated herein by reference.
Information relating to any person who beneficially owns in excess of five percent of the total outstanding shares of our common stock will be disclosed in the definitive Proxy Statement for our Annual Meeting of Stockholders and is incorporated herein by reference.
Information with respect to compensation plans under which equity securities are authorized for issuance will be disclosed in the definitive Proxy Statement for our Annual Meeting of Stockholders and is incorporated herein by reference.
ITEM 13. CERTAIN RELATIONSHIPS AND RELATED TRANSACTIONS, AND DIRECTOR INDEPENDENCE
Information with respect to certain relationships and related transactions will be disclosed in the definitive Proxy Statement for our Annual Meeting of Stockholders and is incorporated herein by reference.
ITEM 14. PRINCIPAL ACCOUNTANT FEES AND SERVICES
Information with respect to principal accountant fees and services, and the disclosure of the Audit Committee’s pre-approval policies and procedures are contained in the definitive Proxy Statement for our Annual Meeting of Stockholders and are incorporated herein by reference.
ITEM 15. EXHIBITS AND FINANCIAL STATEMENT SCHEDULES
| (a) |
Documents filed with this report. |
| 1. |
Consolidated Financial Statements: |
See Index to Consolidated Financial Statements on page F-1
| 2. |
Financial Statement Schedules: |
Other than as stated on the Index to Consolidated Financial Statements on page F-1 with respect to Schedule I, financial statement schedules are omitted because they are not required or are not applicable or the required information is shown in the consolidated financial statements or notes thereto.
| 3. |
Exhibits: |
The exhibits to this report are listed on the Exhibit Index below.
| (b) |
Description of exhibits. |
| 10.14 | U.S. Receivables Loan Agreement dated as of October 16, 2009 (File No. 001-32427) | 8-K | 10.1 | October 22, 2009 | ||||
| 10.15 |
8-K |
10.2 |
October 22, 2009 |
* Filed herewith.
Pursuant to the requirements of Section 13 or 15(d) of the Securities Exchange Act of 1934, the registrants have duly caused this report to be signed on their behalf by the undersigned, thereunto duly authorized.
Dated: February 15, 2022
| Huntsman Corporation |
||
| By: |
/s/ Philip M. Lister |
|
| Philip M. Lister |
||
Pursuant to the requirements of the Securities Exchange Act of 1934, this report has been signed below by the following persons on behalf of Huntsman Corporation in the capacities indicated on the 15th day of February 2022.
| /s/ Peter R. Huntsman |
|
/s/ Philip M. Lister |
| Peter R. Huntsman Chairman, President and Chief Executive Officer (Principal Executive Officer) |
Philip M. Lister |
|
| /s/ Steven C. Jorgensen |
/s/ Nolan D. Archibald |
|
| Steven C. Jorgensen |
Nolan D. Archibald |
|
| /s/ Dr. Mary C. Beckerle |
/s/ M. Anthony Burns | |
| Dr. Mary C. Beckerle |
M. Anthony Burns Director |
|
| /s/ Sonia Dulá |
/s/ Cynthia L. Egan | |
| Sonia Dulá |
Cynthia L. Egan Vice Chair, Lead Independent Director of the Board and Chair of the Nominating and Corporate Governance Committee |
|
| /s/ Curtis E. Espeland |
/s/ Daniele Ferrari | |
| Curtis E. Espeland |
Daniele Ferrari |
|
| /s/ Sir Robert J. Margetts | /s/ Jeanne McGovern | |
| Sir Robert J. Margetts | Jeanne McGovern | |
| Director | Chair of the Audit Committee and Director | |
| /s/ José Muñoz | /s/ Wayne A. Reaud | |
| José Muñoz | Wayne A. Reaud | |
| Director | Chairman of the Litigation and Compensation Committees and Director | |
| /s/ David B. Sewell | /s/ Vice Admiral (Ret) Jan E. Tighe | |
| David B. Sewell | Vice Admiral (ret) Jan E. Tighe | |
| Director | Chair of the Sustainability Committee and Director |
Pursuant to the requirements of the Securities Exchange Act of 1934, this report has been signed below by the following persons on behalf of Huntsman International LLC in the capacities indicated on the 15th day of February 2022.
| /s/ Peter R. Huntsman |
/s/ Philip M. Lister |
|
| Peter R. Huntsman |
Philip M. Lister |
|
| /s/Steven C. Jorgensen |
/s/ David M. Stryker |
|
| Steven C. Jorgensen |
David M. Stryker Secretary and Manager |
HUNTSMAN CORPORATION AND SUBSIDIARIES
HUNTSMAN INTERNATIONAL LLC AND SUBSIDIARIES
INDEX TO CONSOLIDATED FINANCIAL STATEMENTS
REPORT OF INDEPENDENT REGISTERED PUBLIC ACCOUNTING FIRM
To the Stockholders and Board of Directors of Huntsman Corporation
Opinion on the Financial Statements
We have audited the accompanying consolidated balance sheets of Huntsman Corporation and subsidiaries (the “Company”) as of December 31, 2021, and 2020, the related consolidated statements of operations, comprehensive income (loss), equity, and cash flows, for each of the three years in the period ended December 31, 2021, and the related notes and the schedule listed in the Index on page F-1 (collectively referred to as the “financial statements”). In our opinion, the financial statements present fairly, in all material respects, the financial position of the Company as of December 31, 2021 and 2020, and the results of its operations and its cash flows for each of the three years in the period ended December 31, 2021, in conformity with accounting principles generally accepted in the United States of America.
We have also audited, in accordance with the standards of the Public Company Accounting Oversight Board (United States) (PCAOB), the Company’s internal control over financial reporting as of December 31, 2021, based on criteria established in Internal Control—Integrated Framework (2013) issued by the Committee of Sponsoring Organizations of the Treadway Commission and our report dated February 15, 2022, expressed an unqualified opinion on the Company’s internal control over financial reporting.
Basis for Opinion
These financial statements are the responsibility of the Company’s management. Our responsibility is to express an opinion on the Company’s financial statements based on our audits. We are a public accounting firm registered with the PCAOB and are required to be independent with respect to the Company in accordance with the U.S. federal securities laws and the applicable rules and regulations of the Securities and Exchange Commission and the PCAOB.
We conducted our audits in accordance with the standards of the PCAOB. Those standards require that we plan and perform the audit to obtain reasonable assurance about whether the financial statements are free of material misstatement, whether due to error or fraud. Our audits included performing procedures to assess the risks of material misstatement of the financial statements, whether due to error or fraud, and performing procedures that respond to those risks. Such procedures included examining, on a test basis, evidence regarding the amounts and disclosures in the financial statements. Our audits also included evaluating the accounting principles used and significant estimates made by management, as well as evaluating the overall presentation of the financial statements. We believe that our audits provide a reasonable basis for our opinion.
Critical Audit Matter
The critical audit matter communicated below is a matter arising from the current-period audit of the financial statements that was communicated or required to be communicated to the Audit Committee and that (1) relates to accounts or disclosures that are material to the financial statements and (2) involved our especially challenging, subjective, or complex judgments. The communication of critical audit matters does not alter in any way our opinion on the financial statements, taken as a whole, and we are not, by communicating the critical audit matter below, providing a separate opinion on the critical audit matter or on the accounts or disclosures to which it relates.
Income Taxes—Realizability of Deferred Tax Assets—Refer to Notes 2 and 19 to the financial statements
Critical Audit Matter Description
The Company recognizes deferred income taxes for tax attributes and for differences between the financial statement and tax carrying amounts of assets and liabilities at enacted statutory tax rates in effect for the years in which the deferred tax liability or asset are expected to be settled or realized. A valuation allowance is provided to offset deferred tax assets if, based upon the available evidence, it is more likely than not that some or all of the deferred tax assets will not be realized. The Company files tax returns in multiple jurisdictions with complex tax laws and regulations. Valuation allowances are evaluated on a tax jurisdiction basis to analyze whether there is sufficient positive or negative evidence to support a change in judgment about the realizability of the related deferred tax assets for each jurisdiction. In evaluating the objective evidence that historical results provide, the Company considers the cyclicality of businesses and cumulative income or losses during the applicable period. Cumulative losses incurred over the period limits the Company’s ability to consider other subjective evidence such as taxable income for the future. The Company’s valuation allowances as of December 31, 2021 were $131 million.
We identified management’s determination that it is not more likely than not that sufficient taxable income will be generated in the future to realize some of its deferred tax assets as a critical audit matter because of the significant judgments and estimates management makes related to future taxable income. This required a high degree of auditor judgment and an increased extent of effort, including the need to involve our income tax specialists, when performing audit procedures to evaluate the reasonableness of management’s estimates of future taxable income.
How the Critical Audit Matter Was Addressed in the Audit
Our audit procedures related to estimated future taxable income and the determination of whether it is more likely than not that the deferred tax assets will be realized included the following, among others:
| • |
We tested the effectiveness of controls over the valuation allowance for income taxes, including management’s controls over the estimates of future taxable income and the determination of whether it is more likely than not that the deferred tax assets will be realized. |
| • |
With the assistance of our income tax specialists, we considered (1) the appropriateness of qualifying tax planning strategies, including that they were prudent, feasible and would more likely than not result in the realization of deferred tax assets and (2) the following sources of management’s estimated future taxable income: |
| – |
Estimates of future taxable income |
| – |
Future reversals of existing temporary differences |
| – |
Taxable income in historical periods (where carryback is permitted under the tax law) |
| • |
We tested the reasonableness of management’s estimates of future taxable income by comparing the estimates to: |
| – |
Historical taxable income |
| – |
Internal communications to management and the Board of Directors |
| – |
Forecasted information included in Company press releases as well as in analyst and industry reports for the Company and certain of its peer companies |
| • |
We evaluated whether the taxable income in prior carryback years was of the appropriate character and available under the tax law. |
| • |
We evaluated the reasonableness of the methods, assumptions, and judgments used by management to determine whether a valuation allowance was necessary. |
/s/
February 15, 2022
We have served as the Company’s auditor since 1984.
HUNTSMAN CORPORATION AND SUBSIDIARIES
CONSOLIDATED BALANCE SHEETS
(In Millions, Except Share Amounts)
| December 31, | December 31, | |||||||
| 2021 | 2020 | |||||||
| ASSETS | ||||||||
| Current assets: | ||||||||
| Cash and cash equivalents(a) | $ | $ | ||||||
| Accounts and notes receivable (net of allowance for doubtful accounts of $ and $, respectively), ($ and $ pledged as collateral, respectively)(a) | ||||||||
| Accounts receivable from affiliates | ||||||||
| Inventories(a) | ||||||||
| Receivable associated with the Albemarle Settlement | ||||||||
| Other current assets | ||||||||
| Total current assets | ||||||||
| Property, plant and equipment, net(a) | ||||||||
| Investment in unconsolidated affiliates | ||||||||
| Intangible assets, net | ||||||||
| Goodwill | ||||||||
| Deferred income taxes | ||||||||
| Operating lease right-of-use assets | ||||||||
| Other noncurrent assets(a) | ||||||||
| Total assets | $ | $ | ||||||
| LIABILITIES AND EQUITY | ||||||||
| Current liabilities: | ||||||||
| Accounts payable(a) | $ | $ | ||||||
| Accounts payable to affiliates | ||||||||
| Accrued liabilities(a) | ||||||||
| Current portion of debt(a) | ||||||||
| Current operating lease liabilities(a) | ||||||||
| Total current liabilities | ||||||||
| Long-term debt(a) | ||||||||
| Deferred income taxes | ||||||||
| Noncurrent operating lease liabilities(a) | ||||||||
| Other noncurrent liabilities(a) | ||||||||
| Total liabilities | ||||||||
| Commitments and contingencies (Notes 20 and 21) | ||||||||
| Equity | ||||||||
| Huntsman Corporation stockholders’ equity: | ||||||||
| Common stock $ par value, shares authorized, and shares issued and and shares outstanding, respectively | ||||||||
| Additional paid-in capital | ||||||||
| Treasury stock, and shares, respectively | ( | ) | ( | ) | ||||
| Unearned stock-based compensation | ( | ) | ( | ) | ||||
| Retained earnings | ||||||||
| Accumulated other comprehensive loss | ( | ) | ( | ) | ||||
| Total Huntsman Corporation stockholders’ equity | ||||||||
| Noncontrolling interests in subsidiaries | ||||||||
| Total equity | ||||||||
| Total liabilities and equity | $ | $ | ||||||
| (a) |
At December 31, 2021 and December 31, 2020, respectively, $1 and $2 of cash and cash equivalents, $12 and $6 of accounts and notes receivable (net), $64 and $38 of inventories, $161 and $167 of property, plant and equipment (net), $23 each of other noncurrent assets, $146 and $119 of accounts payable, $13 each of accrued liabilities, $10 and $47 of current portion of debt, $6 and $5 of current operating lease liabilities, $35 and $3 of long-term debt, $20 and $17 of noncurrent operating lease and $46 and $82 of other noncurrent liabilities from consolidated variable interest entities are included in the respective Balance Sheets captions above. See “Note 8. Variable Interest Entities.” |
See accompanying notes to consolidated financial statements.
HUNTSMAN CORPORATION AND SUBSIDIARIES
CONSOLIDATED STATEMENTS OF OPERATIONS
(In Millions, Except Share and Per Share Amounts)
| Year ended December 31, |
||||||||||||
| 2021 |
2020 |
2019 |
||||||||||
| Revenues: |
||||||||||||
| Trade sales, services and fees, net |
$ | $ | $ | |||||||||
| Related party sales |
||||||||||||
| Total revenues |
||||||||||||
| Cost of goods sold |
||||||||||||
| Gross profit |
||||||||||||
| Operating expenses: |
||||||||||||
| Selling, general and administrative |
||||||||||||
| Research and development |
||||||||||||
| Restructuring, impairment and plant closing costs (credits) |
( |
) | ||||||||||
| Gain on sale of India-based DIY business |
( |
) | ( |
) | ||||||||
| Other operating (income) expense, net |
( |
) | ( |
) | ||||||||
| Total operating expenses |
||||||||||||
| Operating income |
||||||||||||
| Interest expense, net |
( |
) | ( |
) | ( |
) | ||||||
| Equity in income of investment in unconsolidated affiliates |
||||||||||||
| Fair value adjustments to Venator investment and related loss on disposal |
( |
) | ( |
) | ( |
) | ||||||
| Loss on early extinguishment of debt |
( |
) | ( |
) | ||||||||
| Income associated with the Albemarle Settlement, net |
||||||||||||
| Other income, net |
||||||||||||
| Income from continuing operations before income taxes |
||||||||||||
| Income tax (expense) benefit |
( |
) | ( |
) | ||||||||
| Income from continuing operations |
||||||||||||
| Income from discontinued operations, net of tax |
||||||||||||
| Net income |
||||||||||||
| Net income attributable to noncontrolling interests |
( |
) | ( |
) | ( |
) | ||||||
| Net income attributable to Huntsman Corporation |
$ | $ | $ | |||||||||
| Basic income per share: |
||||||||||||
| Income from continuing operations attributable to Huntsman Corporation common stockholders |
$ | $ | $ | |||||||||
| Income from discontinued operations attributable to Huntsman Corporation common stockholders, net of tax |
||||||||||||
| Net income attributable to Huntsman Corporation common stockholders |
$ | $ | $ | |||||||||
| Weighted average shares |
||||||||||||
| Diluted income per share: |
||||||||||||
| Income from continuing operations attributable to Huntsman Corporation common stockholders |
$ | $ | $ | |||||||||
| Income from discontinued operations attributable to Huntsman Corporation common stockholders, net of tax |
||||||||||||
| Net income attributable to Huntsman Corporation common stockholders |
$ | $ | $ | |||||||||
| Weighted average shares |
||||||||||||
| Amounts attributable to Huntsman Corporation: |
||||||||||||
| Income from continuing operations |
$ | $ | $ | |||||||||
| Income from discontinued operations, net of tax |
||||||||||||
| Net income |
$ | $ | $ | |||||||||
See accompanying notes to consolidated financial statements.
HUNTSMAN CORPORATION AND SUBSIDIARIES
CONSOLIDATED STATEMENTS OF COMPREHENSIVE INCOME
(In Millions)
| Year ended December 31, |
||||||||||||
| 2021 |
2020 |
2019 |
||||||||||
| Net income |
$ | $ | $ | |||||||||
| Other comprehensive income (loss), net of tax: |
||||||||||||
| Foreign currency translations adjustments |
( |
) | ||||||||||
| Pension and other postretirement benefits adjustments |
( |
) | ( |
) | ||||||||
| Other, net |
( |
) | ||||||||||
| Other comprehensive income (loss), net of tax |
( |
) | ||||||||||
| Comprehensive income |
||||||||||||
| Comprehensive income attributable to noncontrolling interests |
( |
) | ( |
) | ( |
) | ||||||
| Comprehensive income attributable to Huntsman Corporation |
$ | $ | $ | |||||||||
See accompanying notes to consolidated financial statements.
HUNTSMAN CORPORATION AND SUBSIDIARIES
CONSOLIDATED STATEMENTS OF EQUITY
(In Millions, Except Share Amounts)
| Huntsman Corporation Stockholders’ Equity | ||||||||||||||||||||||||||||||||||||
| Accumulated | ||||||||||||||||||||||||||||||||||||
| Shares | Additional | Unearned | other | Noncontrolling | ||||||||||||||||||||||||||||||||
| Common | Common | paid-in | Treasury | stock-based | Retained | comprehensive | interests in | Total | ||||||||||||||||||||||||||||
| stock | stock | capital | stock | compensation | earnings | loss | subsidiaries | equity | ||||||||||||||||||||||||||||
| Beginning balance, January 1, 2019 | $ | $ | $ | ( | ) | $ | ( | ) | $ | $ | ( | ) | $ | $ | ||||||||||||||||||||||
| Net income | — | |||||||||||||||||||||||||||||||||||
| Other comprehensive (loss) income | — | ( | ) | ( | ) | |||||||||||||||||||||||||||||||
| Issuance of nonvested stock awards | — | ( | ) | |||||||||||||||||||||||||||||||||
| Vesting of stock awards | ||||||||||||||||||||||||||||||||||||
| Recognition of stock-based compensation | — | |||||||||||||||||||||||||||||||||||
| Repurchase and cancellation of stock awards | ( | ) | ( | ) | ( | ) | ||||||||||||||||||||||||||||||
| Stock options exercised | ( | ) | ||||||||||||||||||||||||||||||||||
| Treasury stock repurchased | ( | ) | ( | ) | ( | ) | ||||||||||||||||||||||||||||||
| Acquisition of noncontrolling interests, net of tax | — | ( | ) | ( | ) | ( | ) | |||||||||||||||||||||||||||||
| Dividends declared to noncontrolling interests | — | ( | ) | ( | ) | |||||||||||||||||||||||||||||||
| Dividends declared on common stock ($ per share) | — | ( | ) | ( | ) | |||||||||||||||||||||||||||||||
| Balance, December 31, 2019 | ( | ) | ( | ) | ( | ) | ||||||||||||||||||||||||||||||
| Net income | — | |||||||||||||||||||||||||||||||||||
| Other comprehensive income | — | |||||||||||||||||||||||||||||||||||
| Issuance of nonvested stock awards | — | ( | ) | |||||||||||||||||||||||||||||||||
| Vesting of stock awards | ||||||||||||||||||||||||||||||||||||
| Recognition of stock-based compensation | — | |||||||||||||||||||||||||||||||||||
| Repurchase and cancellation of stock awards | ( | ) | ( | ) | ( | ) | ||||||||||||||||||||||||||||||
| Stock options exercised | ( | ) | ||||||||||||||||||||||||||||||||||
| Treasury stock repurchased | ( | ) | ( | ) | ( | ) | ||||||||||||||||||||||||||||||
| Dividends declared to noncontrolling interests | — | ( | ) | ( | ) | |||||||||||||||||||||||||||||||
| Dividends declared on common stock ($ per share) | — | ( | ) | ( | ) | |||||||||||||||||||||||||||||||
| Balance, December 31, 2020 | ( | ) | ( | ) | ( | ) | ||||||||||||||||||||||||||||||
| Net income | — | |||||||||||||||||||||||||||||||||||
| Other comprehensive income | — | |||||||||||||||||||||||||||||||||||
| Issuance of nonvested stock awards | — | ( | ) | |||||||||||||||||||||||||||||||||
| Vesting of stock awards | ||||||||||||||||||||||||||||||||||||
| Recognition of stock-based compensation | — | |||||||||||||||||||||||||||||||||||
| Repurchase and cancellation of stock awards | ( | ) | ( | ) | ( | ) | ||||||||||||||||||||||||||||||
| Stock options exercised | ( | ) | ||||||||||||||||||||||||||||||||||
| Treasury stock repurchased | ( | ) | ( | ) | ( | ) | ||||||||||||||||||||||||||||||
| Dividends declared to noncontrolling interests | — | ( | ) | ( | ) | |||||||||||||||||||||||||||||||
| Dividends declared on common stock ($ per share) | — | ( | ) | ( | ) | |||||||||||||||||||||||||||||||
| Balance, December 31, 2021 | $ | $ | $ | ( | ) | $ | ( | ) | $ | $ | ( | ) | $ | $ | ||||||||||||||||||||||
See accompanying notes to consolidated financial statements.
HUNTSMAN CORPORATION AND SUBSIDIARIES
CONSOLIDATED STATEMENTS OF CASH FLOWS
(In Millions)
| Year ended December 31, | ||||||||||||
| 2021 | 2020 | 2019 | ||||||||||
| Operating Activities: | ||||||||||||
| Net income | $ | $ | $ | |||||||||
| Less: Income from discontinued operations, net of tax | ( | ) | ( | ) | ||||||||
| Income from continuing operations | ||||||||||||
| Adjustments to reconcile income from continuing operations to net cash provided by operating activities from continuing operations: | ||||||||||||
| Equity in income of investment in unconsolidated affiliates | ( | ) | ( | ) | ( | ) | ||||||
| Unrealized losses on fair value adjustments to Venator investment and related loss on disposal | ||||||||||||
| Cash received from return on investment in unconsolidated subsidiary | ||||||||||||
| Depreciation and amortization | ||||||||||||
| Noncash lease expense | ||||||||||||
| Gain on disposal of businesses/assets | ( | ) | ( | ) | ( | ) | ||||||
| Loss on early extinguishment of debt | ||||||||||||
| Noncash restructuring and impairment charges | ||||||||||||
| Deferred income taxes | ( | ) | ( | ) | ||||||||
| Stock-based compensation | ||||||||||||
| Other, net | ( | ) | ||||||||||
| Changes in operating assets and liabilities: | ||||||||||||
| Accounts and notes receivable | ( | ) | ||||||||||
| Inventories | ( | ) | ||||||||||
| Receivable associated with the Albemarle Settlement | ( | ) | ||||||||||
| Other current assets | ( | ) | ||||||||||
| Other noncurrent assets | ( | ) | ( | ) | ( | ) | ||||||
| Accounts payable | ||||||||||||
| Accrued liabilities | ( | ) | ( | ) | ||||||||
| Taxes paid on Chemical Intermediates Businesses | ( | ) | ||||||||||
| Other noncurrent liabilities | ( | ) | ( | ) | ||||||||
| Net cash provided by operating activities from continuing operations | ||||||||||||
| Net cash (used in) provided by operating activities from discontinued operations | ( | ) | ( | ) | ||||||||
| Net cash provided by operating activities | ||||||||||||
| Investing Activities: | ||||||||||||
| Capital expenditures | ( | ) | ( | ) | ( | ) | ||||||
| Cash received from sale of businesses | ||||||||||||
| Acquisition of businesses, net of cash acquired | ( | ) | ( | ) | ||||||||
| Cash received from the sale of Venator shares | ||||||||||||
| Proceeds from sale of assets | ||||||||||||
| Cash received from forward swap contract related to the sale of investment in Venator | ||||||||||||
| Insurance proceeds for recovery of property damage | ||||||||||||
| Other | ||||||||||||
| Net cash (used in) provided by investing activities from continuing operations | ( | ) | ( | ) | ||||||||
| Net cash provided by (used in) investing activities from discontinued operations | ( | ) | ||||||||||
| Net cash (used in) provided by investing activities | ( | ) | ( | ) | ||||||||
(continued)
HUNTSMAN CORPORATION AND SUBSIDIARIES
CONSOLIDATED STATEMENTS OF CASH FLOWS (Continued)
(In Millions)
| Year ended December 31, | ||||||||||||
| 2021 | 2020 | 2019 | ||||||||||
| Financing Activities: | ||||||||||||
| Net repayments on revolving loan facilities | $ | ( | ) | $ | ( | ) | $ | ( | ) | |||
| Proceeds from issuance of long-term debt | ||||||||||||
| Repayments of long-term debt | ( | ) | ( | ) | ( | ) | ||||||
| Repayments of short-term debt | ( | ) | ||||||||||
| Borrowings on short-term debt | ||||||||||||
| Repayments of notes payable | ( | ) | ( | ) | ||||||||
| Borrowings on note payable | ||||||||||||
| Debt issuance costs paid | ( | ) | ( | ) | ||||||||
| Costs of early extinguishment of debt | ( | ) | ( | ) | ||||||||
| Dividends paid to common stockholders | ( | ) | ( | ) | ( | ) | ||||||
| Dividends paid to noncontrolling interests | ( | ) | ( | ) | ( | ) | ||||||
| Cash paid for noncontrolling interest | ( | ) | ||||||||||
| Repurchase of common stock | ( | ) | ( | ) | ( | ) | ||||||
| Repurchase and cancellation of stock awards | ( | ) | ( | ) | ( | ) | ||||||
| Proceeds from issuance of common stock | ||||||||||||
| Other | ( | ) | ||||||||||
| Net cash used in financing activities | ( | ) | ( | ) | ( | ) | ||||||
| Effect of exchange rate changes on cash | ( | ) | ( | ) | ||||||||
| (Decrease) increase in cash and cash equivalents | ( | ) | ||||||||||
| Cash and cash equivalents from continuing operations at beginning of period | ||||||||||||
| Cash and cash equivalents at end of period | $ | $ | $ | |||||||||
| Supplemental cash flow information: | ||||||||||||
| Cash paid for interest | $ | $ | $ | |||||||||
| Cash paid for income taxes | ||||||||||||
As of December 31, 2021, 2020 and 2019, the amount of capital expenditures in accounts payable was $62 million, $74 million and $64 million, respectively. For the year ended of December 31, 2019, the amounts of cash interest and cash income taxes included in our supplemental cash flow information related to cash paid for interest and cash paid for income taxes that was paid by Venator was $46 million and $38 million, respectively. For the years ended December 31, 2021 and 2020, the amounts of cash paid for taxes in connection with the sale of the Chemical Intermediates Businesses and the India-based DIY business were nil and $231 million, respectively, and $3 million and $26 million, respectively.
See accompanying notes to consolidated financial statements.
REPORT OF INDEPENDENT REGISTERED PUBLIC ACCOUNTING FIRM
To the Members and Board of Managers of Huntsman International LLC
Opinion on the Financial Statements
We have audited the accompanying consolidated balance sheets of Huntsman International LLC and subsidiaries (“Huntsman International”) as of December 31, 2021 and 2020, the related consolidated statements of operations, comprehensive income (loss), equity, and cash flows, for each of the three years in the period ended December 31, 2021, and the related notes (collectively referred to as the “financial statements”). In our opinion, the financial statements present fairly, in all material respects, the financial position of Huntsman International as of December 31, 2021 and 2020, and the results of its operations and its cash flows for each of the three years in the period ended December 31, 2021, in conformity with accounting principles generally accepted in the United States of America.
Basis for Opinion
These financial statements are the responsibility of Huntsman International’s management. Our responsibility is to express an opinion on Huntsman International’s financial statements based on our audits. We are a public accounting firm registered with the PCAOB and are required to be independent with respect to Huntsman International in accordance with the U.S. federal securities laws and the applicable rules and regulations of the Securities and Exchange Commission and the PCAOB.
We conducted our audits in accordance with the standards of the PCAOB. Those standards require that we plan and perform the audit to obtain reasonable assurance about whether the financial statements are free of material misstatement, whether due to error or fraud. Huntsman International is not required to have, nor were we engaged to perform, an audit of its internal control over financial reporting. As part of our audits, we are required to obtain an understanding of internal control over financial reporting but not for the purpose of expressing an opinion on the effectiveness of Huntsman International’s internal control over financial reporting. Accordingly, we express no such opinion.
Our audits included performing procedures to assess the risks of material misstatement of the financial statements, whether due to error or fraud, and performing procedures that respond to those risks. Such procedures included examining, on a test basis, evidence regarding the amounts and disclosures in the financial statements. Our audits also included evaluating the accounting principles used and significant estimates made by management, as well as evaluating the overall presentation of the financial statements. We believe that our audits provide a reasonable basis for our opinion.
Critical Audit Matter
The critical audit matter communicated below is a matter arising from the current-period audit of the financial statements that was communicated or required to be communicated to the Board of Managers and that (1) relates to accounts or disclosures that are material to the financial statements and (2) involved our especially challenging, subjective, or complex judgments. The communication of critical audit matters does not alter in any way our opinion on the financial statements, taken as a whole, and we are not, by communicating the critical audit matter below, providing a separate opinion on the critical audit matter or on the accounts or disclosures to which it relates.
Income Taxes—Realizability of Deferred Tax Assets—Refer to Notes 2 and 19 to the financial statements
Critical Audit Matter Description
Huntsman International recognizes deferred income taxes for tax attributes and for differences between the financial statement and tax carrying amounts of assets and liabilities at enacted statutory tax rates in effect for the years in which the deferred tax liability or asset are expected to be settled or realized. A valuation allowance is provided to offset deferred tax assets if, based upon the available evidence, it is more likely than not that some or all of the deferred tax assets will not be realized. Huntsman International files tax returns in multiple jurisdictions with complex tax laws and regulations. Valuation allowances are evaluated on a tax jurisdiction basis to analyze whether there is sufficient positive or negative evidence to support a change in judgment about the realizability of the related deferred tax assets for each jurisdiction. In evaluating the objective evidence that historical results provide, Huntsman International considers the cyclicality of businesses and cumulative income or losses during the applicable period. Cumulative losses incurred over the period limits Huntsman International’s ability to consider other subjective evidence such as taxable income for the future. Huntsman International’s valuation allowances as of December 31, 2021 were $131 million.
We identified management’s determination that it is not more likely than not that sufficient taxable income will be generated in the future to realize some of its deferred tax assets as a critical audit matter because of the significant judgments and estimates management makes related to future taxable income. This required a high degree of auditor judgment and an increased extent of effort, including the need to involve our income tax specialists, when performing audit procedures to evaluate the reasonableness of management’s estimates of future taxable income.
How the Critical Audit Matter Was Addressed in the Audit
Our audit procedures related to estimated future taxable income and the determination of whether it is more likely than not that the deferred tax assets will be realized included the following, among others:
| • |
We tested the effectiveness of controls over the valuation allowance for income taxes, including management’s controls over the estimates of future taxable income and the determination of whether it is more likely than not that the deferred tax assets will be realized. |
| • |
With the assistance of our income tax specialists, we considered (1) the appropriateness of qualifying tax planning strategies, including that they were prudent, feasible and would more likely than not result in the realization of deferred tax assets and (2) the following sources of management’s estimated future taxable income: |
| – |
Estimates of future taxable income |
| – |
Future reversals of existing temporary differences |
| – |
Taxable income in historical periods (where carryback is permitted under the tax law) |
| • |
We tested the reasonableness of management’s estimates of future taxable income by comparing the estimates to: |
| – |
Historical taxable income |
| – |
Internal communications to management and the Board of Managers |
| – |
Forecasted information included in Huntsman International’s press releases as well as in analyst and industry reports for Huntsman International and certain of its peer companies |
| • |
We evaluated whether the taxable income in prior carryback years was of the appropriate character and available under the tax law. |
| • |
We evaluated the reasonableness of the methods, assumptions, and judgments used by management to determine whether a valuation allowance was necessary. |
/s/ DELOITTE & TOUCHE LLP
Houston, Texas
February 15, 2022
We have served as Huntsman International’s auditor since 1984.
HUNTSMAN INTERNATIONAL LLC AND SUBSIDIARIES
CONSOLIDATED BALANCE SHEETS
(In Millions, Except Unit Amounts)
| December 31, | December 31, | |||||||
| 2021 | 2020 | |||||||
| ASSETS | ||||||||
| Current assets: | ||||||||
| Cash and cash equivalents(a) | $ | $ | ||||||
| Accounts and notes receivable (net of allowance for doubtful accounts of $ and $, respectively), ($ and $ pledged as collateral, respectively)(a) | ||||||||
| Accounts receivable from affiliates | ||||||||
| Inventories(a) | ||||||||
| Receivable associated with the Albemarle Settlement | ||||||||
| Other current assets | ||||||||
| Total current assets | ||||||||
| Property, plant and equipment, net(a) | ||||||||
| Investment in unconsolidated affiliates | ||||||||
| Intangible assets, net | ||||||||
| Goodwill | ||||||||
| Deferred income taxes | ||||||||
| Operating lease right-of-use assets | ||||||||
| Other noncurrent assets(a) | ||||||||
| Total assets | $ | $ | ||||||
| LIABILITIES AND EQUITY | ||||||||
| Current liabilities: | ||||||||
| Accounts payable(a) | $ | $ | ||||||
| Accounts payable to affiliates | ||||||||
| Accrued liabilities(a) | ||||||||
| Current portion of debt(a) | ||||||||
| Current operating lease liabilities(a) | ||||||||
| Total current liabilities | ||||||||
| Long-term debt(a) | ||||||||
| Deferred income taxes | ||||||||
| Noncurrent operating lease liabilities(a) | ||||||||
| Other noncurrent liabilities(a) | ||||||||
| Total liabilities | ||||||||
| Commitments and contingencies (Notes 20 and 21) | ||||||||
| Equity | ||||||||
| Huntsman International LLC members’ equity: | ||||||||
| Members’ equity, units issued and outstanding | ||||||||
| Retained earnings | ||||||||
| Accumulated other comprehensive loss | ( | ) | ( | ) | ||||
| Total Huntsman International LLC members’ equity | ||||||||
| Noncontrolling interests in subsidiaries | ||||||||
| Total equity | ||||||||
| Total liabilities and equity | $ | $ | ||||||
| (a) |
At December 31, 2021 and December 31, 2020, respectively, $1 and $2 of cash and cash equivalents, $12 and $6 of accounts and notes receivable (net), $64 and $38 of inventories, $161 and $167 of property, plant and equipment (net), $23 each of other noncurrent assets, $146 and $119 of accounts payable, $13 each of accrued liabilities, $10 and $47 of current portion of debt, $6 and $5 of current operating lease liabilities, $35 and $3 of long-term debt, $20 and $17 of noncurrent operating lease and $46 and $82 of other noncurrent liabilities from consolidated variable interest entities are included in the respective Balance Sheets captions above. See “Note 8. Variable Interest Entities.” |
See accompanying notes to consolidated financial statements.
HUNTSMAN INTERNATIONAL LLC AND SUBSIDIARIES
CONSOLIDATED STATEMENTS OF OPERATIONS
(In Millions)
| Year ended December 31, |
||||||||||||
| 2021 |
2020 |
2019 |
||||||||||
| Revenues: |
||||||||||||
| Trade sales, services and fees, net |
$ | $ | $ | |||||||||
| Related party sales |
||||||||||||
| Total revenues |
||||||||||||
| Cost of goods sold |
||||||||||||
| Gross profit |
||||||||||||
| Operating expenses: |
||||||||||||
| Selling, general and administrative |
||||||||||||
| Research and development |
||||||||||||
| Restructuring, impairment and plant closing costs (credits) |
( |
) | ||||||||||
| Gain on sale of India-based DIY business |
( |
) | ( |
) | ||||||||
| Other operating (income) expense, net |
( |
) | ( |
) | ||||||||
| Total operating expenses |
||||||||||||
| Operating income |
||||||||||||
| Interest expense, net |
( |
) | ( |
) | ( |
) | ||||||
| Equity in income of investment in unconsolidated affiliates |
||||||||||||
| Fair value adjustments to Venator investment and related loss on disposal |
( |
) | ( |
) | ( |
) | ||||||
| Loss on early extinguishment of debt |
( |
) | ( |
) | ||||||||
| Income associated with the Albemarle Settlement, net |
||||||||||||
| Other income, net |
||||||||||||
| Income from continuing operations before income taxes |
||||||||||||
| Income tax (expense) benefit |
( |
) | ( |
) | ||||||||
| Income from continuing operations |
||||||||||||
| Income from discontinued operations, net of tax |
||||||||||||
| Net income |
||||||||||||
| Net income attributable to noncontrolling interests |
( |
) | ( |
) | ( |
) | ||||||
| Net income attributable to Huntsman International LLC |
$ | $ | $ | |||||||||
See accompanying notes to consolidated financial statements.
HUNTSMAN INTERNATIONAL LLC AND SUBSIDIARIES
CONSOLIDATED STATEMENTS OF COMPREHENSIVE INCOME
(In Millions)
| Year ended December 31, |
||||||||||||
| 2021 |
2020 |
2019 |
||||||||||
| Net income |
$ | $ | $ | |||||||||
| Other comprehensive income (loss), net of tax: |
||||||||||||
| Foreign currency translations adjustment |
( |
) | ||||||||||
| Pension and other postretirement benefits adjustments |
( |
) | ( |
) | ||||||||
| Other, net |
( |
) | ||||||||||
| Other comprehensive income (loss), net of tax |
( |
) | ||||||||||
| Comprehensive income |
||||||||||||
| Comprehensive income attributable to noncontrolling interests |
( |
) | ( |
) | ( |
) | ||||||
| Comprehensive income attributable to Huntsman International LLC |
$ | $ | $ | |||||||||
See accompanying notes to consolidated financial statements.
HUNTSMAN INTERNATIONAL LLC AND SUBSIDIARIES
CONSOLIDATED STATEMENTS OF EQUITY
(In Millions, Except Unit Amounts)
| Huntsman International LLC Members |
||||||||||||||||||||||||
| (Accumulated |
Accumulated |
|||||||||||||||||||||||
| deficit) |
other |
Noncontrolling |
||||||||||||||||||||||
| Members’ equity |
retained |
comprehensive |
interests in |
Total |
||||||||||||||||||||
| Units |
Amount |
earnings |
loss |
subsidiaries |
equity |
|||||||||||||||||||
| Beginning balance, January 1, 2019 |
$ | $ | ( |
) | $ | ( |
) | $ | $ | |||||||||||||||
| Net income |
— | |||||||||||||||||||||||
| Other comprehensive (loss) income |
— | ( |
) | ( |
) | |||||||||||||||||||
| Dividends paid to parent |
— | ( |
) | ( |
) | |||||||||||||||||||
| Contribution from parent |
— | |||||||||||||||||||||||
| Dividends declared to noncontrolling interests |
— | ( |
) | ( |
) | |||||||||||||||||||
| Acquisition of noncontrolling interests, net of tax |
— | ( |
) | ( |
) | ( |
) | |||||||||||||||||
| Balance, December 31, 2019 |
( |
) | ||||||||||||||||||||||
| Net income |
— | |||||||||||||||||||||||
| Other comprehensive income |
— | |||||||||||||||||||||||
| Dividends paid to parent |
— | ( |
) | ( |
) | |||||||||||||||||||
| Contribution from parent |
— | |||||||||||||||||||||||
| Dividends declared to noncontrolling interests |
— | ( |
) | ( |
) | |||||||||||||||||||
| Balance, December 31, 2020 |
( |
) | ||||||||||||||||||||||
| Net income |
— | |||||||||||||||||||||||
| Other comprehensive income |
— | |||||||||||||||||||||||
| Dividends paid to parent |
— | ( |
) | ( |
) | |||||||||||||||||||
| Contribution from parent |
— | |||||||||||||||||||||||
| Dividends declared to noncontrolling interests |
— | ( |
) | ( |
) | |||||||||||||||||||
| Balance, December 31, 2021 |
$ | $ | $ | ( |
) | $ | $ | |||||||||||||||||
See accompanying notes to consolidated financial statements.
HUNTSMAN INTERNATIONAL LLC AND SUBSIDIARIES
CONSOLIDATED STATEMENTS OF CASH FLOWS
(In Millions)
| Year ended December 31, |
||||||||||||
| 2021 |
2020 |
2019 |
||||||||||
| Operating Activities: |
||||||||||||
| Net income |
$ | $ | $ | |||||||||
| Less: Income from discontinued operations, net of tax |
( |
) | ( |
) | ||||||||
| Income from continuing operations |
||||||||||||
| Adjustments to reconcile income from continuing operations to net cash provided by operating activities from continuing operations: |
||||||||||||
| Equity in income of investment in unconsolidated affiliates |
( |
) | ( |
) | ( |
) | ||||||
| Unrealized losses on fair value adjustments to Venator investment and related loss on disposal |
||||||||||||
| Cash received from return on investment in unconsolidated subsidiary |
||||||||||||
| Depreciation and amortization |
||||||||||||
| Noncash lease expense |
||||||||||||
| Gain on disposal of businesses/assets |
( |
) | ( |
) | ( |
) | ||||||
| Loss on early extinguishment of debt |
||||||||||||
| Noncash restructuring and impairment charges (credits) |
||||||||||||
| Deferred income taxes |
( |
) | ( |
) | ||||||||
| Noncash compensation |
||||||||||||
| Other, net |
( |
) | ||||||||||
| Changes in operating assets and liabilities: |
||||||||||||
| Accounts and notes receivable |
( |
) | ||||||||||
| Inventories |
( |
) | ||||||||||
| Receivable associated with the Albemarle Settlement |
( |
) | ||||||||||
| Other current assets |
( |
) | ||||||||||
| Other noncurrent assets |
( |
) | ( |
) | ( |
) | ||||||
| Accounts payable |
||||||||||||
| Accrued liabilities |
( |
) | ( |
) | ||||||||
| Taxes paid on sale of Chemical Intermediates Businesses |
( |
) | ||||||||||
| Other noncurrent liabilities |
( |
) | ( |
) | ||||||||
| Net cash provided by operating activities from continuing operations |
||||||||||||
| Net cash (used in) provided by operating activities from discontinued operations |
( |
) | ( |
) | ||||||||
| Net cash provided by operating activities |
||||||||||||
| Investing Activities: |
||||||||||||
| Capital expenditures |
( |
) | ( |
) | ( |
) | ||||||
| Cash received from sale of businesses |
||||||||||||
| Acquisition of businesses, net of cash acquired |
( |
) | ( |
) | ||||||||
| Cash received from the sale of Venator shares |
||||||||||||
| Increase in receivable from affiliate |
( |
) | ( |
) | ||||||||
| Proceeds from sale of assets |
||||||||||||
| Cash received from forward swap contract related to the sale of investment in Venator |
||||||||||||
| Insurance proceeds for recovery of property damage |
||||||||||||
| Other, net |
||||||||||||
| Net cash (used in) provided by investing activities from continuing operations |
( |
) | ( |
) | ||||||||
| Net cash provided by (used in) investing activities from discontinued operations |
( |
) | ||||||||||
| Net cash (used in) provided by investing activities |
( |
) | ( |
) | ||||||||
(continued)
HUNTSMAN INTERNATIONAL LLC AND SUBSIDIARIES
CONSOLIDATED STATEMENTS OF CASH FLOWS (Continued)
(In Millions)
| Year ended December 31, | ||||||||||||
| 2021 | 2020 | 2019 | ||||||||||
| Financing Activities: | ||||||||||||
| Net repayments on revolving loan facilities | $ | ( | ) | $ | ( | ) | $ | ( | ) | |||
| Proceeds from issuance of long-term debt | — | — | ||||||||||
| Repayments of long-term debt | ( | ) | ( | ) | ( | ) | ||||||
| Proceeds from issuance of long-term debt | — | — | ||||||||||
| Repayments of short-term debt | ( | ) | ||||||||||
| Borrowings on short-term debt | ||||||||||||
| Repayments of notes payable to affiliate | ( | ) | ( | ) | ||||||||
| Repayments of notes payable | ( | ) | ( | ) | ||||||||
| Borrowings on notes payable | ||||||||||||
| Debt issuance costs paid | ( | ) | ( | ) | ||||||||
| Costs of early extinguishment of debt | ( | ) | ( | ) | ||||||||
| Dividends paid to parent | ( | ) | ( | ) | ( | ) | ||||||
| Dividends paid to noncontrolling interests | ( | ) | ( | ) | ( | ) | ||||||
| Cash paid for noncontrolling interest | ( | ) | ||||||||||
| Other | ( | ) | ||||||||||
| Net cash used in financing activities | ( | ) | ( | ) | ( | ) | ||||||
| Effect of exchange rate changes on cash | ( | ) | ( | ) | ||||||||
| (Decrease) increase in cash and cash equivalents | ( | ) | ||||||||||
| Cash and cash equivalents from continuing operations at beginning of period | ||||||||||||
| Cash and cash equivalents at end of period | $ | $ | $ | |||||||||
| Supplemental cash flow information: | ||||||||||||
| Cash paid for interest | $ | $ | $ | |||||||||
| Cash paid for income taxes | ||||||||||||
As of December 31, 2021, 2020 and 2019 the amount of capital expenditures in accounts payable was $62 million, $74 million and $64 million, respectively. For the year ended December 31, 2019, the amount of cash interest and cash income taxes included in our supplemental cash flow information related to cash paid for interest and cash paid for income taxes that was paid by Venator was $46 million and $38 million, respectively. For the years ended December 31, 2021 and 2020, the amounts of cash paid for taxes in connection with the sale of the Chemical Intermediates Businesses and the India-based DIY business were nil and $231 million, respectively, and $3 million and $26 million, respectively.
See accompanying notes to consolidated financial statements.
HUNTSMAN CORPORATION AND SUBSIDIARIES
HUNTSMAN INTERNATIONAL LLC AND SUBSIDIARIES
NOTES TO CONSOLIDATED FINANCIAL STATEMENTS
Definitions
For convenience in this report, the terms “Company,” “our” or “we” may be used to refer to Huntsman Corporation and, unless the context otherwise requires, its subsidiaries and predecessors. In this report, “Huntsman International” refers to Huntsman International LLC (our wholly-owned subsidiary) and, unless the context otherwise requires, its subsidiaries; “AAC” refers to Arabian Amines Company, our consolidated manufacturing joint venture with the Zamil Group; “HPS” refers to Huntsman Polyurethanes Shanghai Ltd. (our consolidated splitting joint venture with Shanghai Chlor-Alkali Chemical Company, Ltd); and “SLIC” refers to Shanghai Liengheng Isocyanate Company (our unconsolidated manufacturing joint venture with BASF and Chinese chemical companies).
In this report, we may use, without definition, the common names of competitors or other industry participants. We may also use the common names or abbreviations for certain chemicals or products.
Description of Business
We are a global manufacturer of differentiated organic chemical products. We operate in segments: Polyurethanes, Performance Products, Advanced Materials and Textile Effects. Our products comprise a broad range of chemicals and formulations, which we market globally to a diversified group of consumer and industrial customers. Our products are used in a wide range of applications, including those in the adhesives, aerospace, automotive, construction products, durable and non-durable consumer products, electronics, insulation, medical, packaging, coatings and construction, power generation, refining, synthetic fiber, textile chemicals and dye industries. We are a leading global producer in many of our key product lines, including MDI, amines, maleic anhydride, epoxy-based polymer formulations, textile chemicals and dyes.
Company
Our Company, a Delaware corporation, was formed in 2004 to hold the Huntsman businesses, which were founded by Jon M. Huntsman. Mr. Huntsman founded the predecessor to our Company in 1970 as a small polystyrene plastics packaging company. Since then, we have grown through a series of acquisitions and now own a global portfolio of businesses.
We operate all of our businesses through Huntsman International, our wholly-owned subsidiary. Huntsman International is a Delaware limited liability company and was formed in 1999.
Recent Developments
Dividend Increase
On February 14, 2022, our Board of Directors declared a $
Strategic Review of Textile Effects
In December 2021, we initiated a strategic review of our Textile Effects segment, which is headquartered in Singapore, including a possible sale of the segment. We have not set a timetable or a deadline for the conclusion of this evaluation of strategic alternatives.
Albemarle Settlement
On October 28, 2021, we won an arbitration award in excess of $
Share Repurchase Program
On October 26, 2021, our Board of Directors approved a new share repurchase program of $
Other Significant Developments During 2021
Other significant developments that occurred during 2021 were as follows:
| ● | On July 1, 2021, we entered into amendments to our A/R Programs that, among other things, extended the scheduled termination dates of our A/R Programs from April 2022 to July 2024. For additional information, see “Note 14. Debt—Direct and Subsidiary Debt—A/R Programs.” |
| ● | On May 26, 2021, Huntsman International completed a $ |
| ● | On November 3, 2020, we completed the sale of the DIY business, part of our Advanced Materials segment to Pidilite Industries Ltd. and received cash of approximately $ |
| ● | On January 15, 2021, we completed the Gabriel Acquisition from funds affiliated with Audax Private Equity in an all-cash transaction of approximately $ |
| ● | On January 15, 2021, we redeemed in full million (approximately $ |
Huntsman Corporation and Huntsman International Financial Statements
Except where otherwise indicated, these notes relate to the consolidated financial statements for both our Company and Huntsman International. The differences between our consolidated financial statements and Huntsman International’s consolidated financial statements relate primarily to the following:
| ● | purchase accounting recorded at our Company for the 2003 step-acquisition of Huntsman International Holdings LLC, the former parent company of Huntsman International that was merged into Huntsman International in 2005; and |
| ● | the different capital structures. |
2. SUMMARY OF SIGNIFICANT ACCOUNTING POLICIES
Carrying Value of Long-Lived Assets
We review long-lived assets and all amortizable intangible assets for impairment whenever events or changes in circumstances indicate that the carrying amount of these assets may not be recoverable. Recoverability is based upon current and anticipated undiscounted cash flows, and we recognize an impairment when such estimated cash flows are less than the carrying value of the asset. Measurement of the amount of impairment, if any, is based upon the difference between carrying value and fair value. Fair value is generally estimated by discounting estimated future cash flows using a discount rate commensurate with the risks involved or selling price of assets held for sale.
Cash and Cash Equivalents
We consider cash in checking accounts and cash in short-term highly liquid investments with original maturities of three months or less at the date of purchase to be cash and cash equivalents.
Cost of Goods Sold
We classify the costs of manufacturing and distributing our products as cost of goods sold. Manufacturing costs include variable costs, primarily raw materials and energy, and fixed expenses directly associated with production. Manufacturing costs also include, among other things, plant site operating costs and overhead (including depreciation), production planning and logistics costs, repair and maintenance costs, plant site purchasing costs, and engineering and technical support costs. Distribution, freight and warehousing costs are also included in cost of goods sold.
Derivatives and Hedging Activities
All derivatives, whether designated in hedging relationships or not, are recorded on our balance sheets at fair value. If the derivative is designated as a fair value hedge, the changes in the fair value of the derivative and the hedged items are recognized in earnings. If the derivative is designated as a cash flow hedge, changes in the fair value of the derivative are recorded in accumulated other comprehensive loss, to the extent effective, and will be recognized in the income statement when the hedged item affects earnings. Changes in the fair value of the hedge in the net investment of certain international operations are recorded in other comprehensive income (loss), to the extent effective. The effectiveness of a cash flow hedging relationship is established at the inception of the hedge, and after inception we perform effectiveness assessments at least every months. A derivative designated as a cash flow hedge is determined to be effective if the change in value of the hedge divided by the change in value of the hedged item is within a range of
Environmental Expenditures
Environmental related restoration and remediation costs are recorded as liabilities when site restoration and environmental remediation and clean-up obligations are either known or considered probable and the related costs can be reasonably estimated. Other environmental expenditures that are principally maintenance or preventative in nature are recorded when expended and incurred and are expensed or capitalized as appropriate. See “Note 21. Environmental, Health and Safety Matters.”
Equity Method Investments
We account for our equity investments where we own a non-controlling interest, but exercise significant influence, under the equity method of accounting. Under the equity method of accounting, our original cost of the investment is adjusted for our share of equity in the earnings of the equity investee and reduced by dividends and distributions of capital received, unless the fair value option is elected, in which case the investment balance is marked to fair value each reporting period and the impact of changes in fair value of the equity investment are reported in earnings.
Foreign Currency Translation
The accounts of our operating subsidiaries outside of the U.S., unless they are operating in highly inflationary economic environments, consider the functional currency to be the currency of the economic environment in which they operate. Accordingly, assets and liabilities are translated at rates prevailing at the balance sheet date. Revenues, expenses, gains and losses are translated at a weighted average rate for the period. Cumulative translation adjustments are recorded to equity as a component of accumulated other comprehensive loss.
If a subsidiary operates in an economic environment that is considered to be highly inflationary (
Foreign currency transaction gains and losses are recorded in other operating (income) expense, net in our consolidated statements of operations and were gains (losses) of $
Income Taxes
We use the asset and liability method of accounting for income taxes. Deferred income taxes reflect the net tax effects of temporary differences between the carrying amounts of assets and liabilities for financial and tax reporting purposes. We evaluate deferred tax assets to determine whether it is more likely than not that they will be realized. Valuation allowances are reviewed on a tax jurisdiction basis to analyze whether there is sufficient positive or negative evidence to support a change in judgment about the realizability of the related deferred tax assets for each jurisdiction. These conclusions require significant judgment. In evaluating the objective evidence that historical results provide, we consider the cyclicality of businesses and cumulative income or losses during the applicable period. Cumulative losses incurred over the period limits our ability to consider other subjective evidence such as our projections for the future. Changes in expected future income in applicable jurisdictions could affect the realization of deferred tax assets in those jurisdictions.
Accounting for uncertainty in income taxes prescribes a recognition threshold and measurement attribute for the financial statement recognition and measurement of a tax position taken or expected to be taken in a tax return. The application of income tax law is inherently complex. We are required to determine if an income tax position meets the criteria of more-likely-than-not to be realized based on the merits of the position under tax law, in order to recognize an income tax benefit. This requires us to make significant judgments regarding the merits of income tax positions and the application of income tax law. Additionally, if a tax position meets the recognition criteria of more-likely-than-not we are required to make judgments and apply assumptions to measure the amount of the tax benefits to recognize. These judgments are based on the probability of the amount of tax benefits that would be realized if the tax position was challenged by the taxing authorities. Interpretations and guidance surrounding income tax laws and regulations change over time. As a consequence, changes in assumptions and judgments can materially affect amounts recognized in our consolidated financial statements. See “Note 19. Income Taxes.”
During 2019, we adopted Accounting Standards Update (“ASU”) No. 2018-02, Income Statement – Reporting Comprehensive Income (Topic 220): Reclassification of Certain Tax Effects from Accumulated Other Comprehensive Income. We did not make the election to reclassify the income tax effects of the U.S. Tax Reform Act from accumulated other comprehensive loss to retained earnings. Stranded income tax effects are generally released from accumulated other comprehensive loss when an entire portfolio of the type of item related to the stranded income tax effect is liquidated, sold or extinguished.
Intangible Assets and Goodwill
Intangible assets are stated at cost (fair value at the time of acquisition) and are amortized using the straight-line method over the estimated useful lives or the life of the related agreement as follows:
| In Years | ||
| Patents and technology | ||
| Trademarks | ||
| Licenses and other agreements | ||
| Other intangibles |
Goodwill represents costs in excess of fair values assigned to the underlying net assets of acquired businesses. Goodwill is not subject to any method of amortization, but is tested for impairment annually (at the beginning of the third quarter) and when events and circumstances change that would more likely than not reduce the fair value of a reporting unit below its carrying amount. When the fair value is less than the carrying value of the related reporting unit, we are required to reduce the amount of goodwill through a charge to earnings. Fair value is estimated using the market approach, as well as the income approach based on discounted cash flow projections. Goodwill has been assigned to reporting units for purposes of impairment testing.
During 2021, goodwill increased by approximately $
Inventories
Inventories are stated at the lower of cost or market, with cost determined using LIFO, first-in first-out, and average costs methods for different components of inventory.
Leases
On January 1, 2019, we adopted the new lease standard using the optional transition method provided under ASU No. 2018-11, which allowed us to initially apply the amendments of the new lease standard at the adoption date. Upon adoption of the new lease standard, we elected the package of three practical expedient permitted under the transition guidance within the new lease standard, which among other things, allowed us to carry forward the historical lease classification on existing leases at adoption. In addition, we elected the practical expedient related to land easements, which allowed us to carry forward our accounting treatment for land easements on existing agreements. We also elected the hindsight practical expedient to determine the lease term for existing leases.
The determination of whether a contract is or contains a lease is performed at the lease inception date. Lease right-of-use assets and lease liabilities are recognized at the lease commencement date based on the present value of lease payments over the lease term, using incremental borrowing rates as the implicit rates are not readily determinable for our leases. The incremental borrowing rates are determined on a collateralized basis and vary from lease to lease depending on the country where the leased asset exists and the term of the lease arrangement. We combine lease components with non-lease components and account for them as a single lease component for all classes of underlying assets, except for leases of manufacturing and research facilities and administrative offices. For these assets, non-lease components are separated from lease components and accounted for as normal operating expenses. See “Note 9. Leases.”
Legal Costs
We expense legal costs, including those legal costs incurred in connection with a loss contingency, as incurred.
Net Income Per Share Attributable to Huntsman Corporation
Basic income per share excludes dilution and is computed by dividing net income attributable to Huntsman Corporation by the weighted average number of shares outstanding during the period. Diluted income per share reflects all potential dilutive common shares outstanding during the period and is computed by dividing net income attributable to Huntsman Corporation by the weighted average number of shares outstanding during the period increased by the number of additional shares that would have been outstanding as potential dilutive securities.
Basic and diluted income per share is determined using the following information (in millions):
| Year ended December 31, | ||||||||||||
| 2021 | 2020 | 2019 | ||||||||||
| Numerator: | ||||||||||||
| Income from continuing operations attributable to Huntsman Corporation | $ | $ | $ | |||||||||
| Net income attributable to Huntsman Corporation | $ | $ | $ | |||||||||
| Denominator: | ||||||||||||
| Weighted average shares outstanding | ||||||||||||
| Dilutive shares: | ||||||||||||
| Stock-based awards | ||||||||||||
| Total weighted average shares outstanding, including dilutive shares | ||||||||||||
Additional stock-based awards of
Other Noncurrent Assets
Periodic maintenance and repairs applicable to major units of manufacturing facilities (a “turnaround”) are accounted for on the deferral basis by capitalizing the costs of the turnaround and amortizing the costs over the estimated period until the next turnaround.
Principles of Consolidation
Our consolidated financial statements include the accounts of our wholly owned and majority owned subsidiaries and any variable interest entities for which we are the primary beneficiary. All intercompany accounts and transactions have been eliminated.
Property, Plant and Equipment
Property, plant and equipment is stated at cost less accumulated depreciation. Depreciation is computed using the straight-line method over the estimated useful lives or lease term as follows:
| In Years | ||
| Buildings | ||
| Plant and equipment | ||
| Furniture, fixtures and leasehold improvements |
Interest expense capitalized as part of plant and equipment was $
Normal maintenance and repairs of plant and equipment are charged to expense as incurred. Renewals, betterments and major repairs that materially extend the useful life of the assets are capitalized, and the assets replaced, if any, are retired.
Revenue Recognition
We generate substantially all of our revenue through product sales in the open market and long-term supply agreements in which revenue is recognized at a point in time. We recognize revenue when control of the promised goods is transferred to our customers. Control of goods usually passes to the customer at the time shipment is made. Revenue is measured as the amount that reflects the consideration that we expect to be entitled to in exchange for those goods. Sales, value add, and other taxes we collect concurrent with revenue-producing activities are excluded from revenue. Incidental items that are immaterial in the context of the contract are recognized as expense. We have elected to account for all shipping and handling activities as fulfillment costs. We have also elected to expense commissions when incurred as the amortization period of the commission asset that we would have otherwise recognized is less than one year.
Substantially all of our revenue is generated through product sales in which revenue is recognized at a point in time. At contract inception, we assess the goods and services, if any, promised in our contracts and identify a performance obligation for each promise to transfer to the customer a good or service that is distinct. In substantially all cases, a contract has a single performance obligation to deliver a promised good to the customer. Revenue is recognized when control of the product is transferred to the customer (i.e., when our performance obligation is satisfied), which typically occurs at shipment. Further, in determining whether control has transferred, we consider if there is a present right to payment and legal title, along with risks and rewards of ownership having transferred to the customer.
The amount of consideration we receive and revenue we recognize is based upon the terms stated in the sales contract, which may contain variable consideration such as discounts or rebates. We allocate the transaction price to each distinct product based on their relative standalone selling price. The product price as specified on the purchase order or in the sales contract is considered the standalone selling price as it is an observable input that depicts the price as if sold to a similar customer in similar circumstances. In order to estimate the applicable variable consideration, we use historical and current trend information to estimate the amount of discounts or rebates to which customers are likely to be entitled. Historically, actual discount or rebate adjustments relative to those estimated and included when determining the transaction price have not materially differed. Payment terms vary but are generally less than one year. As our standard payment terms are less than one year, we have elected to not assess whether a contract has a significant financing component. In the normal course of business, we do not accept product returns unless the item is defective as manufactured. We establish provisions for estimated returns based on an analysis of historical experience. See “Note 17. Revenue Recognition.”
Securitization of Accounts Receivable
Under our A/R Programs, we grant an undivided interest in certain of our trade receivables to the special purpose entities (“SPE”) in the U.S. and EU. This undivided interest serves as security for the issuance of debt. The A/R Programs provide for financing in both U.S. dollars, euros and British pounds. The amounts outstanding under our A/R Programs are accounted for as secured borrowings. See “Note 14. Debt—Direct and Subsidiary Debt—A/R Programs.”
Stock-Based Compensation
We measure the cost of employee services received in exchange for an award of equity instruments based on the grant-date fair value of the award. That cost, net of estimated forfeitures, will be recognized over the period during which the employee is required to provide services in exchange for the award. See “Note 23. Stock-Based Compensation Plan.”
Use of Estimates
The preparation of financial statements in conformity with U.S. GAAP requires management to make estimates and assumptions that affect the reported amounts of assets and liabilities and disclosure of contingent assets and liabilities at the date of the financial statements and the reported amounts of revenues and expenses during the reporting period. Actual results could differ from those estimates.
Accounting Pronouncements Adopted During 2021
We adopted the following accounting pronouncements during 2021, which did not have a significant impact on our consolidated financial statements:
| ● | Financial Accounting Standards Board (“FASB”) ASU No. 2021-01, Reference Rate Reform (Topic 848): Scope. |
3. BUSINESS COMBINATIONS AND ACQUISITIONS
On January 15, 2021, we completed the Gabriel Acquisition from funds affiliated with Audax Private Equity in an all-cash transaction of approximately $
We accounted for the Gabriel Acquisition using the acquisition method. As such, we analyzed the fair value of tangible and intangible assets acquired and liabilities assumed. The preliminary allocation of acquisition cost to the assets acquired and liabilities assumed is summarized as follows (dollars in millions):
| Fair value of assets acquired and liabilities assumed: |
||||
| Cash paid for the Gabriel Acquisition |
$ | |||
| Cash |
$ | |||
| Accounts receivable |
||||
| Inventories |
||||
| Property, plant and equipment |
||||
| Intangible assets |
||||
| Goodwill |
||||
| Accounts payable |
( |
) | ||
| Accrued liabilities |
( |
) | ||
| Deferred income taxes |
( |
) | ||
| Total fair value of net assets acquired |
$ |
The acquisition cost allocation is preliminary pending final determination of the fair value of assets acquired and liabilities assumed, including final valuation of certain liabilities and deferred taxes. As a result of a preliminary valuation of the assets and liabilities, reallocations were made in certain inventory, property, plant and equipment, intangible asset, goodwill, accrued liability and deferred tax balances. Intangible assets acquired included in this preliminary allocation consist primarily of trademarks, technology and trade secrets, which are being amortized over a period of
The acquired business had revenues and net income of $
Acquisition of CVC Thermoset Specialties
On May 18, 2020, we completed the CVC Thermoset Specialties Acquisition, a North American specialty chemical manufacturer serving the industrial composites, adhesives and coatings markets. We acquired the business for $
We accounted for the CVC Thermoset Specialties Acquisition using the acquisition method. As such, we analyzed the fair value of tangible and intangible assets acquired and liabilities assumed. The allocation of acquisition cost to the assets acquired and liabilities assumed is summarized as follows (dollars in millions):
| Fair value of assets acquired and liabilities assumed: |
||||
| Cash paid for the CVC Thermoset Specialties Acquisition |
$ | |||
| Accounts receivable |
$ | |||
| Inventories |
||||
| Property, plant and equipment |
||||
| Intangible assets |
||||
| Goodwill |
||||
| Accounts payable |
( |
) | ||
| Accrued liabilities |
( |
) | ||
| Deferred income taxes |
( |
) | ||
| Total fair value of net assets acquired |
$ |
Intangible assets acquired consist primarily of trademarks, trade secrets and customer relationships, which are predominantly being amortized over a period of
Acquisition of Icynene-Lapolla
On February 20, 2020, we completed the Icynene-Lapolla Acquisition, a leading North American manufacturer and distributor of spray polyurethane foam insulation systems for residential and commercial applications. We acquired the business from an affiliate of FFL Partners, LLC for $
We have accounted for the Icynene-Lapolla Acquisition using the acquisition method. As such, we analyzed the fair value of tangible and intangible assets acquired and liabilities assumed. The allocation of acquisition cost to the assets acquired and liabilities assumed is summarized as follows (dollars in millions):
| Fair value of assets acquired and liabilities assumed: |
||||
| Cash paid for the Icynene-Lapolla Acquisition |
$ | |||
| Cash |
$ | |||
| Accounts receivable |
||||
| Inventories |
||||
| Prepaid expenses and other current assets |
||||
| Property, plant and equipment |
||||
| Intangible assets |
||||
| Goodwill |
||||
| Other noncurrent assets |
||||
| Accounts payable |
( |
) | ||
| Accrued liabilities |
( |
) | ||
| Deferred income taxes |
( |
) | ||
| Total fair value of net assets acquired |
$ |
As a result of the final valuation of the assets and liabilities, reallocations were made during the first quarter of 2021 in certain current asset and liability, property, plant and equipment, intangible asset, goodwill, other noncurrent assets and deferred tax balances. Intangible assets acquired consist primarily of trademarks, trade secrets and customer relationships, which are predominantly being amortized over a period of
PRO FORMA INFORMATION FOR ACQUISITIONS
If the Gabriel Performance Products Acquisition, the CVC Thermoset Specialties Acquisition and the Icynene-Lapolla Acquisition were to have occurred on January 1, 2020, the following estimated pro forma revenues, net income and net income attributable to Huntsman Corporation and Huntsman International would have been reported (dollars in millions):
| Pro forma (unaudited) |
||||||||
| Year ended December 31, |
||||||||
| 2021(1) |
2020 |
|||||||
| Revenues |
$ | $ | ||||||
| Net income |
||||||||
| Net income attributable to Huntsman Corporation |
||||||||
| Pro forma (unaudited) |
||||||||
| Year ended December 31, |
||||||||
| 2021(1) |
2020 |
|||||||
| Revenues |
$ | $ | ||||||
| Net income |
||||||||
| Net income attributable to Huntsman International |
||||||||
| (1) |
Includes pro forma information for the Gabriel Acquisition only. |
Acquisition of Remaining Interest in Sasol-Huntsman Joint Venture
On September 30, 2019, we acquired from Sasol, our former joint venture partner, the
The effects of changes in our ownership interest in Sasol-Huntsman on the equity attributable to Huntsman Corporation and Huntsman International are as follows (dollars in millions):
| Year ended |
||||
| December 31, 2019 |
||||
| Net income attributable to Huntsman Corporation shareholders |
$ | |||
| Decrease in Huntsman Corporation’s paid-in capital for purchase of 50% interest in Sasol-Huntsman |
( |
) | ||
| Net transfers to noncontrolling interest |
( |
) | ||
| Change from net income attributable to Huntsman Corporation shareholders and transfers to noncontrolling interest |
$ | |||
| Year ended |
||||
| December 31, 2019 |
||||
| Net income attributable to Huntsman International shareholders |
$ | |||
| Decrease in Huntsman International’s paid-in capital for purchase of 50% interest in Sasol-Huntsman |
( |
) | ||
| Net transfers to noncontrolling interest |
( |
) | ||
| Change from net income attributable to Huntsman International shareholders and transfers to noncontrolling interest |
$ | |||
4. DISCONTINUED OPERATIONS AND BUSINESS DISPOSITIONS
Sale of India-Based Do-It-Yourself Consumer Adhesives Business
On November 3, 2020, we completed the sale of the India-based DIY business to Pidilite Industries Ltd. and received cash of approximately $
Sale of Chemical Intermediates Businesses
On January 3, 2020, we completed the sale of our Chemical Intermediates Businesses to Indorama in a transaction valued at approximately $
During the year ended December 31, 2020, we paid $
The following table reconciles major line items constituting pretax income of discontinued operations to after-tax income of discontinued operations as presented in our consolidated statements of operations (dollars in millions):
| Year ended December 31, |
||||||||||||
| 2021 |
2020 |
2019 |
||||||||||
| Major line items constituting pretax income of discontinued operations(1): |
||||||||||||
| Trade sales, services and fees, net(2) |
$ | $ | $ | |||||||||
| Cost of goods sold(2)(3) |
( |
) | ||||||||||
| Gain on sale of the Chemical Intermediates Businesses |
||||||||||||
| Other (income) expense items, net |
( |
) | ||||||||||
| Income from discontinued operations before income taxes |
||||||||||||
| Income tax expense |
( |
) | ( |
) | ( |
) | ||||||
| Net income attributable to discontinued operations |
$ | $ | $ | |||||||||
|
|
|
| (1) |
Discontinued operations primarily include our Chemical Intermediates Businesses, our Australia styrenics operations and our North American polymers and base chemicals operations for all periods presented. |
| (2) |
Includes eliminations of trade sales, services and fees, net and cost of sales between continuing operations and discontinued operations. |
| (3) | Includes $ |
Separation and Deconsolidation of Venator
In August 2017, we separated our Titanium Dioxide and Performance Additives business and conducted an initial public offering of ordinary shares of Venator. Beginning in December 2018, following a series of public offerings and sales of Venator ordinary shares, our ownership in Venator decreased to approximately
5. INVENTORIES
Inventories consisted of the following (dollars in millions):
| December 31, | ||||||||
| 2021 | 2020 | |||||||
| Raw materials and supplies | $ | $ | ||||||
| Work in progress | ||||||||
| Finished goods | ||||||||
| Total | ||||||||
| LIFO reserves | ( | ) | ( | ) | ||||
| Net inventories | $ | $ | ||||||
For both December 31, 2021 and 2020, approximately
6. PROPERTY, PLANT AND EQUIPMENT
The cost and accumulated depreciation of property, plant and equipment were as follows (dollars in millions):
Huntsman Corporation
| December 31, |
||||||||
| 2021 |
2020 |
|||||||
| Land |
$ | $ | ||||||
| Buildings |
||||||||
| Plant and equipment |
||||||||
| Construction in progress |
||||||||
| Total |
||||||||
| Less accumulated depreciation |
( |
) | ( |
) | ||||
| Net |
$ | $ | ||||||
Huntsman International
| December 31, |
||||||||
| 2021 |
2020 |
|||||||
| Land |
$ | $ | ||||||
| Buildings |
||||||||
| Plant and equipment |
||||||||
| Construction in progress |
||||||||
| Total |
||||||||
| Less accumulated depreciation |
( |
) | ( |
) | ||||
| Net |
$ | $ | ||||||
Depreciation expense for Huntsman Corporation and Huntsman International for 2021, 2020 and 2019 was $
7. INVESTMENT IN UNCONSOLIDATED AFFILIATES
Our ownership percentage and investment in unconsolidated affiliates were as follows (dollars in millions):
| December 31, | ||||||||
| 2021 | 2020 | |||||||
| Equity Method: | ||||||||
| BASF Huntsman Shanghai Isocyanate Investment BV ()(1) | $ | $ | ||||||
| Nanjing Jinling Huntsman New Material Co., Ltd. () | ||||||||
| Jurong Ningwu New Material Development Co., Ltd. () | ||||||||
| KPX Huntsman Polyurethanes Automotive Co., Ltd. ()(2) | ||||||||
| Total investments | $ | $ | ||||||
|
|
||
| (1) |
We own |
|
| (2) | KPX Huntsman Polyurethanes Automotive Co., Ltd. was formed in September 2021. |
All of our equity method investments are held by our Polyurethanes segment.
Summarized Financial Information of Unconsolidated Affiliates
Summarized financial information of our unconsolidated affiliates as of December 31, 2021 and 2020 and for the years ended December 31, 2021, 2020 and 2019 is as follows (dollars in millions):
| December 31, |
||||||||
| 2021 |
2020 |
|||||||
| Current assets |
$ | $ | ||||||
| Non-current assets |
||||||||
| Current liabilities |
||||||||
| Non-current liabilities |
||||||||
| Noncontrolling interests |
||||||||
| Year ended December 31, |
||||||||||||
| 2021 |
2020 |
2019(1) |
||||||||||
| Revenues |
$ | $ | $ | |||||||||
| Gross profit |
||||||||||||
| Income (loss) from continuing operations |
( |
) | ||||||||||
| Net income (loss) |
( |
) | ||||||||||
|
|
||
| (1) |
We began accounting for our investment in Venator as an equity method investment on December 3, 2018 and then as an investment in equity securities on December 23, 2020 and thereafter. Therefore, the summarized financial data only includes information for Venator for the years ended December 31, 2020 and 2019. |
8. VARIABLE INTEREST ENTITIES
We evaluate our investments and transactions to identify variable interest entities for which we are the primary beneficiary. We hold a variable interest in the following joint ventures for which we are the primary beneficiary:
| ● |
Rubicon is our |
| ● |
AAC is our |
Sasol-Huntsman was our
During the year ended December 31, 2021, there were no changes in our variable interest entities.
Creditors of our variable interest entities have no recourse to our general credit. See “Note 14. Debt—Direct and Subsidiary Debt.” As the primary beneficiary of these variable interest entities at December 31, 2021, the joint ventures’ assets, liabilities and results of operations are included in our consolidated financial statements.
The following table summarizes the carrying amount of our variable interest entities’ assets and liabilities included in our consolidated balance sheets as of December 31, 2021 and 2020 (dollars in millions):
| December 31, | ||||||||
| 2021 | 2020 | |||||||
| Current assets |
$ | $ | ||||||
| Property, plant and equipment, net |
||||||||
| Operating lease right-of-use assets |
||||||||
| Other noncurrent assets |
||||||||
| Deferred income taxes |
||||||||
| Total assets |
$ | $ | ||||||
| Current liabilities |
$ | $ | ||||||
| Long-term debt |
||||||||
| Noncurrent operating lease liabilities |
||||||||
| Other noncurrent liabilities |
||||||||
| Deferred income taxes |
||||||||
| Total liabilities |
$ | $ | ||||||
The revenues, income from continuing operations before income taxes and net cash provided by operating activities for our variable interest entities are as follows (dollars in millions):
| Year ended December 31, |
||||||||||||
| 2021 |
2020 |
2019(1) |
||||||||||
| Revenues |
$ | $ | $ | |||||||||
| Income from continuing operations before income taxes |
||||||||||||
| Net cash provided by operating activities |
||||||||||||
|
|
||
| (1) |
As of September 30, 2019, Sasol-Huntsman was no longer accounted for as a variable interest entity. Therefore, this financial data only includes information for Sasol-Huntsman applicable to the period from January 1, 2019 through September 30, 2019. |
9. LEASES
We primarily lease manufacturing and research facilities, administrative offices, land, tanks, railcars and equipment. Leases with an initial term of 12 months or less are not recognized on the balance sheets; we recognize lease expense for these leases on a straight-line basis over the lease term. Our variable lease cost was approximately for each of the years ended December 31, 2021, 2020 and 2019, respectively. Our leases have remaining lives from month to
The components of operating lease expense, cash flows and supplemental noncash information from continuing operations are as follows (dollars in millions):
| Years ended December 31, | ||||||||||||
| 2021 | 2020 | 2019 | ||||||||||
| Operating lease expense: | ||||||||||||
| Cost of goods sold | $ | $ | $ | |||||||||
| Selling, general and administrative | ||||||||||||
| Research and development | ||||||||||||
| Total operating lease expense(1) | $ | $ | $ | |||||||||
| Cash paid for amounts included in the measurement of lease liabilities: | ||||||||||||
| Operating cash flows from operating leases | $ | $ | $ | |||||||||
| Supplemental noncash information: | ||||||||||||
| Leased assets obtained in exchange for new operating lease liabilities | $ | $ | $ | |||||||||
|
| ||
| (1) | Total operating lease expense includes short-term lease expense of approximately $ |
The weighted-average lease term and discount rate for our operating leases from continuing operations are as follows:
| Years ended December 31, | ||||||||||||
| 2021 | 2020 | 2019 | ||||||||||
| Weighted-average remaining lease term (in years) | ||||||||||||
| Weighted-average discount rate | % | % | % | |||||||||
The undiscounted future cash flows of operating lease liabilities from continuing operations as of December 31, 2021 are as follows (dollars in millions):
| Year ending December 31, | ||||
| 2022 | $ | |||
| 2023 | ||||
| 2024 | ||||
| 2025 | ||||
| 2026 | ||||
| Thereafter | ||||
| Total lease payments | ||||
| Less imputed interest | ( | ) | ||
| Total | $ |
As of December 31, 2021, we have additional leases, primarily for leases of office and manufacturing facilities and rail cars, that have not yet commenced of approximately $
During November 2020, we entered into a sale and leaseback agreement to sell certain properties in Basel, Switzerland for approximately CHF
10. INTANGIBLE ASSETS
The gross carrying amount and accumulated amortization of intangible assets were as follows (dollars in millions):
Huntsman Corporation
| December 31, 2021 |
December 31, 2020 |
|||||||||||||||||||||||
| Carrying |
Accumulated |
Carrying |
Accumulated |
|||||||||||||||||||||
| Amount |
Amortization |
Net |
Amount |
Amortization |
Net |
|||||||||||||||||||
| Patents, trademarks and technology |
$ | $ | $ | $ | $ | $ | ||||||||||||||||||
| Licenses and other agreements |
||||||||||||||||||||||||
| Other intangibles(1) |
||||||||||||||||||||||||
| Total |
$ | $ | $ | $ | $ | $ | ||||||||||||||||||
Huntsman International
| December 31, 2021 |
December 31, 2020 |
|||||||||||||||||||||||
| Carrying |
Accumulated |
Carrying |
Accumulated |
|||||||||||||||||||||
| Amount |
Amortization |
Net |
Amount |
Amortization |
Net |
|||||||||||||||||||
| Patents, trademarks and technology |
$ | $ | $ | $ | $ | $ | ||||||||||||||||||
| Licenses and other agreements |
||||||||||||||||||||||||
| Other intangibles(1) |
||||||||||||||||||||||||
| Total |
$ | $ | $ | $ | $ | $ | ||||||||||||||||||
|
|
||
| (1) |
Includes provisional intangible asset fair values related to the CVC Thermoset Specialties Acquisition and the Icynene-Lapolla Acquisition for the 2020 period. For more information, see “Note 3. Business Combinations and Acquisitions." |
Amortization expense for Huntsman Corporation and Huntsman International was $
Our and Huntsman International’s estimated future amortization expense for intangible assets over the next five years is as follows (dollars in millions):
| Year ending December 31, |
||||
| 2022 |
$ | |||
| 2023 |
||||
| 2024 |
||||
| 2025 |
||||
| 2026 |
11. ACCRUED LIABILITIES
Accrued liabilities consisted of the following (dollars in millions):
Huntsman Corporation
| December 31, |
||||||||
| 2021 |
2020 |
|||||||
| Payroll and related accruals |
$ | $ | ||||||
| Income taxes |
||||||||
| Taxes other than income taxes |
||||||||
| Volume and rebate accruals |
||||||||
| Legal fees payable related to the Albemarle Settlement |
||||||||
| Other miscellaneous accruals |
||||||||
| Total |
$ | $ | ||||||
Huntsman International
| December 31, |
||||||||
| 2021 |
2020 |
|||||||
| Payroll and related accruals |
$ | $ | ||||||
| Income taxes |
||||||||
| Taxes other than income taxes |
||||||||
| Volume and rebate accruals |
||||||||
| Legal fees payable related to the Albemarle Settlement |
||||||||
| Other miscellaneous accruals |
||||||||
| Total |
$ | $ | ||||||
12. RESTRUCTURING, IMPAIRMENT AND PLANT CLOSING COSTS (CREDITS)
As of December 31, 2021, 2020 and 2019, accrued restructuring costs by type of cost and initiative consisted of the following (dollars in millions):
| Non-cancelable |
Other |
|||||||||||||||||||
| Workforce |
Demolition and |
lease and contract |
restructuring |
|||||||||||||||||
| reductions |
decommissioning |
termination costs |
costs |
Total |
||||||||||||||||
| Accrued liabilities as of January 1, 2019 |
$ | $ | $ | $ | $ | |||||||||||||||
| 2019 charges (credits) for 2018 and prior initiatives |
( |
) | ||||||||||||||||||
| 2019 charges for 2019 initiatives |
||||||||||||||||||||
| 2019 payments for 2018 and prior initiatives |
( |
) | ( |
) | ( |
) | ( |
) | ||||||||||||
| 2019 payments for 2019 initiatives |
( |
) | ( |
) | ||||||||||||||||
| Reversal of reserves no longer required |
( |
) | ( |
) | ( |
) | ||||||||||||||
| Accrued liabilities as of December 31, 2019 |
||||||||||||||||||||
| 2020 charges for 2019 and prior initiatives |
||||||||||||||||||||
| 2020 charges for 2020 initiatives |
||||||||||||||||||||
| 2020 payments for 2019 and prior initiatives |
( |
) | ( |
) | ( |
) | ( |
) | ||||||||||||
| 2020 payments for 2020 initiatives |
( |
) | ( |
) | ( |
) | ||||||||||||||
| Reversal of reserves no longer required |
( |
) | ( |
) | ||||||||||||||||
| Foreign currency effect on liability balance |
||||||||||||||||||||
| Accrued liabilities as of December 31, 2020 |
||||||||||||||||||||
| 2021 charges for 2020 and prior initiatives |
||||||||||||||||||||
| 2021 charges for 2021 initiatives |
||||||||||||||||||||
| 2021 payments for 2020 and prior initiatives |
( |
) | ( |
) | ( |
) | ||||||||||||||
| 2021 payments for 2021 initiatives |
( |
) | ( |
) | ||||||||||||||||
| Accrued liabilities as of December 31, 2021 |
$ | $ | $ | $ | $ | |||||||||||||||
Details with respect to our reserves for restructuring, impairment and plant closing costs by segment and initiative are provided below (dollars in millions):
| Performance |
Advanced |
Textile |
Corporate |
|||||||||||||||||||||
| Polyurethanes |
Products |
Materials |
Effects |
and other |
Total |
|||||||||||||||||||
| Accrued liabilities as of January 1, 2019 |
$ | $ | $ | $ | $ | $ | ||||||||||||||||||
| 2019 charges for 2018 and prior initiatives |
||||||||||||||||||||||||
| 2019 charges for 2019 initiatives |
||||||||||||||||||||||||
| 2019 payments for 2018 and prior initiatives |
( |
) | ( |
) | ( |
) | ( |
) | ( |
) | ||||||||||||||
| 2019 payments for 2019 initiatives |
( |
) | ( |
) | ||||||||||||||||||||
| Reversal of reserves no longer required |
( |
) | ( |
) | ||||||||||||||||||||
| Accrued liabilities as of December 31, 2019 |
||||||||||||||||||||||||
| 2020 charges (credits) for 2019 and prior initiatives |
( |
) | ||||||||||||||||||||||
| 2020 charges for 2020 initiatives |
||||||||||||||||||||||||
| 2020 payments for 2019 and prior initiatives |
( |
) | ( |
) | ( |
) | ( |
) | ( |
) | ||||||||||||||
| 2020 payments for 2020 initiatives |
( |
) | ( |
) | ( |
) | ( |
) | ( |
) | ( |
) | ||||||||||||
| Reversal of reserves no longer required |
( |
) | ( |
) | ||||||||||||||||||||
| Foreign currency effect on liability balance |
||||||||||||||||||||||||
| Accrued liabilities as of December 31, 2020 |
||||||||||||||||||||||||
| 2021 charges (credits) for 2020 and prior initiatives |
( |
) | ( |
) | ||||||||||||||||||||
| 2021 charges for 2021 initiatives |
||||||||||||||||||||||||
| 2021 payments for 2020 and prior initiatives |
( |
) | ( |
) | ( |
) | ( |
) | ( |
) | ( |
) | ||||||||||||
| 2021 payments for 2021 initiatives |
( |
) | ( |
) | ||||||||||||||||||||
| Accrued liabilities as of December 31, 2021 |
$ | $ | $ | $ | $ | $ | ||||||||||||||||||
| Current portion of restructuring reserves |
$ | $ | $ | $ | $ | $ | ||||||||||||||||||
| Long-term portion of restructuring reserves |
||||||||||||||||||||||||
Details with respect to cash and noncash restructuring charges from continuing operations by initiative for the years ended December 31, 2021, 2020 and 2019 are provided below (dollars in millions):
| Cash charges: |
||||
| 2021 charges for 2020 and prior initiatives |
$ | |||
| 2021 charges for 2021 initiatives |
||||
| Noncash charges: |
||||
| Accelerated depreciation |
||||
| Gain on sale of assets |
( |
) | ||
| Other noncash (credits) charges |
||||
| Total 2021 restructuring, impairment and plant closing costs |
$ | |||
| Cash charges: |
||||
| 2020 charges for 2019 and prior initiatives |
$ | |||
| 2020 charges for 2020 initiatives |
||||
| Reversal of reserves no longer required |
( |
) | ||
| Noncash charges: |
||||
| Accelerated depreciation |
||||
| Total 2020 restructuring, impairment and plant closing costs |
$ | |||
| Cash charges: |
||||
| 2019 charges for 2018 and prior initiatives |
$ | |||
| 2019 charges for 2019 initiatives |
||||
| Reversal of reserves no longer required |
( |
) | ||
| Noncash charges: |
||||
| Gain on sale of assets |
( |
) | ||
| Other noncash credits |
( |
) | ||
| Total 2019 restructuring, impairment and plant closing costs |
$ | ( |
) |
Beginning in the third quarter of 2020, our Polyurethanes segment implemented a restructuring program to optimize its downstream footprint. In connection with this restructuring program, we recorded restructuring expense of approximately $
Beginning in the second quarter of 2020, our Advanced Materials segment implemented restructuring programs in connection with the CVC Thermoset Specialties Acquisition, the alignment of the segment’s commercial organization and optimization of the segment’s manufacturing processes. In connection with these restructuring programs, we recorded restructuring expense of approximately $
2020 Restructuring Activities
Beginning in the second quarter of 2020, our Polyurethanes segment implemented a restructuring program to reorganize its spray polyurethane foam business to better position this business for efficiencies and growth in coming years. In connection with this restructuring program, we recorded restructuring expense of approximately $
Beginning in the third quarter of 2020, our Polyurethanes segment implemented a restructuring program to optimize its downstream footprint. In connection with this restructuring program, we recorded restructuring expense of approximately $
Beginning in the second quarter of 2020, our Performance Products segment implemented a restructuring program, primarily related to workforce reductions, in response to the sale of our Chemical Intermediates Businesses to Indorama. In connection with this restructuring program, we recorded restructuring expense of approximately $
Beginning in the second quarter of 2020, our Advanced Materials segment implemented restructuring programs, primarily related to workforce reductions and accelerated depreciation in connection with the CVC Thermoset Specialties Acquisition, the alignment of the segment’s commercial organization and optimization of the segment’s manufacturing processes. In connection with these restructuring programs, we recorded restructuring expense of approximately $
During 2020, our Textile Effects segment implemented restructuring programs to rationalize and realign structurally across various functions and certain locations within the segment. In connection with these restructuring programs, we recorded restructuring expense of approximately $
2019 Restructuring Activities
In September 2011, we initiated a restructuring program in our Textile Effects segment to close its production facilities and business support offices in Basel, Switzerland. In July 2019, we sold the production and business support offices in Basel. Accordingly, during the third quarter of 2019, we received proceeds of $
13. OTHER NONCURRENT LIABILITIES
Other noncurrent liabilities consisted of the following (dollars in millions):
Huntsman Corporation
| December 31, |
||||||||
| 2021 |
2020 |
|||||||
| Pension liabilities |
$ | $ | ||||||
| Other postretirement benefits |
||||||||
| Employee benefit accrual |
||||||||
| Other |
||||||||
| Total |
$ | $ | ||||||
Huntsman International
| December 31, |
||||||||
| 2021 |
2020 |
|||||||
| Pension liabilities |
$ | $ | ||||||
| Other postretirement benefits |
||||||||
| Employee benefit accrual |
||||||||
| Other |
||||||||
| Total |
$ | $ | ||||||
14. DEBT
Outstanding debt, net of debt issuance costs, of consolidated entities consisted of the following (dollars in millions):
| December 31, |
December 31, |
|||||||
| 2021 |
2020 |
|||||||
| Senior Credit Facilities: |
||||||||
| Revolving facility |
$ | $ | ||||||
| Amounts outstanding under A/R programs |
||||||||
| Senior notes |
||||||||
| Variable interest entities |
||||||||
| Other |
||||||||
| Total debt |
$ | $ | ||||||
| Total current portion of debt |
$ | $ | ||||||
| Long-term portion of debt |
||||||||
| Total debt |
$ | $ | ||||||
Direct and Subsidiary Debt
Substantially all of our debt, including the facilities described below, has been incurred by our subsidiaries (primarily Huntsman International); Huntsman Corporation is not a guarantor of such subsidiary debt.
Certain of our subsidiaries have third-party debt agreements. These debt agreements contain certain restrictions with regard to dividends, distributions, loans or advances. In certain circumstances, the consent of a third party would be required prior to the transfer of any cash or assets from these subsidiaries to us.
Debt Issuance Costs
We record debt issuance costs related to a debt liability on the balance sheets as a reduction in the face amount of that debt liability. As of December 31, 2021 and 2020, the amount of debt issuance costs directly reducing the debt liability was $
Revolving Credit Facility
On May 21, 2018, Huntsman International entered into the Revolving Credit Facility. Borrowings under the Revolving Credit Facility will bear interest at the rates specified in the credit agreement governing the Revolving Credit Facility, which will vary based on the type of loan and Huntsman International’s debt ratings. Unless earlier terminated, the Revolving Credit Facility will mature in May 2023. Huntsman International may increase the Revolving Credit Facility commitments up to an additional $
As of December 31, 2021, our Revolving Credit Facility was as follows (dollars in millions):
| Unamortized |
|||||||||||||||||||||
| Discounts and |
|||||||||||||||||||||
| Committed |
Principal |
Debt Issuance |
Carrying |
||||||||||||||||||
| Facility |
Amount |
Outstanding |
Costs |
Value |
Interest Rate(2) |
Maturity |
|||||||||||||||
| Revolving Credit Facility |
$ | $ | (1) |
$ | (1) |
$ | (1) |
|
|||||||||||||
| (1) | On December 31, 2021, we had an additional $ |
| (2) |
Interest rates on borrowings under the Revolving Credit Facility vary based on the type of loan and Huntsman International’s debt ratings. The representative interest rate as of December 31, 2021 was |
Term Loan Credit Facility
On September 24, 2019, Huntsman International entered into the 2019 Term Loan, pursuant to which Huntsman International borrowed an aggregate principal amount of million (or $
A/R Programs
Our A/R Programs are structured so that we transfer certain of our trade receivables to the U.S. special purpose entity (“U.S. SPE”) and the European special purpose entity (“EU SPE”) in transactions intended to be true sales or true contributions. The receivables collateralize debt incurred by the U.S. SPE and the EU SPE.
On July 1, 2021, we entered into amendments to our A/R Programs that, among other things, extended the respective scheduled termination dates of our A/R Programs from April 2022 to July 2024.
Information regarding our A/R Programs as of December 31, 2021 was as follows (monetary amounts in millions):
| Maximum Funding |
Amount |
||||||||||
| Facility |
Maturity |
Availability(1) |
Outstanding |
Interest Rate(2) |
|||||||
| U.S. A/R Program |
|
$ | $ | (3) |
|
||||||
| EU A/R Program |
|
€ | € |
|
|||||||
|
|
|
||||||||||
| (1) |
The amount of actual availability under our A/R Programs may be lower based on the level of eligible receivables sold, changes in the credit ratings of our customers, customer concentration levels and certain characteristics of the accounts receivable being transferred, as defined in the applicable agreements. |
| (2) |
The applicable rate for our U.S. A/R Program is defined by the lender as USD LIBOR. The applicable rate for our EU A/R Program is either USD LIBOR, EURIBOR or SONIA (Sterling Overnight Interbank Average Rate). In anticipation of the transition away from USD LIBOR, the amendments we made in July 2021 to our A/R Programs incorporated replacement rates for the USD LIBOR. |
| (3) |
As of December 31, 2021, we had approximately $ |
As of December 31, 2021 and December 31, 2020, $
Senior Notes
As of December 31, 2021, we had outstanding the following notes (monetary amounts in millions):
| Unamortized | ||||||||||||
| Premiums, | ||||||||||||
| Discounts | ||||||||||||
| and Debt | ||||||||||||
| Notes | Maturity | Interest Rate | Amount Outstanding | Issuance Costs | ||||||||
| 2025 Senior Notes | April 2025 | % |
| $ | ||||||||
| 2029 Senior Notes | February 2029 | % |
| |||||||||
| 2031 Senior Notes | June 2031 | % |
| |||||||||
The 2025, 2029 and 2031 Senior Notes are general unsecured senior obligations of Huntsman International. The indentures impose certain limitations on the ability of Huntsman International and its subsidiaries to, among other things, incur additional indebtedness secured by any principal properties, incur indebtedness of subsidiaries, enter into sale and leaseback transactions with respect to any principal properties and consolidate or merge with or into any other person or lease, sell or transfer all or substantially all of its properties and assets. Upon the occurrence of certain change of control events, holders of the 2025, 2029 and 2031 Senior Notes will have the right to require that Huntsman International purchase all or a portion of such holder’s notes in cash at a purchase price equal to
On March 13, 2019, Huntsman International completed a $
The 2029 Senior Notes bear interest at
On January 15, 2021, we redeemed in full million (approximately $
On May 26, 2021, Huntsman International completed a $
The 2031 Senior Notes bear interest at
Variable Interest Entity Debt
As of December 31, 2021, AAC, our consolidated
Note Payable from Huntsman International to Huntsman Corporation
During the first quarter of 2020, our loan of $
Compliance With Covenants
Our Revolving Credit Facility contains a financial covenant regarding the leverage ratio of Huntsman International and its subsidiaries. The Revolving Credit Facility also contains other customary covenants and events of default for credit facilities of this type. Upon an event of default that is not cured or waived within any applicable cure periods, in addition to other remedies that may be available to the lenders, the obligations under the Revolving Credit Facility may be accelerated.
The agreements governing our A/R Programs also contain certain receivable performance metrics. Any material failure to meet the applicable A/R Programs’ metrics could lead to an early termination event under the A/R Programs, which could require us to cease our use of such facilities, prohibiting us from additional borrowings against our receivables or, at the discretion of the lenders, requiring that we repay the A/R Programs in full. An early termination event under the A/R Programs would also constitute an event of default under our Revolving Credit Facility, which could require us to pay off the balance of the Revolving Credit Facility in full and could result in the loss of our Revolving Credit Facility.
We believe that we are in compliance with the covenants governing our material debt instruments, including our Revolving Credit Facility, our A/R Programs and our notes.
Maturities
The scheduled maturities of our debt (excluding debt to affiliates) by year as of December 31, 2021 are as follows (dollars in millions):
| Year ending December 31, |
||||
| 2022 |
$ | |||
| 2023 |
||||
| 2024 |
||||
| 2025 |
||||
| 2026 |
||||
| Thereafter |
||||
| $ |
15. DERIVATIVE INSTRUMENTS AND HEDGING ACTIVITIES
We are exposed to market risks, such as changes in interest rates, foreign exchange rates and commodity prices. From time to time, we enter into transactions, including transactions involving derivative instruments, to manage certain of these exposures. We also hedge our net investment in certain European operations. Changes in the fair value of the hedge in the net investment of certain European operations are recorded in other accumulated comprehensive income (loss).
Interest Rate Risks
Through our borrowing activities, we are exposed to interest rate risk. Such risk arises due to the structure of our debt portfolio, including the mix of fixed and floating interest rates. Actions taken to reduce interest rate risk include managing the mix and rate characteristics of various interest-bearing liabilities, as well as entering into interest rate derivative instruments.
From time to time, we may purchase interest rate swaps and/or other derivative instruments to reduce the impact of changes in interest rates on our floating-rate exposures. Under interest rate swaps, we agree with other parties to exchange, at specified intervals, the difference between fixed-rate and floating-rate interest amounts calculated by reference to an agreed notional principal amount. On January 9, 2019, we entered into a six-year $
During 2021, there were no other reclassifications from accumulated other comprehensive loss to earnings. The actual amount that will be reclassified to earnings over the next twelve months may vary from this amount due to changing market conditions. We would be exposed to credit losses in the event of nonperformance by a counterparty to our derivative financial instruments. We anticipate, however, that the counterparties will be able to fully satisfy their obligations under the contracts. Market risk arises from changes in interest rates.
Foreign Exchange Rate Risk
Our cash flows and earnings are subject to fluctuations due to exchange rate variation. Our revenues and expenses are denominated in various currencies. We enter into foreign currency derivative instruments to minimize the short-term impact of movements in foreign currency rates. Where practicable, we generally net multicurrency cash balances among our subsidiaries to help reduce exposure to foreign currency exchange rates. Certain other exposures may be managed from time to time through financial market transactions, principally through the purchase of spot or forward foreign exchange contracts (generally with maturities of months or less). We do not hedge our currency exposures in a manner that would eliminate the effect of changes in exchange rates on our cash flows and earnings. As of December 31, 2021 and 2020, we had approximately $
A portion of our debt is denominated in euros. We also finance certain of our non-U.S. subsidiaries with intercompany loans that are, in many cases, denominated in currencies other than the entities’ functional currency. We manage the net foreign currency exposure created by this debt through various means, including cross-currency swaps, the designation of certain intercompany loans as permanent loans because they are not expected to be repaid in the foreseeable future and the designation of certain debt and swaps as net investment hedges.
Foreign currency transaction gains and losses on intercompany loans that are not designated as permanent loans are recorded in earnings. Foreign currency transaction gains and losses on intercompany loans that are designated as permanent loans are recorded in other comprehensive income (loss). From time to time, we review such designation of intercompany loans.
We review our non-U.S. dollar denominated debt and derivative instruments to determine the appropriate amounts designated as hedges. As of December 31, 2021, we have designated approximately million (approximately $
Commodity Prices Risk
Inherent in our business is exposure to price changes for several commodities. However, our exposure to changing commodity prices is somewhat limited since the majority of our raw materials are acquired at posted or market related prices, and sales prices for many of our finished products are at market related prices which are largely set on a monthly or quarterly basis in line with industry practice. Consequently, we do not generally hedge our commodity exposures.
16. FAIR VALUE
The fair values of our financial instruments were as follows (dollars in millions):
| December 31, 2021 | December 31, 2020 | |||||||||||||||
| Carrying | Estimated | Carrying | Estimated | |||||||||||||
| Value | Fair Value | Value | Fair Value | |||||||||||||
| Non-qualified employee benefit plan investments | $ | $ | $ | $ | ||||||||||||
| Investment in Venator | ||||||||||||||||
| Option agreement for remaining Venator shares | ( | ) | ( | ) | ||||||||||||
| Long-term debt (including current portion) | ( | ) | ( | ) | ( | ) | ( | ) | ||||||||
The carrying amounts reported in the balance sheets of cash and cash equivalents, accounts receivable and accounts payable approximate fair value because of the immediate or short-term maturity of these financial instruments. Our investment in Venator is marked to fair value, which is obtained through market observable pricing using prevailing market prices (Level 1). Additionally, the estimated fair value of the option agreement related to the remaining ordinary shares we hold in Venator is based on a valuation technique using market observable inputs (Level 2). See “Note 4. Discontinued Operations and Business Dispositions—Separation and Deconsolidation of Venator.” The fair values of non-qualified employee benefit plan investments are obtained through market observable pricing using prevailing market prices (Level 1). The estimated fair values of our long-term debt are based on quoted market prices for the identical liability when traded in an active market (Level 1). The fair value estimates presented herein are based on pertinent information available to management as of December 31, 2021 and 2020. Although management is not aware of any factors that would significantly affect the estimated fair value amounts, such amounts have not been comprehensively revalued for purposes of these financial statements since December 31, 2021, and current estimates of fair value may differ significantly from the amounts presented herein.
During the years ended December 31, 2021 and 2020, there were
17. REVENUE RECOGNITION
The following tables disaggregate our revenue from continuing operations by major source for the years ended December 31, 2021, 2020 and 2019 (dollars in millions):
| 2021 |
Polyurethanes |
Performance Products |
Advanced Materials |
Textile Effects |
Corporate and Eliminations |
Total |
||||||||||||||||||
| Primary Geographic Markets(1) |
||||||||||||||||||||||||
| U.S. and Canada |
$ | $ | $ | $ | $ | ( |
) | $ | ||||||||||||||||
| Europe |
( |
) | ||||||||||||||||||||||
| Asia Pacific |
||||||||||||||||||||||||
| Rest of world |
||||||||||||||||||||||||
| $ | $ | $ | $ | $ | ( |
) | $ | |||||||||||||||||
| Major Product Groupings |
||||||||||||||||||||||||
| MDI urethanes |
$ | $ | ||||||||||||||||||||||
| Differentiated |
$ | |||||||||||||||||||||||
| Specialty |
$ | |||||||||||||||||||||||
| Non-specialty |
||||||||||||||||||||||||
| Textile chemicals and dyes |
$ | |||||||||||||||||||||||
| Eliminations |
$ | ( |
) | ( |
) | |||||||||||||||||||
| $ | $ | $ | $ | $ | ( |
) | $ | |||||||||||||||||
| 2020 |
Polyurethanes |
Performance Products |
Advanced Materials |
Textile Effects |
Corporate and Eliminations |
Total |
||||||||||||||||||
| Primary Geographic Markets(1) |
||||||||||||||||||||||||
| U.S. and Canada |
$ | $ | $ | $ | $ | ( |
) | $ | ||||||||||||||||
| Europe |
( |
) | ||||||||||||||||||||||
| Asia Pacific |
||||||||||||||||||||||||
| Rest of world |
( |
) | ||||||||||||||||||||||
| $ | $ | $ | $ | $ | ( |
) | $ | |||||||||||||||||
| Major Product Groupings |
||||||||||||||||||||||||
| MDI urethanes |
$ | $ | ||||||||||||||||||||||
| Differentiated |
$ | |||||||||||||||||||||||
| Specialty |
$ | |||||||||||||||||||||||
| Non-specialty |
||||||||||||||||||||||||
| Textile chemicals and dyes |
$ | |||||||||||||||||||||||
| Eliminations |
$ | ( |
) | ( |
) | |||||||||||||||||||
| $ | $ | $ | $ | $ | ( |
) | $ | |||||||||||||||||
| 2019 |
Polyurethanes |
Performance Products |
Advanced Materials |
Textile Effects |
Corporate and Eliminations | Total |
||||||||||||||||||
| Primary Geographic Markets(1) |
||||||||||||||||||||||||
| U.S. and Canada |
$ | $ | $ | $ | $ | ( |
) | $ | ||||||||||||||||
| Europe |
( |
) | ||||||||||||||||||||||
| Asia Pacific |
( |
) | ||||||||||||||||||||||
| Rest of world |
( |
) | ||||||||||||||||||||||
| $ | $ | $ | $ | $ | ( |
) | $ | |||||||||||||||||
| Major Product Groupings |
||||||||||||||||||||||||
| MDI urethanes |
$ | $ | ||||||||||||||||||||||
| Differentiated |
$ | |||||||||||||||||||||||
| Specialty |
$ | |||||||||||||||||||||||
| Non-specialty |
||||||||||||||||||||||||
| Textile chemicals and dyes |
$ | |||||||||||||||||||||||
| Eliminations |
$ | ( |
) | ( |
) | |||||||||||||||||||
| $ | $ | $ | $ | $ | ( |
) | $ | |||||||||||||||||
| (1) |
Geographic information for revenues is based upon countries into which product is sold. |
18. EMPLOYEE BENEFIT PLANS
Defined Benefit and Other Postretirement Benefit
We provide a trusteed, non-contributory defined benefit pension plan (the “Plan”) that covers the majority of our U.S. employees. Effective July 1, 2004, the Plan formula for employees not covered by a collective bargaining agreement was converted to a cash balance design. For represented employees, participation in the cash balance design was subject to the terms of negotiated contracts. For participating employees, benefits accrued under the prior formula were converted to opening cash balance accounts. The cash balance benefit formula provides annual pay credits from
Beginning July 1, 2014, the Huntsman Defined Benefit Pension Plan was closed to new non-union entrants and as of April 1, 2015, it was closed to new union entrants. In addition, as of January 1, 2015, Rubicon closed its defined benefit plan to new entrants. Following the closure of these plans, new hires have been provided with a defined contribution plan with a non-discretionary employer contribution of
Our postretirement benefit plans provide access to fully insured Medicare Part D plans including prescription drug benefits affected by the Medicare Prescription Drug, Improvement and Modernization Act of 2003 (the “Act”). We cannot determine whether the medical benefits provided by our postretirement benefit plans are actuarially equivalent to those provided by the Act. We do not collect a subsidy and our net periodic postretirement benefits cost, and related benefit obligation, do not reflect an amount associated with the subsidy. We do not subsidize the premium cost of these plans; the premiums are entirely paid by the retirees.
We sponsor defined benefit plans in a number of countries outside of the U.S. The availability of these plans, and their specific design provisions, are consistent with local competitive practices and regulations.
The following table sets forth the funded status of the plans for us and Huntsman International and the amounts recognized in our consolidated balance sheets at December 31, 2021 and 2020 (dollars in millions):
| Defined Benefit Plans | Other Postretirement Benefit Plans | |||||||||||||||||||||||||||||||
| 2021 | 2020 | 2021 | 2020 | |||||||||||||||||||||||||||||
| U.S. | Non-U.S. | U.S. | Non-U.S. | U.S. | Non-U.S. | U.S. | Non-U.S. | |||||||||||||||||||||||||
| Plans | Plans | Plans | Plans | Plans | Plans | Plans | Plans | |||||||||||||||||||||||||
| Change in benefit obligation | ||||||||||||||||||||||||||||||||
| Benefit obligation at beginning of year | $ | $ | $ | $ | $ | $ | $ | $ | ||||||||||||||||||||||||
| Service cost | ||||||||||||||||||||||||||||||||
| Interest cost | ||||||||||||||||||||||||||||||||
| Participant contributions | ||||||||||||||||||||||||||||||||
| Plan amendments | ||||||||||||||||||||||||||||||||
| Foreign currency exchange rate changes | ( | ) | ||||||||||||||||||||||||||||||
| Settlements/curtailments/divestitures | ( | ) | ( | ) | ( | ) | ||||||||||||||||||||||||||
| Actuarial (gain) loss | ( | ) | ( | ) | ( | ) | ||||||||||||||||||||||||||
| Benefits paid | ( | ) | ( | ) | ( | ) | ( | ) | ( | ) | ( | ) | ||||||||||||||||||||
| Benefit obligation at end of year | $ | $ | $ | $ | $ | $ | $ | $ | ||||||||||||||||||||||||
| Change in plan assets | ||||||||||||||||||||||||||||||||
| Fair value of plan assets at beginning of year | $ | $ | $ | $ | $ | $ | $ | $ | ||||||||||||||||||||||||
| Actual return on plan assets | ||||||||||||||||||||||||||||||||
| Foreign currency exchange rate changes | ( | ) | ||||||||||||||||||||||||||||||
| Participant contributions | ||||||||||||||||||||||||||||||||
| Settlement/transfers/divestitures | ( | ) | ( | ) | ( | ) | ||||||||||||||||||||||||||
| Company contributions | ||||||||||||||||||||||||||||||||
| Benefits paid | ( | ) | ( | ) | ( | ) | ( | ) | ( | ) | ( | ) | ||||||||||||||||||||
| Fair value of plan assets at end of year | $ | $ | $ | $ | $ | $ | $ | $ | ||||||||||||||||||||||||
| Funded status | ||||||||||||||||||||||||||||||||
| Fair value of plan assets | $ | $ | $ | $ | $ | $ | $ | $ | ||||||||||||||||||||||||
| Benefit obligation | ||||||||||||||||||||||||||||||||
| Accrued benefit cost | $ | ( | ) | $ | ( | ) | $ | ( | ) | $ | ( | ) | $ | ( | ) | $ | $ | ( | ) | $ | ||||||||||||
| Amounts recognized in balance sheet: | ||||||||||||||||||||||||||||||||
| Noncurrent asset | $ | $ | $ | $ | $ | $ | $ | $ | ||||||||||||||||||||||||
| Current liability | ( | ) | ( | ) | ( | ) | ( | ) | ( | ) | ( | ) | ||||||||||||||||||||
| Noncurrent liability | ( | ) | ( | ) | ( | ) | ( | ) | ( | ) | ( | ) | ||||||||||||||||||||
| Total | $ | ( | ) | $ | ( | ) | $ | ( | ) | $ | ( | ) | $ | ( | ) | $ | $ | ( | ) | $ | ||||||||||||
Huntsman Corporation
| Defined Benefit Plans | Other Postretirement Benefit Plans | |||||||||||||||||||||||||||||||
| 2021 | 2020 | 2021 | 2020 | |||||||||||||||||||||||||||||
| U.S. | Non-U.S. | U.S. | Non-U.S. | U.S. | Non-U.S. | U.S. | Non-U.S. | |||||||||||||||||||||||||
| Plans | Plans | Plans | Plans | Plans | Plans | Plans | Plans | |||||||||||||||||||||||||
| Amounts recognized in accumulated other comprehensive loss: | ||||||||||||||||||||||||||||||||
| Net actuarial loss | $ | $ | $ | $ | $ | $ | $ | $ | ||||||||||||||||||||||||
| Prior service credit | ( | ) | ( | ) | ( | ) | ( | ) | ( | ) | ( | ) | ||||||||||||||||||||
| Total | $ | $ | $ | $ | $ | $ | $ | $ | ||||||||||||||||||||||||
Huntsman International
| Defined Benefit Plans | Other Postretirement Benefit Plans | |||||||||||||||||||||||||||||||
| 2021 | 2020 | 2021 | 2020 | |||||||||||||||||||||||||||||
| U.S. | Non-U.S. | U.S. | Non-U.S. | U.S. | Non-U.S. | U.S. | Non-U.S. | |||||||||||||||||||||||||
| Plans | Plans | Plans | Plans | Plans | Plans | Plans | Plans | |||||||||||||||||||||||||
| Amounts recognized in accumulated other comprehensive loss: | ||||||||||||||||||||||||||||||||
| Net actuarial loss | $ | $ | $ | $ | $ | $ | $ | $ | ||||||||||||||||||||||||
| Prior service credit | ( | ) | ( | ) | ( | ) | ( | ) | ( | ) | ( | ) | ||||||||||||||||||||
| Total | $ | $ | $ | $ | $ | $ | $ | $ | ||||||||||||||||||||||||
During 2021, the overall decreases in our U.S. pension and other postretirement benefit plan obligations were primarily due to increases in discount rates. The overall decrease in our non-U.S. pension plan obligation was primarily due to the increases in discount rates in most countries with significant impacts from Switzerland, the U.K. and other European countries, as well as strong investment returns compared to expectations, primarily from Belgium, Switzerland and the U.K., offset with asset losses in The Netherlands due to exchange rate movements.
During 2020, the overall increases in our U.S. pension and other postretirement benefit plan obligations were primarily due to decreases in discount rates. The overall increase in our non-U.S. pension plan obligation was primarily due to decreases in discount rates in Switzerland, Germany, The Netherlands and the U.K., as well as foreign currency exchange rate changes in Switzerland, The Netherlands, Germany and Belgium.
Components of net periodic benefit costs of continuing operations for the years ended December 31, 2021, 2020 and 2019 were as follows (dollars in millions):
Huntsman Corporation
| Defined Benefit Plans | ||||||||||||||||||||||||
| U.S. plans | Non-U.S. plans | |||||||||||||||||||||||
| 2021 | 2020 | 2019 | 2021 | 2020 | 2019 | |||||||||||||||||||
| Service cost | $ | $ | $ | $ | $ | $ | ||||||||||||||||||
| Interest cost(a) | ||||||||||||||||||||||||
| Expected return on plan assets(a) | ( | ) | ( | ) | ( | ) | ( | ) | ( | ) | ( | ) | ||||||||||||
| Amortization of prior service credit(a) | ( | ) | ( | ) | ( | ) | ( | ) | ( | ) | ( | ) | ||||||||||||
| Amortization of actuarial loss(a) | ||||||||||||||||||||||||
| Settlement loss(a) | ||||||||||||||||||||||||
| Net periodic benefit cost (credit) | $ | $ | $ | $ | $ | ( | ) | $ | ||||||||||||||||
| Other Postretirement Benefit Plans | ||||||||||||||||||||||||
| U.S. plans | Non-U.S. plans | |||||||||||||||||||||||
| 2021 | 2020 | 2019 | 2021 | 2020 | 2019 | |||||||||||||||||||
| Service cost | $ | $ | $ | $ | $ | $ | ||||||||||||||||||
| Interest cost(a) | ||||||||||||||||||||||||
| Amortization of prior service credit(a) | ( | ) | ( | ) | ( | ) | ||||||||||||||||||
| Amortization of actuarial loss(a) | ||||||||||||||||||||||||
| Net periodic benefit cost (credit) | $ | $ | ( | ) | $ | $ | $ | $ | ||||||||||||||||
Huntsman International
| Defined Benefit Plans | ||||||||||||||||||||||||
| U.S. plans | Non-U.S. plans | |||||||||||||||||||||||
| 2021 | 2020 | 2019 | 2021 | 2020 | 2019 | |||||||||||||||||||
| Service cost | $ | $ | $ | $ | $ | $ | ||||||||||||||||||
| Interest cost(a) | ||||||||||||||||||||||||
| Expected return on plan assets(a) | ( | ) | ( | ) | ( | ) | ( | ) | ( | ) | ( | ) | ||||||||||||
| Amortization of prior service credit(a) | ( | ) | ( | ) | ( | ) | ( | ) | ( | ) | ( | ) | ||||||||||||
| Amortization of actuarial loss(a) | ||||||||||||||||||||||||
| Settlement loss(a) | ||||||||||||||||||||||||
| Net periodic benefit cost (credit) | $ | $ | $ | $ | $ | ( | ) | $ | ||||||||||||||||
| Other Postretirement Benefit Plans | ||||||||||||||||||||||||
| U.S. plans | Non-U.S. plans | |||||||||||||||||||||||
| 2021 | 2020 | 2019 | 2021 | 2020 | 2019 | |||||||||||||||||||
| Service cost | $ | $ | $ | $ | $ | $ | ||||||||||||||||||
| Interest cost(a) | ||||||||||||||||||||||||
| Amortization of prior service credit(a) | ( | ) | ( | ) | ( | ) | ||||||||||||||||||
| Amortization of actuarial loss(a) | ||||||||||||||||||||||||
| Net periodic benefit cost (credit) | $ | $ | ( | ) | $ | $ | $ | $ | ||||||||||||||||
| (a) | Amounts are presented in other income, net. |
The amounts recognized in net periodic benefit cost and other comprehensive income (loss) as of December 31, 2021, 2020 and 2019 were as follows (dollars in millions):
Huntsman Corporation
| Defined Benefit Plans | ||||||||||||||||||||||||
| U.S. plans | Non-U.S. plans | |||||||||||||||||||||||
| 2021 | 2020 | 2019 | 2021 | 2020 | 2019 | |||||||||||||||||||
| Current year actuarial (gain) loss | $ | ( | ) | $ | $ | $ | ( | ) | $ | $ | ||||||||||||||
| Amortization of actuarial loss | ( | ) | ( | ) | ( | ) | ( | ) | ( | ) | ( | ) | ||||||||||||
| Current year prior service cost (credit) | ( | ) | ||||||||||||||||||||||
| Amortization of prior service credit | ||||||||||||||||||||||||
| Settlements | ( | ) | ( | ) | ||||||||||||||||||||
| Total recognized in other comprehensive income (loss) | ( | ) | ( | ) | ( | ) | ( | ) | ||||||||||||||||
| Amounts related to discontinued operations | ||||||||||||||||||||||||
| Total recognized in other comprehensive income (loss) in continuing operations | ( | ) | ( | ) | ( | ) | ||||||||||||||||||
| Net periodic benefit cost (credit) | ( | ) | ||||||||||||||||||||||
| Total recognized in net periodic benefit cost and other comprehensive income (loss) | $ | ( | ) | $ | $ | $ | ( | ) | $ | $ | ||||||||||||||
| Other Postretirement Benefit Plans | ||||||||||||||||||||||||
| U.S. plans | Non-U.S. plans | |||||||||||||||||||||||
| 2021 | 2020 | 2019 | 2021 | 2020 | 2019 | |||||||||||||||||||
| Current year actuarial (gain) loss | $ | ( | ) | $ | $ | $ | $ | $ | ||||||||||||||||
| Amortization of actuarial loss | ( | ) | ( | ) | ( | ) | ||||||||||||||||||
| Current year prior service credit | ||||||||||||||||||||||||
| Amortization of prior service credit | ||||||||||||||||||||||||
| Settlements | ( | ) | ||||||||||||||||||||||
| Curtailment loss | ||||||||||||||||||||||||
| Total recognized in other comprehensive income (loss) | ||||||||||||||||||||||||
| Amounts related to discontinued operations | ( | ) | ||||||||||||||||||||||
| Total recognized in other comprehensive income (loss) in continuing operations | ( | ) | ||||||||||||||||||||||
| Net periodic benefit cost (credit) | ( | ) | ||||||||||||||||||||||
| Total recognized in net periodic benefit cost and other comprehensive income (loss) | $ | $ | $ | ( | ) | $ | $ | $ | ||||||||||||||||
Huntsman International
| Defined Benefit Plans | ||||||||||||||||||||||||
| U.S. plans | Non-U.S. plans | |||||||||||||||||||||||
| 2021 | 2020 | 2019 | 2021 | 2020 | 2019 | |||||||||||||||||||
| Current year actuarial (gain) loss | $ | ( | ) | $ | $ | $ | ( | ) | $ | $ | ||||||||||||||
| Amortization of actuarial loss | ( | ) | ( | ) | ( | ) | ( | ) | ( | ) | ( | ) | ||||||||||||
| Current year prior service cost (credit) | ( | ) | ||||||||||||||||||||||
| Amortization of prior service credit | ||||||||||||||||||||||||
| Settlements | ( | ) | ( | ) | ||||||||||||||||||||
| Total recognized in other comprehensive income (loss) | ( | ) | ( | ) | ( | ) | ( | ) | ||||||||||||||||
| Amounts related to discontinued operations | ||||||||||||||||||||||||
| Total recognized in other comprehensive income (loss) in continuing operations | ( | ) | ( | ) | ( | ) | ||||||||||||||||||
| Net periodic benefit cost (credit) | ( | ) | ||||||||||||||||||||||
| Total recognized in net periodic benefit cost and other comprehensive income (loss) | $ | ( | ) | $ | $ | $ | ( | ) | $ | $ | ||||||||||||||
| Other Postretirement Benefit Plans | ||||||||||||||||||||||||
| U.S. plans | Non-U.S. plans | |||||||||||||||||||||||
| 2021 | 2020 | 2019 | 2021 | 2020 | 2019 | |||||||||||||||||||
| Current year actuarial (gain) loss | $ | ( | ) | $ | $ | $ | $ | $ | ||||||||||||||||
| Amortization of actuarial loss | ( | ) | ( | ) | ( | ) | ||||||||||||||||||
| Current year prior service credit | ||||||||||||||||||||||||
| Amortization of prior service credit | ||||||||||||||||||||||||
| Settlements | ( | ) | ||||||||||||||||||||||
| Curtailment loss | ||||||||||||||||||||||||
| Total recognized in other comprehensive income (loss) | ||||||||||||||||||||||||
| Amounts related to discontinued operations | ( | ) | ||||||||||||||||||||||
| Total recognized in other comprehensive income (loss) in continuing operations | ( | ) | ||||||||||||||||||||||
| Net periodic benefit cost (credit) | ( | ) | ||||||||||||||||||||||
| Total recognized in net periodic benefit cost and other comprehensive income (loss) | $ | $ | $ | ( | ) | $ | $ | $ | ||||||||||||||||
The following weighted-average assumptions were used to determine the projected benefit obligation at the measurement date and the net periodic pension cost for the year:
| Defined Benefit Plans | ||||||||||||||||||||||||
| U.S. plans | Non-U.S. plans | |||||||||||||||||||||||
| 2021 | 2020 | 2019 | 2021 | 2020 | 2019 | |||||||||||||||||||
| Projected benefit obligation | ||||||||||||||||||||||||
| Discount rate | % | % | % | % | % | % | ||||||||||||||||||
| Rate of compensation increase | % | % | % | % | % | % | ||||||||||||||||||
| Interest credit rate | % | % | % | % | % | % | ||||||||||||||||||
| Net periodic pension cost | ||||||||||||||||||||||||
| Discount rate | % | % | % | % | % | % | ||||||||||||||||||
| Rate of compensation increase | % | % | % | % | % | % | ||||||||||||||||||
| Expected return on plan assets | % | % | % | % | % | % | ||||||||||||||||||
| Interest credit rate | % | % | % | % | % | % | ||||||||||||||||||
| Other Postretirement Benefit Plans | ||||||||||||||||||||||||
| U.S. plans | Non-U.S. plans | |||||||||||||||||||||||
| 2021 | 2020 | 2019 | 2021 | 2020 | 2019 | |||||||||||||||||||
| Projected benefit obligation | ||||||||||||||||||||||||
| Discount rate | % | % | % | % | % | % | ||||||||||||||||||
| Net periodic pension cost | ||||||||||||||||||||||||
| Discount rate | % | % | % | % | % | % | ||||||||||||||||||
At December 31, 2021 and 2020, the health care trend rate used to measure the expected increase of the cost of benefits was assumed to be
The projected benefit obligation and fair value of plan assets for the defined benefit plans with projected benefit obligations in excess of plan assets as of December 31, 2021 and 2020 were as follows (dollars in millions):
| U.S. plans | Non-U.S. plans | |||||||||||||||
| 2021 | 2020 | 2021 | 2020 | |||||||||||||
| Projected benefit obligation in excess of plan assets | ||||||||||||||||
| Projected benefit obligation | $ | $ | $ | $ | ||||||||||||
| Fair value of plan assets | ||||||||||||||||
The projected benefit obligation, accumulated benefit obligation and fair value of plan assets for the defined benefit plans with an accumulated benefit obligation in excess of plan assets as of December 31, 2021 and 2020 were as follows (dollars in millions):
| U.S. plans | Non-U.S. plans | |||||||||||||||
| 2021 | 2020 | 2021 | 2020 | |||||||||||||
| Accumulated benefit obligation in excess of plan assets | ||||||||||||||||
| Projected benefit obligation | $ | $ | $ | $ | ||||||||||||
| Accumulated benefit obligation | ||||||||||||||||
| Fair value of plan assets | ||||||||||||||||
The accumulated benefit obligation of our defined pension plans as of December 31, 2021 and 2020 was $
Expected future contributions and benefit payments related to continuing operations are as follows (dollars in millions):
| U.S. Plans | Non-U.S. Plans | ||||||||||||||||
| Other | Other | ||||||||||||||||
| Defined | Postretirement | Defined | Postretirement | ||||||||||||||
| Benefit | Benefit | Benefit | Benefit | ||||||||||||||
| Plans | Plans | Plans | Plans | ||||||||||||||
| 2022 expected employer contributions | |||||||||||||||||
| To plan trusts | $ | $ | $ | $ | |||||||||||||
| Expected benefit payments | |||||||||||||||||
| 2022 | |||||||||||||||||
| 2023 | |||||||||||||||||
| 2024 | |||||||||||||||||
| 2025 | |||||||||||||||||
| 2026 | |||||||||||||||||
| 2027 - 2031 | |||||||||||||||||
Our investment strategy with respect to pension assets is to pursue an investment plan that, over the long term, is expected to protect the funded status of the plan, enhance the real purchasing power of plan assets, and not threaten the plan’s ability to meet currently committed obligations. Additionally, our investment strategy is to achieve returns on plan assets, subject to a prudent level of portfolio risk. Plan assets are invested in a broad range of investments. These investments are diversified in terms of domestic and international equities, both growth and value funds, including small, mid and large capitalization equities; short-term and long-term debt securities; real estate; and cash and cash equivalents. The investments are further diversified within each asset category. The portfolio diversification provides protection against a single investment or asset category having a disproportionate impact on the aggregate performance of the plan assets.
Our pension plan assets are managed by outside investment managers. The investment managers value our plan assets using quoted market prices, other observable inputs or unobservable inputs. For certain assets, the investment managers obtain third-party appraisals at least annually, which use valuation techniques and inputs specific to the applicable property, market, or geographic location. During 2021, there were
We have established target allocations for each asset category. Our pension plan assets are periodically rebalanced based upon our target allocations.
The fair value of plan assets for the pension plans was $
| Fair Value Amounts Using | ||||||||||||||||
| Quoted prices in active | Significant other | Significant | ||||||||||||||
| December 31, | markets for identical | observable inputs | unobservable inputs | |||||||||||||
| Asset category | 2021 | assets (Level 1) | (Level 2) | (Level 3) | ||||||||||||
| U.S. pension plans: | ||||||||||||||||
| Equities | $ | $ | $ | $ | ||||||||||||
| Fixed income | ||||||||||||||||
| Real estate/other | ||||||||||||||||
| Cash | ||||||||||||||||
| Total U.S. pension plan assets | $ | $ | $ | $ | ||||||||||||
| Non-U.S. pension plans: | ||||||||||||||||
| Equities | $ | $ | $ | $ | ||||||||||||
| Fixed income | ||||||||||||||||
| Real estate/other | ||||||||||||||||
| Cash | ||||||||||||||||
| Total Non-U.S. pension plan assets | $ | $ | $ | $ | ||||||||||||
| Fair Value Amounts Using | ||||||||||||||||
| Quoted prices in active | Significant other | Significant | ||||||||||||||
| December 31, | Markets for identical | Observable inputs | Unobservable inputs | |||||||||||||
| Asset category | 2020 | assets (Level 1) | (Level 2) | (Level 3) | ||||||||||||
| U.S. pension plans: | ||||||||||||||||
| Equities | $ | $ | $ | $ | ||||||||||||
| Fixed income | ||||||||||||||||
| Real estate/other | ||||||||||||||||
| Cash | ||||||||||||||||
| Total U.S. pension plan assets | $ | $ | $ | $ | ||||||||||||
| Non-U.S. pension plans: | ||||||||||||||||
| Equities | $ | $ | $ | $ | ||||||||||||
| Fixed income | ||||||||||||||||
| Real estate/other | ||||||||||||||||
| Cash | ||||||||||||||||
| Total Non-U.S. pension plan assets | $ | $ | $ | $ | ||||||||||||
The following table reconciles the beginning and ending balances of plan assets measured at fair value using unobservable inputs (Level 3) (dollars in millions):
| Real Estate/Other | ||||||||
| Year ended December 31, | ||||||||
| 2021 | 2020 | |||||||
| Fair Value Measurements of Plan Assets Using Significant Unobservable Inputs (Level 3) | ||||||||
| Balance at beginning of period | $ | $ | ||||||
| Return on pension plan assets | ||||||||
| Purchases, sales and settlements | ( | ) | ( | ) | ||||
| Transfers into (out of) Level 3 | ||||||||
| Balance at end of period | $ | $ | ||||||
Based upon historical returns, the expectations of our investment committee and outside advisors, the expected long-term rate of return on the pension assets is estimated to be between
| Target | ||||||||||||
| Allocation | Allocation at December 31, | |||||||||||
| Asset category | 2022 | 2021 | 2020 | |||||||||
| U.S. pension plans: | ||||||||||||
| Equities | % | % | % | |||||||||
| Fixed income | % | % | % | |||||||||
| Real estate/other | % | % | % | |||||||||
| Cash | % | % | % | |||||||||
| Total U.S. pension plans | % | % | % | |||||||||
| Non-U.S. pension plans: | ||||||||||||
| Equities | % | % | % | |||||||||
| Fixed income | % | % | % | |||||||||
| Real estate/other | % | % | % | |||||||||
| Cash | % | % | % | |||||||||
| Total non-U.S. pension plans | % | % | % | |||||||||
Equity securities in our pension plans did not include any direct investments in equity securities of our Company or our affiliates at the end of 2021.
Defined Contribution Plans
We have defined contribution plans in a variety of global locations. Our total combined expense for our defined contribution plans for the years ended December 31, 2021, 2020 and 2019 was $
In the U.S., we had a money purchase pension plan that covered substantially all of our domestic employees who were hired prior to January 1, 2004. Employer contributions were made based on a percentage of employees’ earnings (ranging up to
We have a salary deferral plan covering substantially all U.S. employees. Plan participants may elect to make voluntary contributions to this plan up to a specified amount of their compensation. We contribute an amount equal to the participant’s contribution, not to exceed
SUPPLEMENTAL SALARY DEFFERAL PLAN AND SUPPLEMENTAL EXECUTIVE RETIREMENT PLAN
The Huntsman Supplemental Savings Plan (the “SSP”) is a non-qualified plan covering key management employees and allows participants to defer amounts that would otherwise be paid as compensation. The participant can defer up to
The Huntsman Supplemental Executive Retirement Plan (the “SERP”) is an unfunded non-qualified pension plan established to provide certain executive employees with benefits that could not be provided, due to legal limitations, under the Huntsman Defined Benefit Pension Plan, a qualified defined benefit pension plan, and the Huntsman Money Purchase Pension Plan, a qualified money purchase pension plan.
Assets of these plans are included in other noncurrent assets and as of December 31, 2021 and 2020 were $
Stock-Based Incentive Plan
On May 5, 2016, our stockholders approved a new Huntsman Corporation 2016 Stock Incentive Plan (the “2016 Stock Incentive Plan”), which reserved
International Plans
International employees are covered by various post-employment arrangements consistent with local practices and regulations. Such obligations are included in other long-term liabilities in our consolidated balance sheets.
19. INCOME TAXES
The following is a summary of U.S. and non-U.S. provisions for current and deferred income taxes (dollars in millions):
Huntsman Corporation
| Year ended December 31, | ||||||||||||
| 2021 | 2020 | 2019 | ||||||||||
| Income tax expense (benefit): | ||||||||||||
| U.S. | ||||||||||||
| Current | $ | $ | ( | ) | $ | ( | ) | |||||
| Deferred | ( | ) | ( | ) | ||||||||
| Non-U.S. | ||||||||||||
| Current | ||||||||||||
| Deferred | ||||||||||||
| Total | $ | $ | $ | ( | ) | |||||||
Huntsman International
| Year ended December 31, | ||||||||||||
| 2021 | 2020 | 2019 | ||||||||||
| Income tax expense (benefit): | ||||||||||||
| U.S. | ||||||||||||
| Current | $ | $ | ( | ) | $ | ( | ) | |||||
| Deferred | ( | ) | ( | ) | ||||||||
| Non-U.S. | ||||||||||||
| Current | ||||||||||||
| Deferred | ||||||||||||
| Total | $ | $ | $ | ( | ) | |||||||
The following schedule reconciles the differences between the U.S. federal income taxes at the U.S. statutory rate to our provision for income taxes (dollars in millions):
Huntsman Corporation
| Year ended December 31, | ||||||||||||
| 2021 | 2020 | 2019 | ||||||||||
| Income from continuing operations before income taxes | $ | $ | $ | |||||||||
| Expected tax expense at U.S. statutory rate of % | $ | $ | $ | |||||||||
| Change resulting from: | ||||||||||||
| State tax expense, net of federal benefit | ( | ) | ( | ) | ||||||||
| Non-U.S. tax rate differentials | ||||||||||||
| Other non-U.S. tax effects, including nondeductible expenses and other withholding taxes | ||||||||||||
| U.S. Tax Reform Act impact | ( | ) | ||||||||||
| Currency exchange gains/losses, net | ( | ) | ( | ) | ||||||||
| Venator investment basis difference and fair market value adjustments | ( | ) | ( | ) | ||||||||
| Change in valuation allowance on capital loss related to Venator investment | ( | ) | ( | ) | ||||||||
| Non-U.S. income subject to U.S. tax not offset by U.S. foreign tax credits | ( | ) | ||||||||||
| Tax authority audits and dispute resolutions | ( | ) | ||||||||||
| Share-based compensation excess tax benefits | ( | ) | ( | ) | ||||||||
| Change in valuation allowance | ( | ) | ( | ) | ||||||||
| Deferred tax effects of non-U.S. tax rate changes | ( | ) | ( | ) | ||||||||
| Impact of equity method investments | ( | ) | ( | ) | ( | ) | ||||||
| Sale of the India-based DIY business | ( | ) | ( | ) | ||||||||
| Non-U.S. withholding tax on repatriated earnings, net of U.S. foreign tax credits | ||||||||||||
| Other U.S. tax effects, including nondeductible expenses and other credits | ( | ) | ( | ) | ||||||||
| Total income tax expense (benefit) | $ | $ | $ | ( | ) | |||||||
Huntsman International
| Year ended December 31, | ||||||||||||
| 2021 | 2020 | 2019 | ||||||||||
| Income from continuing operations before income taxes | $ | $ | $ | |||||||||
| Expected tax expense at U.S. statutory rate of % | $ | $ | $ | |||||||||
| Change resulting from: | ||||||||||||
| State tax expense, net of federal benefit | ( | ) | ( | ) | ||||||||
| Non-U.S. tax rate differentials | ||||||||||||
| Other non-U.S. tax effects, including nondeductible expenses and other withholding taxes | ||||||||||||
| U.S. Tax Reform Act impact | ( | ) | ||||||||||
| Currency exchange gains/losses, net | ( | ) | ( | ) | ||||||||
| Venator investment basis difference and fair market value adjustments | ( | ) | ( | ) | ||||||||
| Change in valuation allowance on capital loss related to Venator investment | ( | ) | ( | ) | ||||||||
| Non-U.S. income subject to U.S. tax not offset by U.S. foreign tax credits | ( | ) | ||||||||||
| Tax authority audits and dispute resolutions | ( | ) | ||||||||||
| Share-based compensation excess tax benefits | ( | ) | ( | ) | ||||||||
| Change in valuation allowance | ( | ) | ( | ) | ||||||||
| Deferred tax effects of non-U.S. tax rate changes | ( | ) | ( | ) | ||||||||
| Impact of equity method investments | ( | ) | ( | ) | ( | ) | ||||||
| Sale of the India-based DIY business | ( | ) | ( | ) | ||||||||
| Non-U.S. withholding tax on repatriated earnings, net of U.S. foreign tax credits | ||||||||||||
| Other U.S. tax effects, including nondeductible expenses and other credits | ( | ) | ( | ) | ||||||||
| Total income tax expense (benefit) | $ | $ | $ | ( | ) | |||||||
During 2021, 2020 and 2019, the average statutory rate for countries with pre-tax income (in 2021, primarily our operations in China (25% statutory rate), Germany (30% statutory rate), and Luxembourg (25% statutory rate), was higher than the average statutory rate for countries with pre-tax losses, resulting in a net expense of $
During 2021, Albemarle agreed to waive any appeal in connection with an arbitration award we won and pay us $
In 2019, we recorded $
Under the U.S. Tax Reform Act’s global intangible low-taxed income (“GILTI”) provision, our non-U.S. operations are generally subject to U.S. tax. We have elected to treat the GILTI as a current-period expense when incurred. The stated purpose of the GILTI rules is to generate additional U.S. tax related to income in non-U.S. jurisdictions which incur less than a blended 13.125% non-U.S. tax rate. Our non-U.S. income is subject to a blended rate greater than 13.125%; however, in practice, the GILTI regulations result in additional tax liability as a result of expense allocations which limit our ability to utilize foreign tax credits against the GILTI inclusion. For 2021, 2020 and 2019, we have incurred a tax benefit of $
The 2020 sale and related 2021 earnout provision of the India-based DIY business created global taxable gains different than the gains for U.S. GAAP purposes. Because this transaction was the disposition of a legal entity in India, we paid only India capital gains tax on the transaction. The difference in the global taxation of this transaction and the U.S. GAAP gains at the U.S. statutory tax rate benefit for 2021 and 2020 was $
The components of income (loss) from continuing operations before income taxes were as follows (dollars in millions):
Huntsman Corporation
| Year ended December 31, | ||||||||||||
| 2021 | 2020 | 2019 | ||||||||||
| U.S. | $ | $ | ( | ) | $ | ( | ) | |||||
| Non-U.S. | ||||||||||||
| Total | $ | $ | $ | |||||||||
Huntsman International
| Year ended December 31, | ||||||||||||
| 2021 | 2020 | 2019 | ||||||||||
| U.S. | $ | $ | ( | ) | $ | ( | ) | |||||
| Non-U.S. | ||||||||||||
| Total | $ | $ | $ | |||||||||
Components of deferred income tax assets and liabilities were as follows (dollars in millions):
Huntsman Corporation
| December 31, | ||||||||
| 2021 | 2020 | |||||||
| Deferred income tax assets: | ||||||||
| Net operating loss carryforwards | $ | $ | ||||||
| Pension and other employee compensation | ||||||||
| Property, plant and equipment | ||||||||
| Intangible assets | ||||||||
| Basis difference in Venator investment | ||||||||
| Operating leases | ||||||||
| Capital loss carryovers | ||||||||
| Deferred interest | ||||||||
| Intercompany prepayments (FDII related) | ||||||||
| Other, net | ||||||||
| Total | $ | $ | ||||||
| Deferred income tax liabilities: | ||||||||
| Property, plant and equipment | $ | ( | ) | $ | ( | ) | ||
| Pension and other employee compensation | ( | ) | ( | ) | ||||
| Intangible assets | ( | ) | ( | ) | ||||
| Unrealized currency gains | ( | ) | ( | ) | ||||
| Operating leases | ( | ) | ( | ) | ||||
| Other, net | ( | ) | ( | ) | ||||
| Total | $ | ( | ) | $ | ( | ) | ||
| Net deferred tax asset before valuation allowance | $ | $ | ||||||
| Valuation allowance—net operating losses and other | ( | ) | ( | ) | ||||
| Net deferred tax asset | $ | $ | ||||||
| Non-current deferred tax asset | $ | $ | ||||||
| Non-current deferred tax liability | ( | ) | ( | ) | ||||
| Net deferred tax asset | $ | $ | ||||||
Huntsman International
| December 31, | ||||||||
| 2021 | 2020 | |||||||
| Deferred income tax assets: | ||||||||
| Net operating loss carryforwards | $ | $ | ||||||
| Pension and other employee compensation | ||||||||
| Property, plant and equipment | ||||||||
| Intangible assets | ||||||||
| Basis difference in Venator investment | ||||||||
| Operating leases | ||||||||
| Capital loss carryovers | ||||||||
| Deferred interest | ||||||||
| Intercompany prepayments (FDII related) | ||||||||
| Other, net | ||||||||
| Total | $ | $ | ||||||
| Deferred income tax liabilities: | ||||||||
| Property, plant and equipment | $ | ( | ) | $ | ( | ) | ||
| Pension and other employee compensation | ( | ) | ( | ) | ||||
| Intangible assets | ( | ) | ( | ) | ||||
| Unrealized currency gains | ( | ) | ( | ) | ||||
| Operating leases | ( | ) | ( | ) | ||||
| Other, net | ( | ) | ( | ) | ||||
| Total | $ | ( | ) | $ | ( | ) | ||
| Net deferred tax asset before valuation allowance | $ | $ | ||||||
| Valuation allowance—net operating losses and other | ( | ) | ( | ) | ||||
| Net deferred tax asset | $ | $ | ||||||
| Non-current deferred tax asset | $ | $ | ||||||
| Non-current deferred tax liability | ( | ) | ( | ) | ||||
| Net deferred tax asset | $ | $ | ||||||
We evaluate deferred tax assets to determine whether it is more likely than not that they will be realized. Valuation allowances are reviewed each period on a tax jurisdiction by jurisdiction basis to analyze whether there is sufficient positive or negative evidence to support a change in judgment about the realizability of the related deferred tax assets. These conclusions require significant judgment. In evaluating the objective evidence that historical results provide, we consider the cyclicality of businesses and cumulative income or losses during the applicable period. Cumulative losses incurred over the period limits our ability to consider other subjective evidence such as our projections for the future. Our judgments regarding valuation allowances are also influenced by factors outside of business results, including the costs and risks associated with any tax planning idea associated with utilizing a deferred tax asset.
We have gross net operating losses (“NOLs”) of $
We have gross U.S. federal NOLs of $
Included in the $
We have $
During 2021, we recognized $
During 2019, based on our expectation that our remaining interest in Venator would be sold on or before December 31, 2023, we recorded $
During 2019, we also established $
Uncertainties regarding expected future income in certain jurisdictions could affect the realization of deferred tax assets in those jurisdictions and result in additional valuation allowances in future periods, or, in the case of unexpected pre-tax earnings, the release of valuation allowances in future periods.
The following is a summary of changes in the valuation allowance (dollars in millions):
Huntsman Corporation
| 2021 | 2020 | 2019 | ||||||||||
| Valuation allowance as of January 1 | $ | $ | $ | |||||||||
| Valuation allowance as of December 31 | ||||||||||||
| Net decrease (increase) | ( | ) | ||||||||||
| Foreign currency movements | ( | ) | ||||||||||
| Decrease to deferred tax assets with no impact on operating tax expense, including an offsetting (decrease) increase to valuation allowances | ( | ) | ( | ) | ( | ) | ||||||
| Change in valuation allowance per rate reconciliation | $ | $ | $ | ( | ) | |||||||
| Components of change in valuation allowance affecting tax expense: | ||||||||||||
| Pre-tax income and losses in jurisdictions with valuation allowances resulting in tax expense or benefit | $ | $ | $ | ( | ) | |||||||
| Releases of valuation allowances in various jurisdictions | ||||||||||||
| Establishments of valuation allowances in various jurisdictions | ( | ) | ||||||||||
| Change in valuation allowance per rate reconciliation | $ | $ | $ | ( | ) | |||||||
Huntsman International
| 2021 | 2020 | 2019 | ||||||||||
| Valuation allowance as of January 1 | $ | $ | $ | |||||||||
| Valuation allowance as of December 31 | ||||||||||||
| Net decrease (increase) | ( | ) | ||||||||||
| Foreign currency movements | ( | ) | ||||||||||
| Decrease to deferred tax assets with no impact on operating tax expense, including an offsetting (decrease) increase to valuation allowances | ( | ) | ( | ) | ( | ) | ||||||
| Change in valuation allowance per rate reconciliation | $ | $ | $ | ( | ) | |||||||
| Components of change in valuation allowance affecting tax expense: | ||||||||||||
| Pre-tax income and losses in jurisdictions with valuation allowances resulting in tax expense or benefit | $ | $ | $ | ( | ) | |||||||
| Releases of valuation allowances in various jurisdictions | ||||||||||||
| Establishments of valuation allowances in various jurisdictions | ( | ) | ||||||||||
| Change in valuation allowance per rate reconciliation | $ | $ | $ | ( | ) | |||||||
The following is a reconciliation of our unrecognized tax benefits (dollars in millions):
| 2021 | 2020 | |||||||
| Unrecognized tax benefits as of January 1 | $ | $ | ||||||
| Gross increases and decreases—tax positions taken during a prior period | ||||||||
| Gross increases and decreases—tax positions taken during the current period | ||||||||
| Decreases related to settlements of amounts due to tax authorities | ( | ) | ||||||
| Reductions resulting from the lapse of statutes of limitation | ( | ) | ( | ) | ||||
| Foreign currency movements | ( | ) | ||||||
| Unrecognized tax benefits as of December 31 | $ | $ | ||||||
As of December 31, 2021 and 2020, the amount of unrecognized tax benefits (not including interest and penalty expense) which, if recognized, would affect the effective tax rate is $
During 2021, we concluded and settled tax examinations in the U.S. (federal and various states), Germany, Taiwan and Thailand. During 2020, we concluded and settled tax examinations in the U.S. (various states), Thailand and Korea. During 2019, we concluded and settled tax examinations in the U.S. (federal and various states).
During 2021, for unrecognized tax benefits that impact tax expense, we recorded a net increase in unrecognized tax benefits with a corresponding income tax expense (not including interest and penalty expense) of $
In accordance with our accounting policy, we continue to recognize interest and penalties accrued related to unrecognized tax benefits in income tax expense.
| Year ended December 31, | ||||||||||||
| 2021 | 2020 | 2019 | ||||||||||
| Interest expense included in tax expense | $ | $ | $ | |||||||||
| Penalties expense included in tax expense | ||||||||||||
| December 31, | ||||||||
| 2021 | 2020 | |||||||
| Accrued liability for interest | $ | $ | ||||||
| Accrued liability for penalties | ||||||||
We conduct business globally and, as a result, we file income tax returns in U.S. federal, various U.S. state and various non-U.S. jurisdictions. The following table summarizes the tax years that remain subject to examination by major tax jurisdictions:
| Tax Jurisdiction | Open Tax Years | |
| Belgium |
| |
| China |
| |
| France | ||
| Germany |
| |
| Hong Kong |
| |
| India |
| |
| Italy |
| |
| Japan | ||
| Mexico |
| |
| Spain | ||
| Switzerland |
| |
| The Netherlands |
| |
| Thailand |
| |
| United Kingdom |
| |
| United States federal |
|
Certain of our U.S. and non-U.S. income tax returns are currently under various stages of audit by applicable tax authorities and the amounts ultimately agreed upon in resolution of the issues raised may differ materially from the amounts accrued.
We estimate that it is reasonably possible that certain of our non-U.S. unrecognized tax benefits could change within
In connection with the provisions of U.S. Tax Reform, all non-U.S. earnings have generally been subject to U.S. tax and may be repatriated without incurring additional U.S. tax liability. Such repatriation may potentially be subject to limited foreign withholding taxes. We intend to continue to invest most of these earnings indefinitely within the local countries and do not expect to incur any significant additional taxes. There are certain countries where we do intend to repatriate some of our earnings, and we have accrued all withholding taxes for such amounts.
20. COMMITMENTS AND CONTINGENCIES
Purchase Commitments
We have various purchase commitments extending through 2039 for materials, supplies and services entered into in the ordinary course of business. Included in the purchase commitments table below are contracts which require minimum volume purchases that extend beyond year or are renewable annually and have been renewed in 2021. Certain contracts allow for changes in minimum required purchase volumes in the event of a temporary or permanent shutdown of a facility. To the extent the contract requires a minimum notice period, such notice period has been included in the table below. The contractual purchase prices for substantially all of these contracts are variable based upon market prices, subject to annual negotiations. We have estimated our contractual obligations by using the terms of our current pricing for each contract. We also have a limited number of contracts which require a minimum payment even if no volume is purchased. We believe that all of our purchase obligations will be utilized in our normal operations. We made minimum payments of $
Total purchase commitments as of December 31, 2021 are as follows (dollars in millions):
| Year ending December 31, |
||||
| 2022 |
$ | |||
| 2023 |
||||
| 2024 |
||||
| 2025 |
||||
| 2026 |
||||
| Thereafter |
||||
| $ |
Legal Matters
We are a party to various proceedings instituted by private plaintiffs, governmental authorities and others arising under provisions of applicable laws, including various environmental, products liability and other laws. Except as otherwise disclosed in this report, we do not believe that the outcome of any of these matters will have a material effect on our financial condition, results of operations or liquidity.
21. ENVIRONMENTAL, HEALTH AND SAFETY MATTERS
EHS Capital Expenditures
We may incur future costs for capital improvements and general compliance under EHS laws, including costs to acquire, maintain and repair pollution control equipment. For the years ended December 31, 2021, 2020 and 2019, our capital expenditures for EHS matters totaled $
Environmental Reserves
We have accrued liabilities relating to anticipated environmental cleanup obligations, site reclamation and closure costs and known penalties. Liabilities are recorded when potential liabilities are either known or considered probable and can be reasonably estimated. Our liability estimates are calculated using present value techniques as appropriate and are based upon requirements placed upon us by regulators, available facts, existing technology and past experience. The environmental liabilities do not include amounts recorded as asset retirement obligations. We had accrued $
Environmental Matters
Under the Comprehensive Environmental Response, Compensation, and Liability Act (“CERCLA”) and similar state laws, a current or former owner or operator of real property in the U.S. may be liable for remediation costs regardless of whether the release or disposal of hazardous substances was in compliance with law at the time it occurred, and a current owner or operator may be liable regardless of whether it owned or operated the facility at the time of the release. Outside the U.S., analogous contaminated property laws, such as those in effect in France and Australia, can hold past owners and/or operators liable for remediation at former facilities. Currently, there are approximately
Under the Resource Conservation and Recovery Act (“RCRA”) in the U.S. and similar state laws, we may be required to remediate contamination originating from our properties as a condition to our hazardous waste permit. Some of our manufacturing sites have an extended history of industrial chemical manufacturing and use, including on-site waste disposal. We are aware of soil, groundwater or surface contamination from past operations at some of our sites, and we may find contamination at other sites in the future. For example, our Geismar, Louisiana facility is the subject of ongoing remediation requirements imposed under RCRA. Similar laws exist in a number of locations in which we currently operate, or previously operated, manufacturing facilities, such as Australia, India, France, Hungary and Italy.
North Maybe Canyon Mine Remediation
The North Maybe Canyon Mine site is a CERCLA site and involves a former phosphorous mine near Soda Springs, Idaho, which is believed to have been operated by several companies, including a predecessor company to us. In 2004, the U.S. Forest Service notified us that we are a CERCLA potentially responsible party (“PRP”) for contamination originating from the site. In February 2010, we and Wells Cargo (another PRP) agreed to conduct a Remedial Investigation/Feasibility Study of a portion of the site and are currently engaged in that process. At this time, we are unable to reasonably estimate our potential liabilities at this site.
22. HUNTSMAN CORPORATION STOCKHOLDERS’ EQUITY
Share Repurchase Program
On October 26, 2021, our Board of Directors approved a new share repurchase program of $
Dividends on Common Stock
The following tables represent dividends on common stock for our Company for the years ended December 31, 2021 and 2020 (dollars in millions, except per share payment amounts):
| 2021 |
||||||||
| Approximate |
||||||||
| Per share |
amount |
|||||||
| Quarter ended |
payment amount |
paid |
||||||
| March 31, 2021 |
$ | $ | ||||||
| June 30, 2021 |
||||||||
| September 30, 2021 |
||||||||
| December 31, 2021 |
||||||||
| 2020 |
||||||||
| Approximate |
||||||||
| Per share |
amount |
|||||||
| Quarter ended |
payment amount |
paid |
||||||
| March 31, 2020 |
$ | $ | ||||||
| June 30, 2020 |
||||||||
| September 30, 2020 |
||||||||
| December 31, 2020 |
||||||||
23. STOCK-BASED COMPENSATION PLAN
Under the 2016 Stock Incentive Plan, we may grant nonqualified stock options, incentive stock options, stock appreciation rights, restricted stock, phantom stock, performance share units and other stock-based awards to our employees, directors and consultants and to employees and consultants of our subsidiaries, provided that incentive stock options may be granted solely to employees. The terms of the grants under both the 2016 Stock Incentive Plan and the Prior Plan are fixed at the grant date. Initially, there were approximately
The compensation cost under the 2016 Stock Incentive Plan and the Prior Plan for our Company and Huntsman International were as follows (dollars in millions):
| Year ended December 31, |
||||||||||||
| 2021 |
2020 |
2019 |
||||||||||
| Huntsman Corporation compensation cost |
$ | $ | $ | |||||||||
| Huntsman International compensation cost |
||||||||||||
The total income tax benefit recognized in the statement of operations for stock-based compensation arrangements was $
Stock Options
The fair value of each stock option award is estimated on the date of grant using the Black-Scholes valuation model that uses the assumptions noted in the following table. Expected volatilities are based on the historical volatility of our common stock through the grant date. The expected term of options granted was estimated based on the contractual term of the instruments and employees’ expected exercise and post-vesting employment termination behavior. The risk-free rate for periods within the contractual life of the option was based on the U.S. Treasury yield curve in effect at the time of grant. The assumptions noted below represent the weighted averages of the assumptions utilized for all stock options granted during the year.
| Year ended December 31, |
||||||||||||
| 2021 |
2020 |
2019 |
||||||||||
| Dividend yield |
% | % | % | |||||||||
| Expected volatility |
% | % | % | |||||||||
| Risk-free interest rate |
% | % | % | |||||||||
| Expected life of stock options granted during the period (in years) |
||||||||||||
A summary of stock option activity under the 2016 Stock Incentive Plan and the Prior Plan as of December 31, 2021 and changes during the year then ended is presented below:
| Weighted |
||||||||||||||||
| Weighted |
Average |
|||||||||||||||
| Average |
Remaining |
Aggregate |
||||||||||||||
| Exercise |
Contractual |
Intrinsic |
||||||||||||||
| Option Awards |
Shares |
Price |
Term |
Value |
||||||||||||
| (in thousands) |
(years) |
(in millions) |
||||||||||||||
| Outstanding at January 1, 2021 |
$ | |||||||||||||||
| Granted |
||||||||||||||||
| Exercised |
( |
) | ||||||||||||||
| Forfeited |
( |
) | ||||||||||||||
| Outstanding at December 31, 2021 |
$ | |||||||||||||||
| Exercisable at December 31, 2021 |
||||||||||||||||
The weighted-average grant-date fair value of stock options granted during 2021, 2020 and 2019 was $
During the years ended December 31, 2021, 2020 and 2019, the total intrinsic value of stock options exercised was approximately $
Nonvested Shares
Nonvested shares granted under the 2016 Stock Incentive Plan and the Prior Plan consist of restricted stock and performance share unit awards, which are accounted for as equity awards, and phantom stock, which is accounted for as a liability award because it can be settled in either stock or cash. The fair value of each restricted stock and phantom stock award is estimated to be the closing stock price of Huntsman’s stock on the date of grant.
The fair value of each performance share unit award is estimated using a Monte Carlo simulation model that uses various assumptions, including an expected volatility rate and a risk-free interest rate. For the years ended December 31, 2021, 2020 and 2019, the weighted-average expected volatility rate was
A summary of the status of our nonvested shares as of December 31, 2021 and changes during the year then ended is presented below:
| Equity Awards |
Liability Awards |
|||||||||||||||
| Weighted |
Weighted |
|||||||||||||||
| Average |
Average |
|||||||||||||||
| Grant-Date |
Grant-Date |
|||||||||||||||
| Shares |
Fair Value |
Shares |
Fair Value |
|||||||||||||
| (in thousands) |
(in thousands) |
|||||||||||||||
| Nonvested at January 1, 2021 |
$ | $ | ||||||||||||||
| Granted |
||||||||||||||||
| Vested |
( |
) | (1)(2) |
( |
) | |||||||||||
| Forfeited |
( |
) | ( |
) | ||||||||||||
| Nonvested at December 31, 2021 |
||||||||||||||||
| (1) |
As of December 31, 2021, a total of |
| (2) |
A total of |
As of December 31, 2021, there was $
24. ACCUMULATED OTHER COMPREHENSIVE (LOSS) INCOME
The components of other comprehensive (loss) income and changes in accumulated other comprehensive loss by component were as follows (dollars in millions):
Huntsman Corporation
| Pension and | Other | |||||||||||||||||||||||||||
| Foreign | other | comprehensive | Amounts | Amounts | ||||||||||||||||||||||||
| currency | postretirement | income of | attributable to | attributable to | ||||||||||||||||||||||||
| translation | benefits | unconsolidated | noncontrolling | Huntsman | ||||||||||||||||||||||||
| adjustment(a) | adjustments(b) | affiliates | Other, net | Total | interests | Corporation | ||||||||||||||||||||||
| Beginning balance, January 1, 2021 | $ | ( | ) | $ | ( | ) | $ | $ | $ | ( | ) | $ | $ | ( | ) | |||||||||||||
| Other comprehensive loss before reclassifications, gross | ( | ) | ( | ) | ||||||||||||||||||||||||
| Tax benefit | ( | ) | ( | ) | ( | ) | ( | ) | ||||||||||||||||||||
| Amounts reclassified from accumulated other comprehensive loss, gross(c) | ||||||||||||||||||||||||||||
| Tax expense | ( | ) | ( | ) | ( | ) | ||||||||||||||||||||||
| Net current-period other comprehensive (loss) income | ( | ) | ( | ) | ||||||||||||||||||||||||
| Ending balance, December 31, 2021 | $ | ( | ) | $ | ( | ) | $ | $ | $ | ( | ) | $ | $ | ( | ) | |||||||||||||
| (a) | Amounts are net of tax of $ |
| (b) | Amounts are net of tax of $ |
| (c) | See table below for details about these reclassifications. |
| Pension and | Other | |||||||||||||||||||||||||||
| Foreign | other | comprehensive | Amounts | Amounts | ||||||||||||||||||||||||
| currency | postretirement | income of | attributable to | attributable to | ||||||||||||||||||||||||
| translation | benefits | unconsolidated | noncontrolling | Huntsman | ||||||||||||||||||||||||
| adjustment(a) | adjustments(b) | affiliates | Other, net | Total | interests | Corporation | ||||||||||||||||||||||
| Beginning balance, January 1, 2020 | $ | ( | ) | $ | ( | ) | $ | $ | $ | ( | ) | $ | $ | ( | ) | |||||||||||||
| Other comprehensive income (loss) before reclassifications, gross | ( | ) | ( | ) | ( | ) | ( | ) | ||||||||||||||||||||
| Tax benefit | ||||||||||||||||||||||||||||
| Amounts reclassified from accumulated other comprehensive loss, gross(c) | ||||||||||||||||||||||||||||
| Tax expense | ( | ) | ( | ) | ( | ) | ||||||||||||||||||||||
| Net current-period other comprehensive income (loss) | ( | ) | ( | ) | ||||||||||||||||||||||||
| Ending balance, December 31, 2020 | $ | ( | ) | $ | ( | ) | $ | $ | $ | ( | ) | $ | $ | ( | ) | |||||||||||||
| (a) | Amounts are net of tax of $ |
| (b) | Amounts are net of tax of $ |
| (c) | See table below for details about these reclassifications. |
| Amounts reclassified | ||||||||||||||
| from accumulated | ||||||||||||||
| other | ||||||||||||||
| comprehensive loss | Affected line item in | |||||||||||||
| Details about Accumulated Other | Year ended December 31, | where net income | ||||||||||||
| Comprehensive Loss Components(a): | 2021 | 2020 | 2019 | is presented | ||||||||||
| Amortization of pension and other postretirement benefits: | ||||||||||||||
| Prior service credit | $ | ( | ) | $ | ( | ) | $ | ( | ) | (b)(d) | Other income, net | |||
| Settlement loss | (b)(c) | Other income, net | ||||||||||||
| Curtailment gain | ( | ) | (c) | Other income, net | ||||||||||
| Actuarial loss | (b)(d) | Other income, net | ||||||||||||
| Total before tax | ||||||||||||||
| ( | ) | ( | ) | ( | ) | Income tax expense | ||||||||
| Total reclassifications for the period | $ | $ | $ | Net of tax | ||||||||||
| (a) | Pension and other postretirement benefits amounts in parentheses indicate credits on our consolidated statements of operations. |
| (b) | These accumulated other comprehensive loss components are included in the computation of net periodic pension costs. See “Note 18. Employee Benefit Plans.” |
| (c) | In connection with the sale of our Chemical Intermediates Businesses, we recognized $ |
| (d) | Amounts contain approximately $ |
Huntsman International
| Pension | Other | |||||||||||||||||||||||||||
| Foreign | and other | comprehensive | Amounts | Amounts | ||||||||||||||||||||||||
| currency | postretirement | income of | attributable to | attributable to | ||||||||||||||||||||||||
| translation | benefits | unconsolidated | noncontrolling | Huntsman | ||||||||||||||||||||||||
| adjustment(a) | adjustments(b) | affiliates | Other, net | Total | interests | International | ||||||||||||||||||||||
| Beginning balance, January 1, 2021 | $ | ( | ) | $ | ( | ) | $ | $ | $ | ( | ) | $ | $ | ( | ) | |||||||||||||
| Other comprehensive income (loss) before reclassifications, gross | ( | ) | ( | ) | ||||||||||||||||||||||||
| Tax benefit | ( | ) | ( | ) | ( | ) | ( | ) | ||||||||||||||||||||
| Amounts reclassified from accumulated other comprehensive loss, gross(c) | ||||||||||||||||||||||||||||
| Tax expense | ( | ) | ( | ) | ( | ) | ||||||||||||||||||||||
| Net current-period other comprehensive (loss) income | ( | ) | ( | ) | ||||||||||||||||||||||||
| Ending balance, December 31, 2021 | $ | ( | ) | $ | ( | ) | $ | $ | $ | ( | ) | $ | $ | ( | ) | |||||||||||||
| (a) | Amounts are net of tax of $ |
| (b) | Amounts are net of tax of $ |
| (c) | See table below for details about these reclassifications. |
| Pension | Other | |||||||||||||||||||||||||||
| Foreign | and other | comprehensive | Amounts | Amounts | ||||||||||||||||||||||||
| currency | postretirement | income of | attributable to | attributable to | ||||||||||||||||||||||||
| translation | benefits | unconsolidated | noncontrolling | Huntsman | ||||||||||||||||||||||||
| adjustment(a) | adjustments(b) | affiliates | Other, net | Total | interests | International | ||||||||||||||||||||||
| Beginning balance, January 1, 2020 | $ | ( | ) | $ | ( | ) | $ | $ | $ | ( | ) | $ | $ | ( | ) | |||||||||||||
| Other comprehensive income (loss) before reclassifications, gross | ( | ) | ( | ) | ( | ) | ( | ) | ||||||||||||||||||||
| Tax benefit | ||||||||||||||||||||||||||||
| Amounts reclassified from accumulated other comprehensive loss, gross(c) | ||||||||||||||||||||||||||||
| Tax expense | ( | ) | ( | ) | ( | ) | ||||||||||||||||||||||
| Net current-period other comprehensive (loss) income | ( | ) | ( | ) | ||||||||||||||||||||||||
| Ending balance, December 31, 2020 | $ | ( | ) | $ | ( | ) | $ | $ | $ | ( | ) | $ | $ | ( | ) | |||||||||||||
| (a) | Amounts are net of tax of $ |
| (b) | Amounts are net of tax of $ |
| (c) | See table below for details about these reclassifications. |
| Amounts reclassified | ||||||||||||||
| from accumulated | ||||||||||||||
| other | ||||||||||||||
| comprehensive loss | Affected line item in | |||||||||||||
| Details about Accumulated Other | Year ended December 31, | where net income | ||||||||||||
| Comprehensive Loss Components(a): | 2021 | 2020 | 2019 | is presented | ||||||||||
| Amortization of pension and other postretirement benefits: | ||||||||||||||
| Prior service credit | $ | ( | ) | $ | ( | ) | $ | ( | ) | (b)(d) | Other income, net | |||
| Settlement loss | (b)(c) | Other income, net | ||||||||||||
| Curtailment gain | ( | ) | (c) | Other income, net | ||||||||||
| Actuarial loss | (b)(d) | Other income, net | ||||||||||||
| Total before tax | ||||||||||||||
| ( | ) | ( | ) | ( | ) | Income tax expense | ||||||||
| Total reclassifications for the period | $ | $ | $ | Net of tax | ||||||||||
| (a) | Pension and other postretirement benefits amounts in parentheses indicate credits on our consolidated statements of operations. |
| (b) | These accumulated other comprehensive loss components are included in the computation of net periodic pension costs. See “Note 18. Employee Benefit Plans.” |
| (c) | In connection with the sale of our Chemical Intermediates Businesses, we recognized $ |
| (d) | Amounts contain approximately $ |
Items of other comprehensive income (loss) of our Company and our consolidated affiliates have been recorded net of tax, with the exception of the foreign currency translation adjustments related to subsidiaries with earnings permanently reinvested. The tax effect is determined based upon the jurisdiction where the income or loss was recognized and is net of valuation allowances.
25. RELATED PARTY TRANSACTIONS
Our consolidated financial statements include the following transactions with our affiliates not otherwise disclosed (dollars in millions):
| Year ended December 31, |
||||||||||||
| 2021 |
2020 |
2019 |
||||||||||
| Sales to: |
||||||||||||
| Unconsolidated affiliates |
$ | $ | $ | |||||||||
| Inventory purchases from: |
||||||||||||
| Unconsolidated affiliates |
||||||||||||
26. OPERATING SEGMENT INFORMATION
We derive our revenues, earnings and cash flows from the manufacture and sale of a wide variety of differentiated and commodity chemical products. We have operating segments, which are also our reportable segments: Polyurethanes, Performance Products, Advanced Materials and Textile Effects. We have organized our business and derived our operating segments around differences in product lines.
The major products of each reportable operating segment are as follows:
| Segment |
|
Products |
| Polyurethanes |
MDI, polyols, TPU and other polyurethane-related products |
|
| Performance Products |
Specialty amines, ethyleneamines, maleic anhydride and technology licenses |
|
| Advanced Materials |
Specialty resin compounds; cross-linking, matting, and curing and toughening agents; epoxy, acrylic and polyurethane-based formulations; specialty nitrile latex, alkyd resins and carbon nano materials |
|
| Textile Effects |
Textile chemicals and dyes |
Sales between segments are generally recognized at external market prices and are eliminated in consolidation. We use adjusted EBITDA to measure the financial performance of our global business units and for reporting the results of our operating segments. This measure includes all operating items relating to the businesses. The adjusted EBITDA of operating segments excludes items that principally apply to our Company as a whole. The following schedule includes revenues and adjusted EBITDA for each of our reportable operating segments (dollars in millions). We have revised our prior years’ presentation below to reconcile total reportable segments’ adjusted EBITDA to income from continuing operations before income taxes, in addition to net income, and removed “corporate and other costs, net” from the total reportable segments’ adjusted EBITDA and included such amounts in the reconciliation to income from continuing operations before income taxes. Additionally, we have revised our prior years’ presentation of total reportable segments’ revenues, depreciation and amortization, capital expenditures and total assets, in which we removed intersegment eliminations from the total reportable segment’s revenues and removed depreciation and amortization, capital expenditures and assets related to Corporate and other from the total reportable segments’ respective amounts.
| Year ended December 31, |
||||||||||||
| 2021 |
2020 |
2019 |
||||||||||
| Revenues: |
||||||||||||
| Polyurethanes |
$ | $ | $ | |||||||||
| Performance Products |
||||||||||||
| Advanced Materials |
||||||||||||
| Textile Effects |
||||||||||||
| Total reportable segments’ revenues |
||||||||||||
| Intersegment eliminations |
( |
) | ( |
) | ( |
) | ||||||
| Total |
$ | $ | $ | |||||||||
| Huntsman Corporation: |
||||||||||||
| Segment adjusted EBITDA(1): |
||||||||||||
| Polyurethanes |
$ | $ | $ | |||||||||
| Performance Products |
||||||||||||
| Advanced Materials |
||||||||||||
| Textile Effects |
||||||||||||
| Total reportable segments’ adjusted EBITDA |
||||||||||||
| Reconciliation of total reportable segments’ adjusted EBITDA to income from continuing operations before income taxes: |
||||||||||||
| Interest expense, net—continuing operations |
( |
) | ( |
) | ( |
) | ||||||
| Depreciation and amortization—continuing operations |
( |
) | ( |
) | ( |
) | ||||||
| Corporate and other costs, net(2) |
( |
) | ( |
) | ( |
) | ||||||
| Net income attributable to noncontrolling interests |
||||||||||||
| Other adjustments: |
||||||||||||
| Business acquisition and integration expenses and purchase accounting inventory adjustments |
( |
) | ( |
) | ( |
) | ||||||
| Fair value adjustments to Venator investment and related loss on disposal |
( |
) | ( |
) | ( |
) | ||||||
| Loss on early extinguishment of debt |
( |
) | ( |
) | ||||||||
| Certain legal and other settlements and related expenses |
( |
) | ( |
) | ( |
) | ||||||
| Income associated with the Albemarle Settlement, net |
||||||||||||
| Gain (loss) on sale of businesses/assets |
( |
) | ||||||||||
| Income from transition services arrangements |
||||||||||||
| Certain nonrecurring information technology project implementation costs |
( |
) | ( |
) | ( |
) | ||||||
| Amortization of pension and postretirement actuarial losses |
( |
) | ( |
) | ( |
) | ||||||
| Plant incident remediation costs |
( |
) | ( |
) | ||||||||
| Restructuring, impairment and plant closing and transition (costs) credits(3) |
( |
) | ( |
) | ||||||||
| Income from continuing operations before income taxes |
||||||||||||
| Income tax (expense) benefit—continuing operations |
( |
) | ( |
) | ||||||||
| Income from discontinued operations, net of tax |
||||||||||||
| Net income |
$ | $ | $ | |||||||||
| Year ended December 31, |
||||||||||||
| 2021 |
2020 |
2019 |
||||||||||
| Depreciation and Amortization: |
||||||||||||
| Polyurethanes |
$ | $ | $ | |||||||||
| Performance Products |
||||||||||||
| Advanced Materials |
||||||||||||
| Textile Effects |
||||||||||||
| Total reportable segments’ depreciation and amortization |
||||||||||||
| Corporate and other |
||||||||||||
| Total |
$ | $ | $ | |||||||||
| Year ended December 31, |
||||||||||||
| 2021 |
2020 |
2019 |
||||||||||
| Capital Expenditures: |
||||||||||||
| Polyurethanes |
$ | $ | $ | |||||||||
| Performance Products |
||||||||||||
| Advanced Materials |
||||||||||||
| Textile Effects |
||||||||||||
| Total reportable segments’ capital expenditures |
||||||||||||
| Corporate and other |
||||||||||||
| Total |
$ | $ | $ | |||||||||
| December 31, |
||||||||
| 2021 |
2020 |
|||||||
| Total Assets: |
||||||||
| Polyurethanes |
$ | $ | ||||||
| Performance Products |
||||||||
| Advanced Materials |
||||||||
| Textile Effects |
||||||||
| Total reportable segments’ total assets |
||||||||
| Corporate and other |
||||||||
| Total |
$ | $ | ||||||
| December 31, |
||||||||
| 2021 |
2020 |
|||||||
| Goodwill: |
||||||||
| Polyurethanes |
$ | $ | ||||||
| Performance Products |
||||||||
| Advanced Materials |
||||||||
| Total |
$ | $ | ||||||
| Year ended December 31, |
||||||||||||
| 2021 |
2020 |
2019 |
||||||||||
| Huntsman International: |
||||||||||||
| Segment adjusted EBITDA(1): |
||||||||||||
| Polyurethanes |
$ | $ | $ | |||||||||
| Performance Products |
||||||||||||
| Advanced Materials |
||||||||||||
| Textile Effects |
||||||||||||
| Total reportable segments’ adjusted EBITDA |
||||||||||||
| Reconciliation of total reportable segments’ adjusted EBITDA to income from continuing operations before income taxes: |
||||||||||||
| Interest expense, net—continuing operations |
( |
) | ( |
) | ( |
) | ||||||
| Depreciation and amortization—continuing operations |
( |
) | ( |
) | ( |
) | ||||||
| Corporate and other costs, net(2) |
( |
) | ( |
) | ( |
) | ||||||
| Net income attributable to noncontrolling interests |
||||||||||||
| Other adjustments: |
||||||||||||
| Business acquisition and integration expenses and purchase accounting inventory adjustments |
( |
) | ( |
) | ( |
) | ||||||
| Fair value adjustments to Venator investment and related loss on disposal |
( |
) | ( |
) | ( |
) | ||||||
| Loss on early extinguishment of debt |
( |
) | ( |
) | ||||||||
| Certain legal and other settlements and related expenses |
( |
) | ( |
) | ( |
) | ||||||
| Income associated with the Albemarle Settlement, net |
||||||||||||
| Gain (loss) on sale of businesses/assets |
( |
) | ||||||||||
| Income from transition services arrangements |
||||||||||||
| Certain nonrecurring information technology project implementation costs |
( |
) | ( |
) | ( |
) | ||||||
| Amortization of pension and postretirement actuarial losses |
( |
) | ( |
) | ( |
) | ||||||
| Plant incident remediation costs |
( |
) | ( |
) | ||||||||
| Restructuring, impairment and plant closing and transition (costs) credits(3) |
( |
) | ( |
) | ||||||||
| Income from continuing operations before income taxes |
||||||||||||
| Income tax (expense) benefit—continuing operations |
( |
) | ( |
) | ||||||||
| Income from discontinued operations, net of tax |
||||||||||||
| Net income |
$ | $ | $ | |||||||||
| Year ended December 31, |
||||||||||||
| 2021 |
2020 |
2019 |
||||||||||
| Depreciation and Amortization: |
||||||||||||
| Polyurethanes |
$ | $ | $ | |||||||||
| Performance Products |
||||||||||||
| Advanced Materials |
||||||||||||
| Textile Effects |
||||||||||||
| Total reportable segments’ depreciation and amortization |
||||||||||||
| Corporate and other |
||||||||||||
| Total |
$ | $ | $ | |||||||||
| Year ended December 31, |
||||||||||||
| 2021 |
2020 |
2019 |
||||||||||
| Capital Expenditures: |
||||||||||||
| Polyurethanes |
$ | $ | $ | |||||||||
| Performance Products |
||||||||||||
| Advanced Materials |
||||||||||||
| Textile Effects |
||||||||||||
| Total reportable segments’ capital expenditures |
||||||||||||
| Corporate and other |
||||||||||||
| Total |
$ | $ | $ | |||||||||
| December 31, |
||||||||
| 2021 |
2020 |
|||||||
| Total Assets: |
||||||||
| Polyurethanes |
$ | $ | ||||||
| Performance Products |
||||||||
| Advanced Materials |
||||||||
| Textile Effects |
||||||||
| Total reportable segments’ total assets |
||||||||
| Corporate and other |
||||||||
| Total |
$ | $ | ||||||
| December 31, |
||||||||
| 2021 |
2020 |
|||||||
| Goodwill: |
||||||||
| Polyurethanes |
$ | $ | ||||||
| Performance Products |
||||||||
| Advanced Materials |
||||||||
| Total |
$ | $ | ||||||
| (1) |
We use segment adjusted EBITDA as the measure of each segment’s profit or loss. We believe that segment adjusted EBITDA more accurately reflects what the chief operating decision maker uses to make decisions about resources to be allocated to the segments and assess their financial performance. Segment adjusted EBITDA is defined as net income of Huntsman Corporation or Huntsman International, as appropriate, before interest, income tax, depreciation and amortization, net income attributable to noncontrolling interests and certain Corporate and other items, as well as eliminating the following adjustments: (a) business acquisition and integration expenses and purchase accounting inventory adjustments; (b) fair value adjustments to Venator investment and related loss on disposal; (c) loss on early extinguishment of debt; (d) certain legal and other settlements and related expenses; (e) income associated with the Albemarle Settlement, net; (f) gain (loss) on sale of businesses/assets; (g) income from transition services arrangements related to the sale of our Chemical Intermediates Businesses to Indorama; (h) certain nonrecurring information technology project implementation costs; (i) amortization of pension and postretirement actuarial losses; (j) plant incident remediation costs; (k) restructuring, impairment, plant closing and transition (costs) credits; and (l) income from discontinued operations, net of tax. |
| (2) |
Corporate and other costs, net includes unallocated corporate overhead, unallocated foreign exchange gains and losses, LIFO inventory valuation reserve adjustments, nonoperating income and expense and gains and losses on the disposition of corporate assets. |
| (3) |
Includes costs associated with transition activities relating primarily to our Corporate program to optimize our global approach to leverage shared services capabilities as well as our 2020 CVC Thermoset Specialties Acquisition. |
| Year ended December 31, |
||||||||||||
| 2021 |
2020 |
2019 |
||||||||||
| Revenues by geographic area(1): |
||||||||||||
| United States |
$ | $ | $ | |||||||||
| China |
||||||||||||
| Germany |
||||||||||||
| Italy |
||||||||||||
| India |
||||||||||||
| Other nations |
||||||||||||
| Total |
$ | $ | $ | |||||||||
| December 31, | ||||||||
| 2021 | 2020 | |||||||
| Long-lived assets(2): | ||||||||
| United States | $ | $ | ||||||
| The Netherlands | ||||||||
| China | ||||||||
| Germany | ||||||||
| Saudi Arabia | ||||||||
| Singapore | ||||||||
| Switzerland | ||||||||
| Other nations | ||||||||
| Total | $ | $ | ||||||
| (1) |
Geographic information for revenues is based upon countries into which product is sold. |
| (2) |
Long-lived assets consist of property, plant and equipment, net. |
HUNTSMAN CORPORATION (PARENT ONLY)
Schedule I—Condensed Financial Information of Registrant
HUNTSMAN CORPORATION (Parent Only)
BALANCE SHEETS
(In Millions, Except Share and Per Share Amounts)
| December 31, | ||||||||
| 2021 | 2020 | |||||||
| ASSETS | ||||||||
| Cash and cash equivalents | $ | $ | ||||||
| Prepaid assets | ||||||||
| Receivable from affiliate | ||||||||
| Total current assets | ||||||||
| Investment in and advances to affiliates | ||||||||
| Total assets | $ | $ | ||||||
| LIABILITIES AND STOCKHOLDERS’ EQUITY | ||||||||
| Accounts payable | $ | $ | ||||||
| Payable to affiliate | ||||||||
| Accrued liabilities | ||||||||
| Total current liabilities | ||||||||
| Other noncurrent liabilities | ||||||||
| Total liabilities | ||||||||
| STOCKHOLDERS’ EQUITY | ||||||||
| Common stock $ par value, shares authorized, and shares issued and and shares outstanding, respectively | ||||||||
| Additional paid-in capital | ||||||||
| Treasury stock, and shares, respectively | ( | ) | ( | ) | ||||
| Unearned stock-based compensation | ( | ) | ( | ) | ||||
| Retained earnings | ||||||||
| Accumulated other comprehensive loss | ( | ) | ( | ) | ||||
| Total stockholders’ equity | ||||||||
| Total liabilities and stockholders’ equity | $ | $ | ||||||
The accompanying notes are an integral part of the condensed financial information.
HUNTSMAN CORPORATION (Parent Only)
STATEMENTS OF OPERATIONS
(In Millions)
| Year ended December 31, |
||||||||||||
| 2021 |
2020 |
2019 |
||||||||||
| Selling, general and administrative expenses |
$ | ( |
) | $ | ( |
) | $ | ( |
) | |||
| Interest income |
||||||||||||
| Equity in income of subsidiaries |
||||||||||||
| Dividend income—affiliate |
||||||||||||
| Other income |
||||||||||||
| Net income |
$ | $ | $ | |||||||||
The accompanying notes are an integral part of the condensed financial information.
HUNTSMAN CORPORATION (Parent Only)
STATEMENTS OF COMPREHENSIVE INCOME
(In Millions)
| Year ended December 31, |
||||||||||||
| 2021 |
2020 |
2019 |
||||||||||
| Net income |
$ | $ | $ | |||||||||
| Other comprehensive income, net of tax: |
||||||||||||
| Foreign currency translations adjustments |
( |
) | ||||||||||
| Pension and other postretirement benefits adjustments |
( |
) | ( |
) | ||||||||
| Other, net |
||||||||||||
| Other comprehensive income, net of tax |
||||||||||||
| Comprehensive income |
||||||||||||
| Comprehensive income attributable to noncontrolling interests |
( |
) | ( |
) | ( |
) | ||||||
| Comprehensive income attributable to Huntsman Corporation |
$ | $ | $ | |||||||||
The accompanying notes are an integral part of the condensed financial information.
HUNTSMAN CORPORATION (Parent Only)
STATEMENTS OF STOCKHOLDERS’ EQUITY
(In Millions, Except Share Amounts)
| Huntsman Corporation Stockholders’ Equity |
||||||||||||||||||||||||||||||||
| Accumulated |
||||||||||||||||||||||||||||||||
| Shares |
Additional |
Unearned |
other |
|||||||||||||||||||||||||||||
| Common |
Common |
paid-in |
Treasury |
stock-based |
Retained |
comprehensive |
Total |
|||||||||||||||||||||||||
| stock |
stock |
capital |
stock |
compensation |
earnings |
loss |
equity |
|||||||||||||||||||||||||
| Beginning balance, January 1, 2019 |
$ | $ | $ | ( |
) | $ | ( |
) | $ | $ | ( |
) | $ | |||||||||||||||||||
| Net income |
— | |||||||||||||||||||||||||||||||
| Other comprehensive loss |
— | ( |
) | ( |
) | |||||||||||||||||||||||||||
| Issuance of nonvested stock awards |
— | ( |
) | |||||||||||||||||||||||||||||
| Vesting of stock awards |
||||||||||||||||||||||||||||||||
| Recognition of stock-based compensation |
— | |||||||||||||||||||||||||||||||
| Repurchase and cancellation of stock awards |
( |
) | ( |
) | ( |
) | ||||||||||||||||||||||||||
| Stock options exercised |
( |
) | ||||||||||||||||||||||||||||||
| Treasury stock repurchased |
( |
) | ( |
) | ( |
) | ||||||||||||||||||||||||||
| Acquisition of noncontrolling interests, net of tax |
— | ( |
) | ( |
) | |||||||||||||||||||||||||||
| Dividends declared on common stock |
— | ( |
) | ( |
) | |||||||||||||||||||||||||||
| Balance, December 31, 2019 |
( |
) | ( |
) | ( |
) | ||||||||||||||||||||||||||
| Net income |
— | |||||||||||||||||||||||||||||||
| Other comprehensive income |
— | |||||||||||||||||||||||||||||||
| Issuance of nonvested stock awards |
— | ( |
) | |||||||||||||||||||||||||||||
| Vesting of stock awards |
||||||||||||||||||||||||||||||||
| Recognition of stock-based compensation |
— | |||||||||||||||||||||||||||||||
| Repurchase and cancellation of stock awards |
( |
) | ( |
) | ( |
) | ||||||||||||||||||||||||||
| Stock options exercised |
( |
) | ||||||||||||||||||||||||||||||
| Treasury stock repurchased |
( |
) | ( |
) | ( |
) | ||||||||||||||||||||||||||
| Dividends declared to noncontrolling interests |
— | — | — | — | — | — | — | — | ||||||||||||||||||||||||
| Dividends declared on common stock |
— | ( |
) | ( |
) | |||||||||||||||||||||||||||
| Balance, December 31, 2020 |
( |
) | ( |
) | ( |
) | ||||||||||||||||||||||||||
| Net income |
— | |||||||||||||||||||||||||||||||
| Other comprehensive income |
— | |||||||||||||||||||||||||||||||
| Issuance of nonvested stock awards |
— | ( |
) | |||||||||||||||||||||||||||||
| Vesting of stock awards |
||||||||||||||||||||||||||||||||
| Recognition of stock-based compensation |
— | |||||||||||||||||||||||||||||||
| Repurchase and cancellation of stock awards |
( |
) | ( |
) | ( |
) | ||||||||||||||||||||||||||
| Stock options exercised |
( |
) | ||||||||||||||||||||||||||||||
| Treasury stock repurchased |
( |
) | ( |
) | ( |
) | ||||||||||||||||||||||||||
| Dividends declared on common stock |
— | ( |
) | ( |
) | |||||||||||||||||||||||||||
| Balance, December 31, 2021 |
$ | $ | $ | ( |
) | $ | ( |
) | $ | $ | ( |
) | $ | |||||||||||||||||||
The accompanying notes are an integral part of the condensed financial information.
HUNTSMAN CORPORATION (Parent Only)
STATEMENTS OF CASH FLOWS
(In Millions)
| Year ended December 31, |
||||||||||||
| 2021 |
2020 |
2019 |
||||||||||
| Operating Activities: |
||||||||||||
| Net income |
$ | $ | $ | |||||||||
| Equity in income of subsidiaries |
( |
) | ( |
) | ( |
) | ||||||
| Stock-based compensation |
||||||||||||
| Noncash interest income |
( |
) | ( |
) | ||||||||
| Changes in operating assets and liabilities |
( |
) | ( |
) | ||||||||
| Net cash provided by operating activities |
||||||||||||
| Investing Activities: |
||||||||||||
| Repayments of loan by affiliate |
||||||||||||
| Net cash provided by investing activities |
||||||||||||
| Financing Activities: |
||||||||||||
| Dividends paid to common stockholders |
( |
) | ( |
) | ( |
) | ||||||
| Repurchase and cancellation of stock awards |
( |
) | ( |
) | ( |
) | ||||||
| Proceeds from issuance of common stock |
||||||||||||
| Repurchase of common stock |
( |
) | ( |
) | ( |
) | ||||||
| Increase (decrease) in payable to affiliates |
( |
) | ||||||||||
| Net cash used in financing activities |
( |
) | ( |
) | ( |
) | ||||||
| Increase in cash and cash equivalents |
||||||||||||
| Cash and cash equivalents at beginning of period |
||||||||||||
| Cash and cash equivalents at end of period |
$ | $ | $ | |||||||||
The accompanying notes are an integral part of the condensed financial information.
HUNTSMAN CORPORATION (Parent Only)
NOTES TO CONDENSED FINANCIAL STATEMENTS
1. BASIS OF PRESENTATION
Pursuant to rules and regulations of the SEC, the parent only condensed financial information of Huntsman Corporation do not reflect all of the information and notes normally included with financial statements prepared in accordance with GAAP in the United States. Therefore, these condensed financial statements should be read in conjunction with the consolidated financial statements and related notes included under Item 8 in this Form 10-K.
F-72