00013079540001089748--12-31--12-3120192019FYFYfalsefalsetruefalse10-K2019-12-31272827280us-gaap:OperatingLeaseLiabilityCurrent us-gaap:OperatingLeaseLiabilityNoncurrent0001307954hun:SasolHuntsmanGmbHAndCoKGMember2019-09-292019-09-290001307954hun:RubiconLLCMember2019-01-012019-12-310001307954hun:ArabianAminesCompanyMember2019-01-012019-12-310001307954srt:ParentCompanyMembersrt:ReportableLegalEntitiesMemberus-gaap:TreasuryStockCommonMember2019-01-012019-12-310001307954us-gaap:TreasuryStockCommonMember2019-01-012019-12-310001307954srt:ParentCompanyMembersrt:ReportableLegalEntitiesMemberus-gaap:TreasuryStockCommonMember2018-01-012018-12-310001307954us-gaap:TreasuryStockCommonMember2018-01-012018-12-3100013079542020-01-012020-01-3100013079542017-01-012018-12-310001307954hun:ShareRepurchaseProgram2015Member2018-05-030001307954srt:MaximumMemberhun:ShareRepurchaseProgram2018Member2018-05-030001307954srt:ParentCompanyMembersrt:ReportableLegalEntitiesMemberus-gaap:CommonStockMember2019-01-012019-12-310001307954us-gaap:CommonStockMember2019-01-012019-12-310001307954srt:ParentCompanyMembersrt:ReportableLegalEntitiesMemberus-gaap:CommonStockMember2018-01-012018-12-310001307954us-gaap:CommonStockMember2018-01-012018-12-310001307954srt:ParentCompanyMembersrt:ReportableLegalEntitiesMemberus-gaap:CommonStockMember2017-01-012017-12-310001307954us-gaap:CommonStockMember2017-01-012017-12-310001307954us-gaap:TreasuryStockCommonMember2019-12-310001307954us-gaap:RetainedEarningsMember2019-12-310001307954us-gaap:NoncontrollingInterestMember2019-12-310001307954us-gaap:DeferredCompensationShareBasedPaymentsMember2019-12-310001307954us-gaap:AociIncludingPortionAttributableToNoncontrollingInterestMember2019-12-310001307954us-gaap:AociAttributableToNoncontrollingInterestMember2019-12-310001307954us-gaap:AdditionalPaidInCapitalMember2019-12-310001307954us-gaap:AccumulatedOtherComprehensiveIncomeMember2019-12-310001307954us-gaap:AccumulatedForeignCurrencyAdjustmentIncludingPortionAttributableToNoncontrollingInterestMember2019-12-310001307954us-gaap:AccumulatedDefinedBenefitPlansAdjustmentIncludingPortionAttributableToNoncontrollingInterestMember2019-12-310001307954hun:AccumulatedOtherComprehensiveIncomeOtherNetIncludingPortionAttributableToNoncontrollingInterestMember2019-12-310001307954hun:AccumulatedOtherComprehensiveIncomeLossUnconsolidatedAffiliatesIncludingPortionAttributableToNoncontrollingInterestMember2019-12-310001307954us-gaap:TreasuryStockCommonMember2018-12-310001307954us-gaap:RetainedEarningsMember2018-12-310001307954us-gaap:NoncontrollingInterestMember2018-12-310001307954us-gaap:DeferredCompensationShareBasedPaymentsMember2018-12-310001307954us-gaap:AociIncludingPortionAttributableToNoncontrollingInterestMember2018-12-310001307954us-gaap:AociAttributableToNoncontrollingInterestMember2018-12-310001307954us-gaap:AdditionalPaidInCapitalMember2018-12-310001307954us-gaap:AccumulatedOtherComprehensiveIncomeMember2018-12-310001307954us-gaap:AccumulatedForeignCurrencyAdjustmentIncludingPortionAttributableToNoncontrollingInterestMember2018-12-310001307954us-gaap:AccumulatedDefinedBenefitPlansAdjustmentIncludingPortionAttributableToNoncontrollingInterestMember2018-12-310001307954hun:AccumulatedOtherComprehensiveIncomeOtherNetIncludingPortionAttributableToNoncontrollingInterestMember2018-12-310001307954hun:AccumulatedOtherComprehensiveIncomeLossUnconsolidatedAffiliatesIncludingPortionAttributableToNoncontrollingInterestMember2018-12-310001307954us-gaap:TreasuryStockCommonMember2017-12-310001307954us-gaap:NoncontrollingInterestMember2017-12-310001307954us-gaap:DeferredCompensationShareBasedPaymentsMember2017-12-310001307954us-gaap:AociAttributableToNoncontrollingInterestMember2017-12-310001307954us-gaap:AdditionalPaidInCapitalMember2017-12-310001307954us-gaap:AccumulatedForeignCurrencyAdjustmentIncludingPortionAttributableToNoncontrollingInterestMember2017-12-310001307954us-gaap:AccumulatedDefinedBenefitPlansAdjustmentIncludingPortionAttributableToNoncontrollingInterestMember2017-12-310001307954hun:AccumulatedOtherComprehensiveIncomeLossUnconsolidatedAffiliatesIncludingPortionAttributableToNoncontrollingInterestMember2017-12-310001307954us-gaap:TreasuryStockCommonMember2016-12-310001307954us-gaap:RetainedEarningsMember2016-12-310001307954us-gaap:NoncontrollingInterestMember2016-12-310001307954us-gaap:DeferredCompensationShareBasedPaymentsMember2016-12-310001307954us-gaap:AdditionalPaidInCapitalMember2016-12-310001307954us-gaap:AccumulatedOtherComprehensiveIncomeMember2016-12-310001307954srt:ParentCompanyMembersrt:ReportableLegalEntitiesMemberus-gaap:TreasuryStockCommonMember2019-12-310001307954srt:ParentCompanyMembersrt:ReportableLegalEntitiesMemberus-gaap:RetainedEarningsMember2019-12-310001307954srt:ParentCompanyMembersrt:ReportableLegalEntitiesMemberus-gaap:DeferredCompensationShareBasedPaymentsMember2019-12-310001307954srt:ParentCompanyMembersrt:ReportableLegalEntitiesMemberus-gaap:AdditionalPaidInCapitalMember2019-12-310001307954srt:ParentCompanyMembersrt:ReportableLegalEntitiesMemberus-gaap:AccumulatedOtherComprehensiveIncomeMember2019-12-310001307954srt:ParentCompanyMembersrt:ReportableLegalEntitiesMemberus-gaap:TreasuryStockCommonMember2018-12-310001307954srt:ParentCompanyMembersrt:ReportableLegalEntitiesMemberus-gaap:RetainedEarningsMember2018-12-310001307954srt:ParentCompanyMembersrt:ReportableLegalEntitiesMemberus-gaap:DeferredCompensationShareBasedPaymentsMember2018-12-310001307954srt:ParentCompanyMembersrt:ReportableLegalEntitiesMemberus-gaap:AdditionalPaidInCapitalMember2018-12-310001307954srt:ParentCompanyMembersrt:ReportableLegalEntitiesMemberus-gaap:AccumulatedOtherComprehensiveIncomeMember2018-12-310001307954srt:ParentCompanyMembersrt:ReportableLegalEntitiesMemberus-gaap:TreasuryStockCommonMember2017-12-310001307954srt:ParentCompanyMembersrt:ReportableLegalEntitiesMemberus-gaap:DeferredCompensationShareBasedPaymentsMember2017-12-310001307954srt:ParentCompanyMembersrt:ReportableLegalEntitiesMemberus-gaap:AdditionalPaidInCapitalMember2017-12-310001307954srt:ParentCompanyMembersrt:ReportableLegalEntitiesMemberus-gaap:TreasuryStockCommonMember2016-12-310001307954srt:ParentCompanyMembersrt:ReportableLegalEntitiesMemberus-gaap:RetainedEarningsMember2016-12-310001307954srt:ParentCompanyMembersrt:ReportableLegalEntitiesMemberus-gaap:DeferredCompensationShareBasedPaymentsMember2016-12-310001307954srt:ParentCompanyMembersrt:ReportableLegalEntitiesMemberus-gaap:AdditionalPaidInCapitalMember2016-12-310001307954srt:ParentCompanyMembersrt:ReportableLegalEntitiesMemberus-gaap:AccumulatedOtherComprehensiveIncomeMember2016-12-310001307954hun:VenatorMaterialsPLCMemberus-gaap:OverAllotmentOptionMember2018-01-030001307954us-gaap:EmployeeStockOptionMember2018-12-310001307954hun:HuntsmanCorporation2016StockIncentivePlanMember2019-12-310001307954hun:HuntsmanCorporationStockIncentivePlanMember2016-05-050001307954hun:HuntsmanCorporation2016StockIncentivePlanMember2016-05-050001307954us-gaap:PerformanceSharesMember2018-01-012018-12-310001307954us-gaap:PerformanceSharesMember2017-01-012017-12-310001307954srt:MaximumMemberus-gaap:EmployeeStockOptionMember2019-01-012019-12-310001307954hun:NonvestedSharesMember2018-01-012018-12-310001307954hun:NonvestedSharesMember2017-01-012017-12-310001307954hun:LiabilityAwardsMember2019-12-310001307954hun:EquityAwardsMember2019-12-310001307954hun:LiabilityAwardsMember2018-12-310001307954hun:EquityAwardsMember2018-12-310001307954hun:LiabilityAwardsMember2019-01-012019-12-310001307954hun:EquityAwardsMember2019-01-012019-12-310001307954us-gaap:StockCompensationPlanMember2019-01-012019-12-310001307954hun:HuntsmanInternationalLLCMemberhun:ThirdPartyCustomersMember2019-01-012019-12-310001307954hun:HuntsmanInternationalLLCMemberhun:RelatedPartyCustomersMember2019-01-012019-12-310001307954hun:ThirdPartyCustomersMember2019-01-012019-12-310001307954hun:RelatedPartyCustomersMember2019-01-012019-12-310001307954hun:OtherNationsMember2019-01-012019-12-310001307954country:US2019-01-012019-12-310001307954country:IN2019-01-012019-12-310001307954country:DE2019-01-012019-12-310001307954country:CN2019-01-012019-12-310001307954hun:HuntsmanInternationalLLCMemberhun:ThirdPartyCustomersMember2018-01-012018-12-310001307954hun:HuntsmanInternationalLLCMemberhun:RelatedPartyCustomersMember2018-01-012018-12-310001307954hun:ThirdPartyCustomersMember2018-01-012018-12-310001307954hun:RelatedPartyCustomersMember2018-01-012018-12-310001307954hun:OtherNationsMember2018-01-012018-12-310001307954country:US2018-01-012018-12-310001307954country:IN2018-01-012018-12-310001307954country:DE2018-01-012018-12-310001307954country:CN2018-01-012018-12-310001307954hun:HuntsmanInternationalLLCMemberhun:ThirdPartyCustomersMember2017-01-012017-12-310001307954hun:HuntsmanInternationalLLCMemberhun:RelatedPartyCustomersMember2017-01-012017-12-310001307954hun:ThirdPartyCustomersMember2017-01-012017-12-310001307954hun:RelatedPartyCustomersMember2017-01-012017-12-310001307954hun:OtherNationsMember2017-01-012017-12-310001307954hun:CorporateAndEliminationsMember2017-01-012017-12-310001307954country:US2017-01-012017-12-310001307954country:IN2017-01-012017-12-310001307954country:DE2017-01-012017-12-310001307954country:CN2017-01-012017-12-310001307954srt:EuropeMemberhun:TextileEffectsMember2019-01-012019-12-310001307954srt:EuropeMemberhun:PolyurethanesMember2019-01-012019-12-310001307954srt:EuropeMemberhun:PerformanceProductsMember2019-01-012019-12-310001307954srt:EuropeMemberhun:AdvancedMaterialsMember2019-01-012019-12-310001307954srt:AsiaPacificMemberhun:TextileEffectsMember2019-01-012019-12-310001307954srt:AsiaPacificMemberhun:PolyurethanesMember2019-01-012019-12-310001307954srt:AsiaPacificMemberhun:PerformanceProductsMember2019-01-012019-12-310001307954srt:AsiaPacificMemberhun:AdvancedMaterialsMember2019-01-012019-12-310001307954hun:UnitedStatesAndCanadaMemberhun:TextileEffectsMember2019-01-012019-12-310001307954hun:UnitedStatesAndCanadaMemberhun:PolyurethanesMember2019-01-012019-12-310001307954hun:UnitedStatesAndCanadaMemberhun:PerformanceProductsMember2019-01-012019-12-310001307954hun:UnitedStatesAndCanadaMemberhun:AdvancedMaterialsMember2019-01-012019-12-310001307954hun:TextileChemicalsAndDyesAndDigitalInksMemberhun:TextileEffectsMember2019-01-012019-12-310001307954hun:SpecialtyMemberhun:AdvancedMaterialsMember2019-01-012019-12-310001307954hun:PlaceOtherThanAsiaPacificEuropeUnitedStatesAndCanadaMemberhun:TextileEffectsMember2019-01-012019-12-310001307954hun:PlaceOtherThanAsiaPacificEuropeUnitedStatesAndCanadaMemberhun:PolyurethanesMember2019-01-012019-12-310001307954hun:PlaceOtherThanAsiaPacificEuropeUnitedStatesAndCanadaMemberhun:PerformanceProductsMember2019-01-012019-12-310001307954hun:PlaceOtherThanAsiaPacificEuropeUnitedStatesAndCanadaMemberhun:AdvancedMaterialsMember2019-01-012019-12-310001307954hun:NonSpecialtyMemberhun:AdvancedMaterialsMember2019-01-012019-12-310001307954hun:MdiUrethanesMemberhun:PolyurethanesMember2019-01-012019-12-310001307954hun:DifferentiatedMemberhun:PerformanceProductsMember2019-01-012019-12-310001307954hun:CorporateAndEliminationsMembersrt:EuropeMember2019-01-012019-12-310001307954hun:CorporateAndEliminationsMembersrt:AsiaPacificMember2019-01-012019-12-310001307954hun:CorporateAndEliminationsMemberhun:UnitedStatesAndCanadaMember2019-01-012019-12-310001307954hun:CorporateAndEliminationsMemberhun:PlaceOtherThanAsiaPacificEuropeUnitedStatesAndCanadaMember2019-01-012019-12-310001307954srt:EuropeMember2019-01-012019-12-310001307954srt:AsiaPacificMember2019-01-012019-12-310001307954hun:UnitedStatesAndCanadaMember2019-01-012019-12-310001307954hun:TextileEffectsMember2019-01-012019-12-310001307954hun:TextileChemicalsAndDyesAndDigitalInksMember2019-01-012019-12-310001307954hun:SpecialtyMember2019-01-012019-12-310001307954hun:PolyurethanesMember2019-01-012019-12-310001307954hun:PlaceOtherThanAsiaPacificEuropeUnitedStatesAndCanadaMember2019-01-012019-12-310001307954hun:PerformanceProductsMember2019-01-012019-12-310001307954hun:NonSpecialtyMember2019-01-012019-12-310001307954hun:MdiUrethanesMember2019-01-012019-12-310001307954hun:DifferentiatedMember2019-01-012019-12-310001307954hun:CorporateAndEliminationsMember2019-01-012019-12-310001307954hun:AdvancedMaterialsMember2019-01-012019-12-310001307954srt:EuropeMemberhun:TextileEffectsMember2018-01-012018-12-310001307954srt:EuropeMemberhun:PolyurethanesMember2018-01-012018-12-310001307954srt:EuropeMemberhun:PerformanceProductsMember2018-01-012018-12-310001307954srt:EuropeMemberhun:AdvancedMaterialsMember2018-01-012018-12-310001307954srt:AsiaPacificMemberhun:TextileEffectsMember2018-01-012018-12-310001307954srt:AsiaPacificMemberhun:PolyurethanesMember2018-01-012018-12-310001307954srt:AsiaPacificMemberhun:PerformanceProductsMember2018-01-012018-12-310001307954srt:AsiaPacificMemberhun:AdvancedMaterialsMember2018-01-012018-12-310001307954hun:UnitedStatesAndCanadaMemberhun:TextileEffectsMember2018-01-012018-12-310001307954hun:UnitedStatesAndCanadaMemberhun:PolyurethanesMember2018-01-012018-12-310001307954hun:UnitedStatesAndCanadaMemberhun:PerformanceProductsMember2018-01-012018-12-310001307954hun:UnitedStatesAndCanadaMemberhun:AdvancedMaterialsMember2018-01-012018-12-310001307954hun:TextileChemicalsAndDyesAndDigitalInksMemberhun:TextileEffectsMember2018-01-012018-12-310001307954hun:SpecialtyMemberhun:AdvancedMaterialsMember2018-01-012018-12-310001307954hun:PlaceOtherThanAsiaPacificEuropeUnitedStatesAndCanadaMemberhun:TextileEffectsMember2018-01-012018-12-310001307954hun:PlaceOtherThanAsiaPacificEuropeUnitedStatesAndCanadaMemberhun:PolyurethanesMember2018-01-012018-12-310001307954hun:PlaceOtherThanAsiaPacificEuropeUnitedStatesAndCanadaMemberhun:PerformanceProductsMember2018-01-012018-12-310001307954hun:PlaceOtherThanAsiaPacificEuropeUnitedStatesAndCanadaMemberhun:AdvancedMaterialsMember2018-01-012018-12-310001307954hun:NonSpecialtyMemberhun:AdvancedMaterialsMember2018-01-012018-12-310001307954hun:MdiUrethanesMemberhun:PolyurethanesMember2018-01-012018-12-310001307954hun:DifferentiatedMemberhun:PerformanceProductsMember2018-01-012018-12-310001307954hun:CorporateAndEliminationsMembersrt:EuropeMember2018-01-012018-12-310001307954hun:CorporateAndEliminationsMembersrt:AsiaPacificMember2018-01-012018-12-310001307954hun:CorporateAndEliminationsMemberhun:UnitedStatesAndCanadaMember2018-01-012018-12-310001307954hun:CorporateAndEliminationsMemberhun:PlaceOtherThanAsiaPacificEuropeUnitedStatesAndCanadaMember2018-01-012018-12-310001307954srt:EuropeMember2018-01-012018-12-310001307954srt:AsiaPacificMember2018-01-012018-12-310001307954hun:UnitedStatesAndCanadaMember2018-01-012018-12-310001307954hun:TextileEffectsMember2018-01-012018-12-310001307954hun:TextileChemicalsAndDyesAndDigitalInksMember2018-01-012018-12-310001307954hun:SpecialtyMember2018-01-012018-12-310001307954hun:PolyurethanesMember2018-01-012018-12-310001307954hun:PlaceOtherThanAsiaPacificEuropeUnitedStatesAndCanadaMember2018-01-012018-12-310001307954hun:PerformanceProductsMember2018-01-012018-12-310001307954hun:NonSpecialtyMember2018-01-012018-12-310001307954hun:MdiUrethanesMember2018-01-012018-12-310001307954hun:DifferentiatedMember2018-01-012018-12-310001307954hun:CorporateAndEliminationsMember2018-01-012018-12-310001307954hun:AdvancedMaterialsMember2018-01-012018-12-310001307954hun:CorporateInitiativesMemberhun:CorporateAndReconcilingItemsMember2018-01-012018-12-310001307954us-gaap:OperatingSegmentsMemberhun:BaselSwitzerlandMemberhun:NonCancelableLeaseCostAndContractTerminationCostsMemberhun:TextileEffectsMember2017-01-012017-12-310001307954us-gaap:OperatingSegmentsMemberhun:BaselSwitzerlandMemberhun:DemolitionAndDecommissioningMemberhun:TextileEffectsMember2017-01-012017-12-310001307954us-gaap:OperatingSegmentsMemberus-gaap:EmployeeSeveranceMemberhun:TextileEffectsMember2017-01-012017-12-310001307954us-gaap:OperatingSegmentsMemberhun:BaselSwitzerlandMemberhun:TextileEffectsMember2017-01-012017-12-310001307954srt:AffiliatedEntityMember2019-01-012019-12-310001307954srt:AffiliatedEntityMember2018-01-012018-12-310001307954srt:AffiliatedEntityMember2017-01-012017-12-310001307954hun:HuntsmanInternationalLLCMemberus-gaap:AccumulatedDefinedBenefitPlansAdjustmentIncludingPortionAttributableToNoncontrollingInterestMemberus-gaap:SegmentDiscontinuedOperationsMember2019-01-012019-12-310001307954us-gaap:AccumulatedDefinedBenefitPlansAdjustmentNetGainLossIncludingPortionAttributableToNoncontrollingInterestMemberus-gaap:SegmentDiscontinuedOperationsMember2019-01-012019-12-310001307954us-gaap:AccumulatedDefinedBenefitPlansAdjustmentIncludingPortionAttributableToNoncontrollingInterestMemberus-gaap:SegmentDiscontinuedOperationsMember2019-01-012019-12-310001307954hun:HuntsmanInternationalLLCMemberus-gaap:AccumulatedDefinedBenefitPlansAdjustmentNetPriorServiceIncludingPortionAttributableToNoncontrollingInterestMember2019-01-012019-12-310001307954hun:HuntsmanInternationalLLCMemberus-gaap:AccumulatedDefinedBenefitPlansAdjustmentNetGainLossIncludingPortionAttributableToNoncontrollingInterestMember2019-01-012019-12-310001307954hun:HuntsmanInternationalLLCMemberhun:AccumulatedDefinedBenefitPlansAdjustmentSettlementGainLossAttributableToNoncontrollingInterestMember2019-01-012019-12-310001307954us-gaap:AccumulatedDefinedBenefitPlansAdjustmentNetPriorServiceIncludingPortionAttributableToNoncontrollingInterestMember2019-01-012019-12-310001307954hun:AccumulatedDefinedBenefitPlansAdjustmentSettlementGainLossAttributableToNoncontrollingInterestMember2019-01-012019-12-310001307954hun:HuntsmanInternationalLLCMemberus-gaap:AccumulatedDefinedBenefitPlansAdjustmentIncludingPortionAttributableToNoncontrollingInterestMemberus-gaap:SegmentDiscontinuedOperationsMember2018-01-012018-12-310001307954us-gaap:AccumulatedDefinedBenefitPlansAdjustmentNetGainLossIncludingPortionAttributableToNoncontrollingInterestMemberus-gaap:SegmentDiscontinuedOperationsMember2018-01-012018-12-310001307954us-gaap:AccumulatedDefinedBenefitPlansAdjustmentIncludingPortionAttributableToNoncontrollingInterestMemberus-gaap:SegmentDiscontinuedOperationsMember2018-01-012018-12-310001307954hun:HuntsmanInternationalLLCMemberus-gaap:AccumulatedDefinedBenefitPlansAdjustmentNetPriorServiceIncludingPortionAttributableToNoncontrollingInterestMember2018-01-012018-12-310001307954hun:HuntsmanInternationalLLCMemberus-gaap:AccumulatedDefinedBenefitPlansAdjustmentNetGainLossIncludingPortionAttributableToNoncontrollingInterestMember2018-01-012018-12-310001307954hun:HuntsmanInternationalLLCMemberhun:AccumulatedDefinedBenefitPlansAdjustmentSettlementGainLossAttributableToNoncontrollingInterestMember2018-01-012018-12-310001307954us-gaap:AccumulatedDefinedBenefitPlansAdjustmentNetPriorServiceIncludingPortionAttributableToNoncontrollingInterestMember2018-01-012018-12-310001307954hun:AccumulatedDefinedBenefitPlansAdjustmentSettlementGainLossAttributableToNoncontrollingInterestMember2018-01-012018-12-310001307954hun:HuntsmanInternationalLLCMemberus-gaap:AccumulatedDefinedBenefitPlansAdjustmentIncludingPortionAttributableToNoncontrollingInterestMemberus-gaap:SegmentDiscontinuedOperationsMember2017-01-012017-12-310001307954us-gaap:AccumulatedDefinedBenefitPlansAdjustmentNetGainLossIncludingPortionAttributableToNoncontrollingInterestMemberus-gaap:SegmentDiscontinuedOperationsMember2017-01-012017-12-310001307954us-gaap:AccumulatedDefinedBenefitPlansAdjustmentIncludingPortionAttributableToNoncontrollingInterestMemberus-gaap:SegmentDiscontinuedOperationsMember2017-01-012017-12-310001307954hun:HuntsmanInternationalLLCMemberus-gaap:AccumulatedDefinedBenefitPlansAdjustmentNetPriorServiceIncludingPortionAttributableToNoncontrollingInterestMember2017-01-012017-12-310001307954hun:HuntsmanInternationalLLCMemberus-gaap:AccumulatedDefinedBenefitPlansAdjustmentNetGainLossIncludingPortionAttributableToNoncontrollingInterestMember2017-01-012017-12-310001307954us-gaap:AccumulatedDefinedBenefitPlansAdjustmentNetPriorServiceIncludingPortionAttributableToNoncontrollingInterestMember2017-01-012017-12-310001307954srt:MinimumMemberhun:PlantAndEquipmentMember2019-01-012019-12-310001307954srt:MinimumMemberhun:FurnitureFixturesAndLeaseholdImprovementsMember2019-01-012019-12-310001307954srt:MinimumMemberhun:BuildingsAndEquipmentMember2019-01-012019-12-310001307954srt:MaximumMemberhun:PlantAndEquipmentMember2019-01-012019-12-310001307954srt:MaximumMemberhun:FurnitureFixturesAndLeaseholdImprovementsMember2019-01-012019-12-310001307954srt:MaximumMemberhun:BuildingsAndEquipmentMember2019-01-012019-12-310001307954hun:OtherNationsMember2019-12-310001307954country:US2019-12-310001307954country:SG2019-12-310001307954country:SA2019-12-310001307954country:NL2019-12-310001307954country:DE2019-12-310001307954country:CN2019-12-310001307954country:CH2019-12-310001307954hun:OtherNationsMember2018-12-310001307954country:US2018-12-310001307954country:SG2018-12-310001307954country:SA2018-12-310001307954country:NL2018-12-310001307954country:DE2018-12-310001307954country:CN2018-12-310001307954country:CH2018-12-310001307954hun:HuntsmanInternationalLLCMemberus-gaap:LandMember2019-12-310001307954hun:HuntsmanInternationalLLCMemberus-gaap:EquipmentMember2019-12-310001307954hun:HuntsmanInternationalLLCMemberus-gaap:ConstructionInProgressMember2019-12-310001307954hun:HuntsmanInternationalLLCMemberus-gaap:BuildingMember2019-12-310001307954us-gaap:LandMember2019-12-310001307954us-gaap:EquipmentMember2019-12-310001307954us-gaap:ConstructionInProgressMember2019-12-310001307954us-gaap:BuildingMember2019-12-310001307954hun:HuntsmanInternationalLLCMemberus-gaap:LandMember2018-12-310001307954hun:HuntsmanInternationalLLCMemberus-gaap:EquipmentMember2018-12-310001307954hun:HuntsmanInternationalLLCMemberus-gaap:ConstructionInProgressMember2018-12-310001307954hun:HuntsmanInternationalLLCMemberus-gaap:BuildingMember2018-12-310001307954us-gaap:LandMember2018-12-310001307954us-gaap:EquipmentMember2018-12-310001307954us-gaap:ConstructionInProgressMember2018-12-310001307954us-gaap:BuildingMember2018-12-310001307954us-gaap:CrossCurrencyInterestRateContractMemberus-gaap:DesignatedAsHedgingInstrumentMember2017-08-012017-08-310001307954us-gaap:OperatingSegmentsMemberhun:BaselSwitzerlandMembersrt:ScenarioForecastMemberhun:NonCancelableLeaseCostAndContractTerminationCostsMemberhun:TextileEffectsMember2023-01-012023-12-310001307954us-gaap:OperatingSegmentsMemberhun:BaselSwitzerlandMemberhun:NonCancelableLeaseCostAndContractTerminationCostsMemberhun:TextileEffectsMember2019-01-012019-12-310001307954hun:HuntsmanInternationalLLCMemberus-gaap:AccumulatedDefinedBenefitPlansAdjustmentIncludingPortionAttributableToNoncontrollingInterestMember2017-01-012017-12-310001307954us-gaap:AccumulatedDefinedBenefitPlansAdjustmentIncludingPortionAttributableToNoncontrollingInterestMember2017-01-012017-12-310001307954srt:ParentCompanyMembersrt:ReportableLegalEntitiesMemberus-gaap:AccumulatedOtherComprehensiveIncomeMember2019-01-012019-12-310001307954srt:ParentCompanyMembersrt:ReportableLegalEntitiesMemberus-gaap:AccumulatedOtherComprehensiveIncomeMember2017-01-012017-12-310001307954hun:HuntsmanInternationalLLCMemberus-gaap:AccumulatedOtherComprehensiveIncomeMember2017-01-012017-12-310001307954us-gaap:AccumulatedOtherComprehensiveIncomeMember2017-01-012017-12-310001307954hun:HuntsmanInternationalLLCMemberus-gaap:AccumulatedForeignCurrencyAdjustmentIncludingPortionAttributableToNoncontrollingInterestMember2017-01-012017-12-310001307954us-gaap:AccumulatedForeignCurrencyAdjustmentIncludingPortionAttributableToNoncontrollingInterestMember2017-01-012017-12-310001307954hun:VenatorMaterialsPLCMembercountry:AU2019-12-310001307954srt:RestatementAdjustmentMemberus-gaap:AccountingStandardsUpdate201602Member2019-01-010001307954us-gaap:SellingGeneralAndAdministrativeExpensesMember2019-01-012019-12-310001307954us-gaap:ResearchAndDevelopmentExpenseMember2019-01-012019-12-310001307954us-gaap:CostOfSalesMember2019-01-012019-12-310001307954hun:VenatorMaterialsPLCMember2018-01-030001307954hun:InterestRateSixYearContract2019Memberus-gaap:DesignatedAsHedgingInstrumentMember2019-01-092019-01-090001307954hun:HuntsmanInternationalLLCMemberus-gaap:RetainedEarningsMember2019-12-310001307954hun:HuntsmanInternationalLLCMemberus-gaap:NoncontrollingInterestMember2019-12-310001307954hun:HuntsmanInternationalLLCMemberus-gaap:AociIncludingPortionAttributableToNoncontrollingInterestMember2019-12-310001307954hun:HuntsmanInternationalLLCMemberus-gaap:AociAttributableToNoncontrollingInterestMember2019-12-310001307954hun:HuntsmanInternationalLLCMemberus-gaap:AccumulatedOtherComprehensiveIncomeMember2019-12-310001307954hun:HuntsmanInternationalLLCMemberus-gaap:AccumulatedForeignCurrencyAdjustmentIncludingPortionAttributableToNoncontrollingInterestMember2019-12-310001307954hun:HuntsmanInternationalLLCMemberus-gaap:AccumulatedDefinedBenefitPlansAdjustmentIncludingPortionAttributableToNoncontrollingInterestMember2019-12-310001307954hun:HuntsmanInternationalLLCMemberhun:AccumulatedOtherComprehensiveIncomeLossUnconsolidatedAffiliatesIncludingPortionAttributableToNoncontrollingInterestMember2019-12-310001307954hun:HuntsmanInternationalLLCMemberus-gaap:RetainedEarningsMember2018-12-310001307954hun:HuntsmanInternationalLLCMemberus-gaap:NoncontrollingInterestMember2018-12-310001307954hun:HuntsmanInternationalLLCMemberus-gaap:AociIncludingPortionAttributableToNoncontrollingInterestMember2018-12-310001307954hun:HuntsmanInternationalLLCMemberus-gaap:AociAttributableToNoncontrollingInterestMember2018-12-310001307954hun:HuntsmanInternationalLLCMemberus-gaap:AccumulatedOtherComprehensiveIncomeMember2018-12-310001307954hun:HuntsmanInternationalLLCMemberus-gaap:AccumulatedForeignCurrencyAdjustmentIncludingPortionAttributableToNoncontrollingInterestMember2018-12-310001307954hun:HuntsmanInternationalLLCMemberus-gaap:AccumulatedDefinedBenefitPlansAdjustmentIncludingPortionAttributableToNoncontrollingInterestMember2018-12-310001307954hun:HuntsmanInternationalLLCMemberhun:AccumulatedOtherComprehensiveIncomeOtherNetIncludingPortionAttributableToNoncontrollingInterestMember2018-12-310001307954hun:HuntsmanInternationalLLCMemberhun:AccumulatedOtherComprehensiveIncomeLossUnconsolidatedAffiliatesIncludingPortionAttributableToNoncontrollingInterestMember2018-12-310001307954hun:HuntsmanInternationalLLCMemberus-gaap:NoncontrollingInterestMember2017-12-310001307954hun:HuntsmanInternationalLLCMemberus-gaap:RetainedEarningsMember2016-12-310001307954hun:HuntsmanInternationalLLCMemberus-gaap:NoncontrollingInterestMember2016-12-310001307954hun:HuntsmanInternationalLLCMemberus-gaap:AccumulatedOtherComprehensiveIncomeMember2016-12-310001307954us-gaap:VariableInterestEntityPrimaryBeneficiaryMember2019-01-012019-12-310001307954us-gaap:VariableInterestEntityPrimaryBeneficiaryMember2018-01-012018-12-310001307954us-gaap:VariableInterestEntityPrimaryBeneficiaryMember2017-01-012017-12-310001307954hun:HuntsmanInternationalLLCMember2019-04-012019-06-300001307954hun:HuntsmanInternationalLLCMemberhun:PriorCreditFacilityMember2018-05-212018-05-210001307954srt:MinimumMemberus-gaap:TrademarksMember2019-01-012019-12-310001307954srt:MinimumMemberus-gaap:OtherIntangibleAssetsMember2019-01-012019-12-310001307954srt:MinimumMemberhun:PatentsAndTechnologyMember2019-01-012019-12-310001307954srt:MinimumMemberhun:LicensingAndOtherAgreementsMember2019-01-012019-12-310001307954srt:MaximumMemberus-gaap:TrademarksMember2019-01-012019-12-310001307954srt:MaximumMemberus-gaap:OtherIntangibleAssetsMember2019-01-012019-12-310001307954srt:MaximumMemberhun:PatentsAndTechnologyMember2019-01-012019-12-310001307954srt:MaximumMemberhun:LicensingAndOtherAgreementsMember2019-01-012019-12-310001307954hun:HuntsmanInternationalLLCMemberus-gaap:OtherIntangibleAssetsMember2019-12-310001307954hun:HuntsmanInternationalLLCMemberus-gaap:NoncompeteAgreementsMember2019-12-310001307954hun:HuntsmanInternationalLLCMemberus-gaap:LicensingAgreementsMember2019-12-310001307954hun:HuntsmanInternationalLLCMemberhun:PatentsTrademarksAndTechnologyMember2019-12-310001307954us-gaap:OtherIntangibleAssetsMember2019-12-310001307954us-gaap:NoncompeteAgreementsMember2019-12-310001307954us-gaap:LicensingAgreementsMember2019-12-310001307954hun:PatentsTrademarksAndTechnologyMember2019-12-310001307954hun:HuntsmanInternationalLLCMemberus-gaap:OtherIntangibleAssetsMember2018-12-310001307954hun:HuntsmanInternationalLLCMemberus-gaap:NoncompeteAgreementsMember2018-12-310001307954hun:HuntsmanInternationalLLCMemberus-gaap:LicensingAgreementsMember2018-12-310001307954hun:HuntsmanInternationalLLCMemberhun:PatentsTrademarksAndTechnologyMember2018-12-310001307954us-gaap:OtherIntangibleAssetsMember2018-12-310001307954us-gaap:NoncompeteAgreementsMember2018-12-310001307954us-gaap:LicensingAgreementsMember2018-12-310001307954hun:PatentsTrademarksAndTechnologyMember2018-12-310001307954us-gaap:FairValueMeasurementsRecurringMember2019-01-012019-12-310001307954us-gaap:FairValueMeasurementsRecurringMember2018-01-012018-12-310001307954hun:VenatorMaterialsPLCMember2018-12-312018-12-310001307954hun:VenatorMaterialsPLCMemberhun:ForwardSwapMember2018-12-012018-12-310001307954hun:VenatorMaterialsPLCMemberhun:ForwardSwapMember2019-01-012019-03-310001307954us-gaap:FairValueInputsLevel1Memberus-gaap:FairValueMeasurementsRecurringMember2019-12-310001307954us-gaap:FairValueMeasurementsRecurringMember2019-12-310001307954hun:UnconsolidatedAffiliatesMember2019-01-012019-12-310001307954hun:UnconsolidatedAffiliatesMember2018-01-012018-12-310001307954hun:UnconsolidatedAffiliatesMember2017-01-012017-12-310001307954hun:UnconsolidatedAffiliatesMember2019-12-310001307954hun:UnconsolidatedAffiliatesMember2018-12-310001307954hun:VenatorMaterialsPlcMember2018-12-310001307954hun:NanjingJinlingHuntsmanNewMaterialCoLtdMember2018-12-310001307954hun:JurongNingwuNewMaterialsDevelopmentCoLtdMember2018-12-310001307954hun:BASFHuntsmanShanghaiIsocyanateInvestmentBVMember2018-12-310001307954hun:VenatorMaterialsPlcMember2019-12-310001307954hun:NanjingJinlingHuntsmanNewMaterialCoLtdMember2019-12-310001307954hun:JurongNingwuNewMaterialsDevelopmentCoLtdMember2019-12-310001307954hun:BASFHuntsmanShanghaiIsocyanateInvestmentBVMember2019-12-310001307954us-gaap:EmployeeStockOptionMember2018-01-012018-12-310001307954us-gaap:EmployeeStockOptionMember2017-01-012017-12-310001307954us-gaap:EmployeeStockOptionMember2019-01-012019-12-310001307954hun:NonvestedSharesMember2019-01-012019-12-310001307954us-gaap:EmployeeStockOptionMember2019-12-310001307954hun:NonvestedSharesMember2019-12-310001307954srt:ParentCompanyMembersrt:ReportableLegalEntitiesMemberus-gaap:RetainedEarningsMember2019-01-012019-12-310001307954us-gaap:RetainedEarningsMember2019-01-012019-12-310001307954srt:ParentCompanyMembersrt:ReportableLegalEntitiesMemberus-gaap:RetainedEarningsMember2017-01-012017-12-310001307954us-gaap:RetainedEarningsMember2017-01-012017-12-310001307954us-gaap:DisposalGroupDisposedOfBySaleNotDiscontinuedOperationsMemberhun:BaselSwitzerlandProductionFacilitiesAndSupportOfficesMember2019-07-012019-09-300001307954us-gaap:DiscontinuedOperationsDisposedOfByMeansOtherThanSaleMemberhun:PigmentsAndAdditivesBusinessMember2018-10-012018-12-310001307954hun:FiveYearCrossCurrencyInterestRateContractMemberus-gaap:DesignatedAsHedgingInstrumentMember2014-11-300001307954hun:EightYearsCrossCurrencyInterestRateContractMemberus-gaap:DesignatedAsHedgingInstrumentMember2014-11-300001307954us-gaap:ForeignExchangeContractMember2019-12-310001307954us-gaap:ForeignExchangeContractMember2018-12-310001307954us-gaap:CrossCurrencyInterestRateContractMemberus-gaap:DesignatedAsHedgingInstrumentMember2014-11-300001307954hun:InterestRateSixYearContract2019Memberus-gaap:DesignatedAsHedgingInstrumentMember2019-01-090001307954srt:MaximumMemberhun:SalaryDeferralPlanMembercountry:US2019-01-012019-12-310001307954srt:MaximumMemberhun:HuntsmanUkPensionPlanNewHiresMemberus-gaap:ForeignPlanMember2019-01-012019-12-310001307954us-gaap:ForeignPlanMember2019-01-012019-12-310001307954country:US2019-01-012019-12-310001307954us-gaap:ForeignPlanMember2018-01-012018-12-310001307954country:US2018-01-012018-12-310001307954us-gaap:ForeignPlanMember2017-01-012017-12-310001307954country:US2017-01-012017-12-310001307954us-gaap:FixedIncomeFundsMemberus-gaap:ForeignPlanMemberus-gaap:PensionPlansDefinedBenefitMember2019-12-310001307954us-gaap:FixedIncomeFundsMembercountry:USus-gaap:PensionPlansDefinedBenefitMember2019-12-310001307954us-gaap:DefinedBenefitPlanEquitySecuritiesMemberus-gaap:ForeignPlanMemberus-gaap:PensionPlansDefinedBenefitMember2019-12-310001307954us-gaap:DefinedBenefitPlanEquitySecuritiesMembercountry:USus-gaap:PensionPlansDefinedBenefitMember2019-12-310001307954us-gaap:CashMemberus-gaap:ForeignPlanMemberus-gaap:PensionPlansDefinedBenefitMember2019-12-310001307954hun:RealEstateAndOtherMemberus-gaap:ForeignPlanMemberus-gaap:PensionPlansDefinedBenefitMember2019-12-310001307954hun:RealEstateAndOtherMembercountry:USus-gaap:PensionPlansDefinedBenefitMember2019-12-310001307954us-gaap:FixedIncomeFundsMemberus-gaap:ForeignPlanMemberus-gaap:PensionPlansDefinedBenefitMember2018-12-310001307954us-gaap:FixedIncomeFundsMembercountry:USus-gaap:PensionPlansDefinedBenefitMember2018-12-310001307954us-gaap:DefinedBenefitPlanEquitySecuritiesMemberus-gaap:ForeignPlanMemberus-gaap:PensionPlansDefinedBenefitMember2018-12-310001307954us-gaap:DefinedBenefitPlanEquitySecuritiesMembercountry:USus-gaap:PensionPlansDefinedBenefitMember2018-12-310001307954us-gaap:CashMemberus-gaap:ForeignPlanMemberus-gaap:PensionPlansDefinedBenefitMember2018-12-310001307954hun:RealEstateAndOtherMemberus-gaap:ForeignPlanMemberus-gaap:PensionPlansDefinedBenefitMember2018-12-310001307954hun:RealEstateAndOtherMembercountry:USus-gaap:PensionPlansDefinedBenefitMember2018-12-310001307954srt:ScenarioForecastMemberus-gaap:FixedIncomeFundsMemberus-gaap:ForeignPlanMemberus-gaap:PensionPlansDefinedBenefitMember2020-12-310001307954srt:ScenarioForecastMemberus-gaap:FixedIncomeFundsMembercountry:USus-gaap:PensionPlansDefinedBenefitMember2020-12-310001307954srt:ScenarioForecastMemberus-gaap:DefinedBenefitPlanEquitySecuritiesMemberus-gaap:ForeignPlanMemberus-gaap:PensionPlansDefinedBenefitMember2020-12-310001307954srt:ScenarioForecastMemberus-gaap:DefinedBenefitPlanEquitySecuritiesMembercountry:USus-gaap:PensionPlansDefinedBenefitMember2020-12-310001307954srt:ScenarioForecastMemberus-gaap:CashMemberus-gaap:ForeignPlanMemberus-gaap:PensionPlansDefinedBenefitMember2020-12-310001307954srt:ScenarioForecastMemberus-gaap:CashMembercountry:USus-gaap:PensionPlansDefinedBenefitMember2020-12-310001307954srt:ScenarioForecastMemberhun:RealEstateAndOtherMemberus-gaap:ForeignPlanMemberus-gaap:PensionPlansDefinedBenefitMember2020-12-310001307954srt:ScenarioForecastMemberhun:RealEstateAndOtherMembercountry:USus-gaap:PensionPlansDefinedBenefitMember2020-12-310001307954srt:ScenarioForecastMemberus-gaap:ForeignPlanMemberus-gaap:PensionPlansDefinedBenefitMember2020-12-310001307954srt:ScenarioForecastMembercountry:USus-gaap:PensionPlansDefinedBenefitMember2020-12-310001307954us-gaap:FixedIncomeFundsMemberus-gaap:FairValueMeasurementsRecurringMemberus-gaap:ForeignPlanMemberus-gaap:PensionPlansDefinedBenefitMember2019-12-310001307954us-gaap:FixedIncomeFundsMemberus-gaap:FairValueMeasurementsRecurringMembercountry:USus-gaap:PensionPlansDefinedBenefitMember2019-12-310001307954us-gaap:FixedIncomeFundsMemberus-gaap:FairValueInputsLevel2Memberus-gaap:ForeignPlanMemberus-gaap:PensionPlansDefinedBenefitMember2019-12-310001307954us-gaap:FixedIncomeFundsMemberus-gaap:FairValueInputsLevel2Membercountry:USus-gaap:PensionPlansDefinedBenefitMember2019-12-310001307954us-gaap:FixedIncomeFundsMemberus-gaap:FairValueInputsLevel1Memberus-gaap:ForeignPlanMemberus-gaap:PensionPlansDefinedBenefitMember2019-12-310001307954us-gaap:FixedIncomeFundsMemberus-gaap:FairValueInputsLevel1Membercountry:USus-gaap:PensionPlansDefinedBenefitMember2019-12-310001307954us-gaap:DefinedBenefitPlanEquitySecuritiesMemberus-gaap:FairValueMeasurementsRecurringMemberus-gaap:ForeignPlanMemberus-gaap:PensionPlansDefinedBenefitMember2019-12-310001307954us-gaap:DefinedBenefitPlanEquitySecuritiesMemberus-gaap:FairValueMeasurementsRecurringMembercountry:USus-gaap:PensionPlansDefinedBenefitMember2019-12-310001307954us-gaap:DefinedBenefitPlanEquitySecuritiesMemberus-gaap:FairValueInputsLevel2Memberus-gaap:ForeignPlanMemberus-gaap:PensionPlansDefinedBenefitMember2019-12-310001307954us-gaap:DefinedBenefitPlanEquitySecuritiesMemberus-gaap:FairValueInputsLevel2Membercountry:USus-gaap:PensionPlansDefinedBenefitMember2019-12-310001307954us-gaap:DefinedBenefitPlanEquitySecuritiesMemberus-gaap:FairValueInputsLevel1Memberus-gaap:ForeignPlanMemberus-gaap:PensionPlansDefinedBenefitMember2019-12-310001307954us-gaap:DefinedBenefitPlanEquitySecuritiesMemberus-gaap:FairValueInputsLevel1Membercountry:USus-gaap:PensionPlansDefinedBenefitMember2019-12-310001307954us-gaap:CashMemberus-gaap:FairValueMeasurementsRecurringMemberus-gaap:ForeignPlanMemberus-gaap:PensionPlansDefinedBenefitMember2019-12-310001307954us-gaap:CashMemberus-gaap:FairValueInputsLevel2Memberus-gaap:ForeignPlanMemberus-gaap:PensionPlansDefinedBenefitMember2019-12-310001307954us-gaap:CashMemberus-gaap:FairValueInputsLevel1Memberus-gaap:ForeignPlanMemberus-gaap:PensionPlansDefinedBenefitMember2019-12-310001307954hun:RealEstateAndOtherMemberus-gaap:FairValueMeasurementsRecurringMemberus-gaap:ForeignPlanMemberus-gaap:PensionPlansDefinedBenefitMember2019-12-310001307954hun:RealEstateAndOtherMemberus-gaap:FairValueMeasurementsRecurringMembercountry:USus-gaap:PensionPlansDefinedBenefitMember2019-12-310001307954hun:RealEstateAndOtherMemberus-gaap:FairValueInputsLevel3Memberus-gaap:ForeignPlanMemberus-gaap:PensionPlansDefinedBenefitMember2019-12-310001307954hun:RealEstateAndOtherMemberus-gaap:FairValueInputsLevel3Membercountry:USus-gaap:PensionPlansDefinedBenefitMember2019-12-310001307954hun:RealEstateAndOtherMemberus-gaap:FairValueInputsLevel2Memberus-gaap:ForeignPlanMemberus-gaap:PensionPlansDefinedBenefitMember2019-12-310001307954hun:RealEstateAndOtherMemberus-gaap:FairValueInputsLevel1Memberus-gaap:ForeignPlanMemberus-gaap:PensionPlansDefinedBenefitMember2019-12-310001307954us-gaap:FairValueMeasurementsRecurringMemberus-gaap:ForeignPlanMemberus-gaap:PensionPlansDefinedBenefitMember2019-12-310001307954us-gaap:FairValueMeasurementsRecurringMembercountry:USus-gaap:PensionPlansDefinedBenefitMember2019-12-310001307954us-gaap:FairValueInputsLevel3Memberus-gaap:ForeignPlanMemberus-gaap:PensionPlansDefinedBenefitMember2019-12-310001307954us-gaap:FairValueInputsLevel3Membercountry:USus-gaap:PensionPlansDefinedBenefitMember2019-12-310001307954us-gaap:FairValueInputsLevel2Memberus-gaap:ForeignPlanMemberus-gaap:PensionPlansDefinedBenefitMember2019-12-310001307954us-gaap:FairValueInputsLevel2Membercountry:USus-gaap:PensionPlansDefinedBenefitMember2019-12-310001307954us-gaap:FairValueInputsLevel1Memberus-gaap:ForeignPlanMemberus-gaap:PensionPlansDefinedBenefitMember2019-12-310001307954us-gaap:FairValueInputsLevel1Membercountry:USus-gaap:PensionPlansDefinedBenefitMember2019-12-310001307954hun:RealEstateAndOtherMemberus-gaap:FairValueInputsLevel3Memberus-gaap:PensionPlansDefinedBenefitMember2019-12-310001307954us-gaap:PensionPlansDefinedBenefitMember2019-12-310001307954us-gaap:FixedIncomeFundsMemberus-gaap:FairValueMeasurementsRecurringMemberus-gaap:ForeignPlanMemberus-gaap:PensionPlansDefinedBenefitMember2018-12-310001307954us-gaap:FixedIncomeFundsMemberus-gaap:FairValueMeasurementsRecurringMembercountry:USus-gaap:PensionPlansDefinedBenefitMember2018-12-310001307954us-gaap:FixedIncomeFundsMemberus-gaap:FairValueInputsLevel2Memberus-gaap:ForeignPlanMemberus-gaap:PensionPlansDefinedBenefitMember2018-12-310001307954us-gaap:FixedIncomeFundsMemberus-gaap:FairValueInputsLevel2Membercountry:USus-gaap:PensionPlansDefinedBenefitMember2018-12-310001307954us-gaap:FixedIncomeFundsMemberus-gaap:FairValueInputsLevel1Memberus-gaap:ForeignPlanMemberus-gaap:PensionPlansDefinedBenefitMember2018-12-310001307954us-gaap:FixedIncomeFundsMemberus-gaap:FairValueInputsLevel1Membercountry:USus-gaap:PensionPlansDefinedBenefitMember2018-12-310001307954us-gaap:DefinedBenefitPlanEquitySecuritiesMemberus-gaap:FairValueMeasurementsRecurringMemberus-gaap:ForeignPlanMemberus-gaap:PensionPlansDefinedBenefitMember2018-12-310001307954us-gaap:DefinedBenefitPlanEquitySecuritiesMemberus-gaap:FairValueMeasurementsRecurringMembercountry:USus-gaap:PensionPlansDefinedBenefitMember2018-12-310001307954us-gaap:DefinedBenefitPlanEquitySecuritiesMemberus-gaap:FairValueInputsLevel2Memberus-gaap:ForeignPlanMemberus-gaap:PensionPlansDefinedBenefitMember2018-12-310001307954us-gaap:DefinedBenefitPlanEquitySecuritiesMemberus-gaap:FairValueInputsLevel2Membercountry:USus-gaap:PensionPlansDefinedBenefitMember2018-12-310001307954us-gaap:DefinedBenefitPlanEquitySecuritiesMemberus-gaap:FairValueInputsLevel1Memberus-gaap:ForeignPlanMemberus-gaap:PensionPlansDefinedBenefitMember2018-12-310001307954us-gaap:DefinedBenefitPlanEquitySecuritiesMemberus-gaap:FairValueInputsLevel1Membercountry:USus-gaap:PensionPlansDefinedBenefitMember2018-12-310001307954us-gaap:CashMemberus-gaap:FairValueMeasurementsRecurringMemberus-gaap:ForeignPlanMemberus-gaap:PensionPlansDefinedBenefitMember2018-12-310001307954us-gaap:CashMemberus-gaap:FairValueInputsLevel1Memberus-gaap:ForeignPlanMemberus-gaap:PensionPlansDefinedBenefitMember2018-12-310001307954hun:RealEstateAndOtherMemberus-gaap:FairValueMeasurementsRecurringMemberus-gaap:ForeignPlanMemberus-gaap:PensionPlansDefinedBenefitMember2018-12-310001307954hun:RealEstateAndOtherMemberus-gaap:FairValueMeasurementsRecurringMembercountry:USus-gaap:PensionPlansDefinedBenefitMember2018-12-310001307954hun:RealEstateAndOtherMemberus-gaap:FairValueInputsLevel3Memberus-gaap:ForeignPlanMemberus-gaap:PensionPlansDefinedBenefitMember2018-12-310001307954hun:RealEstateAndOtherMemberus-gaap:FairValueInputsLevel3Membercountry:USus-gaap:PensionPlansDefinedBenefitMember2018-12-310001307954hun:RealEstateAndOtherMemberus-gaap:FairValueInputsLevel2Memberus-gaap:ForeignPlanMemberus-gaap:PensionPlansDefinedBenefitMember2018-12-310001307954hun:RealEstateAndOtherMemberus-gaap:FairValueInputsLevel1Memberus-gaap:ForeignPlanMemberus-gaap:PensionPlansDefinedBenefitMember2018-12-310001307954us-gaap:FairValueMeasurementsRecurringMemberus-gaap:ForeignPlanMemberus-gaap:PensionPlansDefinedBenefitMember2018-12-310001307954us-gaap:FairValueMeasurementsRecurringMembercountry:USus-gaap:PensionPlansDefinedBenefitMember2018-12-310001307954us-gaap:FairValueInputsLevel3Memberus-gaap:ForeignPlanMemberus-gaap:PensionPlansDefinedBenefitMember2018-12-310001307954us-gaap:FairValueInputsLevel3Membercountry:USus-gaap:PensionPlansDefinedBenefitMember2018-12-310001307954us-gaap:FairValueInputsLevel2Memberus-gaap:ForeignPlanMemberus-gaap:PensionPlansDefinedBenefitMember2018-12-310001307954us-gaap:FairValueInputsLevel2Membercountry:USus-gaap:PensionPlansDefinedBenefitMember2018-12-310001307954us-gaap:FairValueInputsLevel1Memberus-gaap:ForeignPlanMemberus-gaap:PensionPlansDefinedBenefitMember2018-12-310001307954us-gaap:FairValueInputsLevel1Membercountry:USus-gaap:PensionPlansDefinedBenefitMember2018-12-310001307954hun:RealEstateAndOtherMemberus-gaap:FairValueInputsLevel3Memberus-gaap:PensionPlansDefinedBenefitMember2018-12-310001307954us-gaap:PensionPlansDefinedBenefitMember2018-12-310001307954hun:RealEstateAndOtherMemberus-gaap:FairValueInputsLevel3Memberus-gaap:PensionPlansDefinedBenefitMember2017-12-310001307954us-gaap:ForeignPlanMemberus-gaap:OtherPostretirementBenefitPlansDefinedBenefitMember2019-01-012019-12-310001307954us-gaap:ForeignPlanMemberus-gaap:OtherPostretirementBenefitPlansDefinedBenefitMember2018-01-012018-12-310001307954us-gaap:ForeignPlanMemberus-gaap:OtherPostretirementBenefitPlansDefinedBenefitMember2019-12-310001307954us-gaap:ForeignPlanMemberus-gaap:OtherPostretirementBenefitPlansDefinedBenefitMember2018-12-310001307954us-gaap:ForeignPlanMemberus-gaap:PensionPlansDefinedBenefitMember2017-12-310001307954us-gaap:ForeignPlanMemberus-gaap:OtherPostretirementBenefitPlansDefinedBenefitMember2017-12-310001307954country:USus-gaap:PensionPlansDefinedBenefitMember2017-12-310001307954country:USus-gaap:OtherPostretirementBenefitPlansDefinedBenefitMember2017-12-310001307954hun:RealEstateAndOtherMemberus-gaap:FairValueInputsLevel3Memberus-gaap:PensionPlansDefinedBenefitMember2019-01-012019-12-310001307954hun:RealEstateAndOtherMemberus-gaap:FairValueInputsLevel3Memberus-gaap:PensionPlansDefinedBenefitMember2018-01-012018-12-310001307954hun:HuntsmanInternationalLLCMemberus-gaap:ForeignPlanMemberus-gaap:PensionPlansDefinedBenefitMember2019-12-310001307954hun:HuntsmanInternationalLLCMembercountry:USus-gaap:PensionPlansDefinedBenefitMember2019-12-310001307954hun:HuntsmanInternationalLLCMembercountry:USus-gaap:OtherPostretirementBenefitPlansDefinedBenefitMember2019-12-310001307954us-gaap:ForeignPlanMemberus-gaap:PensionPlansDefinedBenefitMember2019-12-310001307954country:USus-gaap:PensionPlansDefinedBenefitMember2019-12-310001307954country:USus-gaap:OtherPostretirementBenefitPlansDefinedBenefitMember2019-12-310001307954hun:HuntsmanInternationalLLCMemberus-gaap:ForeignPlanMemberus-gaap:PensionPlansDefinedBenefitMember2018-12-310001307954hun:HuntsmanInternationalLLCMembercountry:USus-gaap:PensionPlansDefinedBenefitMember2018-12-310001307954hun:HuntsmanInternationalLLCMembercountry:USus-gaap:OtherPostretirementBenefitPlansDefinedBenefitMember2018-12-310001307954us-gaap:ForeignPlanMemberus-gaap:PensionPlansDefinedBenefitMember2018-12-310001307954country:USus-gaap:PensionPlansDefinedBenefitMember2018-12-310001307954country:USus-gaap:OtherPostretirementBenefitPlansDefinedBenefitMember2018-12-310001307954country:LU2019-12-310001307954srt:MinimumMember2019-12-310001307954srt:MaximumMember2019-12-310001307954hun:HuntsmanInternationalLLCMemberhun:AccumulatedOtherComprehensiveIncomeLossUnconsolidatedAffiliatesIncludingPortionAttributableToNoncontrollingInterestMember2018-01-012018-12-310001307954hun:AccumulatedOtherComprehensiveIncomeLossUnconsolidatedAffiliatesIncludingPortionAttributableToNoncontrollingInterestMember2018-01-012018-12-310001307954hun:HuntsmanInternationalLLCMemberus-gaap:SeniorNotesMemberhun:DebtInstrumentRedemptionPeriodUponOccurrenceCertainChangeOfControlEventsMember2019-01-012019-12-310001307954hun:HuntsmanInternationalLLCMemberhun:SeniorNotesMaturing2029Member2019-01-012019-12-310001307954us-gaap:EstimateOfFairValueFairValueDisclosureMember2019-12-310001307954us-gaap:CarryingReportedAmountFairValueDisclosureMember2019-12-310001307954us-gaap:EstimateOfFairValueFairValueDisclosureMember2018-12-310001307954us-gaap:CarryingReportedAmountFairValueDisclosureMember2018-12-310001307954hun:HuntsmanInternationalLLCMemberhun:TermLoanMember2019-09-240001307954hun:HuntsmanInternationalLLCMemberhun:SeniorNotesMaturing2029Member2019-03-130001307954hun:HuntsmanInternationalLLCMemberhun:SeniorNotesMaturingNovember2022Member2019-12-310001307954hun:HuntsmanInternationalLLCMemberhun:SeniorNotesMaturingApril2025Member2019-12-310001307954hun:HuntsmanInternationalLLCMemberhun:SeniorNotesMaturingApril2021Member2019-12-310001307954hun:HuntsmanInternationalLLCMemberhun:SeniorNotesMaturing2029Member2019-12-310001307954hun:HuntsmanInternationalLLCMemberhun:TermLoanMemberhun:EuroInterbankOfferedRateEuriborMember2019-09-242019-09-240001307954hun:HuntsmanInternationalLLCMemberhun:TermLoanMemberhun:EuriborFloorMember2019-09-242019-09-240001307954hun:HuntsmanInternationalLLCMemberus-gaap:RevolvingCreditFacilityMemberus-gaap:LondonInterbankOfferedRateLIBORMember2019-01-012019-12-310001307954hun:HuntsmanInternationalLLCMemberhun:UsAccountsReceivableProgramMaturingApril2022Memberhun:LondonInterbankOfferedRateOrCommercialPaperRateMember2019-01-012019-12-310001307954hun:HuntsmanInternationalLLCMemberhun:EuAccountsReceivableProgramMaturingApril2022Memberhun:GDPLiborOrUSDLiborOrEuriborMember2019-01-012019-12-310001307954srt:ParentCompanyMembersrt:ReportableLegalEntitiesMemberus-gaap:RetainedEarningsMember2017-12-310001307954srt:ParentCompanyMembersrt:ReportableLegalEntitiesMemberus-gaap:AccumulatedOtherComprehensiveIncomeMember2017-12-310001307954hun:HuntsmanInternationalLLCMemberus-gaap:RetainedEarningsMember2017-12-310001307954us-gaap:RetainedEarningsMember2017-12-310001307954us-gaap:AociIncludingPortionAttributableToNoncontrollingInterestMember2017-12-310001307954us-gaap:AccumulatedOtherComprehensiveIncomeMember2017-12-310001307954hun:AccumulatedOtherComprehensiveIncomeOtherNetIncludingPortionAttributableToNoncontrollingInterestMember2017-12-310001307954hun:HuntsmanInternationalLLCMemberhun:LimitedLiabilityCompanyEquityMember2019-12-310001307954hun:HuntsmanInternationalLLCMemberhun:LimitedLiabilityCompanyEquityMember2018-12-310001307954hun:HuntsmanInternationalLLCMemberhun:LimitedLiabilityCompanyEquityMember2017-12-310001307954hun:HuntsmanInternationalLLCMemberhun:LimitedLiabilityCompanyEquityMember2016-12-310001307954srt:ParentCompanyMembersrt:ReportableLegalEntitiesMemberus-gaap:CommonStockMember2019-12-310001307954us-gaap:CommonStockMember2019-12-310001307954srt:ParentCompanyMembersrt:ReportableLegalEntitiesMemberus-gaap:CommonStockMember2018-12-310001307954us-gaap:CommonStockMember2018-12-310001307954srt:ParentCompanyMembersrt:ReportableLegalEntitiesMemberus-gaap:CommonStockMember2017-12-310001307954us-gaap:CommonStockMember2017-12-310001307954srt:ParentCompanyMembersrt:ReportableLegalEntitiesMemberus-gaap:CommonStockMember2016-12-310001307954us-gaap:CommonStockMember2016-12-3100013079542019-04-012019-06-300001307954srt:ParentCompanyMembersrt:ReportableLegalEntitiesMember2017-12-310001307954hun:HuntsmanInternationalLLCMember2017-12-3100013079542017-12-310001307954srt:ParentCompanyMembersrt:ReportableLegalEntitiesMember2016-12-310001307954hun:HuntsmanInternationalLLCMember2016-12-3100013079542016-12-310001307954hun:DemilecAcquisitionMember2018-04-232018-12-310001307954hun:DemilecAcquisitionMember2018-01-012018-12-310001307954us-gaap:DiscontinuedOperationsHeldforsaleMemberhun:ChemicalIntermediatesBusinessesMember2018-12-310001307954us-gaap:FairValueInputsLevel2Memberus-gaap:FairValueMeasurementsRecurringMember2018-12-310001307954us-gaap:FairValueInputsLevel1Memberus-gaap:FairValueMeasurementsRecurringMember2018-12-310001307954us-gaap:FairValueMeasurementsRecurringMember2018-12-310001307954us-gaap:StockCompensationPlanMember2019-01-012019-12-310001307954us-gaap:StockCompensationPlanMember2018-01-012018-12-310001307954us-gaap:StockCompensationPlanMember2017-01-012017-12-310001307954srt:ParentCompanyMembersrt:ReportableLegalEntitiesMemberus-gaap:DeferredCompensationShareBasedPaymentsMember2019-01-012019-12-310001307954us-gaap:DeferredCompensationShareBasedPaymentsMember2019-01-012019-12-310001307954srt:ParentCompanyMembersrt:ReportableLegalEntitiesMemberus-gaap:DeferredCompensationShareBasedPaymentsMember2018-01-012018-12-310001307954us-gaap:DeferredCompensationShareBasedPaymentsMember2018-01-012018-12-310001307954us-gaap:DeferredCompensationShareBasedPaymentsMember2017-01-012017-12-310001307954srt:ParentCompanyMembersrt:ReportableLegalEntitiesMember2019-12-310001307954srt:ParentCompanyMembersrt:ReportableLegalEntitiesMember2018-12-310001307954hun:HuntsmanInternationalLLCMemberus-gaap:VariableInterestEntityPrimaryBeneficiaryMember2019-12-310001307954hun:HuntsmanInternationalLLCMemberus-gaap:VariableInterestEntityPrimaryBeneficiaryMember2018-12-310001307954hun:HuntsmanUkPensionPlanMemberus-gaap:ForeignPlanMember2019-01-012019-12-310001307954hun:HuntsmanInternationalLLCMemberus-gaap:SeniorNotesMember2019-12-310001307954hun:HuntsmanInternationalLLCMemberus-gaap:RevolvingCreditFacilityMember2019-12-310001307954hun:HuntsmanInternationalLLCMemberhun:VariableInterestEntityDebtMember2019-12-310001307954hun:HuntsmanInternationalLLCMemberhun:TermLoanMember2019-12-310001307954hun:HuntsmanInternationalLLCMemberhun:OtherDebtInstrumentsMember2019-12-310001307954hun:HuntsmanInternationalLLCMemberhun:AccountsReceivableProgramsMember2019-12-310001307954us-gaap:SeniorNotesMember2019-12-310001307954us-gaap:RevolvingCreditFacilityMember2019-12-310001307954hun:VariableInterestEntityDebtMember2019-12-310001307954hun:TermLoanMember2019-12-310001307954hun:OtherDebtInstrumentsMember2019-12-310001307954hun:ArabianAminesCompanyMember2019-12-310001307954hun:AccountsReceivableProgramsMember2019-12-310001307954hun:HuntsmanInternationalLLCMemberus-gaap:SeniorNotesMember2018-12-310001307954hun:HuntsmanInternationalLLCMemberus-gaap:RevolvingCreditFacilityMember2018-12-310001307954hun:HuntsmanInternationalLLCMemberhun:VariableInterestEntityDebtMember2018-12-310001307954hun:HuntsmanInternationalLLCMemberhun:OtherDebtInstrumentsMember2018-12-310001307954hun:HuntsmanInternationalLLCMemberhun:AccountsReceivableProgramsMember2018-12-310001307954us-gaap:SeniorNotesMember2018-12-310001307954us-gaap:RevolvingCreditFacilityMember2018-12-310001307954hun:VariableInterestEntityDebtMember2018-12-310001307954hun:OtherDebtInstrumentsMember2018-12-310001307954hun:AccountsReceivableProgramsMember2018-12-310001307954hun:FiveYearCrossCurrencyInterestRateContractMemberus-gaap:DesignatedAsHedgingInstrumentMember2014-11-012014-11-300001307954hun:EightYearsCrossCurrencyInterestRateContractMemberus-gaap:DesignatedAsHedgingInstrumentMember2014-11-012014-11-300001307954us-gaap:RestrictedStockUnitsRSUMember2019-01-012019-12-310001307954us-gaap:PerformanceSharesMember2019-01-012019-12-310001307954us-gaap:PerformanceSharesMember2019-12-310001307954us-gaap:OperatingSegmentsMemberhun:BaselSwitzerlandMemberhun:NonCancelableLeaseCostAndContractTerminationCostsMemberhun:TextileEffectsMember2018-10-012018-12-310001307954hun:HuntsmanInternationalLLCMember2019-10-012019-12-3100013079542019-10-012019-12-310001307954hun:HuntsmanInternationalLLCMember2019-07-012019-09-3000013079542019-07-012019-09-300001307954hun:HuntsmanInternationalLLCMember2019-01-012019-03-3100013079542019-01-012019-03-310001307954hun:HuntsmanInternationalLLCMember2018-10-012018-12-3100013079542018-10-012018-12-310001307954hun:HuntsmanInternationalLLCMember2018-07-012018-09-3000013079542018-07-012018-09-300001307954hun:HuntsmanInternationalLLCMember2018-04-012018-06-3000013079542018-04-012018-06-300001307954hun:HuntsmanInternationalLLCMember2018-01-012018-03-3100013079542018-01-012018-03-310001307954us-gaap:OperatingSegmentsMemberhun:BaselSwitzerlandMemberhun:TextileEffectsMember2018-01-012018-12-310001307954country:LU2018-07-012018-09-300001307954country:GB2018-04-012018-06-300001307954country:CH2018-04-012018-06-300001307954us-gaap:ForeignCountryMember2018-01-012018-12-310001307954country:LU2017-01-012017-12-310001307954country:IT2017-01-012017-12-310001307954hun:HuntsmanInternationalLLCMembersrt:MaximumMemberhun:USAccountReceivableProgramInterestRateMember2019-01-012019-12-310001307954hun:HuntsmanInternationalLLCMemberhun:USAccountReceivableProgramInterestRateMember2019-01-012019-12-310001307954hun:SasolHuntsmanGmbHAndCoKGMember2019-09-300001307954us-gaap:DiscontinuedOperationsDisposedOfBySaleMemberhun:ChemicalIntermediatesBusinessesMember2020-01-032020-01-030001307954country:CH2018-01-012018-12-310001307954hun:VenatorMaterialsPLCMember2018-12-032018-12-030001307954hun:HuntsmanInternationalLLCMemberhun:SasolHuntsmanGmbHAndCoKGMember2019-09-302019-09-300001307954hun:SasolHuntsmanGmbHAndCoKGMember2019-09-302019-09-300001307954us-gaap:VariableInterestEntityPrimaryBeneficiaryMember2019-12-310001307954us-gaap:VariableInterestEntityPrimaryBeneficiaryMember2018-12-310001307954hun:HuntsmanInternationalLLCMemberus-gaap:ForeignPlanMemberus-gaap:OtherPostretirementBenefitPlansDefinedBenefitMember2017-01-012017-12-310001307954us-gaap:ForeignPlanMemberus-gaap:OtherPostretirementBenefitPlansDefinedBenefitMember2017-01-012017-12-310001307954hun:HuntsmanInternationalLLCMemberus-gaap:AociIncludingPortionAttributableToNoncontrollingInterestMember2019-01-012019-12-310001307954hun:HuntsmanInternationalLLCMemberus-gaap:AociAttributableToNoncontrollingInterestMember2019-01-012019-12-310001307954hun:HuntsmanInternationalLLCMemberus-gaap:AccumulatedOtherComprehensiveIncomeMember2019-01-012019-12-310001307954hun:HuntsmanInternationalLLCMemberus-gaap:AccumulatedForeignCurrencyAdjustmentIncludingPortionAttributableToNoncontrollingInterestMember2019-01-012019-12-310001307954hun:HuntsmanInternationalLLCMemberus-gaap:AccumulatedDefinedBenefitPlansAdjustmentIncludingPortionAttributableToNoncontrollingInterestMember2019-01-012019-12-310001307954hun:HuntsmanInternationalLLCMemberhun:AccumulatedOtherComprehensiveIncomeOtherNetIncludingPortionAttributableToNoncontrollingInterestMember2019-01-012019-12-310001307954us-gaap:AociIncludingPortionAttributableToNoncontrollingInterestMember2019-01-012019-12-310001307954us-gaap:AccumulatedForeignCurrencyAdjustmentIncludingPortionAttributableToNoncontrollingInterestMember2019-01-012019-12-310001307954us-gaap:AccumulatedDefinedBenefitPlansAdjustmentIncludingPortionAttributableToNoncontrollingInterestMember2019-01-012019-12-310001307954hun:AccumulatedOtherComprehensiveIncomeOtherNetIncludingPortionAttributableToNoncontrollingInterestMember2019-01-012019-12-310001307954hun:HuntsmanInternationalLLCMemberus-gaap:AociIncludingPortionAttributableToNoncontrollingInterestMember2018-01-012018-12-310001307954hun:HuntsmanInternationalLLCMemberus-gaap:AccumulatedForeignCurrencyAdjustmentIncludingPortionAttributableToNoncontrollingInterestMember2018-01-012018-12-310001307954hun:HuntsmanInternationalLLCMemberus-gaap:AccumulatedDefinedBenefitPlansAdjustmentIncludingPortionAttributableToNoncontrollingInterestMember2018-01-012018-12-310001307954hun:HuntsmanInternationalLLCMemberhun:AccumulatedOtherComprehensiveIncomeOtherNetIncludingPortionAttributableToNoncontrollingInterestMember2018-01-012018-12-310001307954us-gaap:AociIncludingPortionAttributableToNoncontrollingInterestMember2018-01-012018-12-310001307954us-gaap:AccumulatedForeignCurrencyAdjustmentIncludingPortionAttributableToNoncontrollingInterestMember2018-01-012018-12-310001307954us-gaap:AccumulatedDefinedBenefitPlansAdjustmentIncludingPortionAttributableToNoncontrollingInterestMember2018-01-012018-12-310001307954hun:AccumulatedOtherComprehensiveIncomeOtherNetIncludingPortionAttributableToNoncontrollingInterestMember2018-01-012018-12-310001307954us-gaap:AociAttributableToNoncontrollingInterestMember2019-01-012019-12-310001307954us-gaap:AccumulatedOtherComprehensiveIncomeMember2019-01-012019-12-310001307954us-gaap:ForeignCountryMemberhun:TaxYear2019ExpirationMember2019-12-310001307954us-gaap:ForeignCountryMemberhun:TaxYear2018ExpirationMember2018-12-310001307954us-gaap:ForeignCountryMemberhun:TaxYear2020ExpirationMember2019-12-310001307954us-gaap:ForeignCountryMember2019-12-310001307954us-gaap:OtherPostretirementBenefitPlansDefinedBenefitMember2019-01-012019-12-310001307954hun:HuntsmanInternationalLLCMemberus-gaap:NoncontrollingInterestMember2017-01-012017-12-310001307954us-gaap:NoncontrollingInterestMember2017-01-012017-12-310001307954country:CH2019-01-012019-12-310001307954hun:HuntsmanInternationalLLCMemberhun:UsAccountsReceivableProgramMaturingApril2022Member2020-01-030001307954hun:HuntsmanInternationalLLCMemberhun:UsAccountsReceivableProgramMaturingApril2022Member2019-12-310001307954hun:HuntsmanInternationalLLCMemberhun:EuAccountsReceivableProgramMaturingApril2022Member2019-12-310001307954hun:HuntsmanInternationalLLCMemberhun:EuAccountsReceivableProgramMaturingApril2022Member2019-04-180001307954hun:HuntsmanInternationalLLCMemberhun:USAccountsReceivableProgramMaturingMarch2018Member2019-04-170001307954hun:HuntsmanInternationalLLCMemberus-gaap:RevolvingCreditFacilityMember2019-01-012019-12-310001307954hun:HuntsmanInternationalLLCMemberus-gaap:AociIncludingPortionAttributableToNoncontrollingInterestMember2017-12-310001307954hun:HuntsmanInternationalLLCMemberus-gaap:AociAttributableToNoncontrollingInterestMember2017-12-310001307954hun:HuntsmanInternationalLLCMemberus-gaap:AccumulatedOtherComprehensiveIncomeMember2017-12-310001307954hun:HuntsmanInternationalLLCMemberus-gaap:AccumulatedForeignCurrencyAdjustmentIncludingPortionAttributableToNoncontrollingInterestMember2017-12-310001307954hun:HuntsmanInternationalLLCMemberus-gaap:AccumulatedDefinedBenefitPlansAdjustmentIncludingPortionAttributableToNoncontrollingInterestMember2017-12-310001307954hun:HuntsmanInternationalLLCMemberhun:AccumulatedOtherComprehensiveIncomeOtherNetIncludingPortionAttributableToNoncontrollingInterestMember2017-12-310001307954hun:HuntsmanInternationalLLCMemberhun:AccumulatedOtherComprehensiveIncomeLossUnconsolidatedAffiliatesIncludingPortionAttributableToNoncontrollingInterestMember2017-12-310001307954hun:SLICMemberhun:BASFHuntsmanShanghaiIsocyanateInvestmentBVMember2019-12-310001307954hun:HuntsmanInternationalLLCMemberus-gaap:OperatingSegmentsMemberhun:TextileEffectsMember2019-01-012019-12-310001307954hun:HuntsmanInternationalLLCMemberus-gaap:OperatingSegmentsMemberhun:PolyurethanesMember2019-01-012019-12-310001307954hun:HuntsmanInternationalLLCMemberus-gaap:OperatingSegmentsMemberhun:PerformanceProductsMember2019-01-012019-12-310001307954hun:HuntsmanInternationalLLCMemberus-gaap:OperatingSegmentsMemberhun:AdvancedMaterialsMember2019-01-012019-12-310001307954us-gaap:OperatingSegmentsMemberhun:TextileEffectsMember2019-01-012019-12-310001307954us-gaap:OperatingSegmentsMemberhun:PolyurethanesMember2019-01-012019-12-310001307954us-gaap:OperatingSegmentsMemberhun:PerformanceProductsMember2019-01-012019-12-310001307954us-gaap:OperatingSegmentsMemberhun:AdvancedMaterialsMember2019-01-012019-12-310001307954hun:HuntsmanInternationalLLCMemberhun:CorporateAndReconcilingItemsMember2019-01-012019-12-310001307954hun:CorporateAndReconcilingItemsMember2019-01-012019-12-310001307954hun:HuntsmanInternationalLLCMemberus-gaap:OperatingSegmentsMemberhun:TextileEffectsMember2018-01-012018-12-310001307954hun:HuntsmanInternationalLLCMemberus-gaap:OperatingSegmentsMemberhun:PolyurethanesMember2018-01-012018-12-310001307954hun:HuntsmanInternationalLLCMemberus-gaap:OperatingSegmentsMemberhun:PerformanceProductsMember2018-01-012018-12-310001307954hun:HuntsmanInternationalLLCMemberus-gaap:OperatingSegmentsMemberhun:AdvancedMaterialsMember2018-01-012018-12-310001307954us-gaap:OperatingSegmentsMemberhun:TextileEffectsMember2018-01-012018-12-310001307954us-gaap:OperatingSegmentsMemberhun:PolyurethanesMember2018-01-012018-12-310001307954us-gaap:OperatingSegmentsMemberhun:PerformanceProductsMember2018-01-012018-12-310001307954us-gaap:OperatingSegmentsMemberhun:AdvancedMaterialsMember2018-01-012018-12-310001307954hun:HuntsmanInternationalLLCMemberhun:CorporateAndReconcilingItemsMember2018-01-012018-12-310001307954hun:CorporateAndReconcilingItemsMember2018-01-012018-12-310001307954hun:HuntsmanInternationalLLCMemberus-gaap:OperatingSegmentsMemberhun:TextileEffectsMember2017-01-012017-12-310001307954hun:HuntsmanInternationalLLCMemberus-gaap:OperatingSegmentsMemberhun:PolyurethanesMember2017-01-012017-12-310001307954hun:HuntsmanInternationalLLCMemberus-gaap:OperatingSegmentsMemberhun:PerformanceProductsMember2017-01-012017-12-310001307954hun:HuntsmanInternationalLLCMemberus-gaap:OperatingSegmentsMemberhun:AdvancedMaterialsMember2017-01-012017-12-310001307954us-gaap:OperatingSegmentsMemberhun:TextileEffectsMember2017-01-012017-12-310001307954us-gaap:OperatingSegmentsMemberhun:PolyurethanesMember2017-01-012017-12-310001307954us-gaap:OperatingSegmentsMemberhun:PerformanceProductsMember2017-01-012017-12-310001307954us-gaap:OperatingSegmentsMemberhun:AdvancedMaterialsMember2017-01-012017-12-310001307954hun:HuntsmanInternationalLLCMemberhun:CorporateAndReconcilingItemsMember2017-01-012017-12-310001307954hun:CorporateAndReconcilingItemsMember2017-01-012017-12-310001307954hun:HuntsmanInternationalLLCMemberus-gaap:RetainedEarningsMember2019-01-012019-12-310001307954hun:HuntsmanInternationalLLCMemberus-gaap:RetainedEarningsMember2018-01-012018-12-310001307954hun:HuntsmanInternationalLLCMemberus-gaap:RetainedEarningsMember2017-01-012017-12-310001307954hun:HuntsmanInternationalLLCMemberus-gaap:AociAttributableToNoncontrollingInterestMember2018-01-012018-12-310001307954us-gaap:AociAttributableToNoncontrollingInterestMember2018-01-012018-12-310001307954us-gaap:DiscontinuedOperationsHeldforsaleMemberhun:PigmentsAndAdditivesBusinessMember2018-09-300001307954us-gaap:DiscontinuedOperationsDisposedOfBySaleMemberhun:ChemicalIntermediatesBusinessesMember2020-01-030001307954hun:HuntsmanInternationalLLCMemberus-gaap:DiscontinuedOperationsHeldforsaleMemberhun:ChemicalIntermediatesBusinessesMember2019-01-012019-12-310001307954us-gaap:DiscontinuedOperationsHeldforsaleMemberhun:ChemicalIntermediatesBusinessesMember2019-01-012019-12-310001307954hun:HuntsmanInternationalLLCMemberus-gaap:DiscontinuedOperationsHeldforsaleMemberhun:ChemicalIntermediatesBusinessesMember2018-01-012018-12-310001307954us-gaap:DiscontinuedOperationsHeldforsaleMemberhun:ChemicalIntermediatesBusinessesMember2018-01-012018-12-310001307954hun:HuntsmanInternationalLLCMemberus-gaap:DiscontinuedOperationsHeldforsaleMemberhun:ChemicalIntermediatesBusinessesMember2017-01-012017-12-310001307954us-gaap:DiscontinuedOperationsHeldforsaleMemberhun:ChemicalIntermediatesBusinessesMember2017-01-012017-12-310001307954us-gaap:DiscontinuedOperationsHeldforsaleMemberhun:ChemicalIntermediatesBusinessesMember2019-12-310001307954hun:InterestRateSixYearContract2019Memberus-gaap:DesignatedAsHedgingInstrumentMember2019-11-300001307954hun:InterestRateSixYearContract2019Memberus-gaap:DesignatedAsHedgingInstrumentMember2019-11-012019-11-300001307954us-gaap:ForeignExchangeContractMember2019-01-012019-12-310001307954hun:MoneyPurchasePensionPlanMembercountry:US2019-01-012019-12-310001307954srt:MaximumMemberhun:SalaryDeferralPlanForNewHiresMembercountry:US2019-01-012019-12-310001307954hun:HuntsmanInternationalLLCMemberus-gaap:ForeignPlanMemberus-gaap:PensionPlansDefinedBenefitMember2019-01-012019-12-310001307954hun:HuntsmanInternationalLLCMembercountry:USus-gaap:PensionPlansDefinedBenefitMember2019-01-012019-12-310001307954hun:HuntsmanInternationalLLCMembercountry:USus-gaap:OtherPostretirementBenefitPlansDefinedBenefitMember2019-01-012019-12-310001307954country:USus-gaap:OtherPostretirementBenefitPlansDefinedBenefitMember2019-01-012019-12-310001307954hun:HuntsmanInternationalLLCMemberus-gaap:ForeignPlanMemberus-gaap:PensionPlansDefinedBenefitMember2018-01-012018-12-310001307954hun:HuntsmanInternationalLLCMembercountry:USus-gaap:PensionPlansDefinedBenefitMember2018-01-012018-12-310001307954hun:HuntsmanInternationalLLCMembercountry:USus-gaap:OtherPostretirementBenefitPlansDefinedBenefitMember2018-01-012018-12-310001307954country:USus-gaap:OtherPostretirementBenefitPlansDefinedBenefitMember2018-01-012018-12-310001307954hun:HuntsmanInternationalLLCMemberus-gaap:ForeignPlanMemberus-gaap:PensionPlansDefinedBenefitMember2017-01-012017-12-310001307954hun:HuntsmanInternationalLLCMembercountry:USus-gaap:PensionPlansDefinedBenefitMember2017-01-012017-12-310001307954hun:HuntsmanInternationalLLCMembercountry:USus-gaap:OtherPostretirementBenefitPlansDefinedBenefitMember2017-01-012017-12-310001307954us-gaap:ForeignPlanMemberus-gaap:PensionPlansDefinedBenefitMember2017-01-012017-12-310001307954country:USus-gaap:PensionPlansDefinedBenefitMember2017-01-012017-12-310001307954country:USus-gaap:OtherPostretirementBenefitPlansDefinedBenefitMember2017-01-012017-12-310001307954hun:RealEstateAndOtherMember2019-01-012019-12-310001307954srt:MinimumMemberus-gaap:PensionPlansDefinedBenefitMember2019-01-012019-12-310001307954srt:MaximumMemberus-gaap:PensionPlansDefinedBenefitMember2019-01-012019-12-310001307954us-gaap:ForeignPlanMemberus-gaap:PensionPlansDefinedBenefitMember2019-01-012019-12-310001307954country:USus-gaap:PensionPlansDefinedBenefitMember2019-01-012019-12-310001307954us-gaap:ForeignPlanMemberus-gaap:PensionPlansDefinedBenefitMember2018-01-012018-12-310001307954country:USus-gaap:PensionPlansDefinedBenefitMember2018-01-012018-12-310001307954hun:VenatorMaterialsPLCMember2019-12-310001307954srt:ParentCompanyMembersrt:ReportableLegalEntitiesMemberus-gaap:AccumulatedOtherComprehensiveIncomeMember2018-01-012018-12-310001307954hun:HuntsmanInternationalLLCMemberus-gaap:NoncontrollingInterestMember2018-01-012018-12-310001307954hun:HuntsmanInternationalLLCMemberus-gaap:AccumulatedOtherComprehensiveIncomeMember2018-01-012018-12-310001307954us-gaap:NoncontrollingInterestMember2018-01-012018-12-310001307954us-gaap:AccumulatedOtherComprehensiveIncomeMember2018-01-012018-12-310001307954hun:HuntsmanInternationalLLCMemberhun:SeniorNotesMaturingNovember2020Member2019-03-272019-03-270001307954hun:HuntsmanInternationalLLCMemberhun:SeniorNotesMaturingNovember2020Member2019-03-270001307954hun:HuntsmanInternationalLLCMemberhun:SasolHuntsmanGmbHAndCoKGMember2018-01-012018-12-310001307954hun:SasolHuntsmanGmbHAndCoKGMember2018-01-012018-12-310001307954hun:HuntsmanInternationalLLCMemberhun:SasolHuntsmanGmbHAndCoKGMember2017-01-012017-12-310001307954hun:SasolHuntsmanGmbHAndCoKGMember2017-01-012017-12-310001307954us-gaap:FairValueMeasurementsRecurringMember2019-02-012019-02-280001307954hun:VenatorMaterialsPLCMember2019-01-012019-12-310001307954hun:VenatorMaterialsPLCMember2019-01-012019-03-310001307954srt:MinimumMember2019-01-012019-12-310001307954srt:MaximumMember2019-01-012019-12-310001307954hun:DemilecAcquisitionMember2018-10-012018-12-310001307954hun:DemilecAcquisitionMember2018-04-232018-04-230001307954hun:DemilecAcquisitionMember2018-04-230001307954hun:IcyneneLapollaMember2019-12-050001307954hun:IcyneneLapollaMember2019-12-052019-12-050001307954hun:HuntsmanInternationalLLCMemberus-gaap:OperatingSegmentsMemberhun:TextileEffectsMember2019-12-310001307954hun:HuntsmanInternationalLLCMemberus-gaap:OperatingSegmentsMemberhun:PolyurethanesMember2019-12-310001307954hun:HuntsmanInternationalLLCMemberus-gaap:OperatingSegmentsMemberhun:PerformanceProductsMember2019-12-310001307954hun:HuntsmanInternationalLLCMemberus-gaap:OperatingSegmentsMemberhun:AdvancedMaterialsMember2019-12-310001307954us-gaap:OperatingSegmentsMemberhun:TextileEffectsMember2019-12-310001307954us-gaap:OperatingSegmentsMemberhun:PolyurethanesMember2019-12-310001307954us-gaap:OperatingSegmentsMemberhun:PerformanceProductsMember2019-12-310001307954us-gaap:OperatingSegmentsMemberhun:AdvancedMaterialsMember2019-12-310001307954hun:HuntsmanInternationalLLCMemberhun:CorporateAndReconcilingItemsMember2019-12-310001307954hun:CorporateAndReconcilingItemsMember2019-12-310001307954hun:HuntsmanInternationalLLCMemberus-gaap:OperatingSegmentsMemberhun:TextileEffectsMember2018-12-310001307954hun:HuntsmanInternationalLLCMemberus-gaap:OperatingSegmentsMemberhun:PolyurethanesMember2018-12-310001307954hun:HuntsmanInternationalLLCMemberus-gaap:OperatingSegmentsMemberhun:PerformanceProductsMember2018-12-310001307954hun:HuntsmanInternationalLLCMemberus-gaap:OperatingSegmentsMemberhun:AdvancedMaterialsMember2018-12-310001307954us-gaap:OperatingSegmentsMemberhun:TextileEffectsMember2018-12-310001307954us-gaap:OperatingSegmentsMemberhun:PolyurethanesMember2018-12-310001307954us-gaap:OperatingSegmentsMemberhun:PerformanceProductsMember2018-12-310001307954us-gaap:OperatingSegmentsMemberhun:AdvancedMaterialsMember2018-12-310001307954hun:HuntsmanInternationalLLCMemberhun:CorporateAndReconcilingItemsMember2018-12-310001307954hun:CorporateAndReconcilingItemsMember2018-12-310001307954srt:ParentCompanyMembersrt:ReportableLegalEntitiesMemberus-gaap:AdditionalPaidInCapitalMember2018-01-012018-12-310001307954hun:HuntsmanInternationalLLCMemberhun:LimitedLiabilityCompanyEquityMember2018-01-012018-12-310001307954us-gaap:AdditionalPaidInCapitalMember2018-01-012018-12-310001307954hun:HuntsmanInternationalLLCMember2018-01-012018-12-310001307954srt:ParentCompanyMembersrt:ReportableLegalEntitiesMember2017-01-012017-12-310001307954hun:HuntsmanInternationalLLCMemberhun:LimitedLiabilityCompanyEquityMember2017-01-012017-12-310001307954us-gaap:AdditionalPaidInCapitalMember2017-01-012017-12-310001307954hun:HuntsmanInternationalLLCMember2017-01-012017-12-3100013079542017-01-012017-12-310001307954srt:ParentCompanyMembersrt:ReportableLegalEntitiesMemberus-gaap:DeferredCompensationShareBasedPaymentsMember2017-01-012017-12-310001307954srt:ParentCompanyMembersrt:ReportableLegalEntitiesMemberus-gaap:AdditionalPaidInCapitalMember2017-01-012017-12-310001307954srt:ParentCompanyMembersrt:ReportableLegalEntitiesMemberus-gaap:AdditionalPaidInCapitalMember2019-01-012019-12-310001307954srt:ParentCompanyMembersrt:ReportableLegalEntitiesMember2019-01-012019-12-310001307954hun:HuntsmanInternationalLLCMemberus-gaap:NoncontrollingInterestMember2019-01-012019-12-310001307954hun:HuntsmanInternationalLLCMemberhun:SasolHuntsmanGmbHAndCoKGMember2019-01-012019-12-310001307954hun:HuntsmanInternationalLLCMemberhun:LimitedLiabilityCompanyEquityMember2019-01-012019-12-310001307954us-gaap:NoncontrollingInterestMember2019-01-012019-12-310001307954us-gaap:AdditionalPaidInCapitalMember2019-01-012019-12-310001307954hun:SasolHuntsmanGmbHAndCoKGMember2019-01-012019-12-310001307954hun:HuntsmanInternationalLLCMember2019-12-3100013079542019-12-310001307954hun:HuntsmanInternationalLLCMember2018-12-3100013079542018-12-310001307954srt:ParentCompanyMembersrt:ReportableLegalEntitiesMemberus-gaap:RetainedEarningsMember2018-01-012018-12-310001307954srt:ParentCompanyMembersrt:ReportableLegalEntitiesMember2018-01-012018-12-310001307954us-gaap:RetainedEarningsMember2018-01-012018-12-3100013079542018-01-012018-12-3100013079542019-06-2800013079542020-01-310001307954hun:HuntsmanInternationalLLCMember2019-01-012019-12-3100013079542019-01-012019-12-31hun:segmentxbrli:sharesiso4217:USDhun:facilityxbrli:pureiso4217:EURhun:companyhun:itemutr:lbiso4217:USDxbrli:shares

Table of Contents

UNITED STATES

SECURITIES AND EXCHANGE COMMISSION

WASHINGTON, D.C. 20549

Form 10-K

(Mark One)

ANNUAL REPORT PURSUANT TO SECTION 13 OR 15(d) OF THE SECURITIES EXCHANGE ACT OF 1934 FOR THE FISCAL YEAR ENDED DECEMBER 31, 2019

OR

TRANSITION REPORT PURSUANT TO SECTION 13 OR 15(d) OF THE SECURITIES EXCHANGE ACT OF 1934

Commission
File Number

Exact Name of Registrant as Specified in its Charter,
Principal Office Address and Telephone Number

State of
Incorporation/Organization

I.R.S. Employer
Identification No.

001-32427

Huntsman Corporation
10003 Woodloch Forest Drive
The Woodlands, Texas 77380
(281719-6000

Delaware

42-1648585

333-85141

Huntsman International LLC
10003 Woodloch Forest Drive
The Woodlands, Texas 77380
(281719-6000

Delaware

87-0630358

Securities registered pursuant to Section 12(b) of the Exchange Act:

Registrant


Title of each class


Trading Symbol

Name of each exchange on which registered

Huntsman Corporation


Common Stock, par value $0.01 per share


HUN

New York Stock Exchange

Huntsman International LLC


NONE


NONE

NONE

Securities registered pursuant to Section 12(g) of the Exchange Act:

Registrant

Title of each class

Huntsman Corporation

None

Huntsman International LLC

None

Indicate by check mark if the registrant is a well-known seasoned issuer, as defined in Rule 405 of the Securities Act.

Huntsman Corporation

Yes 

No 

Huntsman International LLC

Yes 

No 

Indicate by check mark if the registrant is not required to file reports pursuant to Section 13 or Section 15(d) of the Exchange Act.

Huntsman Corporation

Yes 

No 

Huntsman International LLC

Yes 

No 

Indicate by check mark whether the registrant: (1) has filed all reports required to be filed by Section 13 or 15(d) of the Exchange Act during the preceding 12 months (or for such shorter period that the registrant was required to file such reports) and (2) has been subject to such filing requirements for the past 90 days.

Huntsman Corporation

Yes 

No 

Huntsman International LLC

Yes 

No 

Indicate by check mark whether the registrant has submitted electronically every Interactive Data File required to be submitted pursuant to Rule 405 of Regulation S-T during the preceding 12 months (or for such shorter period that the registrant was required to submit such files).

Huntsman Corporation

Yes 

No 

Huntsman International LLC

Yes 

No 

Indicate by check mark whether the registrant is a large accelerated filer, an accelerated filer, a non-accelerated filer, a smaller reporting company, or an emerging growth company. See the definitions of “large accelerated filer,” “accelerated filer” “smaller reporting company,” and “emerging growth company” in Rule 12b-2 of the Exchange Act. Huntsman Corporation

Huntsman Corporation

Large accelerated filer 

Accelerated filer 

Non-accelerated filer 

Smaller reporting company 

Emerging Growth Companies 

Huntsman International LLC

Large accelerated filer 

Accelerated filer 

Non-accelerated filer 

Smaller reporting company 

Emerging Growth Companies 

If an emerging growth company, indicate by check mark if the registrant has elected not to use the extended transition period for complying with any new or revised financial accounting standards provided pursuant to Section 7(a)(2)(B) of the Securities Act.

Huntsman Corporation

Yes 

No 

Huntsman International LLC

Yes 

No 

Indicate by check mark whether the registrant is a shell company (as defined in Rule 12b-2 of the Exchange Act).

Huntsman Corporation

Yes 

No 

Huntsman International LLC

Yes 

No 

On June 28, 2019, the last business day of the registrants’ most recently completed second fiscal quarter, the aggregate market value of voting and non-voting common equity held by non-affiliates was as follows:

Registrant

Common Equity

Market Value Held by Nonaffiliates

Huntsman Corporation

Common Stock

$4,186,891,111(1)

Huntsman International LLC

Units of Membership Interest

NA(2)

(1)

Based on the closing price of $20.44 per share of common stock as quoted on the New York Stock Exchange.

(2)

All units of membership interest are held by Huntsman Corporation, an affiliate.

On January 31, 2020, the number of shares outstanding of each of the registrant’s classes of common equity were as follows:

Registrant

Common Equity

Outstanding

Huntsman Corporation

Common Stock

225,098,027

Huntsman International LLC

Units of Membership Interest

2,728

This Annual Report on Form 10-K presents information for two registrants: Huntsman Corporation and Huntsman International LLC. Huntsman International LLC is a wholly owned subsidiary of Huntsman Corporation and is the principal operating company of Huntsman Corporation. The information reflected in this Annual Report on Form 10-K is equally applicable to both Huntsman Corporation and Huntsman International LLC, except where otherwise indicated.

Huntsman International LLC meets the conditions set forth in General Instructions (I)(1)(a) and (b) of Form 10-K and, to the extent applicable, is therefore filing this form with a reduced disclosure format.

Documents Incorporated by Reference

Part III: Proxy Statement for the 2020 Annual Meeting of Stockholders to be filed within 120 days of

Huntsman Corporation’s fiscal year ended December 31, 2019.

Table of Contents

HUNTSMAN CORPORATION AND SUBSIDIARIES

HUNTSMAN INTERNATIONAL LLC AND SUBSIDIARIES

2019 ANNUAL REPORT ON FORM 10-K

TABLE OF CONTENTS


Page

PART I

ITEM 1.

BUSINESS

1

ITEM 1A.

RISK FACTORS

21

ITEM 1B.

UNRESOLVED STAFF COMMENTS

31

ITEM 2.

PROPERTIES

31

ITEM 3.

LEGAL PROCEEDINGS

33

ITEM 4.

MINE SAFETY DISCLOSURES

34

INFORMATION ABOUT OUR EXECUTIVE OFFICERS

34

PART II

ITEM 5.

MARKET FOR REGISTRANT’S COMMON EQUITY, RELATED STOCKHOLDER MATTERS AND ISSUER PURCHASES OF EQUITY SECURITIES

37

ITEM 6.

SELECTED FINANCIAL DATA

38

ITEM 7.

MANAGEMENT’S DISCUSSION AND ANALYSIS OF FINANCIAL CONDITION AND RESULTS OF OPERATIONS

39

ITEM 7A.

QUANTITATIVE AND QUALITATIVE DISCLOSURES ABOUT MARKET RISK

59

ITEM 8.

FINANCIAL STATEMENTS AND SUPPLEMENTARY DATA

59

ITEM 9.

CHANGES IN AND DISAGREEMENTS WITH ACCOUNTANTS ON ACCOUNTING AND FINANCIAL DISCLOSURE

59

ITEM 9A.

CONTROLS AND PROCEDURES

59

ITEM 9B.

OTHER INFORMATION

62

PART III

ITEM 10.

DIRECTORS, EXECUTIVE OFFICERS AND CORPORATE GOVERNANCE

62

ITEM 11.

EXECUTIVE COMPENSATION

62

ITEM 12.

SECURITY OWNERSHIP OF CERTAIN BENEFICIAL OWNERS AND MANAGEMENT AND RELATED STOCKHOLDER MATTERS

62

ITEM 13.

CERTAIN RELATIONSHIPS AND RELATED TRANSACTIONS, AND DIRECTOR INDEPENDENCE

62

ITEM 14.

PRINCIPAL ACCOUNTANT FEES AND SERVICES

62

PART IV

ITEM 15.

EXHIBITS AND FINANCIAL STATEMENT SCHEDULES

63

i

Table of Contents

HUNTSMAN CORPORATION AND SUBSIDIARIES

HUNTSMAN INTERNATIONAL LLC AND SUBSIDIARIES

2019 ANNUAL REPORT ON FORM 10-K

This report includes information with respect to market share, industry conditions and forecasts that we obtained from internal industry research, publicly available information (including industry publications and surveys), and surveys and market research provided by consultants. The publicly available information and the reports, forecasts and other research provided by consultants generally state that the information contained therein has been obtained from sources believed to be reliable. We have not independently verified any of the data from third-party sources, nor have we ascertained the underlying economic assumptions relied upon therein. Similarly, our internal research and forecasts are based upon our management’s understanding of industry conditions, and such information has not been verified by any independent sources.

For convenience in this report, the terms “Company,” “our,” “us,” or “we” may be used to refer to Huntsman Corporation and, unless the context otherwise requires, its subsidiaries and predecessors. Any references to our “Company,” “we,” “us” or “our” as of a date prior to October 19, 2004 (the date of our formation) are to Huntsman Holdings, LLC and its subsidiaries (including their respective predecessors). In this report, “Huntsman International” refers to Huntsman International LLC (our wholly-owned subsidiary) and, unless the context otherwise requires, its subsidiaries; “AAC” refers to Arabian Amines Company, our consolidated manufacturing joint venture with the Zamil Group; “HPS” refers to Huntsman Polyurethanes Shanghai Ltd. (our consolidated splitting joint venture with Shanghai Chlor-Alkali Chemical Company, Ltd); and “SLIC” refers to Shanghai Liengheng Isocyanate Investment BV (an unconsolidated manufacturing joint venture with BASF and three Chinese chemical companies).

In this report, we may use, without definition, the common names of competitors or other industry participants. We may also use the common names or abbreviations for certain chemicals or products. Many of these terms are defined in the Glossary of Chemical Terms found at the conclusion of “Part I. Item 1. Business” below.

Forward-Looking Statements

With respect to Huntsman Corporation, certain information set forth in this report contains “forward-looking statements” within the meaning the Private Securities Litigation Reform Act of 1995, Section 27A of the Securities Act of 1933 and Section 21E of the Securities Exchange Act of 1934. All statements other than historical factual information are forward-looking statements, including without limitation statements regarding: projections of revenue, expenses, profit, profit margins, tax rates, tax provisions, cash flows, pension and benefit obligations and funding requirements, our liquidity position or other projected financial measures; management’s plans and strategies for future operations, including statements relating to anticipated operating performance, cost reductions, restructuring activities, new product and service developments, competitive strengths or market position, acquisitions, divestitures, spin-offs or other distributions, strategic opportunities, securities offerings, stock repurchases, dividends and executive compensation; growth, declines and other trends in markets we sell into; new or modified laws, regulations and accounting pronouncements; outstanding claims, legal proceedings, tax audits and assessments and other contingent liabilities; foreign currency exchange rates and fluctuations in those rates; general economic and capital markets conditions; the timing of any of the foregoing; assumptions underlying any of the foregoing; and any other statements that address events or developments that we intend or believe will or may occur in the future. In some cases, forward-looking statements can be identified by terminology such as “believes,” “expects,” “may,” “will,” “should,” “anticipates” or “intends” or the negative of such terms or other comparable terminology, or by discussions of strategy. We may also make additional forward-looking statements from time to time. All such subsequent forward-looking statements, whether written or oral, by us or on our behalf, are also expressly qualified by these cautionary statements.

All forward-looking statements, including without limitation management’s examination of historical operating trends, are based upon our current expectations and various assumptions. Our expectations, beliefs and projections are expressed in good faith and we believe there is a reasonable basis for them, but there can be no assurance that management’s expectations, beliefs and projections will result or be achieved. All forward-looking statements apply only as of the date made. We undertake no obligation to publicly update or revise forward-looking statements whether because of new information, future events or otherwise, except as required by securities and other applicable law.

There are a number of risks and uncertainties that could cause our actual results to differ materially from the forward-looking statements contained in or contemplated by this report. Any forward-looking statements should be considered in light of the risks set forth in “Part I. Item 1A. Risk Factors” and elsewhere in this report.

ii

Table of Contents

PART I

ITEM 1. BUSINESS

General

We are a global manufacturer of differentiated organic chemical products. Our Company, a Delaware corporation, was formed in 2004 to hold the Huntsman businesses, which were founded by Jon M. Huntsman. Mr. Huntsman founded the predecessor to our Company in 1970 as a small polystyrene plastics packaging company. Since then, we have grown through a series of acquisitions and now own a global portfolio of businesses.

We operate all of our businesses through Huntsman International, our wholly-owned subsidiary. Huntsman International is a Delaware limited liability company and was formed in 1999.

Our principal executive offices are located at 10003 Woodloch Forest Drive, The Woodlands, Texas 77380, and our telephone number at that location is (281) 719-6000.

RECENT DEVELOPMENTS

Sale of Chemical Intermediates Businesses

On January 3, 2020, we completed the sale of our chemical intermediates businesses, which includes PO/MTBE, and our surfactants businesses (collectively, our “Chemical Intermediates Businesses”) to Indorama Ventures Holdings L.P. (“Indorama”) in a transaction valued at approximately $2 billion, comprising a cash purchase price of approximately $1.93 billion, which includes estimated adjustments to the purchase price for working capital, plus the transfer of approximately $72 million in net underfunded pension and other post-employment benefit liabilities. The final purchase price is subject to customary post-closing adjustments. The net after tax cash proceeds are expected to be approximately $1.6 billion.  Following the transaction, we still retain a 49% interest in our Chinese joint venture with Sinopec, which continues to produce and market PO/MTBE. For more information, see “Note 4. Discontinued Operations and Business Dispositions—Sale of Chemical Intermediates Businesses” to our consolidated financial statements.

Icynene-Lapolla Acquisition

On December 5, 2019, we entered into an agreement with an affiliate of FFL Partners, LLC to acquire Icynene-Lapolla, a leading North American manufacturer and distributor of spray polyurethane foam insulation systems for residential and commercial applications. Icynene-Lapolla operates two manufacturing facilities located in Houston, Texas and Mississauga, Ontario. Under terms of the agreement, we agreed to pay $350 million, subject to customary closing adjustments, in an all-cash transaction to be funded from available liquidity. The transaction is expected to close in the first quarter of 2020. The acquired business is expected to be integrated into our Polyurethanes segment.

Acquisition of Remaining Interest in Sasol-Huntsman Joint Venture

On September 30, 2019, we acquired from Sasol, our former joint venture partner, the 50% noncontrolling interest that we did not own in the Sasol-Huntsman GmbH and Co. KG (“Sasol-Huntsman”) maleic anhydride joint venture. The joint venture owned a manufacturing facility in Moers, Germany with capacity to produce 230 million pounds of maleic anhydride. We paid Sasol $101 million, which included acquired cash, net of any debt. The purchase price was funded from a new 364-day term loan facility (“the 2019 Term Loan”). See “Note 15. Debt—Direct and Subsidiary Debt—Term Loan Credit Facility” to our consolidated financial statements.

Overview

We are a global manufacturer of differentiated organic chemical products. Our products comprise a broad range of chemicals and formulations, which we market globally to a diversified group of consumer and industrial customers. Our products are used in a wide range of applications, including those in the adhesives, aerospace, automotive, construction products, personal care and hygiene, durable and non-durable consumer products, digital inks, electronics, insulation, medical, packaging, coatings and construction, power generation, refining, synthetic fiber, textile chemicals

1

Table of Contents

and dyes industries. We are a leading global producer in many of our key product lines, including MDI, amines, maleic anhydride, epoxy-based polymer formulations, textile chemicals and dyes.

We operate in four segments: Polyurethanes, Performance Products, Advanced Materials and Textile Effects. In August 2017, we separated our Titanium Dioxide and Performance Additives business (the “P&A Business”) through an initial public offering (“IPO”) of ordinary shares of Venator Materials PLC (“Venator”), formerly a wholly-owned subsidiary. Beginning in the third quarter of 2017, we reported the results of operations of Venator as discontinued operations. On December 3, 2018, we sold an additional 4% of Venator ordinary shares which allowed us to immediately deconsolidate Venator and account for our remaining ownership interest in Venator as an equity method investment using the fair value option. For more information, see “Note 4. Discontinued Operations and Business Disposition—Separation and Deconsolidation of Venator” to our consolidated financial statements. On January 3, 2020, we completed the sale of our Chemical Intermediates Businesses, and, beginning in the third quarter of 2019, we reported the results of our Chemical Intermediates Businesses as discontinued operations. For more information, see “Note 4. Discontinued Operations and Business Dispositions—Sale of Chemical Intermediates Businesses” to our consolidated financial statements. In a series of transactions beginning in 2006, we sold or shut down substantially all of our Australian styrenics operations and our North American polymers and base chemicals operations. We also report the results of operations of these businesses as discontinued operations.

As of December 31, 2019, we employed approximately 10,000 associates worldwide, including approximately 1,000 employees associated with the Chemical Intermediates Businesses that was sold on January 3, 2020. Our revenues for the years ended December 31, 2019, 2018 and 2017 were $6,797 million, $7,604 million and $6,845 million, respectively.

Our Products

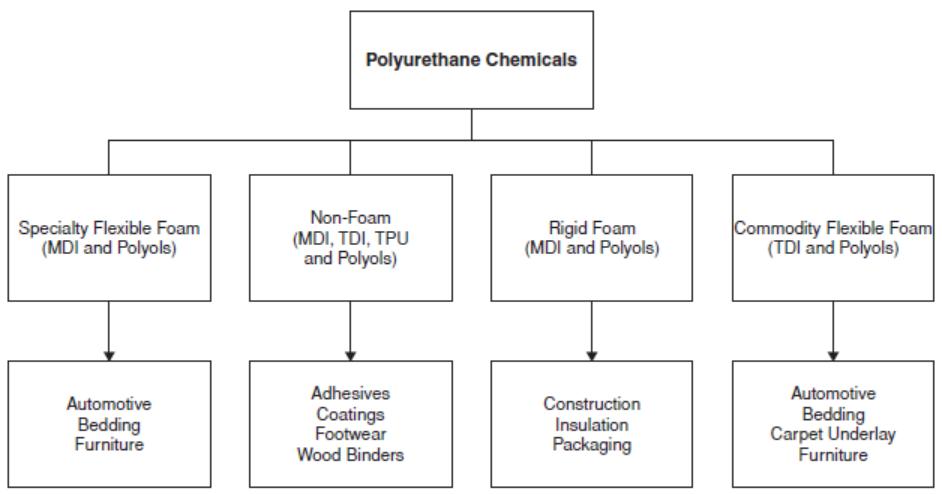
Our Polyurethanes, Performance Products, Advanced Materials and Textile Effects segments produce differentiated organic chemical products. Growth in our differentiated products has been driven by the substitution of our products for other materials and by the level of global economic activity. Accordingly, the profitability of our differentiated products has been somewhat less influenced by the cyclicality that typically impacts the petrochemical industry.

Graphic

(1)

Percentage allocations in this chart do not give effect to Corporate and other unallocated items and eliminations. For a reconciliation of adjusted EBITDA to net income attributable to Huntsman Corporation and cash provided by operating activities, see “Part II. Item 7. Management’s Discussion and Analysis of Financial Condition and Results of Operations—Results of Operations.”

2

Table of Contents

The following table identifies the key products, principal end markets and applications, representative customers, raw materials and representative competitors of each of our business segments:

Product Line

End Markets / Applications

Representative Customers

Raw Materials

Representative Competitors

Polyurethanes

MDI

Polyurethane chemicals are used to produce rigid and flexible foams, as well as coatings, adhesives, sealants and elastomers. They are also used in refrigeration and appliance insulation, construction products, automotive, footwear, furniture, cushioning, specialized engineering applications.

BMW, Electrolux, Firestone, Haier, Henkel, Lear, Louisiana Pacific, Norbord and Recticel

Benzene =>Nitrobenzene and Aniline

Polyols

Polyols are combined with MDI and other isocyanates to create a broad spectrum of polyurethane products, such as rigid foam, flexible foam and other non-foam applications.

Mostly PO, some EO

Wanhua Chemical Group, BASF,

Dow and Covestro

TPU

TPU is a high-quality, fully formulated thermal plastic that can be tailored with unique qualities. It can be used in injection molding and small components for automotive and footwear. It is also extruded into films, wires and cables for use in the coatings, adhesives, sealants and elastomers markets.

Isocyanate (such as MDI) and a polyol


Performance Products

Amines

Amines are a family of intermediate chemicals that are valued for their properties as a reactive agent, emulsifier, dispersant, detergent, solvent or corrosion inhibitor. Amines are used in polyurethane foam, fuel and lubricant additives, paints and coatings, composites, gas treatment, construction materials and personal care products

Afton, Chevron Oronite, Ecolab, Evonik, Georgia-Pacific, Hexion, Infineum, Ingevity, Lubrizol, Olin and PPG

EO, PO, glycols, ethylene dichloride, caustic soda, ammonia, hydrogen, methylamines and acrylonitrile

BASF, Delamine, Dow, Eastman, Evonik, Nouryon and Tosoh

Maleic anhydride

Maleic anhydride is an intermediate chemical used primarily to produce unsaturated polyester resins (UPRs). UPRs are mainly used in the production of fiberglass reinforced resins for marine, automotive and construction products. Maleic anhydride is also used in the production of lubricants, food additives and food acidulants.

AOC, Ashland, Chevron Oronite, Cranston, Dixie, Ingevity, Lubrizol, MFG Chemical, Polynt-Reichhold and Tate & Lyle

Normal butane

Lanxess, INEOS, Bartek and Ashland


Advanced Materials

Technologically- advanced

epoxy, acrylic and

polyurethane-based

polymer formulations

Aerospace and industrial adhesives; composites for aerospace, automotive, oil and gas and wind power generation; construction and civil engineering; industrial coatings; electrical power transmission; consumer electronics and DIY adhesives.

Bodo Moeller, Freeman, Hilti, Nordex, Schneider, Siemens, Speed Fair, Syngenta, Tianjin and Sherwin Williams

BLR, epichlorohydrin, amines, polyols, isocyanates, acrylic materials, hardeners and fillers

Henkel, Sika, 3M, Sumitomo, Hexion, Elantas and Olin

High performance

thermoset

resins and curing agents

High performance chemical building blocks sold to formulators who develop formulations for aerospace, automotive, oil and gas, coatings, construction, electronics and electrical insulation applications.

Cytec, Hexcel and Toray

Epichlorohydrin (ECH), amines, phenols, aminophenols and fatty acids

Hexion, Olin, Sumitomo and Evonik

Base liquid resins (BLR),

Base solid resins (BSR)

BLR is used internally and is the basic building block for many of our downstream products. Approximately 69% of what we produce is used internally and the rest is sold into the merchant market.

Akzo, Omya and Sherwin Williams

Epichlorohydrin, bisphenol A (BPA), BLR, MDA and phenol and aminophenols

Olin, Hexion, Kukdo and NanYa


Textile Effects

Chemicals, dyes & inks

Textile dyes add color to textiles from cotton, polyester and nylon, while textile chemicals improve the performance characteristics of the textile. These are used in apparel, home and technical textiles. Home and institutional textiles include textiles that are used within the home or institutions such as hotels. Functional and technical textiles include automotive textiles, carpet, military fabrics protective wear, nonwoven and other technical fabrics.

Esquel Group, Fruit of the Loom, Guilford Mills, Hanesbrands, Kahatex, Nice Dyeing, Sage Automotive, Tencate, Toray Group, Welspun Group, Y.R.C. Textiles and Zaber and Zubair

Thousands of raw materials, with no one representing more than 5% of raw material costs

Dyes: Archroma, DyStar, Longsheng, Runtu and Jihua

Chemicals: Archroma, Nikka, Transfar/Tannatex, CHT and Rudolf

Digital Inks: EFI/Reggiani, Dover/MS, JK Group, Sensient/Xennia, DuPont, DyStar and SPG

3

Table of Contents

Polyurethanes

General

We are a leading global manufacturer and marketer of a broad range of polyurethane chemicals, including MDI products, polyols, and TPU (each discussed in more detail below under “—Products and Markets”). Polyurethane chemicals are used to produce rigid and flexible foams, as well as coatings, adhesives, sealants and elastomers. We focus on the higher-margin, higher-growth markets for specialty MDI and MDI-based polyurethane systems. Volume growth in our Polyurethanes segment has been driven primarily by the continued substitution of MDI-based products for other materials across a broad range of applications. We operate five primary polyurethane manufacturing facilities in the U.S., Europe and China. We also operate 29 strategically located downstream facilities, 25 of them are polyurethane formulation facilities, commonly referred to in the chemical industry as “systems houses,” located in close proximity to our customers worldwide, which enables us to focus on customer support, technical service and a differentiated product offering. We also operate a specialty polyol manufacturing facility focused on the insulation market and three downstream TPU manufacturing facilities in the U.S., Europe and China.

Our customers produce polyurethane products through the combination of an isocyanate, such as MDI, with polyols, which are derived largely from PO and EO. We are able to produce over 2,500 distinct MDI-based polyurethane products by modifying the MDI molecule through varying the proportion and type of polyol used and by introducing other chemical additives to our MDI formulations. As a result, polyurethane products, especially those derived from MDI, are continuing to replace traditional products in a wide range of end-use markets, including insulation in construction and appliances, cushioning for automotive and furniture, coatings, adhesives, wood binders for construction and furniture, footwear and other specialized engineering applications.

In 1992, we were the first global supplier of polyurethane chemicals to open a technical service center in China. We have since expanded this facility to include an integrated polyurethane formulations facility and a world-scale research and development campus. In January 2003, we entered into two related joint ventures to build MDI production and finishing facilities near Shanghai, China in Caojing. In June 2006, HPS, a consolidated joint venture, began production at our MDI finishing plant. In September 2006, SLIC, an unconsolidated joint venture, began production at the MNB, aniline and crude MDI plants. We completed capacity expansions of these facilities during the first quarter of 2018. These world-scale facilities strengthen our ability to service our customers in the critical Chinese market, the largest MDI market in the world, and will support the long-term demand growth that we believe this region will continue to experience. Additionally, in November 2012, we entered into an agreement with Sinopec to form a joint venture to build a world scale PO/MTBE plant in Nanjing, China utilizing proprietary PO/MTBE manufacturing technology. The facility was completed in early 2017 and beneficial commercial operations began in the second half of 2017. We own a 49% interest in the joint venture and account for our interest in the joint venture as an equity method investment.

4

Table of Contents

Products and Markets

MDI is used primarily in rigid foam applications and in a wide variety of customized, higher-value flexible foam as well as coatings, adhesives, sealants and elastomers. Polyols, including polyether and polyester polyols, are used in conjunction with MDI in rigid foam, flexible foam and other non-foam applications. The following chart illustrates the range of product types and end uses for polyurethane chemicals. We produce MDI, polyols and TPU products and do not produce TDI products.

Graphic

Polyurethane chemicals are sold to customers who combine the chemicals to produce polyurethane products. Depending on their needs, customers will use either component polyurethane chemicals produced for mass sales or polyurethane systems tailored for their specific requirements. By varying the blend, additives and specifications of the polyurethane chemicals, manufacturers are able to develop and produce a breadth and variety of polyurethane products.

Our strategy is focused on growing our differentiated product offering (specialty MDI and polyols, formulated MDI systems and TPU), which requires a greater emphasis on formulating capability to help our downstream customers to meet the desired effect required in their applications. These differentiated products tend to require technical solutions, offer higher margins, lower volatility and are less dependent on industry utilization rates compared to sales of component MDI or component polyols.

MDI. MDI has grown substantially over the past three decades, increasing by a factor of 6% CAGR, well in excess of global GDP. MDI has a substantially larger market size and a higher growth rate than other polyurethane isocyanates. This is primarily because MDI can be used to make polyurethanes with a broader range of properties and can therefore be used in a wider range of applications. We believe that MDI and formulated MDI systems, which combine MDI and polyols, will continue to grow at approximately double the rate of global GDP driven by the mega trends of energy management, food preservation, demographics and urbanization/transportation. MDI offers key products benefits of energy efficiency, comfort and durability aligned with these megatrends. We believe that MDI and formulated MDI systems will continue to substitute for alternative materials such as fiberglass in insulation, phenol formaldehyde in wood binders and TDI in automotive and furniture. Specialty cushioning and insulation applications, thermoplastic polyurethanes and adhesives and coatings will further contribute to the continued growth of MDI. MDI experiences some seasonality in its sales reflecting its exposure to seasonal construction-related end markets such as insulation and composite wood products. Sales generally peak during the spring and summer months in the northern hemisphere, resulting in greater sales volumes during the second and third quarters of the year.

TPU. TPU is a high-quality, fully formulated thermal plastic derived from the reaction of MDI or an aliphatic isocyanate with polyols to produce unique qualities such as durability, flexibility, strength, abrasion-resistance, shock absorbency and chemical resistance. We can tailor the performance characteristics of TPU to help meet the specific

5

Table of Contents

requirements of our customers. TPU is used in injection molding and small components for the automotive and footwear industries. It is also extruded into films for apparel, wires and cables for industrial use and in a wide variety of applications in the coatings, adhesives, sealants and elastomers markets.

Polyols. Polyols are combined with MDI and other isocyanates to create a broad spectrum of formulated polyurethane systems. Demand for specialty polyols has been growing at approximately the same rate at which MDI consumption has grown.

Aniline. Aniline is an intermediate chemical used primarily to manufacture MDI. The majority of our aniline is consumed internally with some sold to third parties. We believe that the lack of a significant spot market for aniline means that in order to remain competitive, MDI manufacturers must either be integrated with an aniline manufacturing facility or have a long-term, cost-competitive aniline supply contract.

Our strategic focus is on growing our differentiated (specialty MDI and polyols, formulated MDI-based systems and TPU) product offerings and the diagram below provides an overview of that focus with an approximation of the number of grades, formulations, products and stock keeping units which we produce and sell.

Graphic

Sales and Marketing

We market our polyurethane chemicals to over 6,000 customers in more than 90 countries. Our sales, marketing and technical resources are organized to support major regional markets and key end-use markets, some of which require a coordinated global approach, such as key accounts across the automotive sector. These key end-use markets include the commercial and residential insulation, appliance, automotive, footwear, furniture and coatings, adhesives, sealants and elastomers industries. We sell both directly and indirectly to customers, the latter via a network of distributors and agents who in turn sell our products to customers who cannot be served as cost effectively by our internal sales groups.

We provide a wide variety of polyurethane solutions as components (i.e., the isocyanate or the polyol) or in the form of “systems” in which we provide the total isocyanate and polyol formulation to our customers. Our ability to deliver a range of polyurethane solutions and technical support, which can be tailored for the needs of our customers, is critical to our long-term success. We have strategically located our downstream polyurethane systems houses close to our customers, enabling us to focus on customer support and technical service. We believe this customer support and

6

Table of Contents

technical service system contributes to customer retention and also provides opportunities for identifying further product and service needs of customers.

Our strategy is to grow the number and capability of our downstream facilities both organically and inorganically. As a result, we have made a number of “bolt-on” acquisitions in recent years to expand our downstream footprint and align with our strategic intent.

We believe that the extensive market knowledge and industry experience of our sales teams and technical experts, in combination with our strong emphasis on customer relationships, have facilitated our ability to establish and maintain long-term customer supply positions. Our sales strategy is to continue to increase sales to existing customers and to attract new customers by providing innovative solutions, quality products, reliable supply, competitive prices and superior customer service.

Manufacturing and Operations

Our world-scale MDI production facilities are located in Geismar, Louisiana; Rotterdam, The Netherlands; and through our joint ventures in Caojing, China. These facilities receive aniline, which is a primary material used in the production of MDI, from our facilities located in Geismar, Louisiana; Wilton, U.K.; and Caojing, China. We believe that this relative scale and product integration of our large facilities is necessary to provide cost competitiveness in MDI production. The following table sets forth the annual production capacity of polyurethane chemicals at select polyurethanes facilities:


MDI


Polyols


TPU


Aniline


Nitrobenzene


(millions of pounds)

Caojing, China


825

(1) 


Geismar, Louisiana


1,060


160


706

(2) 

1,000

(2) 

Houston, Texas


168


Jinshan, China


44


Osnabrück, Germany


26


59


Ringwood, Illinois


28


Rotterdam, The Netherlands


1,036


190


Wilton, U.K.


783


1,045


Total


2,921


544


131


1,489


2,045


(1)    Represents our share of capacity from SLIC.

(2)    Represents our approximately 78% share of capacity under our consolidated Rubicon LLC manufacturing joint venture with Lanxess AG.

At our Geismar, Rotterdam and Caojing facilities we utilize sophisticated proprietary technology to produce MDI. This technology contributes to our position as a low-cost MDI producer.

Joint Ventures

Rubicon Joint Venture. Lanxess AG (“Lanxess”) is our joint venture partner in Rubicon LLC, which owns aniline, nitrobenzene and DPA manufacturing facilities in Geismar, Louisiana. We are entitled to approximately 78% of the nitrobenzene and aniline production capacity of Rubicon LLC, and Lanxess is entitled to 100% of the DPA production. In addition to operating the joint venture’s aniline, nitrobenzene and DPA facilities, Rubicon LLC operates our wholly-owned MDI, polyol and maleic anhydride facilities at Geismar and is responsible for providing other auxiliary services to the entire Geismar complex. As a result of this joint venture, we are able to achieve greater scale and lower costs for our products than we would otherwise have been able to obtain. Rubicon LLC is consolidated in our financial statements.

Chinese MDI Joint Ventures. We are involved in two related joint ventures which operate MDI production facilities in Caojing, China. SLIC, our manufacturing joint venture with BASF and three Chinese chemical companies, produces MNB, aniline and crude MDI. We effectively own 35% of SLIC and account for our investment under the equity method. HPS, our splitting joint venture with Shanghai Chlor-Alkali Chemical Company, Ltd, manufactures pure MDI, polymeric MDI, MDI variants and formulated MDI systems. We own 70% of HPS and it is consolidated in our financial statements. These projects have been funded by a combination of equity invested by the joint venture partners

7

Table of Contents

and borrowed funds. We completed capacity expansions of these facilities in the first quarter of 2018. The total production capacity of the SLIC facilities is 1,280 million pounds per year of MDI, of which HPS is entitled to 825 million pounds.

Chinese PO/MTBE Joint Venture. In November 2012, we entered into an agreement to form a joint venture with Sinopec. The joint venture involved the construction and operation of a PO/MTBE facility in China. Under the joint venture agreement, we hold a 49% interest in the joint venture and Sinopec holds a 51% interest. Beneficial commercial operations began during the second half of 2017.

Raw Materials

The primary raw materials for MDI-based polyurethane chemicals are benzene and PO. Benzene is a widely available commodity that is the primary feedstock for the production of MDI and aniline. Historically, benzene has been the largest component of our raw material costs. We purchase benzene from third parties to manufacture nitrobenzene and aniline, almost all of which we then use to produce MDI.

In connection with the sale of the Chemical Intermediates Businesses to Indorama, we entered into a strategic agreement for the supply of PO in North America. In China, the Chinese PO/MTBE joint venture supplies PO into our downstream China business. The strategic supply of PO gives us access to competitively priced PO and the opportunity to develop polyols that enhance our range of MDI products.

Competition

Our major competitors in the polyurethane chemicals market include BASF, Covestro, Dow, and Wanhua Chemical Group. While these competitors and others produce various types and quantities of polyurethane chemicals, we focus on MDI and MDI-based formulated polyurethane systems. Our downstream business is fragmented with different competitors in various markets and regions. Our competitors in downstream markets include Kingspan, Carlisle and Coim. Our polyurethane chemicals business competes in two basic ways: (1) where price is the dominant element of competition, our polyurethane chemicals business differentiates itself by its high level of customer support, including cooperation on technical and safety matters; and (2) elsewhere, we compete on the basis of product performance, our ability to react quickly to changing customer needs and providing customers with innovative solutions to their needs.

Performance Products

General

Our Performance Products segment has leading global positions in the manufacture and sale of amines and maleic anhydride and serves a wide variety of consumer and industrial end markets. Our Performance Products segment is organized by region and product family: amines and maleic anhydride (including catalyst and licensing).

We produce a wide range of amines, many of which are sold into specialty markets such as epoxy curing agents, oil exploration and production, agrochemicals, and fuel and lubricant additives. We believe we are the largest global producer of polyetheramines, one of the largest producers of 2-(2-amino ethoxy) ethanol, sold under our DGA brand, the largest global producer making the full range of ethyleneamines, the second largest producer of morpholine and a leading global producer of low emission polyurethane catalysts. We are the only producer and largest supplier of propylene carbonate and ethylene carbonate in North America. Many of the markets for these products have growth rates in excess of global GDP.

We believe we are the largest global producer of maleic anhydride, a highly versatile chemical intermediate that is used to produce UPRs, which are mainly used in the production of fiberglass reinforced resins for marine, automotive and construction products. Maleic anhydride is also used in the production of lubricants, food additives and artificial sweeteners. We are also the leading licensor of maleic anhydride manufacturing technology and are amongst the largest suppliers of fixed bed catalyst used in the manufacture of maleic anhydride from n-butane.

Beginning in 2013, our Performance Products segment initiated a restructuring program to refocus its surfactants business in Europe. In connection with this program, in 2014 we completed the sale of our European commodity surfactants business, including the ethoxylation facility in Lavera, France to Wilmar. Additionally, in 2014 we ceased production at our Patrica, Italy surfactants facility. In December 2015, we announced plans for a reorganization of our commercial and technical functions and a refocused divisional business strategy to better position our segment for growth in coming years and we launched a program to capture growth opportunities, improve manufacturing cost efficiency and reduce inventories. In December 2016, we completed the sale of our European differentiated surfactants business to Innospec Inc. for $199 million in cash plus our retention of trade receivables and

8

Table of Contents

payables for an enterprise value of $225 million. In August 2019, we entered into an agreement with Indorama to sell our Chemical Intermediates Businesses, for a purchase price of $2.0 billion in cash plus the transfer of approximately $72 million in net underfunded pension and other post-employment benefit liabilities. We completed this sale on January 3, 2020. In September 2019, we acquired from Sasol, our joint venture partner, the 50% noncontrolling interest that we did not own in the Sasol-Huntsman maleic anhydride joint venture. We paid Sasol $101 million, which included acquired cash, net of any debt.

We produce a variety of products at 10 Performance Products manufacturing facilities in North America, Europe, the Middle East and Asia.

Graphic

Products and Markets

Amines. Amines are a family of intermediate chemicals that are produced by reacting ammonia, or an alkylamine, with various ethylene and propylene derivatives. Generally, amines are valued for their properties as a reactive agent, emulsifier, dispersant, solvent or corrosion inhibitor. Growth in demand for amines is highly correlated with GDP growth. However, certain segments of the amines market, such as polyetheramines, have historically grown at rates in excess of GDP growth due to new product development, technical innovation and end-use substitution. As amines are generally sold based upon the performance characteristics that they provide to customer-specific end-use applications, pricing does not generally fluctuate directly with movements in underlying raw materials. Our amines business is organized around the following product groups:

Product Group


Applications

Polyetheramines

Epoxy composites, polyurethane foams and insulation, construction and flooring, paints and coatings, lubricant and fuel additives, adhesives, agrochemicals, oilfield chemicals, printing inks and pigment dispersion

Ethyleneamines

Chemical building block used in lubricant and fuel additives, epoxy hardeners, wet strength resins, chelating agents and fungicides

Other specialty amines, including DGA™ Agent

Gas treating, agricultural chemicals, personal care, lubricant and fuel additives, polyurethane foams, fabric softeners, paints and coatings, refinery processing and water treating

Polyetheramines are produced by reacting polyol with ammonia. They provide sophisticated performance characteristics as an additive in the manufacture of highly customized epoxy formulations, enabling customers to penetrate new markets and substitute for traditional curing materials.

Our ethyleneamines are manufactured by reacting EDC and caustic soda with ammonia to produce a range of various ethyleneamines homologues having different molecular weights. Most other producers utilize a reductive amination process, which yields a light slate of ethyleneamines. We believe our heavier slate of homologues allows access to a greater range of markets.

9

Table of Contents

Our amines are used in a wide variety of mainly industrial applications, including composites, paints and coatings, polyurethane foam, fuel and lubricant additives, and solvents. Our key amines customers include Afton, Chevron-Oronite, Ecolab, Evonik, Georgia-Pacific, Hexion, Infineum, Ingevity, Lubrizol, Olin, and PPG.

Maleic Anhydride (including catalyst and licensing). Maleic anhydride is a highly versatile chemical intermediate that is used to produce UPRs, which are the main ingredient in fiberglass reinforced resins used for marine and automotive applications and commercial and residential construction products. Maleic anhydride is also used in the production of lubricants, food additives and artificial sweeteners.

Product Group


Applications

Maleic anhydride

Boat hulls, automotive, construction, lubricant and fuel additives, countertops, agrochemicals, paper and food additives

Maleic anhydride catalyst and technology licensing

Maleic anhydride and 1-4 butanediol (BDO) and its derivatives, including polybutylene terephthalate (PBT) production

Maleic anhydride is produced by oxidizing either benzene or normal butane through the use of a catalyst. Our maleic anhydride technology is a proprietary fixed bed butane-based process with a solvent recovery and refining system. We believe that our process is superior in the areas of feedstock and energy efficiency and solvent recovery. The maleic anhydride-based route to BDO manufacture is currently the preferred process technology and is favored over the other routes, which utilize PO, butadiene or acetylene as feedstocks. As a result, the growth in demand for BDO supports growing demand for our maleic anhydride technology and catalyst. Generally, changes in price have resulted from a combination of changes in industry capacity utilization and underlying raw material costs.

We license our maleic anhydride technology and supply our catalysts to licensees and to worldwide merchant customers. Revenue from licensing and catalyst comes from new plant commissioning, as well as current plant retrofits and routine catalyst changes. Our licensing group also licenses technology on behalf of other Performance Products businesses and other segments.

Our key maleic anhydride customers include AOC, Ashland, Chevron Oronite, Cranston, Dixie, Ingevity, Lubrizol, MFG Chemical, Polynt-Reichhold and Tate & Lyle.

Sales and Marketing

We sell over 800 products to over 1,000 customers globally through our Performance Products regional sales and marketing organizations, which have extensive market knowledge, considerable chemical industry experience and well-established customer relationships.

In more specialty markets (e.g., lubricants, coatings, construction, agrochemicals, oilfield, automotive, gas treating and insulation), our marketing efforts are focused on how our product offerings perform in certain customer applications. We believe that this approach enhances the value of our product offerings and creates opportunities for ongoing differentiation in our development activities with our customers.

We provide extensive pre- and post-sales technical service support to our customers where our technical service professionals work closely with our research and development functions to tailor our product offerings to meet our customers unique and changing requirements. These technical service professionals interact closely with our marketing managers and business leadership teams to help guide future offerings and market approach strategies. In addition to our focused direct sales efforts, we maintain an extensive global network of distributors and agents that also sell our products. These distributors and agents typically promote our products to smaller end-use customers who cannot be served cost effectively by our direct sales forces.

10

Table of Contents

Manufacturing and Operations

Our Performance Products segment has the capacity to produce a variety of products at 10 manufacturing locations in North America, EAME, and Asia. These production capacities are as follows:

Current capacity


North


Product Area

America

EAME

APAC

Total

(millions of pounds)

Amines


760


257

(1) 

107


1,124

Maleic anhydride


340


231


571

Includes up to 30 million pounds of ethyleneamines that are made available from DowDuPont’s Terneuzen, The Netherlands facility by way of a long-term supply arrangement and 70 million pounds from AAC, our consolidated 50%-owned joint venture, located in Jubail, Saudi Arabia.

(1)    Includes up to 30 million pounds of ethyleneamines that are made available from Dow’s Terneuzen, The Netherlands facility by way of a long-term supply arrangement and 70 million pounds from AAC, our consolidated 50%-owned joint venture, located in Jubail, Saudi Arabia.

Our amines facilities are located globally. These facilities have a competitive cost base and use modern manufacturing units that allow for flexibility in production capabilities and technical innovation.

A number of our facilities are located within large integrated petrochemical manufacturing complexes. We believe this results in greater scale and lower costs for our products than we would be able to obtain if these facilities were stand-alone operations. These include our maleic anhydride facilities in Pensacola, Florida, Geismar, Louisiana and Moers, Germany and our ethyleneamines facility in Freeport, Texas.

Joint Ventures

Ethyleneamines Joint Venture. Since July 1, 2010, we have consolidated the results of AAC, our 50%-owned joint venture with the Zamil Group. AAC operates an ethyleneamines manufacturing plant in Jubail, Saudi Arabia. The plant has an approximate annual capacity of 70 million pounds. We purchase and sell all of the production from this joint venture.

Raw Materials

The main raw materials used in the production of our amines are EO, PO, glycols, EDC, caustic soda, ammonia, hydrogen, methylamines and acrylonitrile. The majority of these raw materials are available from multiple sources in the merchant market at competitive prices.

Maleic anhydride is produced by the reaction of normal butane with oxygen using our proprietary catalyst. The principal raw material is normal butane, which is purchased pursuant to long-term contracts and delivered to our Pensacola, Florida site by barge, to our facility in Geismar, Louisiana via pipeline and to our Moers, Germany site by railcar. Our maleic anhydride catalyst is toll manufactured by a third party according to our proprietary methods. These raw materials are available from multiple sources at competitive prices.

Competition

There are a small number of competitors for many of our amines due to the considerable customization of product formulations, the proprietary nature of many of our product applications and manufacturing processes and the relatively high research and development and technical costs involved. Our global competitors include BASF, Delamine, Dow, Evonik, Nouryon and Tosoh. We compete primarily on the basis of product performance, new product innovation and, to a lesser extent, on the basis of price.

In our maleic anhydride market, we compete primarily on the basis of price, customer service, technical support and logistics management. Our competitors include Lanxess, INEOS, Bartek and Ashland. We are a leading global supplier of fixed bed catalyst for the manufacture of maleic anhydride from n-butane. The main competitors in the fixed bed n-butane based maleic anhydride catalyst market include Clariant and Polynt-Reichhold. In our maleic anhydride technology licensing market, our primary competitor is Conser. We compete primarily on the basis of technological performance and service.

11

Table of Contents

Advanced Materials

General

Our Advanced Materials segment is a leading global manufacturer and marketer of technologically-advanced epoxy, acrylic and polyurethane-based polymer products. We focus on formulations and systems that are used to address customer-specific needs in a wide variety of industrial and consumer applications. Our products are used either as replacements for traditional materials or in applications where traditional materials do not meet demanding engineering specifications. For example, structural adhesives are used to replace metal rivets and advanced composites are used to replace traditional aluminum panels and other steel materials to lighten structures in aerospace, automotive and other transportation. Our Advanced Materials segment is characterized by the breadth of our product offering, our expertise in complex chemistry, our long-standing relationships with our customers, our ability to develop and adapt our technology and our applications expertise for new markets and new applications.

We operate synthesis, formulating and production facilities in North America, Europe, Asia and South America. We sell to nearly 1,700 customers in the following end markets: aerospace, automotive, liquid natural gas transport, coatings and construction, printed circuit boards, consumer, industrial and automotive electronics, consumer and industrial appliances, wind power generation, consumer/do it yourself (“DIY”), electrical power transmission and distribution, recreational sports equipment, medical appliances and food and beverage packaging.

Products and Markets

Aerospace. Our Advanced Materials segment is a leading global supplier of advanced, high-performance materials for the fabrication and repair of aircraft components. We supply leading aerospace companies with innovations in composites, adhesives, laminating and repair systems.

We offer a wide range of materials to the aerospace market under the ARALDITE®, EPIBOND®, EPOCAST® and URALANE® brands. Many of these products are qualified under the specification of major aerospace original equipment manufacturers (“OEM”), complying with appropriate regulations governing large civil aircraft.

Transportation and Industrial. We offer to the automotive, recreational sports equipment and industrial composite markets, including leading automotive OEM’s and Tier 1 suppliers, high end composite formulations. Lightweight, strength, flexibility, shorter cycle time and fatigue resistance are key requirements of our industrial partners. Our Advanced Materials segment had numerous awards from the JEC Composite Association for innovation in the composite industry.

ARALDITE® is an important brand in high-performance adhesive technologies. We offer formulation expertise in various chemistries, including epoxies, polyurethanes, methacrylates and phenolics. Our materials address requirements such as long open times for large area applications, fast-curing adhesives for early removal and rapid through-put, resistance to high temperature, water and chemicals, thixotropy for gap-filling or vertical applications, and toughness, impact-resistance and elasticity to cope with different thermal expansions when bonding larger structures. Our adhesives are used in a large variety of industrial applications and in the consumer/DIY market.

Electrical Engineering and Electronics. We are a leading global supplier of insulating materials for motors, generators, switchgears, distribution and instrument transformers, and insulators and bushings for utility and industrial applications. The products formulated by our Advanced Materials segment are designed to provide an extended service life and meet specific industry requirements for electrical insulation in indoor and outdoor environments.

In the field of electronics, our Advanced Materials segment has a long history delivering a wide range of solutions meeting stringent requirements for electronics applications, such as high temperature and chemical resistance, flame-retardancy and excellent mechanical and dielectric properties. The strong global push for e-vehicles opens up new opportunities in e-motor encapsulation.

Coatings and Construction. We offer expertise in curing technologies and a portfolio of specialized resins and additives to the manufacturers of paints and construction materials. Our specialty resins and additives, including epoxy hardeners and high solid or water based components, enable customers to address challenging industry requirements such as resistance to aggressive chemicals and high temperature, adhesion to difficult substrates, excellent mechanical properties, high drying speed and easy re-coatability, low temperature and sub-zero cure. Our product technologies enhance performance and productivity at low VOC and environmental impact in several coatings and construction applications, like heavy duty protection, marine, transportation, food packaging, flooring and chemical anchoring.

12

Table of Contents

Wind and Base Resins. Our products are used by leading wind blade manufacturers on a large range of applications from plugs to complete composite turbine blade production, as well as its assembly and repair. Our portfolio includes standard products as well as custom-made solutions formulated to meet specific customer requirements.

We also offer basic liquid and solid epoxy resins to the general formulators market.

Sales and Marketing

We maintain multiple routes to market to service our diverse and fragmented customer base throughout the world. These routes to market range from using our own direct sales force, technically-oriented distribution to mass distribution. Our direct sales force focuses on engineering solutions for our major customers who purchase significant amount of product. We use technically-oriented specialist distributors to augment our sales effort in niche markets and applications where we do not believe it is appropriate to develop direct sales resources. We use mass general distribution channels to sell our products into a wide range of general applications where technical expertise is less important, which reduces our overall selling expenses. We believe our use of multiple routes to market enables us to reach a broader customer base at an efficient cost.

We conduct sales activities through dedicated regional sales teams in EMEAI, Asia and the Americas. Our global customers are covered by key account managers who are familiar with the specific requirements of these customers. The management of long-standing customer relationships is critical to the sales and marketing process.

For our consumer/DIY range, with the exception of the Indian market, we have entered into branding and distribution arrangements. Under these arrangements, our distribution partners fund advertising and sales promotions, negotiate and sell to major retail chains, own inventories and provide store deliveries (and sometimes shelf merchandising) for ARALDITE® branded, ready-to-sell packaged products.

Manufacturing and Operations

We are a global business serving customers in three principal geographic regions: EAMEI, Asia and the Americas. To service our customers efficiently, we maintain manufacturing plants around the world with a strategy of global, regional and local manufacturing employed to optimize the level of service and minimize the cost to our customers. The following table summarizes the plants that we operate:

Description of Facility

Location

Synthesis

Formulations

Bad Säckingen, Germany

Bergkamen, Germany

Duxford, U.K.

East Lansing, Michigan

Ho Chi Minh City, Vietnam

Los Angeles, California

McIntosh, Alabama

Monthey, Switzerland

Pamplona, Spain

Panyu, China(1)

Taboão da Serra, Brazil

(1)    95%-owned and consolidated manufacturing joint venture with Guangzhou Sheng’an Package Company Limited.

Raw Materials

The principal raw materials we purchase for the manufacture of basic and advanced epoxy resins are epichlorohydrin, bisphenol A, MDA, phenol and aminophenols. We also purchase amines, polyols, isocyanates, acrylic materials, hardeners and fillers for the production of our formulated polymer systems and complex chemicals and additives. Raw material costs constitute a sizeable percentage of the costs for certain applications. We have supply contracts with a number of suppliers. The terms of our supply contracts vary, but, in general, these contracts contain provisions that set forth the quantities of product to be supplied and purchased. Formula pricing is sometimes used if advantageous for the business.

Additionally, we produce large volumes of some of our most important raw materials, such as BLR and its basic derivatives, which are the basic building blocks of many of our products. Approximately 70% of the BLR we produce is

13

Table of Contents

consumed internally in our downstream products. The balance of our BLR is sold in the merchant market, allowing us to increase the utilization of our production plants and lower our overall BLR production cost.

We consume certain amines produced by our Performance Products segment and isocyanates produced by our Polyurethanes segment, which we use to formulate Advanced Materials products.

Competition

The markets in which our Advanced Materials segment competes are diverse and require an appropriate human capital and asset footprint to compete effectively. The competitive intensity, capital investment and development of proprietary technology and maintenance of product research and development are all market specific. We operate dedicated technology centers in Basel, Switzerland; The Woodlands, Texas; and Shanghai, China in support of our product and technology development. Among our competitors are some of the world’s largest chemical companies with integrated raw material value chains to formulation companies that leverage intellectual and highly proprietary technology for problem solving.

Aerospace. Our leading market position is driven by our specialty resins and formulations offerings backed by customer-specific certifications, quality and consistency. These products are value-added, and differentiated, backed by many years of reliable global supply and service. Our major competitors include Hexion, Sumitomo, Wakayama Seika, 3M and Henkel.

Transportation and Industrial. Our composite and adhesive markets are being driven by light weighting, cost effective production and assembling, and are serviced by our leading positions in systems formulations backed by application and process manufacturing knowledge. Our product offering allows for reliable and competitive solutions, with a strong ARALDITE® brand reputation, a robust supply chain and a specialized distribution channel to fulfill customers’ expectant demand for service & quality. Our major competitors include Dow, Hexion, Henkel, Sika and 3M.

Electrical Engineering and Electronics. Our competitive position in these diverse markets is primarily based on formulations expertise, product reliability and performance, process expertise and technical support. Our competitive strengths result from our focus on defined market segment needs, our long-standing customer relationships, product reliability and technical performance, and reputation and recognition as a quality supplier. Our major competitors in these markets are Hexion, Hitachi, Nagase, Xiongrun, Peters, Taiyo, Elantas, 3M and Lord.

Coatings and Construction. Our long-standing position in these markets is served by our specialty resins and additives. Our additives and specialty resins offerings, including epoxy hardeners and high solid or water based components, are value-added products that allow our customers to differentiate their own products. Our major competitors include AirProducts / Evonik, Allnex, Hexion, BASF, EMS, Nissan and Kukdo.

Wind and Base Resins. The wind market for thermoset resins is being driven by light weighting and energy efficiency and our product offering with standard products and custom-made formulations allows for competitively priced solutions backed by an effective supply chain. The market for basic liquid and solid epoxy resins is driven by global supply-and-demand and industry consolidation and rationalization continues as a trend as macro-economic factors affect profitability and supply balance. Our major competitors in these markets include OLIN, Hexion, NanYa, Kukdo, Chang Chun and Adytia Birla.

Textile Effects

Our Textile Effects segment is a major global solutions provider in the wet processing of textiles across pretreatment, coloration, printing and finishing and provides a diverse portfolio of textile chemicals, dyes and digital inks. Our textile solutions provide color and enhance the aesthetic, durability and performance of finished textiles, including functionality such as wrinkle resistance and water and stain repellence. Our Textile Effects segment is characterized by the breadth of our product offering and long-standing relationships with our customers and downstream brands and retailers and OEMs (e.g., in the automotive sector).

We market products to customers in multiple end-markets, including consumer fashion apparel, sportswear, career and uniform apparel, military, automotive, home and institutional textiles and furnishings, carpet and other functional textiles. Competition within these markets is generally fragmented with few competitors who can offer complete solutions for each market. We develop and adapt our technology and our applications expertise for new markets and new applications to improve our competitive offering. Increased environmental regulations, particularly in many parts of Asia, and consumer awareness about the environmental impact of the apparel industry has resulted in increased demand for sustainably produced textiles. We are at the forefront of developing sustainable textiles with advanced technology such as non-fluorinated durable water repellence, and eco-friendly digital printing. Our

14

Table of Contents

award-winning AVITERA® reactive dyeing technology meets global industry environmental standards and helps textile mills increase yield, improve productivity and reduce processing costs by significantly reducing water and energy consumption. We operate 11 synthesis and formulation production sites in Asia, Europe and the Americas.

Since 2011, our Textile Effects segment has implemented a plan (the “Textile Effects Restructuring Plan”) to significantly restructure its business including geographically and commercially repositioning operations, optimizing supply chains and improving operational efficiency. The segment closed large, inefficient operations, transferred most of its production to facilities located closer to its customers, formed strategic partnerships and expanded in Mexico, Thailand and India, which has resulted in improved cash flows in the segment.

Products and Markets

Textile Chemicals. Our product offering in textile chemicals covers process and effect chemicals for the entire wet processing of textiles, such as pretreatment, optical brightener, dyeing and printing processes and finishing effects such as UV-protection, flame-retardancy, wrinkle resistance, water and oil repellency, moisture management and enhanced textile comfort.

We own a portfolio of textile chemical brands such as PHOBOTEX®, which is used in the sportswear sector and for outdoor textiles for products that provide non-fluorinated durable water repellency, UVITEX®, which is used for products that provide lasting white in the apparel sector to T-shirts and formal shirts as well as in in the home textile sector for towels and bed sheeting, and PYROVATEX®, which is used for products that provide non-halogenated flame-retardancy to functional textiles like protective workwear and textile insulation material used in the automotive sector.

Dyes. We provide dyes for all major fibers, including cotton, polyester, wool, nylon, silk and acrylic, each of which requires different dye chemistry for optimum results. We develop and offer processes for technological applications of dyes that enable our customers to improve their production yield and reduce their water and energy consumption. We focus on high-quality specialty dyes, which sets us apart from our Asian competitors who are primarily focused on commodity dyes. Because we provide dyes for all major fibers, we are able to differentiate ourselves from industry competitors by providing solutions for a broad range of fiber blended fabrics.

We own a portfolio of dye brands such as AVITERA®, for dyes used in T-shirts, formal shirts and towels for achieving sustainability, NOVACRON®, for dyes used widely across casual wear and home textiles, LANASOL®, for dyes used in wool formal suits, TERASIL®, for dyes used in sportswear, outerwear, home textiles and furnishings, ERIOFAST®, for dyes used in high-end intimate apparel and lingerie, TERATOP®, for dyes used across the automotive industry and NOVASOL®, for dyes used across military, protective wear and other technical textiles.

Digital Inks. We are at the forefront of the emerging trend in digital textile printing, including the time-to-market pressures of rapidly changing fashion trends and environmental concerns. Our range of digital inks solutions cover cotton, polyester, nylon, silk and other types of fiber blends, and are available for all mainstream digital printing technologies from plotters to industrial printers. Our innovative and sustainable digital inks technology is designed to help mills improve process efficiency, print reliability and improve overall environmental performance.

We own a portfolio of digital inks brands, such as LANASET® and TERASIL®, used for inks primarily for apparel and sportswear, and LYOSPERSE®, TERASIL® and NOVACRON®, used for inks for apparel and home textiles. We also have digital ink solutions designed for the fast-growing segments of soft-signage and technical textiles.

Markets. Textiles generally involve a complex matrix of fibers, colors, effects and functionality, and the resulting products range from fashion apparel to bulletproof vests, home and institutional textiles to carpet, and upholstery to automotive interiors. Our broad range of dyes, chemicals and digital inks enhance both the aesthetic appearance of these products and the functionality needed to ensure that they perform in their end-use markets. To meet the emerging digital market landscape and increasing demands for sustainable textiles, our Textile Effects segment has a comprehensive range of digital inks to meet this trend and new market opportunity. Since the requirements for these markets vary dramatically, our business strategy focuses on three major end markets—apparel, home and institutional furnishings, and functional and technical textiles. We work to provide the right balance of products and service to meet the technical and environmental challenges in each of these markets.

The apparel market focuses on products that provide an aesthetic effect through colors, as well as comfort and performance effects. Our solutions also extend to improving the processing efficiency within the textile mill. We offer a complete range of colors for cotton, polyester, wool and nylon that cover the range of shades needed for casualwear, sportswear, intimate apparel, and formal wear. Our dyes have been developed to ensure that they offer the highest levels of color durability currently available in the market. The Textile Effects segment’s AVITERA® dyes meet global

15

Table of Contents

industry environmental standards and helps textile mills increase yield, improve productivity and reduce processing costs by reducing water and energy consumption. Pretreatment and dyeing auxiliaries ensure that these fabrics are processed efficiently and effectively—cleaning the fabrics with fewer chemicals, less energy and less water and thereby minimizing the environmental footprint and reducing the processing costs. Silicone softeners may be used to enhance the feel of products. Textile Effects has developed advanced non-fluorinated durable water repellent technology that enhances the performance levels of sportswear and outdoor wear offering comfort and durability.

Home and institutional textiles include bed linen, towels, curtains, carpets, upholstery, mattress ticking and other textiles that are used within the home or institutions, such as hotels. Dyes, chemicals and digital ink technology for these applications enhance color and shape durability, comfort, prevent color fading and enable limitless design possibilities for consumers. Optical brighteners and other pretreatment products provide “bright white” effects for towels and sheeting.

Functional and technical textiles include automotive textiles, carpet, military fabrics protective wear, nonwoven and other technical fabrics. Though the product groups may differ in their end uses, the articles must provide a high-level of functionality, durability and performance in their respective markets. High-lightfast dyes and UV absorbers are used in automotive interiors and outdoor furnishings to provide colors that do not fade when exposed to sunlight and heat. Powerful stain repellent and release technology imparts durable protection for upholstery, military and medical fabrics, without affecting the color, breathability or feel of the fabric. Specialized dyes and prints create unique camouflage patterns for military uniforms, backpacks and tarps that will not fade through wash and wear or during exposure to the elements.

Our Textile Effects segment is at the forefront of the emerging trend in digital textile printing, including the time-to-market pressures of rapidly changing fashion trends and environmental concerns. The segment’s range of digital ink solutions covers cotton, polyester, silk and other types of fiber blends. The innovative and sustainable digital ink technology is designed to help mills improve process efficiency, print reliability and improve overall environmental performance.

Sales and Marketing

During 2019, approximately 64% of our sales were generated with approximately 1,600 direct customers through our global sales and technical services network and the remaining 36% is generated through our distribution partners. Our sales and technical services representatives work directly with our existing customers forming strong relationships and uncovering new opportunities. Demand for our products is subject to fabric trends and seasonal changes in connection with summer and winter fashion trends. As such, sales generally peak in the second quarter of the year as textile mills prepare for the winter fashion trends which tend to use darker shades and heavier fabric, thereby using more of our products.

In determining the markets on which we focus, we look at growth opportunity and value proposition. Consumption markets are primarily in developed economies, such as Europe and North America, while production markets are primarily in Asia, particularly China, India, Taiwan, Vietnam, Indonesia and Bangladesh. Our downstream marketing team engages with leading brands and retailers in developed economies while our sales force and manufacturing footprint are primarily in Asia, closer to the manufacturing and sourcing base for textiles. We believe that this set-up also enables us to take advantage of continuous demand growth due to demographic and lifestyle changes in emerging markets.

For our textile effects products, we focus on providing effect competence and process competence to our customers. Effect competence, which we define as delivering value-added effects to our customers’ products, enables us to capitalize on new and innovative technologies and to assist our customers in their efforts to differentiate themselves from competitors. Process competence, which we define as applying know-how and expertise to improve customers’ processes, allows us to utilize our technical service to reduce cost, enhance efficiency and offer recommendations to improve the ecological and environmental footprint in the wet processing of textiles.

We maintain strong customer relationships through the delivery of high levels of technical service and product innovation. There are 12 technical services laboratories in North America, South America, Europe and Asia that are close to our customers in these markets, which enables us to serve our customers with greater speed and flexibility.

Manufacturing and Operations

We are a global business serving customers in three principal geographic regions: EAME, the Americas and Asia. To service our customers efficiently, we maintain manufacturing plants around the world with a strategy of global,

16

Table of Contents

regional and local manufacturing employed to optimize the level of service and minimize the cost to our customers. The following table summarizes the capabilities of each of the plants that we operate:

Description of Facility

Textile Chemicals

Textile Dyes

Inks

Location


Synthesis


Formulation


Synthesis


Formulation


Formulation

Atotonilquillo, Mexico

Baroda, India

Bogota, Colombia

Charlotte, North Carolina

Fraijanes, Guatemala

Gandaria, Jakarta, Indonesia

Hangzhou, China

Langweid am Leich, Germany

Panyu, China(1)

Samutsakorn (Mahachai), Thailand

Taboão da Serra, Brazil

(1)95%-owned and consolidated manufacturing joint venture with Guangzhou Sheng’an Package Company Limited.

Joint Venture

In September 2015, our Textile Effects segment established Huntsman Pürsan Chemicals Kimya Sanayi ve Ticaret Limited Şirketi (“HPC”), a 60%-owned joint venture company in Turkey, for the formulation, sale and marketing of textile chemicals and dyes. HPC ceased operating in the third quarter of 2018. The shareholders of HPC are in the process of appointing a liquidator to liquidate the company.

Raw Materials

The manufacture of textile effects products requires a wide selection of raw materials (approximately 1,000 different chemicals), including amines, ethoxylates, acrylics and sulfones. No one raw material represents greater than 5% of our textile effects raw material expenditures. Raw material costs constitute a sizeable percentage of sales for certain applications. We have tolling arrangements with several Chinese suppliers, but the majority of our raw materials are not purchased under long-term contracts. The terms of our supply contracts vary, but, in general, these contracts contain provisions that set forth the quantities of product to be supplied and purchased.

Competition

We are a major global solutions provider for textile chemicals, dyes and digital inks in our chosen markets. Competition within the textile chemicals and dyes markets is generally fragmented with few competitors who can offer complete solutions for the entire textile markets. Key competitors within dyes include Archroma, Longsheng, Runtu, Jihua and DyStar. Key competitors within textile chemicals include Archroma, Nikka, Transfar/Tannatex, CHT and Rudolf. Key competitors within digital inks include Dover/MS, JK Group, Sensient/Xennia, DuPont, EFI/Reggiani, DyStar and SPG.

We believe that our competitive strengths include our product offering, which is characterized by its broad and deep technology range, high quality, significant integration between products and service, reliable technical expertise, long-standing relationships with customers, and strong business infrastructure in Asia. We are a leader in environmentally sustainable chemistry with products that help customers enhance efficiency and reduce their environmental footprint. We believe that we have more customer service capability and account management capability than any of our competitors worldwide. In addition, we engage regularly with downstream brands and retailers on industry and sustainability issues.

RESEARCH AND DEVELOPMENT

We support our business with a major commitment to research and development, technical services and process engineering improvement. Our research and development centers are located in The Woodlands, Texas; Everberg,

17

Table of Contents

Belgium; and Shanghai, China. Other regional development/technical service centers are located in Auburn Hills, Michigan (polyurethanes for the automotive industry); Derry, New Hampshire, Shanghai, China, Deggendorf, Germany and Ternate, Italy (polyurethanes); Basel, Switzerland and Panyu, China (advanced materials and textile effects); and Mumbai, India (textile effects).

INTELLECTUAL PROPERTY RIGHTS

Proprietary protection of our processes, apparatuses and other technology and inventions is important to our businesses. We own approximately 2,830 unexpired patents and have approximately 1,010 patent applications (including provisionals) currently pending. While a presumption of validity exists with respect to issued U.S. patents, we cannot assure that any of our patents will not be challenged, invalidated, circumvented or rendered unenforceable. Furthermore, we cannot assure the issuance of any pending patent application, or that if patents do issue, that these patents will provide meaningful protection against competitors or against competitive technologies. Additionally, our competitors or other third parties may obtain patents that restrict or preclude our ability to lawfully produce or sell our products in a competitive manner.

We also rely upon unpatented proprietary know-how and continuing technological innovation and other trade secrets to develop and maintain our competitive position. There can be no assurance, however, that confidentiality and other agreements into which we enter and have entered will not be breached, that they will provide meaningful protection for our trade secrets or proprietary know-how, or that adequate remedies will be available in the event of an unauthorized use or disclosure of such trade secrets and know-how. In addition, there can be no assurance that others will not obtain knowledge of these trade secrets through independent development or other access by legal means.

In addition to our own patents and patent applications and proprietary trade secrets and know-how, we are a party to certain licensing arrangements and other agreements authorizing us to use trade secrets, know-how and related technology and/or operate within the scope of certain patents owned by other entities. We also have licensed or sub-licensed intellectual property rights to third parties.

We have associated brand names with a number of our products, and we have approximately 4,110 trademark registrations and 190 pending trademark applications globally. These registrations and applications include extensions of protection under the Madrid system for the international registration of marks. However, there can be no assurance that the trademark registrations will provide meaningful protection against the use of similar trademarks by competitors, or that the value of our trademarks will not be diluted.

Because of the breadth and nature of our intellectual property rights and our business, we do not believe that any single intellectual property right (other than certain trademarks for which we intend to maintain the applicable registrations) is material to our business. Moreover, we do not believe that the termination of intellectual property rights expected to occur over the next several years, either individually or in the aggregate, will materially adversely affect our business, financial condition or results of operations.

EMPLOYEES

As of December 31, 2019, we employed approximately 10,000 associates in our operations around the world, including approximately 1,000 employees associated with the Chemical Intermediates Businesses that was sold on January 3, 2020. Approximately 3,000 of these employees are located in the U.S., while approximately 7,000 are located in other countries.

ENVIRONMENTAL, HEALTH AND SAFETY MATTERS

General

We are subject to extensive federal, state, local and international laws, regulations, rules and ordinances relating to occupational health and safety, process safety, pollution, protection of the environment and natural resources, product management and distribution, and the generation, storage, handling, transportation, treatment, disposal and remediation of hazardous substances and waste materials. In the ordinary course of business, we are subject to frequent environmental inspections and monitoring and occasional investigations by governmental enforcement authorities. In addition, our production facilities require operating permits that are subject to renewal, modification and, in certain circumstances, revocation. Actual or alleged violations of safety laws, environmental laws or permit requirements could result in restrictions or prohibitions on plant operations or product distribution, substantial civil or criminal sanctions, or injunctions limiting or prohibiting our operations altogether. In addition, some environmental laws may impose liability on a strict, joint and several basis. Moreover, changes in environmental regulations could inhibit or interrupt our

18

Table of Contents

operations, or require us to modify our facilities or operations and make significant environmental compliance expenditures. Accordingly, environmental or regulatory matters may cause us to incur significant unanticipated losses, costs or liabilities. Information related to environmental, health and safety (“EHS”) matters may also be found in other areas of this report including “—Item 1A. Risk Factors,” “Note 2. Summary of Significant Accounting Policies—Environmental Expenditures” to our consolidated financial statements and “Note 22. Environmental Health and Safety Matters” to our consolidated financial statements.

Environmental, Health and Safety Systems

We are committed to achieving and maintaining compliance with all applicable EHS legal requirements, and we have developed policies and management systems that are intended to identify the multitude of EHS legal requirements applicable to our operations, enhance compliance with applicable legal requirements, improve the safety of our employees, contractors, community neighbors and customers and minimize the production and emission of wastes and other pollutants. We cannot guarantee, however, that these policies and systems will always be effective or that we will be able to manage EHS legal requirements without incurring substantial costs. Although EHS legal requirements are constantly changing and are frequently difficult to comply with, these EHS management systems are designed to assist us in our compliance goals while also fostering efficiency and improvement and reducing overall risk to us.

Environmental Remediation

We have incurred, and we may in the future incur, liability to investigate and clean up waste or contamination at our current or former facilities or facilities operated by third parties at which we may have disposed of waste or other materials. Similarly, we may incur costs for the cleanup of waste that was disposed of prior to the purchase of our businesses. Under some circumstances, the scope of our liability may extend to damages to natural resources.

In cases where our potential liability arises from historical contamination based on operations and other events occurring prior to our ownership of a business or specific facility, we frequently obtain an indemnity agreement from the prior owner addressing remediation liabilities arising from pre-closing conditions. We have successfully exercised our rights under these contractual covenants for a number of sites and, where applicable, mitigated our ultimate remediation liability. We cannot assure you, however, that the liabilities for all such matters subject to indemnity will be honored by the prior owner or that our existing indemnities will be sufficient to cover our liabilities for such matters.

Based on available information and the indemnification rights we believe are likely to be available, we believe that the costs to investigate and remediate known contamination will not have a material effect on our financial statements. However, if such indemnities are not honored or do not fully cover the costs of investigation and remediation or we are required to contribute to such costs, then such expenditures may have a material effect on our financial statements. At the current time, we are unable to estimate the total cost, exclusive of indemnification benefits, to remediate contaminated sites.

Regulatory Matters

Greenhouse Gas Regulation and Climate Change

Globally, our operations are increasingly subject to regulations that seek to reduce emissions of greenhouse gases (“GHGs”), such as carbon dioxide and methane, which may be contributing to changes in the earth’s climate. At the Durban negotiations of the Conference of the Parties to the Kyoto Protocol in 2012, a limited group of nations, including the European Union (the “EU”), agreed to a second commitment period for the Kyoto Protocol, an international treaty that provides for reductions in GHG emissions. More significantly, the EU GHG Emissions Trading System (“ETS”), established pursuant to the Kyoto Protocol to reduce GHG emissions in the EU, continues in its third phase. The EU parliament has used a process to formalize “backloading”—the withholding of GHG allowances during the trading period from 2014 to 2016 with additional allowances auctioned during 2019 to 2020—to prop up carbon prices. As backloading is only a temporary measure, a sustainable solution to the imbalance between supply and demand requires structural changes to the ETS. To that end, the European Commission established a market stability reserve to address the current surplus of allowances and improve the system’s resilience that started operating in 2019. In addition, the EU has announced the binding target to reduce domestic GHG emissions by at least 40% below the 1990 level by 2030. The EU has set a binding target of increasing the share of renewable energy to at least 27% of the EU’s energy consumption by 2030, and additional proposals have been made to increase the target to 35%.

In addition, at the 2015 United Nations Framework Convention on Climate Change in Paris, the U.S. and nearly 200 other nations entered into an international climate agreement, which went into effect in November 2016 (the “Paris

19

Table of Contents

Agreement”). Although the agreement does not create any binding obligations for nations to limit their GHG emissions, it does include pledges to voluntarily limit or reduce future emissions. However, in August 2017 the U.S. informed the United Nations that it is withdrawing from the Paris Agreement. The Paris Agreement provides for a four-year exit process, which would result in an effective exit date of November 2020. The United States’ adherence to the exit process and/or the terms on which the United States may re-enter the Paris Agreement or a separately negotiated agreement are unclear at this time. Additionally, in response to the United States’ withdrawal announcement, various corporations, investors, and U.S. state and local governments have publicly pledged to further the goals of the Paris Agreement.

Domestic efforts to curb GHG emissions are being led by the U.S. Environmental Protection Agency’s (the “EPA”) GHG regulations and similar programs of certain states. To the extent that our domestic operations are subject to the EPA’s GHG regulations, we may face increased capital and operating costs associated with new or expanded facilities. Significant expansions of our existing facilities or construction of new facilities may be subject to the Clean Air Act’s (the “CAA”) requirements for pollutants regulated under the Prevention of Significant Deterioration and Title V programs. Some of our facilities are also subject to the EPA’s Mandatory Reporting of Greenhouse Gases rule, and any further regulation may increase our operational costs.

We are already managing and reporting GHG emissions, to varying degrees, as required by law for our sites in locations subject to U.S. federal and state requirements, Kyoto Protocol obligations and/or ETS requirements. Although these sites are subject to existing GHG legislation, few have experienced or anticipate significant cost increases as a result of these programs, although it is possible that GHG emission restrictions may increase over time. Potential consequences of such restrictions include capital requirements to modify assets to meet GHG emission restrictions and/or increases in energy costs above the level of general inflation, as well as direct compliance costs. Currently, however, it is not possible to estimate the likely financial impact of potential future regulation on any of our sites.

Finally, it should be noted that some scientists have concluded that increasing concentrations of GHGs in the earth’s atmosphere may produce climate changes that have significant physical effects, such as increased frequency and severity of storms, droughts, and floods and other climatic events. If any of those effects were to occur, they could have an adverse effect on our assets and operations.

AVAILABLE INFORMATION

We maintain an internet website at http://www.huntsman.com. Our annual reports on Form 10-K, quarterly reports on Form 10-Q, current reports on Form 8-K and amendments to these reports are available free of charge through our website as soon as reasonably practicable after we file this material with the SEC. We also provide electronic or paper copies of our SEC filings free of charge upon request.

GLOSSARY OF CHEMICAL TERMS

BDO—butane diol

BLR—base liquid resin

DGA® Agent—DIGLYCOLAMINE® agent

DPA—diphenylamine

EDC—ethylene dichloride

EG—ethylene glycol

EO—ethylene oxide

MDA—methylene dioxy amphetamine

MDI—methyl diphenyl diisocyanate

MNB—mononitrobenzene

MTBE—methyl tertiary-butyl ether

PBT—polybutylene terephthalate

PO—propylene oxide

Polyols—a substance containing several hydroxyl groups. A diol, triol and tetrol contain two, three and four hydroxyl groups, respectively.

TDI—toluene diisocyanate

TPU—thermoplastic polyurethane

UPR—unsaturated polyester resin

20

Table of Contents

ITEM 1A.  RISK FACTORS

Any of the following risks could materially and adversely affect our business, results of operations, financial condition and liquidity.

RISKS RELATED TO OUR BUSINESS

Our industry is affected by global economic factors, including risks associated with volatile economic conditions.

Our financial results are substantially dependent on overall economic conditions in the U.S., Europe and Asia. Declining economic conditions in all or any of these locations—or negative perceptions about economic conditions—could result in a substantial decrease in demand for our products and could adversely affect our business. The timing and extent of any changes to currently prevailing market conditions is uncertain, and supply and demand may be unbalanced at any time. Uncertain economic conditions and market instability make it particularly difficult for us to forecast demand trends. As a consequence, we may not be able to accurately predict future economic conditions or the effect of such conditions on our financial condition or results of operations. We can give no assurances as to the timing, extent or duration of the current or future economic cycles impacting the industries in which we operate.

Disruptions in production at our manufacturing facilities may have a material adverse impact on our business, results of operations and/or financial condition.

Manufacturing facilities in our industry are subject to planned and unplanned production shutdowns, turnarounds, outages and other disruptions. Any serious disruption at any of our facilities could impair our ability to use our facilities and have a material adverse impact on our revenues and increase our costs and expenses. Alternative facilities with sufficient capacity may not be available, may cost substantially more or may take a significant time to increase production or qualify with our customers, any of which could negatively impact our business, results of operations and/or financial condition. Long-term production disruptions may cause our customers to seek alternative supply which could further adversely affect our profitability.

Unplanned production disruptions may occur for external reasons including natural disasters, weather, disease, strikes, transportation interruption, government regulation, political unrest or terrorism, or internal reasons, such as fire, unplanned maintenance or other manufacturing problems. For example, the recent emergence of a novel strain of coronavirus in the city of Wuhan and the Hubei province of China has resulted in certain emergency measures to combat the spread of the virus, including extension of the Lunar New Year holidays, implementation of travel bans and closure of factories and businesses. While the full impact of the outbreak is unknown at this time, we have restricted employee travel to China and idled our manufacturing facilities in the country as a safety precaution. Any significant production disruption could have a material impact on our operations, operating results and financial condition.

In addition, we rely on a number of vendors, suppliers, and in some cases sole-source suppliers, service providers, toll manufacturers and collaborations with other industry participants to provide us with chemicals, feedstocks and other raw materials, along with energy sources and, in certain cases, facilities that we need to operate our business. If the business of these third parties is disrupted, some of these companies could be forced to reduce their output, shut down their operations or file for bankruptcy protection. If this were to occur, it could adversely affect their ability to provide us with the raw materials, energy sources or facilities that we need, which could materially disrupt our operations, including the production of certain of our products. Moreover, it could be difficult to find replacements for certain of our business partners without incurring significant delays or cost increases. All of these risks could have a material adverse effect on our business, results of operations, financial condition and liquidity.

While we maintain business recovery plans that are intended to allow us to recover from natural disasters or other events that could disrupt our business, we cannot provide assurances that our plans would fully protect us from the effects of all such disasters or from events that might increase in frequency or intensity due to climate change. In addition, insurance may not adequately compensate us for any losses incurred as a result of natural or other disasters. In areas prone to frequent natural or other disasters, insurance may become increasingly expensive or not available at all. Furthermore, some potential climate-driven losses, particularly inundation due to sea-level rise, may pose long-term risks to our physical facilities such that operations cannot be restored in their current locations.

21

Table of Contents

The markets for many of our products are cyclical and volatile, and we may experience depressed market conditions for such products.

The cyclicality that the markets for many of our products experience occurs as a result of alternating periods of tight supply, causing prices and margins to increase, followed by periods of lower capacity utilization, resulting in oversupply and declining prices and margins. The volatility these markets experience occurs as a result of changes in the demand for products as a consequence of global economic activity, changes in energy prices and changes in customers’ requirements. For example, demand for our products depends in part on the housing and construction industries, which are cyclical in nature and have historically been impacted by downturns in the economy. The supply-demand balance is also impacted by capacity additions or reductions that result in changes in utilization rates. The cyclicality and volatility of our industry results in significant fluctuations in profits and cash flow from period to period and over the business cycle.

Changes in U.S. trade policies and other factors beyond our control may adversely impact our business, financial condition and results of operations.


Tariffs, retaliatory tariffs or other trade restrictions on products and materials that our customers export, including among others, textile, automotive and consumer products, could cause the prices of our customers’ products to increase which could reduce demand for such products, or reduce our customer margins, and adversely impact their revenues, financial results and ability to service debt; which, in turn, could adversely affect our financial condition and results of operations. Additionally, our products may become directly subject to future tariffs, which would in turn raise the cost to our customers and could adversely affect the demand for our products. Direct or unforeseen consequences of tariffs, retaliatory tariffs or other trade restrictions may also alter the competitive landscape of our products in one or more regions of the world.


It remains unclear how the U.S. Administration or foreign governments will act with respect to tariffs, international trade agreements and policies. For example, any future withdrawal or renegotiation of trade agreements, or the failure to reach agreement over trade agreements, or the imposition of new or increased tariffs, or the more aggressive prosecution of trade disputes with countries like China, may increase costs or reduce profitability, or adversely affect our ability to operate our business and execute our growth strategy. As result, a trade war or other governmental action related to tariffs or international trade agreements or policies has the potential to negatively impact ours and/or our customers' costs, demand for our customers’ products, and/or the global economy or certain sectors thereof and, thus, adversely impact our business, financial condition and results of operations.

Our results of operations may be adversely affected by international business risks, including fluctuations in currency exchange rates, legal restrictions and taxes.

We conduct a majority of our business operations outside the U.S., and these operations are subject to risks normally associated with international operations. These risks include the need to convert currencies that may be received for our products into currencies in which we purchase raw materials or pay for services, which could result in a gain or loss depending on fluctuations in exchange rates. We transact business in many foreign currencies, including euros, Swiss francs, Chinese renminbi, Indian rupees, Brazilian reals and Thai bahts. We translate our local currency financial results into U.S. dollars based on average exchange rates prevailing during the reporting period or the exchange rate at the end of that period. During times of a strengthening U.S. dollar, our reported international sales and earnings may be reduced because the local currency may translate into fewer U.S. dollars. Because we currently have significant operations located outside the U.S., we are exposed to fluctuations in global currency rates which may result in gains or losses on our financial statements.

Other risks of international operations include trade barriers, tariffs, exchange controls, cash repatriation restrictions, national and regional labor strikes, social and political risks, general economic risks and required compliance with a variety of U.S. and foreign laws, including monetary policies, tax laws, the Foreign Corrupt Practices Act (and foreign equivalents), export controls and regulations administered by the Office of Foreign Assets Control. Any changes in tariffs or trade barriers could make our products less competitive compared to other producers not subject to the same tariffs or trade barriers. Any decision to repatriate cash as dividends could subject us to foreign and U.S. federal and state income taxes without any offsetting foreign tax credit relief. Although we maintain an anti-corruption compliance program throughout our company, violations of our compliance program may result in criminal or civil sanctions, including material monetary fines, penalties and other costs against us or our employees, and may have a material adverse effect on our business. Furthermore, in foreign jurisdictions where legal processes may vary from country to country, we may experience difficulty in enforcing agreements. In jurisdictions where bankruptcy laws and practices

22

Table of Contents

vary, we may experience difficulty collecting foreign receivables through foreign legal systems. The occurrence of these risks, among others, could disrupt the businesses of our international subsidiaries, which could significantly affect their ability to make distributions to us.

We operate in a significant number of jurisdictions, which contributes to the volatility of our effective tax rate. Changes in tax laws or the interpretation of tax laws in the jurisdictions in which we operate may affect our effective tax rate. In addition, generally accepted accounting principles in the U.S. (“GAAP” or “U.S. GAAP”) have required us to place valuation allowances against our net operating losses and other deferred tax assets in certain tax jurisdictions. These valuation allowances result from analysis of positive and negative evidence supporting the realization of tax benefits. Negative evidence includes a cumulative history of pre-tax operating losses in specific tax jurisdictions. Changes in valuation allowances have resulted in material fluctuations in our effective tax rate. Economic conditions or changes in tax laws may dictate the continued imposition of current valuation allowances and, potentially, the establishment of new valuation allowances. While significant valuation allowances remain, our effective tax rate will likely continue to experience significant fluctuations. Furthermore, certain foreign jurisdictions may take actions to delay our ability to collect value-added tax refunds.

Significant price volatility or interruptions in supply of our raw materials may result in increased costs that we may be unable to pass on to our customers, which could reduce our profitability.

We purchase a substantial portion of our raw materials from third-party suppliers and the cost of these raw materials represents a substantial portion of our operating expenses. The prices for a number of these raw materials generally follow price trends of, and vary with market conditions for, crude oil and natural gas feedstocks, which are highly volatile and cyclical. For example, the market for crude oil and natural gas feedstocks experienced depressed pricing throughout the second half of 2018, leading to favorable prices for the raw materials that we purchase from third parties. Lower raw material prices, however, can lead to downward pressure on selling prices for certain of our products leading to reduced revenue. Our supply agreements typically provide for market-based pricing and provide us only limited protection against price volatility. While we attempt to match cost increases with corresponding product price increases, we are not always able to raise product prices immediately or at all. Timing differences between raw material prices, which may change daily, and contract product prices, which in many cases are negotiated only monthly or less often, have had and may continue to have a negative effect on our cash flow. Any cost increase that we are not able to pass on to our customers could have a material adverse effect on our business, results of operations, financial condition and liquidity.

In general, the feedstocks and other raw materials we consume are organic chemical commodity products that are readily available at market prices. There are, however, several raw materials for which there are only a limited number of suppliers or a single supplier. To mitigate potential supply constraints, we frequently enter into supply agreements with particular suppliers, evaluate alternative sources of supply and evaluate alternative technologies to avoid reliance on limited or sole-source suppliers. In addition, where supply relationships are concentrated, particular attention is paid by the parties to ensure strategic intentions are aligned to facilitate long-term planning. If certain of our suppliers are unable to meet their obligations under present supply agreements, we may be forced to pay higher prices to obtain the necessary raw materials from other sources and we may not be able to increase prices for our finished products to recoup the higher raw materials costs. Any interruption in the supply of raw materials could increase our costs or decrease our revenues, which could reduce our cash flow. The inability of a supplier to meet our raw material needs could have a material adverse effect on our financial statements and results of operations.

The number of sources for and availability of certain raw materials is also specific to the particular geographical region in which a facility is located. Political and economic instability in the countries from which we purchase our raw material supplies could adversely affect their availability. In addition, if raw materials become unavailable within a geographic area from which they are now sourced, then we may not be able to obtain suitable or cost-effective substitutes. We may also experience higher operating costs such as energy costs, which could affect our profitability. We may not always be able to increase our selling prices to offset the impact of any higher production costs or reduced production levels, which could reduce our earnings and decrease our liquidity.

Our results of operations and equity method investment in Venator may fluctuate significantly depending upon the changes in market value of Venator shares.

In August 2017, we separated the P&A Business through an IPO of ordinary shares of Venator, formerly a wholly-owned subsidiary. On December 3, 2018, we sold an aggregate of 4,334,389, or approximately 4%, of Venator ordinary shares. Following this transaction, we retained approximately 49% ownership in Venator, and we elected the

23

Table of Contents

fair value option to account for our equity method investment in Venator post deconsolidation, in which case the investment balance is marked to fair value each reporting period and the impact of changes in fair value of the equity method investment are reported in earnings. Under this approach, our results of operations and equity method investment in Venator could fluctuate significantly depending upon the changes in market value of Venator common stock. Specifically, the market price for Venator’s ordinary shares has been highly volatile, and the market from time to time has experienced significant price fluctuations. For example, during the year ended December 31, 2019, Venator’s stock price ranged from a low of $1.85 to a high of $7.24. As result, the cyclicality and volatility of Venator’s stock price can result in significant fluctuations in our results of operations and equity method investment from quarter to quarter.

Our efforts to grow and transform our businesses may require significant investments; if our strategies are unsuccessful, our business, results of operations and/or financial condition may be materially adversely affected.

We continuously evaluate opportunities for growth and change. These initiatives may involve making acquisitions, entering into partnerships and joint ventures, divesting assets, restructuring our existing operations and assets, creating new financial structures and building new facilities—any of which could require a significant investment and subject us to new kinds of risks. We have incurred indebtedness to finance these opportunities, and we may incur additional indebtedness to finance future initiatives. If our strategies for growth and change are not successful, we could face increased financial pressure, such as increased cash flow demands, reduced liquidity and diminished access to financial markets, and the equity value of our businesses could be diluted.

The implementation of strategies for growth and change may create additional risks, including:

diversion of management time and attention away from existing operations;
requiring capital investment that could otherwise be used for the operation and growth of our existing businesses;
disruptions to important business relationships;
increased operating costs;
limitations imposed by various governmental entities; and
difficulties due to lack of or limited prior experience in any new markets we may enter.

Our inability to mitigate these risks or other problems encountered in connection with our strategies for growth and change could have a material adverse effect on our business, results of operations and financial condition. In addition, we may fail to fully achieve the savings or growth projected for current or future initiatives notwithstanding the expenditure of substantial resources in pursuit thereof.

We may have difficulties integrating acquired businesses and as a result, our business, results of operations and/or financial condition may be materially adversely affected.

We have completed a number of acquisitions and we will continue to acquire additional businesses and enter into joint ventures as part of our business strategy. Growth through acquisitions and joint ventures involves risks, including:

inability to efficiently operate new businesses or to integrate acquired businesses and products;
inability to accurately predict delays in realizing the costs and benefits of acquisitions, partnerships, or joint ventures;
unexpected losses of customers or suppliers of an acquired or existing business;
difficulties in retaining key employees of acquired businesses;
difficulties in realizing projected synergies;
inability to efficiently operate new businesses or to integrate acquired businesses and products;
inability to accurately predict delays in realizing the costs and benefits of acquisitions, partnerships, or joint ventures;
unexpected losses of customers or suppliers of an acquired or existing business;
difficulties in retaining key employees of acquired businesses;
difficulties in realizing projected synergies; and
exposure to unanticipated liabilities, including unexpected environmental exposures, product liability or illegal activities conducted by an acquired company or a joint venture partner.

24

Table of Contents

Our inability to address these risks could cause us to fail to realize the anticipated benefits of such acquisitions or joint ventures and could have a material adverse effect on our business, results of operations and financial condition.

The industries in which we compete are highly competitive, and we may not be able to compete effectively with our competitors that have greater financial resources, which could have a material adverse effect on our business, results of operations and financial condition.

The industries in which we operate are highly competitive. Among our competitors are some of the world’s largest chemical companies and major integrated petroleum companies that have their own raw material resources. Changes in the competitive landscape could make it difficult for us to retain our competitive position in various products and markets throughout the world. Some of the companies with whom we compete may be able to produce products more economically than we can. Furthermore, some of our competitors have greater financial resources, which may enable them to invest significant capital into their businesses, including expenditures for research and development.

While we are engaged in a range of research and development programs to develop new products and processes, to improve and refine existing products and processes, and to develop new applications for existing products, the failure to develop new products, processes or applications could make us less competitive. Moreover, if any of our current or future competitors develops proprietary technology that enables them to produce products at a significantly lower cost, our technology could be rendered uneconomical or obsolete.

Further, it is possible that we could abandon certain products, processes, or applications due to potential infringement of third party intellectual property rights or that we could be named in future litigation for the infringement or misappropriation of a competitor’s or other third party’s intellectual property rights, which could include a claim for injunctive relief and damages, and, if so, such adverse results could have a material adverse effect on our business, results of operations and financial position. In addition, certain of our competitors in various countries in which we do business, including China, may be owned by or affiliated with members of local governments and political entities.

These competitors may get special treatment with respect to regulatory compliance and product registration, while certain of our products, including those based on new technologies, may be delayed or even prevented from entering into the local market.

Certain of our businesses use technology that is widely available. Accordingly, barriers to entry, apart from capital availability, may be low in certain product segments of our business. The entrance of new competitors into any of our businesses may reduce our ability to maintain margins or capture improving margins in circumstances where capacity utilization in the industry is increasing. Further, petroleum-rich countries have become more significant participants in the petrochemical industry and may expand their roles significantly in the future. Increased competition in any of our businesses could compel us to reduce the prices of our products, which could result in reduced margins and loss of market share and have a material adverse effect on our business, results of operations, financial condition and liquidity.

We are subject to risks relating to our information technology systems, and any technology disruption or cybersecurity incident could negatively affect our operations.

We rely on information technology systems across our operations, including for management, supply chain and financial information and various other processes and transactions. Our ability to effectively manage our business depends on the security, reliability and capacity of these systems. Our technology systems or the technology systems of third parties on which we rely, are vulnerable to disruption from circumstances beyond our control including fire, natural disasters, power outages, system failures, security breaches, espionage, cyber-attacks, viruses, theft and inadvertent release of information. Any such disruption to these Information technology systems could disrupt our operations or result in the disclosure of proprietary information about our business or confidential information concerning our customers or employees which could result in negative publicity/brand damage, violation of privacy laws, potential liability, including litigation/investigation/remediation or other legal actions against us or the imposition of penalties, fines, fees or liabilities, which may not be covered by our insurance policies. Any or all the above would potentially cause delays or cancellations of customer orders or impede the manufacture or shipment of products, processing of transactions or reporting of financial results.

While we have invested and will continue to invest in technology security initiatives and disaster recovery plans, we may not be able to implement measures that will protect against all the significant risks to our information technology systems. We have put in place security measures designed to protect against the misappropriation or corruption of our systems, intentional or unintentional disclosure of confidential information, or disruption of our

25

Table of Contents

operations. Current employees have, and former employees may have, access to a significant amount of information regarding our operations which could be disclosed to our competitors or otherwise used to harm us. Moreover, our operations in certain locations, such as China, may be particularly vulnerable to security attacks or other problems. Any breach of our security measures could result in unauthorized access to and misappropriation of our information, corruption of data or disruption of operations or transactions, any of which could have a material adverse effect on our business. In addition, we could be required to expend significant additional efforts to respond to information technology issues or to protect against threatened or actual security breaches.

Finally, data privacy is subject to frequently changing rules and regulations in countries where we do business. For example, the EU adopted a new regulation that became effective in May 2018, the General Data Protection Regulation (“GDPR”), which requires companies to meet new regulations regarding the handling of personal data. Our failure to successfully implement or comply with appropriate processes to adhere to the GDPR requirements could result in substantial fines or penalties and legal liability which could tarnish our reputation.

Agreements governing our debt may restrict our ability to engage in certain business activities or to obtain additional financing.

The agreements governing our debt arrangements contain certain restrictive covenants. These covenants may limit or prohibit our ability to among other things, incur additional indebtedness; make investments; create liens; enter into transactions with affiliates; enter into sale and leaseback transactions; merge or consolidate; and transfer or sell assets. Some of our strategies may necessitate receiving consents or waivers under our debt arrangements, which could be withheld.

Our failure to comply with any of our debt covenants, or our failure to make payments of principal or interest on our debt, could result in a default, or trigger cross-default or acceleration provisions, under our debt agreements. An event of default could result in our debt obligations becoming immediately due and payable, cause our creditors to terminate their lending commitments. Any of the foregoing occurrences could have a material adverse effect on our business, results of operations and financial condition. For more information regarding our debt covenants, see “Note 15. Debt—Compliance with Covenants” to our consolidated financial statements.

Our operations involve risks that may increase our operating costs, which could reduce our profitability.

Although we take precautions to enhance the safety of our operations and minimize the risk of disruptions, our operations are subject to hazards inherent in the manufacturing and marketing of chemical and other products. These hazards include: chemical spills, pipeline leaks and ruptures, storage tank leaks, discharges or releases of toxic or hazardous substances or gases and other hazards incident to the manufacturing, processing, handling, transportation and storage of dangerous chemicals. We are also potentially subject to other hazards, including natural disasters and severe weather; explosions and fires; transportation problems, including interruptions, spills and leaks; mechanical failures; unscheduled downtimes; labor difficulties; remediation complications; and other risks. In addition, some equipment and operations at our facilities are owned or controlled by third parties who may not be fully integrated into our safety programs and over whom we are able to exercise limited control. Many potential hazards can cause bodily injury and loss of life, severe damage to or destruction of property and equipment and environmental damage, and may result in suspension of operations and the imposition of civil or criminal penalties and liabilities. Furthermore, we are subject to present and future claims with respect to workplace exposure, exposure of contractors on our premises as well as other persons located nearby, workers’ compensation and other matters.

We maintain property, business interruption, products liability and casualty insurance policies which we believe are in accordance with customary industry practices, as well as insurance policies covering other types of risks, including pollution legal liability insurance, but we are not fully insured against all potential hazards and risks incident to our business. Each of these insurance policies is subject to customary exclusions, deductibles and coverage limits, in accordance with industry standards and practices. As a result of market conditions, premiums and deductibles for certain insurance policies can increase substantially and, in some instances, certain insurance may become unavailable or available only for reduced amounts of coverage. If we were to incur a significant liability for which we were not fully insured, it could have a material adverse effect on our business, results of operations, financial condition and liquidity.

In addition, we are subject to various claims and litigation in the ordinary course of business. We are a party to various pending lawsuits and proceedings. For more information, see “—Item 3. Legal Proceedings” below.

26

Table of Contents

We are subject to many EHS regulations that may result in unanticipated costs or liabilities, which could reduce our profitability.

We are subject to extensive federal, state, local and foreign laws, regulations, rules and ordinances relating to pollution, protection of the environment and human health and safety, and the generation, storage, handling, transportation, treatment, disposal and remediation of hazardous substances and waste materials. Actual or alleged violations of EHS laws or permit requirements could result in restrictions or prohibitions on plant operations and substantial civil or criminal sanctions, as well as, under some EHS laws, the assessment of strict liability and/or joint and several liability.

Many of our products and operations are subject to the chemical control laws of the countries in which they are located. These laws include the regulation of chemical substances and inventories under the Toxic Substances Control Act (“TSCA”) in the U.S. and the Registration, Evaluation and Authorization of Chemicals (“REACH”) and the Classification, Labeling and Packaging of substances and mixtures (“CLP”) regulations in Europe. Analogous regimes exist in other parts of the world, including China, South Korea, and Taiwan. In addition, a number of countries where we operate, including the U.K., have adopted rules to conform chemical labeling in accordance with the globally harmonized system. Many of these foreign regulatory regimes are in the process of a multi-year implementation period for these rules.

Additional new laws and regulations may be enacted or adopted by various regulatory agencies globally. For example, in the U.S., the EPA finalized revisions to its Risk Management Program in January 2017. The revisions include new requirements for certain facilities to perform hazard analyses, third-party auditing, incident investigations and root cause analyses, emergency response exercises, and to publicly share chemical and process information. The EPA proposed to delay the rule’s effect until February 2019; however, a ruling by the U.S. Court of Appeals for the D.C. Circuit on September 21, 2018 made the Risk Management Program rule amendment effective immediately. The EPA finalized a reconsideration rule on November 20, 2019 that rescinded several of the 2017 revisions to the Risk Management Program rule. The U.S. Occupational Safety and Health Administration had previously announced that it was considering changes to its Process Safety Management standards that parallel EPA’s Risk Management Program; but additional action appears unlikely at this time. In addition, TSCA reform legislation was enacted in June 2016, and the EPA has begun the process of issuing new chemical control regulations. EPA issued several final rules in 2017 and 2018 under the revised TSCA related to existing chemicals, including the following: (i) a rule to establish EPA’s process and criteria for identifying chemicals for risk evaluation; (ii) a rule to establish EPA’s process for evaluating high priority chemicals and their uses to determine whether or not they present an unreasonable risk to health or the environment; and (iii) a rule to require industry reporting of chemicals manufactured or processed in the U.S. over the past 10 years. In April 2019, EPA proposed a revision to its Chemical Data Reporting rule under TSCA, which would change reporting requirements. The EPA has also released its framework for approving new chemicals and new uses of existing chemicals. Under the framework, a new chemical or use presents an unreasonable risk if it exceeds set standards. Such a finding could result in either the issuance of rules restricting the use of the chemical being evaluated or in the need for additional testing. The costs of compliance with any new laws or regulations cannot be estimated until the manner in which they will be implemented has been more precisely defined.

Furthermore, governmental, regulatory and societal demands for increasing levels of product safety and environmental protection could result in increased pressure for more stringent regulatory control with respect to the chemical industry. In addition, these concerns could influence public perceptions regarding our products and operations, the viability of certain products, our reputation, the cost to comply with regulations, and the ability to attract and retain employees. Moreover, changes in EHS regulations could inhibit or interrupt our operations, or require us to modify our facilities or operations. Accordingly, environmental or regulatory matters may cause us to incur significant unanticipated losses, costs or liabilities, which could reduce our profitability. For example, several of our products are being evaluated under REACH and CLP regulations and actions thereunder could negatively impact sales.

We could incur significant expenditures in order to comply with existing or future EHS laws. Capital expenditures and costs relating to EHS matters will be subject to evolving regulatory requirements and will depend on the timing of the promulgation and enforcement of specific standards which impose requirements on our operations. Capital expenditures and costs beyond those currently anticipated may therefore be required under existing or future EHS laws.

Furthermore, we may be liable for the costs of investigating and cleaning up environmental contamination on or from our properties or at off-site locations where we disposed of or arranged for the disposal or treatment of hazardous materials, or from disposal activities that pre-dated our purchase of our businesses. We may therefore incur additional

27

Table of Contents

costs and expenditures beyond those currently anticipated to address all such known and unknown situations under existing and future EHS laws.

Regulatory requirements to reduce GHG emissions could have an adverse effect on our results of operations.

Our operations are increasingly subject to regulations that seek to reduce emissions of GHGs, such as carbon dioxide and methane, which may be contributing to changes in the Earth’s climate. There are existing efforts to address GHG emissions at the international, national, and regional levels. For example, the 2015 Paris climate summit agreement, which entered into force in November 2016, resulted in voluntary commitments by numerous countries to reduce their GHG emissions. However, the U.S. notified the United Nations in August 2017 that it will be withdrawing from the agreement, which provides for a four-year exit process. The EU also regulates GHGs under the EU ETS and China has established its own country-wide GHG cap and trade program. Domestically, the EPA issued its final Clean Power Plan rules in 2015 that establish carbon pollution standards for power plants, called CO2 emission performance rates. This rule has been challenged in court and the EPA announced in October 2017 that it intended to repeal and potentially replace the Clean Power Plan. On August 21, 2018, the EPA proposed the Affordable Clean Energy (“ACE”) rule to replace the 2015 Clean Power Plan, which was stayed by the U.S. Supreme Court and has never gone into effect. In June 2019, EPA finalized ACE rule, which established emission guidelines for states to develop plans to address GHG emissions from existing coal-fired power plants. Such rules and agreements may affect the long-term price and supply of electricity and natural gas and demand for products that contribute to energy efficiency and renewable energy. These various regulations and agreements may result in increased costs to purchased energy, additional capital costs for installation or modification of GHG emitting equipment, and additional costs associated directly with GHG emissions (such as cap and trade systems or carbon taxes), which are primarily related to energy use. Compliance with these regulations and any more stringent restrictions in the future may increase our operational costs.

In addition, most scientists have concluded that increasing concentrations of GHGs in the Earth’s atmosphere may produce climate changes, such as increased frequency and severity of storms, droughts, floods and other climatic events. If any such effects were to occur in areas where we or our clients operate, they could have an adverse effect on our assets and operations.

We could incur significant expenditures in order to comply with existing or future EHS laws. Capital expenditures and costs relating to EHS matters will be subject to evolving regulatory requirements and will depend on the timing of the promulgation and enforcement of specific standards which impose requirements on our operations. Capital expenditures and costs beyond those currently anticipated may therefore be required under existing or future EHS laws.

Furthermore, we may be liable for the costs of investigating and cleaning up environmental contamination on or from our properties or at off-site locations where we disposed of or arranged for the disposal or treatment of hazardous materials or from disposal activities that pre-dated our purchase of our businesses. We may therefore incur additional costs and expenditures beyond those currently anticipated to address all such known and unknown situations under existing and future EHS laws.

Our operations, financial condition and liquidity could be adversely affected by legal claims against us, including antitrust claims.

We face risks arising from various legal actions, including matters relating to antitrust, product liability, intellectual property and environmental claims. It is possible that judgments could be rendered against us in these cases or others for which we could be uninsured or not covered by indemnity, or which may be beyond the amounts that we currently have reserved or anticipate incurring for such matters. Over the past few years, antitrust claims have been made against chemical companies. In this type of litigation, the plaintiffs generally seek injunctive relief, treble damages or the maximum damages allowed by state law, costs of suit and attorneys’ fees, which may result in significant liabilities. An adverse outcome in any antitrust claim could be material and significantly impact our operations, financial condition, liquidity and business reputation.

Our business is exposed to risks associated with the creditworthiness of our suppliers, customers and business partners and the industries in which our suppliers, customers and business partners participate are cyclical in nature, both of which may adversely affect our business and results of operations.

Our business is exposed to risks associated with the creditworthiness of our key suppliers, customers and business partners and reductions in demand for our customers’ products. During periods of economic disruption, more of our customers than normal may experience financial difficulties, including bankruptcies, restructurings and liquidations, which could affect our business by reducing sales, increasing our risk in extending trade credit to customers and reducing

28

Table of Contents

our profitability. A significant adverse change in a customer relationship or in a customer’s financial position could cause us to limit or discontinue business with that customer, require us to assume more credit risk relating to that customer’s receivables or limit our ability to collect accounts receivable from that customer.

Economic conditions and regulatory changes following the United Kingdom's exit from the EU could adversely impact our operations, operating results and financial condition.

On January 31, 2020, the United Kingdom (the "U.K.”) officially departed from the European Union (“EU”) and entered into an implementation period. At the end of this 11-month implementation period, the U.K. will depart from the EU customs union and single market.  Since June 2016, the uncertainty around the Brexit triggered short-term and potentially long-term financial volatility, including a decline in the value of the pound sterling in comparison to both the U.S. dollar and euro, and its indirect effect on the relationship between the U.S. dollar and the euro. The future effects of Brexit will depend on the final agreements the U.K. makes to retain access following the implementation period to the EU or other markets. Given the lack of comparable precedent, it remains unclear what financial, trade and legal implications the withdrawal of the U.K. from the EU would have and how such withdrawal would affect our Company, although any increase in duties and tariffs between the U.K. and the rest of the EU would be immediately damaging to the profitability and in some cases viability of exports of our products between those regions and, over the long term, might result in the need to relocate major manufacturing assets from one region to the other.

While we are not experiencing any material immediate adverse impact on our financial condition as a result of Brexit, adverse consequences such as deterioration in economic conditions, volatility in currency exchange rates or adverse changes in regulation could have a negative impact on our future operations, operating results and financial condition. All of these potential consequences could be further magnified if additional countries were to exit the EU.

Our business is dependent on our intellectual property. If our intellectual property rights cannot be enforced or our trade secrets become known to our competitors, our ability to compete may be adversely affected.

Proprietary protection of our processes, apparatuses and other technology is important to our business. While a presumption of validity exists with respect to patents issued to us in the U.S., there can be no assurance that any of our patents will not be challenged, invalidated, circumvented or rendered unenforceable. Furthermore, if any pending patent application filed by us does not result in an issued patent, or if patents are issued to us, but such patents do not provide meaningful protection of our intellectual property, then our ability to compete may be adversely affected. Additionally, our competitors or other third parties may obtain patents that restrict or preclude our ability to lawfully produce or sell our products in a competitive manner, which could have a material adverse effect on our business, results of operations, financial condition and liquidity.

We also rely upon unpatented proprietary know-how and continuing technological innovation and other trade secrets to develop and maintain our competitive position. While it is our policy to enter into agreements imposing confidentiality obligations upon our employees and third parties to protect our intellectual property, these confidentiality obligations may be breached, may not provide meaningful protection for our trade secrets or proprietary know-how, or adequate remedies may not be available in the event of an unauthorized access, use or disclosure of our trade secrets and know-how. In addition, others could obtain knowledge of our trade secrets through independent development or other access by legal means.

We may have to rely on judicial enforcement of our patents and other proprietary rights. We may not be able to effectively protect our intellectual property rights from misappropriation or infringement in countries where effective patent, trademark, trade secret and other intellectual property laws and judicial systems may be unavailable, or may not protect our proprietary rights to the same extent as U.S. law.

The failure of our patents or confidentiality agreements to protect our processes, apparatuses, technology, trade secrets or proprietary know-how or the failure of adequate legal remedies for related actions could have a material adverse effect on our business, results of operations, financial condition and liquidity.

Conflicts, military actions, terrorist attacks, political events and general instability, along with increased security regulations related to our industry, could adversely affect our business.

Conflicts, military actions, terrorist attacks and political events have precipitated economic instability and turmoil in international commerce and the global economy. The uncertainty and economic disruption resulting from hostilities, military action or acts of terrorism may impact any or all of our facilities and operations or those of our suppliers or customers. Accordingly, any conflict, military action or terrorist attack that impacts us or any of our

29

Table of Contents

suppliers or customers, could have a material adverse effect on our business, results of operations, financial condition and liquidity. Furthermore, instability and turmoil, particularly in energy-producing nations, may result in raw material cost increases.

Changes in social, political, regulatory and economic conditions or in laws and policies governing foreign trade, manufacturing, development and investment in the territories and countries where we currently develop and sell products, could adversely affect our business. For example, a number of governments have instituted regulations attempting to increase the security of chemical plants and the transportation of hazardous chemicals, which could result in higher operating costs and could have a material adverse effect on our financial condition and liquidity.

If our subsidiaries do not make sufficient distributions to us, then we will not be able to make payment on our debts.

Our debt is generally the exclusive obligation of Huntsman International. Our subsidiaries are separate legal entities and have no obligation, contingent or otherwise, to pay any amounts due on our debt or to make any funds available for those amounts, whether by dividends, loans, distributions or other payments, and do not guarantee the payment of interest on, or principal of, our debt. Any right that we have to receive any assets of any of our subsidiaries upon the liquidation or reorganization of any such subsidiary, and the consequent right of holders of notes to realize proceeds from the sale of their assets, will be structurally subordinated to the claims of that subsidiary’s creditors, including trade creditors and holders of debt issued by that subsidiary.

Regulatory or market changes with respect to MTBE may materially reduce our sales and/or materially increase our costs.

Our joint venture with Sinopec produces MTBE, an oxygenate that is blended with gasoline to reduce vehicle air emissions and to enhance the octane rating of gasoline. Because of the allegations that MTBE has contaminated some water supplies, its use has become controversial in the U.S. and elsewhere, and its use has been effectively eliminated in the U.S. market. Our joint venture currently markets MTBE, either directly or through third parties, to gasoline additive customers located outside the U.S. This business has been profitable to us over time, and legislative or regulatory initiatives or changing consumer opinion outside the U.S. restricting MTBE or changing consumer opinion could materially adversely affect our ability to market and sell MTBE and our profitability. In 2017, China announced that it would implement a mandate to use gasoline containing 10% ethanol by 2020. We expect MTBE prices in China to continue facing downward pressure as a result of downstream refiners and blenders reduce operations in line with strong government initiative to improve environment in the country.

Our pension and postretirement benefit plan obligations are currently underfunded, and under certain circumstances we may have to significantly increase the level of cash funding to some or all of these plans, which would reduce the cash available for our business.

We have unfunded and underfunded obligations under some of our domestic and foreign pension and postretirement benefit plans. The funded status of our pension plans is dependent upon many factors, including returns on invested assets, the level of certain market interest rates and the discount rates used to determine pension obligations. Unfavorable returns on the plan assets or unfavorable changes in applicable laws or regulations could materially change the timing and amount of required plan funding, which would reduce the cash available for our business. In addition, a decrease in the discount rate used to determine pension obligations could result in an increase in the valuation of pension obligations, which could affect the reported funding status of our pension plans and future contributions, as well as the periodic pension cost in subsequent fiscal years.

With respect to our domestic pension and postretirement benefit plans, the Pension Benefit Guaranty Corporation (“PBGC”) has the authority to terminate an underfunded tax-qualified pension plan under limited circumstances in accordance with the Employee Retirement Income Security Act of 1974, as amended. In the event our tax-qualified pension plans are terminated by the PBGC, we could be liable to the PBGC for the entire amount of the underfunding and, under certain circumstances, the liability could be senior to our notes. With respect to our foreign pension and postretirement benefit plans, the effects of underfunding depend on the country in which the pension and postretirement benefit plan is established. For example, in the U.K. and Germany semi-public pension protection programs have the authority in certain circumstances to assume responsibility for underfunded pension schemes, including the right to recover the amount of the underfunding from us.

30

Table of Contents

Our debt level, a portion of which is subject to variable interest rates, makes us vulnerable to downturns and may limit our ability to respond to market conditions, to obtain additional financing or to refinance our debt.

As of December 31, 2019, our total consolidated outstanding debt was $2,389 million (including current portion of debt); our debt to total capitalization ratio was approximately 44%; our combined outstanding variable rate borrowings were approximately $328 million; and our current portion of debt totaled $212 million. Our debt level and the fact that a portion of our cash flow is required to make payments on our debt could have important consequences for our business, including but not limited to the following:

we may be more vulnerable to business, industry or economic downturns, making it more difficult to respond to market conditions;
cash flow available for other purposes, including the growth of our business, may be reduced;
our ability to refinance or obtain additional financing may be constrained, particularly during periods when the capital markets are unsettled;
our competitors with lower debt levels may have a competitive advantage relative to us; and
part of our debt is subject to variable interest rates, which makes us more vulnerable to increases in interest rates (for example, a 1% increase in interest rates, without giving effect to interest rate hedges or other offsetting items, would increase our annual interest rate expense by approximately $3 million).

Our debt level also impacts our credit ratings. Any decision by credit rating agencies to downgrade our debt ratings could restrict our ability to obtain additional financing and could result in increased interest and other costs.

RISKS RELATED TO OUR COMMON STOCK AND DEBT SECURITIES

Certain provisions contained in our certificate of incorporation and bylaws could discourage a takeover attempt, which may reduce or eliminate the likelihood of a change of control transaction and, therefore, limit your ability to sell our common stock at a price higher than the current market value.

Certain provisions contained in our certificate of incorporation and bylaws, as well as certain provisions of Delaware law, could make it more difficult for a third party to acquire control of our Company, even if some of our stockholders were to consider such a change of control to be beneficial. Our certificate of incorporation also authorizes our Board of Directors to issue preferred stock without stockholder approval. Therefore, our Board of Directors could elect to issue preferred stock that has special voting or other rights that could make it even more difficult for a third party to acquire us, which may reduce or eliminate your ability to sell our common stock at a price higher than the current market value.

We have purchased, and may continue to purchase, a portion of our equity and debt securities, which could impact the market for our equity and debt securities and likely would negatively affect our liquidity.

Consistent with past practices, we may from time to time seek to repurchase or redeem our equity and debt securities in open market purchases, accelerated repurchase programs, privately negotiated transactions, tender offers, partial or full calls for redemption or otherwise. Any such repurchases or redemptions and the timing and amount thereof would depend on prevailing market conditions, liquidity requirements, contractual restrictions and other factors. Such transactions could negatively affect our liquidity.

ITEM 1B. UNRESOLVED STAFF COMMENTS

As of the date of this filing, we did not have any unresolved comments from the staff of the SEC.

ITEM 2. PROPERTIES

We own or lease chemical manufacturing and research facilities in the locations indicated in the list below, which we believe are adequate for our short-term and anticipated long-term needs. We own or lease office space and storage facilities throughout the U.S. and in many foreign countries. Our principal executive offices are located at 10003

31

Table of Contents

Woodloch Forest Drive, The Woodlands, Texas 77380. The following is a list of material properties where manufacturing, research and main office facilities are located.

Location


Business Segment


Description of Facility

The Woodlands, Texas(1)

Various

Executive Offices, Operating Headquarters, Global Technology Center and Shared Services Center

Kuala Lumpur, Malaysia(1)

Various

Shared Services Center

Mumbai, India(1)

Various

Technology Center, Administrative Offices, Labs and Shared Services Center

Sao Paulo, Brazil(1)

Various

Administrative Offices and Accounting Shared Services Center

Geismar, Louisiana(2)

Polyurethanes and Performance Products

MDI, Nitrobenzene(2), Aniline(2), Polyols and Maleic Anhydride Manufacturing Facilities, Polyurethane Systems House

Rotterdam, The Netherlands(1)

Polyurethanes and other various

MDI Manufacturing Facility, Polyols Manufacturing Facilities, Polyurethane Systems House and Accounting Shared Services Center

Caojing, China

Polyurethanes

MDI Finishing Facilities

Caojing, China(3)

Polyurethanes

Precursor MDI Manufacturing Facility

Jinshan, China(1)

Polyurethanes

TPU Manufacturing Facility

Deer Park, Australia

Polyurethanes

Polyurethane Systems House

Cartagena, Colombia

Polyurethanes

Polyurethane Systems House

Deggendorf, Germany

Polyurethanes

Polyurethane Systems House and Technology Center

Ternate, Italy

Polyurethanes

Polyurethane Systems House and Technology Center

Shanghai, China(1)

Polyurethanes, Performance Products and Advanced Materials

Polyurethane Systems House, Global Technology Center, Performance Products Regional Headquarters and Shared Services Center

Azeglio, Italy

Polyurethanes

Polyurethane Systems House

Pune, India(1)

Polyurethanes

Polyurethane Systems House

Buenos Aires, Argentina(1)

Polyurethanes

Polyurethane Systems House

Samutprakarn, Thailand(1)

Polyurethanes

Polyurethane Systems House

Istanbul, Turkey(4)

Polyurethanes

Polyurethane Systems House

Kuan Yin, Taiwan

Polyurethanes

Polyurethane Systems House

Tlalnepantla, Mexico

Polyurethanes

Polyurethane Systems House

Mississauga, Canada

Polyurethanes

Polyurethane Systems House

Obninsk, Russia

Polyurethanes

Polyurethane Systems House

Dammam, Saudi Arabia(5)

Polyurethanes

Polyurethane Systems House

Georgsmarienhütte, Germany

Polyurethanes

Polyurethane Systems House

Castelfranco Emilia, Italy

Polyurethanes

Polyurethane Systems House

Dubai, United Arab Emirates

Polyurethanes

Polyurethane Systems House

Arlington, Texas

Polyurethanes

Polyurethane Systems House

Boisbriand, Canada

Polyurethanes

Polyurethane Systems House

King’s Lynn, U.K.(1)

Polyurethanes

Polyurethane Systems House

Ho Chi Minh City, Vietnam(1)

Polyurethanes and Advanced Materials

Polyurethane Systems House and Formulating Facility

Auburn Hills, Michigan(1)

Polyurethanes

Polyurethane Research Facility

Everberg, Belgium

Polyurethanes and Performance Products

Polyurethane and Performance Products Regional Headquarters, Global Technology Center and Shared Service Center

Houston, Texas(1)

Polyurethanes

Polyols Manufacturing Facility

Derry, New Hampshire(1)

Polyurethanes

TPU Research Facility

Ringwood, Illinois(1)

Polyurethanes

TPU Manufacturing Facility

Osnabrück, Germany

Polyurethanes

TPU Manufacturing Facility

Wilton, U.K.

Polyurethanes and other various

Aniline and Nitrobenzene Manufacturing Facilities

Nanjing, China(6)

Polyurethanes

PO and MTBE Manufacturing Facilities

Port Neches, Texas

Performance Products

Amines Manufacturing Facility

Conroe, Texas

Performance Products

Amines Manufacturing Facility

Petfurdo, Hungary

Performance Products

Amines Manufacturing Facility

Llanelli, U.K.

Performance Products

Amines Manufacturing Facility

Freeport, Texas(1)

Performance Products

Amines Manufacturing Facility

Jurong Island, Singapore(1)

Performance Products

Amines Manufacturing Facility

Jubail, Saudi Arabia(7)

Performance Products

Amines Manufacturing Facility

Pensacola, Florida(1)

Performance Products

Maleic Anhydride Manufacturing Facility

Moers, Germany(1)

Performance Products

Maleic Anhydride Manufacturing Facility

Bergkamen, Germany

Advanced Materials

Synthesis Facility

Monthey, Switzerland

Advanced Materials

Formulating and Synthesis Facility

Pamplona, Spain

Advanced Materials

Synthesis Facility

McIntosh, Alabama

Advanced Materials

Formulating and Synthesis Facility

Bad Saeckingen, Germany

Advanced Materials

Formulating Facility

32

Table of Contents

Location


Business Segment


Description of Facility

Duxford, U.K.

Advanced Materials

Formulating and Synthesis Facility

Taboão da Serra, Brazil

Advanced Materials, Polyurethanes and Textile Effects

Formulating Facility, Labs, Polyurethane Systems House and Chemicals and Inks Formulations Facility

Panyu, China(1)(8)

Advanced Materials and Textile Effects

Formulating and Synthesis Facility, Technology Center and Shared Services Center

East Lansing, Michigan

Advanced Materials

Formulating Facility

Los Angeles, California

Advanced Materials

Formulating Facility

Merrimack, New Hampshire(1)

Advanced Materials

Research Facility

Basel, Switzerland

Advanced Materials and Textile Effects

Advanced Materials Regional Headquarters, Technology Center

Langweid am Leich, Germany

Textile Effects

Chemicals Synthesis and Chemicals and Inks Formulation Facility

Charlotte, North Carolina

Textile Effects

Chemicals Formulations Facility

Samutsakorn (Mahachai), Thailand

Textile Effects

Textiles Dyes Synthesis and Dyes and Inks Formulations Facility

Atotonilquillo, Mexico

Textile Effects

Textile Dyes and Chemicals Synthesis and Formulations Facility

Baroda, India

Textile Effects

Textile Dyes Synthesis and Dyes and Chemicals Formulations Facility

Gandaria, Jakarta, Indonesia

Textile Effects and Polyurethanes

Textile Dyes and Chemicals Formulations Facility and Polyurethane Systems House

Fraijanes, Guatemala

Textile Effects

Chemicals Formulations Facility

Bogota, Colombia

Textile Effects

Chemicals Formulations Facility

Hangzhou, China(1)

Textile Effects

Chemicals Formulations Facility

Singapore(1)

Textile Effects and other various

Textile Effects Headquarters and Administrative Offices

Wynyard, U.K.(1)

Various

Administrative Offices

(1)Leased land and/or building.
(2)The ownership of the Geismar facility is as follows: we own 100% of the MDI, polyol and maleic anhydride facilities, and Rubicon LLC, a consolidated manufacturing joint venture with Lanxess in which we own a 50% interest, owns the aniline and nitrobenzene facilities. Rubicon LLC is a separate legal entity that operates both the assets that we own jointly with Lanxess and our wholly owned assets at Geismar.
(3)35% interest in SLIC, our unconsolidated manufacturing joint venture with BASF and three Chinese chemical companies.
(4)On September 18, 2019, we experienced a fire at the Huntsman EMA polyurethane systems house in Istanbul, Turkey.
(5)51%-owned consolidated manufacturing joint venture with Basic Chemicals Industries Ltd.
(6)49% interest in Nanjing Jinling Huntsman New Material Co., Ltd., our unconsolidated manufacturing joint venture with Sinopec. Beneficial commercial operations began during the second half of 2017.
(7)50% interest in AAC, our consolidated manufacturing joint venture with the Zamil Group.
(8)95%-owned consolidated manufacturing joint venture with Guangzhou Sheng’an Package Company Limited.

ITEM 3. LEGAL PROCEEDINGS

Rockwood Litigation 


On February 6, 2017, we filed a lawsuit in New York state court against Rockwood Holdings, Inc. (“Rockwood”), Albemarle Corporation (as Rockwood’s successor) and certain former Rockwood executives to recover damage for fraud and breach of contract. During the commissioning of a new Venator production facility in Augusta, Georgia (the “Augusta Facility”) for the synthesis of iron oxide pigments, the Augusta Facility experienced delays producing products at the expected specifications and quantities, raising questions regarding the capabilities of the technology we acquired from Rockwood in October 2014. In May 2018, Venator implemented a plan to cease using certain portions of the Augusta Facility and incurred significant restructuring expenses. The case is currently in arbitration, and we are seeking various forms of legal remedy, including compensatory damages, punitive damages, expectation damages, consequential damages and restitution. Venator is not party to the suit.

33

Table of Contents

ITEM 4. MINE SAFETY DISCLOSURES

Not applicable.

INFORMATION ABOUT OUR EXECUTIVE OFFICERS

The following is information concerning our executive officers and significant employees as of the date of this report.

Peter R. Huntsman, age 56, is Chairman of the Board, President and Chief Executive Officer of our Company. Peter R. Huntsman has served as Chairman of the Board since January 2018 and as a director of our company and affiliated companies since 1994. Prior to his appointment in July 2000 as Chief Executive Officer, Mr. Huntsman had served as President and Chief Operating Officer since 1994. In 1987, Mr. Huntsman joined Huntsman Polypropylene Corporation as Vice President before serving as Senior Vice President and General Manager. Mr. Huntsman has also served as President of Olympus Oil, as Senior Vice President of Huntsman Chemical Corporation and as a Senior Vice President of Huntsman Packaging Corporation, a former subsidiary of our Company. Mr. Huntsman is a director or manager, as applicable, of Huntsman International and certain of our other subsidiaries. Mr. Huntsman currently serves as Chairman of the Board and a director of Venator Materials PLC, which separated from our Company in 2017.

Sean Douglas, age 55, is Executive Vice President and Chief Financial Officer. Mr. Douglas was appointed to this position in January 2017. Mr. Douglas was previously Vice President, Corporate Development and Treasurer from July 2015 to July 2016. Mr. Douglas left the Company in July 2012 to perform charitable services and rejoined the Company in July 2015. He previously served as our Vice President, Corporate Development from December 2009 until July 2012. Mr. Douglas served as Vice President and Treasurer from 2002 to December 2009, Vice President, Finance from July 2001 to 2002 and Vice President, Administration from January 1997 to July 2001. Prior to joining Huntsman in 1990, Mr. Douglas worked for the accounting firm of PricewaterhouseCoopers.

David M. Stryker, age 61, is Executive Vice President, General Counsel and Secretary. Mr. Stryker was appointed to this position in June 2013. Prior to joining Huntsman, Mr. Stryker served as Senior Vice President, General Counsel, Secretary and Chief Compliance Officer of the BASF Corporation since 2004. Previously, he was Associate General Counsel and Chief Compliance Officer at Siemens Corporation and, prior to that, a partner at the law firm of Kirkland & Ellis. Mr. Stryker started his legal career as a judicial clerk to the Honorable Robert H. Bork on the U.S. Court of Appeals for the D.C. Circuit.

Anthony P. Hankins, age 62, is Division President, Polyurethanes and Chief Executive Officer, Asia-Pacific. Mr. Hankins was appointed to these positions in March 2004 and February 2011, respectively. From May 2003 to February 2004, Mr. Hankins served as President, Performance Products, from January 2002 to April 2003, he served as Global Vice President, Rigids Division for our Polyurethanes segment, from October 2000 to December 2001, he served as Vice President—Americas for our Polyurethanes segment, and from March 1998 to September 2000, he served as Vice President—Asia-Pacific for our Polyurethanes segment. Mr. Hankins worked for ICI from 1980 to February 1998, when he joined our Company. At ICI, Mr. Hankins held numerous management positions in the plastics, fibers and polyurethanes businesses. He has extensive international experience, having held senior management positions in Europe, Asia and the U.S.

Rohit Aggarwal, age 52, is Division President, Textile Effects. Mr. Aggarwal was appointed to this position in July 2016. Mr. Aggarwal was previously Vice President and Managing Director of Indian Subcontinent for Huntsman from July 2015 to July 2016 and served in various positions within Huntsman’s Advanced Materials and Textile Effects segments from 2005 to 2013. In 2013, Mr. Aggarwal left Huntsman to join Louis Dreyfus Commodities B.V. as Chief Executive Officer of Asia Region, a position he held until his return to our Company in 2015.

Monte G. Edlund, age 64, is Division President, Performance Products. Prior to his appointment to this position in July 2015, Mr. Edlund served as Vice President—Americas, Advanced Materials since July 2011. From December 2007 to July 2011, Mr. Edlund served as Vice President—Global Specialty Textiles, Textile Effects, from April 2002 to December 2007, he served as Vice President, Polymers and from June 1999 to April 2002, he served as Vice President, Marketing, Base Chemicals and Polymers. Prior to joining Huntsman in 1997 as Vice President—Marketing, Rexene, Mr. Edlund held numerous positions with Rexene Corporation.

Scott J. Wright, age 48, is Division President, Advanced Materials. Mr. Wright was appointed to this position in June 2016. Prior to that time, Mr. Wright served as Vice President of Huntsman Advanced Materials—Europe, Middle East & Africa since 2011. Before joining Huntsman’s Advanced Materials segment, Mr. Wright spent 15 years in

34

Table of Contents

Huntsman’s former P&A Business in a number of roles of increasing responsibility including product development, business planning, marketing and sales. Prior to joining Huntsman in July 1999, Mr. Wright worked with ICI.

Ronald W. Gerrard, age 60, is Senior Vice President, Environmental, Health & Safety and Manufacturing Excellence. Mr. Gerrard was appointed to this position in June 2009. He also serves as our Corporate Sustainability Officer. From May 2004 to June 2009, Mr. Gerrard served as Vice President, Global Operations and Technology in our Polyurethanes segment. From 1999 to May 2004, Mr. Gerrard served as Vice President, Asia; Business Director, Flexible Foams; and Director, EHS and Engineering, also within our Polyurethanes segment. Prior to joining Huntsman in 1999, Mr. Gerrard had worked for ICI and for EVC, a joint venture between ICI and Enichem. Mr. Gerrard is a Chartered Engineer.

R. Wade Rogers, age 54, is Senior Vice President, Global Human Resources. Mr. Rogers has held this position since August 2009. From May 2004 to August 2009, Mr. Rogers served as Vice President, Global Human Resources, from October 2003 to May 2004, Mr. Rogers served as Director, Human Resources—Americas and from August 2000 to October 2003, he served as Director, Human Resources for our Polymers and Base Chemicals businesses. From the time he joined Huntsman in 1994 to August 2000, Mr. Rogers served as Area Manager, Human Resources—Jefferson County Operations. Prior to joining Huntsman, Mr. Rogers held a variety of positions with Texaco Chemical Company.

Randy W. Wright, age 61, is Vice President and Controller. Prior to his appointment to this position in February 2012, Mr. Wright served as Assistant Controller and Director of Financial Reporting since July 2004. Prior to joining Huntsman in 2004, Mr. Wright held various positions with Georgia-Pacific Corporation, Riverwood International, Johns Manville and PricewaterhouseCoopers. Mr. Wright is a Certified Public Accountant.

Twila Day, age 58, is Vice President and Chief Information Officer. Ms. Day was appointed to this position upon joining Huntsman in November 2018. Prior to joining Huntsman, Ms. Day was Managing Director, National Practice Lead for Technology Services, and a member of the executive committee at Alvarez & Marsal. Previously, Ms. Day served at SYSCO Corporation for more than 20 years in a variety of positions, culminating in her appointment as Senior Vice President Information Technology and Chief Information Officer.

Kevin C. Hardman, age 56, is Vice President, Tax. Mr. Hardman served as Chief Tax Officer from 1999 until he was appointed to his current position in 2002. Prior to joining Huntsman in 1999, Mr. Hardman was a tax Senior Manager with the accounting firm of Deloitte & Touche LLP, where he worked for 10 years. Mr. Hardman is a Certified Public Accountant and holds a master’s degree in tax accounting.

Phil Lister, age 47, is Vice President, Corporate Development. Mr. Lister was appointed to this position effective May 2019. From April 2011, Mr. Lister served in Huntsman’s Polyurethanes division as Vice President, Global Finance and Controller, a role including divisional leadership of strategic planning as well as mergers and acquisitions. Prior to that, Mr. Lister served in numerous financial and business roles in Polyurethanes both in Europe and in the United States. Mr. Lister joined Huntsman in July 1999 with the ICI acquisition. Mr. Lister is a U.K. Chartered Management Accountant.

Ivan Marcuse, age 43, is Vice President, Investor Relations. Prior to joining Huntsman in April 2017, Mr. Marcuse served as Director, Equity Research, Specialty Chemicals for KeyBanc Capital Markets Inc. from August 2011 to February 2017. Previously, he was Vice President, Equity Research, Building Products and Materials, for Northcoast Research. Mr. Marcuse is a CFA charterholder and holds a master’s degree in business administration.

Claire Mei, age 45, is Vice President and Treasurer. Ms. Mei was appointed to this role upon joining Huntsman in August of 2018. Prior to joining Huntsman, Ms. Mei served as Vice President and Treasurer at Chobani Global Holdings since November 2016. Previously, Ms. Mei served in a variety of treasury and financial roles with increasing responsibility at several companies including Kraft Foods, PepsiCo, and Hyatt Corporation. Ms. Mei was also a management consultant with McKinsey & Company in Shanghai, China. Ms. Mei holds a master’s degree in business administration.

Pierre Poukens, age 57, is Vice President, Internal Audit, a position he has held since February 2012. Mr. Poukens was Director of Internal Audit from April 2005 to January 2012 and joined Huntsman as Internal Audit Manager in January 2000. Prior to joining Huntsman, Mr. Poukens held various accounting and auditing positions with European companies in Belgium. Mr. Poukens is a Certified Internal Auditor.

Nooshin Vaughn, age 45, is Vice President, Financial Planning and Analysis. Ms. Vaughn was appointed to this position effective June 2018. Ms. Vaughn previously served as Director, Investor Relations. Prior to that, Ms. Vaughn held numerous roles in finance, accounting and information technology. Prior to joining Huntsman in 1997, Ms. Vaughn worked for the accounting firm of Deloitte & Touche LLP. Ms. Vaughn is a Certified Public Accountant.

35

Table of Contents

36

Table of Contents

PART II

ITEM 5. MARKET FOR REGISTRANT’S COMMON EQUITY, RELATED STOCKHOLDER MATTERS AND ISSUER PURCHASES OF EQUITY SECURITIES

Market Information And Holders

Our common stock is listed on the New York Stock Exchange under the symbol “HUN.” As of January 31, 2020, there were approximately 68 stockholders of record and the closing price of our common stock on the New York Stock Exchange was $20.56 per share.

Dividends

The payment of dividends is a business decision made by our Board of Directors from time to time based on our earnings, financial position and prospects, and such other considerations as our Board of Directors considers relevant. Accordingly, while management currently expects that the Company will continue to pay the quarterly cash dividend, its dividend practice may change at any time. On February 7, 2018, the Board of Directors approved an increase to the quarterly cash dividend to $0.1625 per share of common stock beginning with the March 30, 2018 quarterly dividend.

Securities Authorized For Issuance Under Equity Compensation Plans

See “Part III. Item 11. Executive Compensation” for information relating to our equity compensation plans.

Purchases Of Equity Securities By The Company

The following table provides information with respect to shares of our common stock that we repurchased as part of our share repurchase program and shares of restricted stock granted under our stock incentive plans that we withheld upon vesting to satisfy our tax withholding obligations during the three months ended December 31, 2019.


Maximum number

Total number of

(or approximate

shares purchased

dollar value) of

Total number

Average

as part of publicly

shares that may yet

of shares

price paid

announced plans

be purchased under


purchased


per share(1)


or programs(2)


the plans or programs(2)

October


$


$

528,000,000

November


183,495


22.79


183,059


523,000,000

December


321,448


23.35


320,501


516,000,000

Total


504,943

$

23.14


503,560


(1)   Represents net purchase price per share, exclusive of any fees or commissions.

(2)   On February 7, 2018 and on May 3, 2018, our Board of Directors authorized our Company to repurchase up to an additional $950 million in shares of our common stock in addition to the $50 million remaining under our September 2015 share repurchase authorization. The share repurchase program will be supported by our free cash flow generation. Repurchases may be made in the open market, including through accelerated share repurchase programs, or in privately negotiated transactions, and repurchases may be commenced or suspended from time to time without prior notice. Shares of common stock acquired through the repurchase program are held in treasury at cost.

37

Table of Contents

ITEM 6. SELECTED FINANCIAL DATA

The selected historical financial data set forth below presents our historical financial data as of and for the dates and periods indicated. You should read the selected financial data in conjunction with “—Item 7. Management’s Discussion and Analysis of Financial Condition and Results of Operations” and our consolidated financial statements and accompanying notes.

Huntsman Corporation

Year ended December 31, 

(in millions, except per share amounts)


2019


2018


2017


2016


2015

Statements of Operations Data:

Revenues

$

6,797

$

7,604

$

6,845

$

6,146


$

6,674

Gross profit


1,382


1,764


1,651


1,321


1,430

Restructuring, impairment and plant closing (credits) costs


(41)


(7)


19


31


74

Operating income


469


827


729


516


468

Income from continuing operations


429


689


511


271


271

Income (loss) from discontinued operations, net of tax(1)


169


(39)


230


86


(145)

Net income


598


650


741


357


126

Net income attributable to noncontrolling interests

(36)

(313)

(105)

(31)

(33)

Net income attributable to Huntsman Corporation


562


337


636


326


93

Basic income (loss) per common share:


Income from continuing operations attributable to Huntsman Corporation common stockholders

$

1.72

$

2.55

$

1.71

$

1.02


$

0.98

Income (loss) from discontinued operations attributable to Huntsman Corporation common stockholders, net of tax(1)


0.74


(1.13)


0.96


0.36


(0.60)

Net income attributable to Huntsman Corporation common stockholders

$

2.46

$

1.42

$

2.67

$

1.38


$

0.38

Diluted income (loss) per common share:


Income from continuing operations attributable to Huntsman Corporation common stockholders

$

1.70

$

2.52

$

1.66

$

1.00


$

0.97

Income (loss) from discontinued operations attributable to Huntsman Corporation common stockholders, net of tax(1)


0.74


(1.13)


0.95


0.36


(0.59)

Net income attributable to Huntsman Corporation common stockholders

$

2.44

$

1.39

$

2.61

$

1.36


$

0.38

Other Data:


Depreciation and amortization

$

270

$

255

$

236

$

243


$

238

Dividends per share


0.65


0.65


0.50

0.50


0.50

Balance Sheet Data (at period end):


Total assets

$

8,320

$

7,953

$

10,244

$

9,189

$

9,820

Total debt


2,389


2,320


2,298

4,173


4,770

Total liabilities


5,496


5,204


6,873

7,722


8,191

(1)Discontinued operations include our Chemical Intermediates Businesses, our Australian styrenics operations and our North American polymers and base chemicals operations for all periods presented. In addition, discontinued operations for the years ended December 31, 2018, 2017, 2016 and 2015 also include the results of Venator. Beginning in the fourth quarter of 2018, Venator was no longer accounted for as discontinued operations.

38

Table of Contents

ITEM 7. MANAGEMENT’S DISCUSSION AND ANALYSIS OF FINANCIAL CONDITION AND RESULTS OF OPERATIONS

Recent Developments

Sale of Chemical Intermediates Businesses

On January 3, 2020, we completed the sale of our Chemical Intermediates Businesses to Indorama in a transaction valued at approximately $2 billion, comprising a cash purchase price of approximately $1.93 billion, which includes estimated adjustments to the purchase price for working capital, plus the transfer of approximately $72 million in net underfunded pension and other post-employment benefit liabilities. The final purchase price is subject to customary post-closing adjustments. The net after tax cash proceeds are expected to be approximately $1.6 billion. For more information, see “Note 4. Discontinued Operations and Business Dispositions—Sale of Chemical Intermediates Businesses” to our consolidated financial statements.

Icynene-Lapolla Acquisition

On December 5, 2019, we entered into an agreement with an affiliate of FFL Partners, LLC to acquire Icynene-Lapolla, a leading North American manufacturer and distributor of spray polyurethane foam insulation systems for residential and commercial applications. Icynene-Lapolla operates two manufacturing facilities located in Houston, Texas and Mississauga, Ontario. Under terms of the agreement, we agreed to pay $350 million, subject to customary closing adjustments, in an all-cash transaction to be funded from available liquidity. The transaction is expected to close in the first quarter of 2020. The acquired business is expected to be integrated into our Polyurethanes segment.

Acquisition of Remaining Interest in Sasol-Huntsman Joint Venture

On September 30, 2019, we acquired from Sasol, our former joint venture partner, the 50% noncontrolling interest that we did not own in the Sasol-Huntsman maleic anhydride joint venture. The joint venture owned a manufacturing facility in Moers, Germany with capacity to produce 230 million pounds of maleic anhydride. We paid Sasol $101 million, which included acquired cash, net of any debt. The purchase price was funded from the 2019 Term Loan. See “Note 15. Debt—Direct and Subsidiary Debt—Term Loan Credit Facility” to our consolidated financial statements.

Outlook

We expect the following factors to impact our operating segments:

Polyurethanes:

Demand headwinds in several key regions and markets
Growth in insulation, especially in spray polyurethane foam
Stable MDI differentiated margins

Performance Products:

Growth in performance amines
Soft demand in maleic anhydride with stable margins

Advanced Materials:

Weak industrial markets
Demand headwinds in aerospace
Stable overall margins

Textile Effects:

Growth in specialty products
Stable volumes and improving margins

39

Table of Contents

In 2020, we expect to spend between approximately $300 million to $325 million on capital expenditures, including spending of approximately $80 million on a new MDI splitter in Geismar, Louisiana.

In 2019, our adjusted effective tax rate was 22%. We expect our forward adjusted effective tax rate will be approximately 22% to 24%. For further information, see “—Non-GAAP Financial Measures” and “Note 20. Income Taxes” to our consolidated financial statements.

Refer to “Item 1A. Risk Factors” for a discussion of the factors that may impact our business, results of operations, financial condition or liquidity and “Forward-Looking Statements” for a discussion of our use of forward-looking statements.

40

Table of Contents

Results Of Operations

For each of our Company and Huntsman International, the following tables set forth our consolidated results of operations for the years ended December 31, 2019, 2018 and 2017 (dollars in millions, except per share amounts).

Huntsman Corporation

December 31, 

Percent Change


2019


2018


2017

2019 vs 2018

2018 vs 2017

Revenues

$

6,797

$

7,604

$

6,845

(11)%

11%

Cost of goods sold

5,415

5,840

5,194

(7)%

12%

Gross profit

1,382

1,764

1,651

(22)%

7%

Operating expenses

954

942

875

1%

8%

Restructuring, impairment and plant closing (credits) costs

(41)

(7)

19

486%

NM

Merger costs

2

28

(100)%

(93)%

Operating income

469

827

729

(43)%

13%

Interest expense

(111)

(115)

(165)

(3)%

(30)%

Equity in income of investment in unconsolidated affiliates

54

55

13

(2)%

323%

Fair value adjustments to Venator investment

(18)

(62)

(71)%

NM

Loss on early extinguishment of debt

(23)

(3)

(54)

667%

(94)%

Other income, net

20

32

8

(38)%

300%

Income from continuing operations before income taxes

391

734

531

(47)%

38%

Income tax benefit (expense)

38

(45)

(20)

NM

125%

Income from continuing operations

429

689

511

(38)%

35%

Income (loss) from discontinued operations, net of tax

169

(39)

230

NM

NM

Net income

598

650

741

(8)%

(12)%

Reconciliation of net income to adjusted EBITDA:

Net income attributable to noncontrolling interests

(36)

(313)

(105)

(88)%

198%

Interest expense from continuing operations

111

115

165

(3)%

(30)%

Interest expense from discontinued operations

36

19

(100)%

89%

Income tax (benefit) expense from continuing operations

(38)

45

20

NM

125%

Income tax expense from discontinued operations

35

86

111

(59)%

(23)%

Depreciation and amortization of continuing operations

270

255

236

6%

8%

Depreciation and amortization of discontinued operations

61

88

151

(31)%

(42)%

Other adjustments:

Business acquisition and integration expenses and purchase accounting inventory adjustments

5

9

19

Merger costs

2

28

EBITDA from discontinued operations

(265)

(171)

(511)

Noncontrolling interest of discontinued operations

232

49

Fair value adjustments to Venator investment

18

62

Loss on early extinguishment of debt

23

3

54

Certain legal settlements and related expenses (income)

6

1

(11)

Loss (gain) on sale of businesses/assets

21

(9)

Certain nonrecurring information technology project implementation costs

4

Amortization of pension and postretirement actuarial losses

66

67

69

Plant incident remediation costs

8

1

U.S. Tax Reform Act impact on noncontrolling interest

(6)

Restructuring, impairment and plant closing and transition (credits) costs(2)

(41)

(6)

19

Adjusted EBITDA(1)

$

846

$

1,161

$

1,040

(27)%

12%

Net cash provided by operating activities from continuing operations

$

656

$

704

$

672

(7)%

5%

Net cash used in investing activities from continuing operations

(201)

(615)

(217)

(67)%

183%

Net cash used in financing activities

(450)

(424)

(519)

6%

(18)%

Capital expenditures from continuing operations

(274)

(251)

(234)

9%

7%

41

Table of Contents

Huntsman International

December 31, 

Percent Change


2019


2018


2017

2019 vs 2018

2018 vs 2017

Revenues

$

6,797

$

7,604

$

6,845

(11)%

11%

Cost of goods sold

5,415

5,837

5,188

(7)%

13%

Gross profit

1,382

1,767

1,657

(22)%

7%

Operating expenses

949

937

870

1%

8%

Restructuring, impairment and plant closing (credits) costs

(41)

(7)

19

486%

NM

Merger costs

2

28

(100)%

(93)%

Operating income

474

835

740

(43)%

13%

Interest expense

(126)

(136)

(181)

(7)%

(25)%

Equity in income of investment in unconsolidated affiliates

54

55

13

(2)%

323%

Fair value adjustments to Venator investment

(18)

(62)

(71)%

NM

Loss on early extinguishment of debt

(23)

(3)

(54)

667%

(94)%

Other income, net

16

27

6

(41)%

350%

Income from continuing operations before income taxes

377

716

524

(47)%

37%

Income tax benefit (expense)

41

(41)

(17)

NM

141%

Income from continuing operations

418

675

507

(38)%

33%

Income (loss) from discontinued operations, net of tax

169

(39)

227

NM

NM

Net income

587

636

734

(8)%

(13)%

Reconciliation of net income (loss) to adjusted EBITDA:

Net income attributable to noncontrolling interests

(36)

(313)

(105)

(88)%

198%

Interest expense from continuing operations

126

136

181

(7)%

(25)%

Interest expense from discontinued operations

36

19

(100)%

89%

Income tax (benefit) expense from continuing operations

(41)

41

17

NM

141%

Income tax expense from discontinued operations

35

86

111

(59)%

(23)%

Depreciation and amortization of continuing operations

270

252

228

7%

11%

Depreciation and amortization of discontinued operations

61

88

151

(31)%

(42)%

Other adjustments:

Business acquisition and integration expenses and purchase accounting inventory adjustments

5

9

23

Merger costs

2

28

EBITDA from discontinued operations

(265)

(171)

(511)

Noncontrolling interest of discontinued operations

232

49

Fair value adjustments to Venator investment

18

62

Loss on early extinguishment of debt

23

3

54

Certain legal settlements and related expenses (income)

6

1

(11)

Loss (gain) on sale of businesses/assets

21

(10)

Certain nonrecurring information technology project implementation costs

4

Amortization of pension and postretirement actuarial losses

70

71

72

Plant incident remediation costs

8

1

U.S. Tax Reform Act impact on noncontrolling interest

(6)

Restructuring, impairment and plant closing and transition (credits) costs(2)

(41)

(6)

19

Adjusted EBITDA(1)

$

851

$

1,165

$

1,044

(27)%

12%

Net cash provided by operating activities from continuing operations

$

645

$

687

$

666

(6)%

3%

Net cash used in investing activities from continuing operations

(202)

(630)

(231)

(68)%

173%

Net cash used in financing activities

(438)

(390)

(495)

12%

(21)%

Capital expenditures from continuing operations

(274)

(251)

(234)

9%

7%

42

Table of Contents

Huntsman Corporation

Year ended

Year ended

Year ended

December 31, 2019

December 31, 2018

December 31, 2017

Gross


Tax

and other(3)


Net


Gross


Tax

and other(3)


Net


Gross


Tax and other(3)


Net

Reconciliation of net income to adjusted net income

Net income

$

598

$

650

$

741

Net income attributable to noncontrolling interests

(36)

(313)

(105)

Business acquisition and integration expenses and purchase accounting inventory adjustments

$

5

$

5

$

9

$

(3)

6

$

19

$

(5)

14

Merger costs

2

2

28

(10)

18

Income from discontinued operations(5)

(265)

96

(169)

(171)

210

39

(511)

281

(230)

Noncontrolling interest of discontinued operations

232

232

49

49

Fair value adjustments to Venator investment

18

18

62

62

Loss on early extinguishment of debt

23

(5)

18

3

(1)

2

54

(19)

35

Certain legal settlements and related expenses (income)

6

(1)

5

1

(1)

(11)

4

(7)

Loss (gain) on sale of businesses/assets

21

(5)

16

(9)

(9)

Certain nonrecurring information technology project implementation costs

4

(1)

3

Amortization of pension and postretirement actuarial losses

66

(16)

50

67

(13)

54

69

(15)

54

Significant activities related to deferred tax assets and liabilities(4)

(128)

(128)

(119)

(119)

U.S. Tax Reform Act impact on income tax expense

(1)

(1)

32

32

(52)

(52)

U.S. Tax Reform Act impact on noncontrolling interest

(6)

(6)

Plant incident remediation costs

8

(2)

6

1

1

Restructuring, impairment and plant closing and transition (credits) costs(2)

(41)

9

(32)

(6)

1

(5)

19

(3)

16

Adjusted net income(1)

$

353

$

642

$

519

Weighted average shares-basic

228.9

238.1

238.4

Weighted average shares-diluted

230.6

241.6

243.9

Basic net income (loss) attributable to Huntsman Corporation per share:

Income from continuing operations

$

1.72

$

2.55

$

1.71

Income (loss) from discontinued operations

0.74

(1.13)

0.96

Net income

$

2.46

$

1.42

$

2.67

Diluted net income (loss) attributable to Huntsman Corporation per share:

Income from continuing operations

$

1.70

$

2.52

$

1.66

Income (loss) from discontinued operations

0.74

(1.13)

0.95

Net income

$

2.44

$

1.39

$

2.61

Other non-GAAP measures:

Diluted adjusted net income per share(1)

$

1.53

$

2.66

$

2.13

Net cash provided by operating activities from continuing operations

$

656

$

704

$

672

Capital expenditures from continuing operations

(274)

(251)

(234)

All other investing activities from continuing operations, excluding acquisition and disposition activities

7

(1)

6

Non-recurring merger costs

2

28

Free cash flow from continuing operations(1)

$

389

$

454

$

472

NM—Not meaningful

(1)See “—Non-GAAP Financial Measures.”

(2)Includes costs associated with transition activities relating to the migration of our information system data centers and the transition of our Textile Effects segment’s production from Basel, Switzerland to a tolling facility. These transition costs were included in either selling, general and administrative expenses or cost of sales on our consolidated statements of operations.

(3)The income tax impacts, if any, of each adjusting item represent a ratable allocation of the total difference between the unadjusted tax expense and the total adjusted tax expense, computed without consideration of any adjusting items using a with and without approach.

43

Table of Contents

(4)During the year ended December 31, 2019, we recorded $153 million of tax benefit relating to the outside basis difference in our investment in Venator, we recorded $18 million of tax benefit relating to realized tax losses on our remaining interest in Venator, we established $11 million of significant income tax valuation allowance in Australia and we recorded $32 million of deferred tax expense due to the reduction of tax rates in Switzerland. During the year ended December 31, 2018, we released $119 million of significant income tax valuation allowances in Switzerland, the U.K. and Luxembourg. We eliminated the effect of these significant changes in tax valuation allowances and deferred tax assets and liabilities from our presentation of adjusted net income to allow investors to better compare our ongoing financial performance from period to period.

(5)In addition to income tax impacts, this adjusting item is also impacted by depreciation and amortization expense and interest expense.

Non-GAAP Financial Measures

Our consolidated financial statements are prepared in accordance with GAAP, which we supplement with certain non-GAAP financial information. These non-GAAP measures should not be considered in isolation or as a substitute for the related GAAP measures, and other companies may define such measures differently. We encourage investors to review our financial statements and the reconciliation of the non-GAAP financial measures to the most directly comparable GAAP financial measures in their entirety and not to rely on any single financial measure. These non-GAAP measures exclude the impact of certain expenses that we do not believe are indicative of our core operating results.

Adjusted EBITDA

Our management uses adjusted EBITDA to assess financial performance. Adjusted EBITDA is defined as net income of Huntsman Corporation or Huntsman International, as appropriate, before interest, income tax, depreciation and amortization, net income attributable to noncontrolling interests and certain Corporate and other items, as well as eliminating the following adjustments: (a) business acquisition and integration expenses and purchase accounting inventory adjustments; (b) merger costs; (c) EBITDA from discontinued operations; (d) noncontrolling interest of discontinued operations; (e) fair value adjustments to Venator investment; (f) loss on early extinguishment of debt; (g) certain legal settlements and related expenses (income); (h) gain on sale of businesses/assets; (i) certain nonrecurring information technology project implementation costs; (j) amortization of pension and postretirement actuarial losses; (k) plant incident remediation costs; (l) U.S. Tax Cuts and Jobs Act (“U.S. Tax Reform Act”) impact on noncontrolling interest; and (m) restructuring, impairment and plant closing and transition (credits) costs. We believe that net income of Huntsman Corporation or Huntsman International, as appropriate, is the performance measure calculated and presented in accordance with U.S. GAAP that is most directly comparable to adjusted EBITDA.

We believe adjusted EBITDA is useful to investors in assessing the businesses’ ongoing financial performance and provides improved comparability between periods through the exclusion of certain items that management believes are not indicative of the businesses’ operational profitability and that may obscure underlying business results and trends. However, this measure should not be considered in isolation or viewed as a substitute for net income of Huntsman Corporation or Huntsman International, as appropriate, or other measures of performance determined in accordance with U.S. GAAP. Moreover, adjusted EBITDA as used herein is not necessarily comparable to other similarly titled measures of other companies due to potential inconsistencies in the methods of calculation. Our management believes this measure is useful to compare general operating performance from period to period and to make certain related management decisions. Adjusted EBITDA is also used by securities analysts, lenders and others in their evaluation of different companies because it excludes certain items that can vary widely across different industries or among companies within the same industry. For example, interest expense can be highly dependent on a company’s capital structure, debt levels and credit ratings. Therefore, the impact of interest expense on earnings can vary significantly among companies. In addition, the tax positions of companies can vary because of their differing abilities to take advantage of tax benefits and because of the tax policies of the various jurisdictions in which they operate. As a result, effective tax rates and tax expense can vary considerably among companies. Finally, companies employ productive assets of different ages and utilize different methods of acquiring and depreciating such assets. This can result in considerable variability in the relative costs of productive assets and the depreciation and amortization expense among companies.

Nevertheless, our management recognizes that there are material limitations associated with the use of adjusted EBITDA in the evaluation of our Company as compared to net income of Huntsman Corporation or Huntsman International, as appropriate, which reflects overall financial performance. For example, we have borrowed money in order to finance our operations and interest expense is a necessary element of our costs and ability to generate revenue.

44

Table of Contents

Our management compensates for the limitations of using adjusted EBITDA by using this measure to supplement U.S. GAAP results to provide a more complete understanding of the factors and trends affecting the business rather than U.S. GAAP results alone.

Adjusted Net Income

Adjusted net income is computed by eliminating the after tax amounts related to the following from net income attributable to Huntsman Corporation: (a) business acquisition and integration expenses and purchase accounting inventory adjustments; (b) merger costs; (c) loss (income) from discontinued operations; (d) noncontrolling interest of discontinued operations; (e) fair value adjustments to Venator investment; (f) loss on early extinguishment of debt; (g) certain legal settlements and related (income) expenses; (h) gain on sale of businesses/assets; (i) certain nonrecurring information technology project implementation costs; (j) amortization of pension and postretirement actuarial losses; (k) significant activities related to deferred tax assets and liabilities; (l) U.S. Tax Reform Act impact on income tax expense; (m) U.S. Tax Reform Act impact on noncontrolling interest; (n) plant incident remediation costs; and (o) restructuring, impairment and plant closing and transition (credits) costs. Basic adjusted net income per share excludes dilution and is computed by dividing adjusted net income by the weighted average number of shares outstanding during the period. Adjusted diluted net income per share reflects all potential dilutive common shares outstanding during the period and is computed by dividing adjusted net income by the weighted average number of shares outstanding during the period increased by the number of additional shares that would have been outstanding as dilutive securities. Adjusted net income and adjusted net income per share amounts are presented solely as supplemental information.

Free Cash Flow

Management internally uses a free cash flow measure: (a) to evaluate our liquidity, (b) evaluate strategic investments, (c) plan stock buyback and dividend levels, and (d) evaluate our ability to incur and service debt. Free cash flow is not a defined term under U.S. GAAP, and it should not be inferred that the entire free cash flow amount is available for discretionary expenditures. The Company defines free cash flow as cash flows provided by operating activities from continuing operations and used in investing activities from continuing operations, including non-recurring merger costs. Free cash flow as used herein is not necessarily comparable to other similarly titled measures of other companies due to potential inconsistencies in the method of calculation. Free cash flow is typically derived directly from the Company’s consolidated statement of cash flows; however, it may be adjusted for items that affect comparability between periods.

Adjusted Effective Tax Rate

We believe that the effective tax rate of Huntsman Corporation or Huntsman International, as appropriate, is the performance measure calculated and presented in accordance with U.S. GAAP that is most directly comparable to adjusted effective tax rate. We believe our adjusted effective tax rate provides improved comparability between periods through the exclusion of certain items that management believes are not indicative of the businesses’ operational profitability and that may obscure underlying business results and trends. We do not provide reconciliations for adjusted effective tax rate on a forward-looking basis because we are unable to provide a meaningful or accurate calculation or estimation of reconciling items and the information is not available without unreasonable effort. This is due to the inherent difficulty of forecasting the timing and amount of certain items, such as business acquisition and integration expenses, merger costs, certain legal and other settlements and related costs, gains on sale of business/assets, and amortization of pension and postretirement actuarial losses. Each of such adjustments has not yet occurred, is out of our control and/or cannot be reasonably predicted. For the same reasons, we are unable to address the probable significance of the unavailable information.

Year Ended December 31, 2019 Compared with Year Ended December 31, 2018

As discussed in “Note 4. Discontinued Operations and Business Dispositions—Sale of Chemical Intermediates Businesses” and “Note 4. Discontinued Operations and Business Dispositions—Separation and Deconsolidation of Venator” to our consolidated financial statements, the results from continuing operations for all periods presented exclude the results of our Chemical Intermediates Businesses and the results of our former polymers, base chemicals and Australian styrenics businesses for all periods presented as well as the results of Venator for 2018. The increase of $225 million in net income attributable to Huntsman Corporation and the increase of $228 million in net income attributable to Huntsman International was the result of the following items:

Revenues for the year ended December 31, 2019 decreased by $807 million, or 11%, as compared with the 2018 period. The decrease was primarily due to lower average selling prices in all our segments, except for

45

Table of Contents

our Textile Effects segment, and lower sales volumes in all our segments, except for our Polyurethanes segment. See “—Segment Analysis” below.

Our gross profit and the gross profit of Huntsman International for the year ended December 31, 2019 decreased by $382 million and $385 million, respectively, or 22% each, as compared with the 2018 period. The decrease resulted from lower gross margins in all our segments. See “—Segment Analysis” below.

Our operating expenses and the operating expenses of Huntsman International for the year ended December 31, 2019 increased by $12 million each, or 1% each, as compared with the 2018 period, primarily related to an increase in divestiture related costs, partially offset by the impact of translating foreign currency amounts to the U.S. dollar.

Restructuring, impairment and plant closing (credits) costs for the year ended December 31, 2019 was a credit of $41 million compared to a credit of $7 million in the 2018 period. For more information on restructuring activities, see “Note 13. Restructuring, Impairment and Plant Closing (Credits) Costs” to our consolidated financial statements.

We recorded a loss of $18 million in fair value adjustments to our investment in Venator for the year ended December 2019 compared to a loss of $62 million in 2018. See “Note 4. Discontinued Operations and Business Dispositions—Separation and Deconsolidation of Venator” to our consolidated financial statements.

Loss on early extinguishment of debt for the year ended December 31, 2019 increased to $23 million from $3 million in the 2018 period in relation to the early repayment in full of our 2020 Senior Notes in the first quarter of 2019. See “Note. 15. Debt—Notes” to our consolidated financial statements.

Our other income, net and the other income, net of Huntsman International for the year ended December 31, 2019 decreased by $12 million and $11 million, respectively, as compared with the 2018 period, primarily attributable to higher pension-related credits in the 2018 period.

Our income tax benefit for the year ended December 31, 2019 increased to $38 million from an expense of $45 million in the 2018 period. The income tax benefit of Huntsman International for the year ended December 31, 2019 increased to $41 million from an expense of $41 million in the 2018 period. The increase in tax benefit was primarily due to the decrease in pretax income along with discrete items in each period. In 2019, discrete items include tax benefits related to built-in capital losses and realized tax losses both on our remaining interest in Venator, partially offset by tax expense related to the establishment of a valuation allowance in Australia and the change in tax rate in Switzerland. In 2018, discrete items include tax benefits related to the release of valuation allowances in Switzerland, Luxembourg and the U.K., partially offset by additional provisional deemed repatriation transition tax. Our income tax expense is significantly affected by the mix of income and losses in the tax jurisdictions in which we operate, as impacted by the presence of valuation allowances in certain tax jurisdictions]. For further information concerning income taxes, see “Note 20. Income Taxes” to our consolidated financial statements.

46

Table of Contents

Segment Analysis

Year Ended December 31, 2019 Compared to Year Ended December 31, 2018

Percent

Change

Year ended December 31, 

Favorable

(Dollars in millions)

2019


2018

(Unfavorable)

Revenues

Polyurethanes

$

3,911

$

4,282

(9)%

Performance Products

1,158

1,301

(11)%

Advanced Materials

1,044

1,116

(6)%

Textile Effects

763

824

(7)%

Corporate and eliminations

(79)

81

NM

Total

$

6,797

$

7,604

(11)%

Huntsman Corporation

Segment adjusted EBITDA(1)

Polyurethanes

$

548

$

809

(32)%

Performance Products

168

197

(15)%

Advanced Materials

201

225

(11)%

Textile Effects

84

101

(17)%

Corporate and other

(155)

(171)

9%

Total

$

846

$

1,161

(27)%

Huntsman International

Segment adjusted EBITDA(1)

Polyurethanes

$

548

$

809

(32)%

Performance Products

168

197

(15)%

Advanced Materials

201

225

(11)%

Textile Effects

84

101

(17)%

Corporate and other

(150)

(167)

10%

Total

$

851

$

1,165

(27)%

NM—Not meaningful

(1)    For more information, including reconciliation of segment adjusted EBITDA to net income of Huntsman Corporation or Huntsman International, as appropriate, see “Note 27. Operating Segment Information” to our consolidated financial statements.

Year ended December 31, 2019 vs 2018

Average Selling Price(1)

Local

Foreign Currency

Mix &

Sales


Currency


Translation Impact


Other


Volumes(2)

Period-Over-Period (Decrease) Increase

Polyurethanes

(13)%

(2)%

1%

5%

Performance Products

(2)%

(2)%

1%

(8)%

Advanced Materials

2%

(3)%

2%

(7)%

Textile Effects

4%

(3)%

(8)%

47

Table of Contents

Fourth Quarter 2019 vs Third Quarter 2019

Average Selling Price(1)

Local

Foreign Currency

Mix &

Sales


Currency


Translation Impact


Other


Volumes(2)

Period-Over-Period (Decrease) Increase

Polyurethanes

(3)%

(1)%

2%

1%

Performance Products

(4)%

(1)%

3%

1%

Advanced Materials

1%

(1)%

(6)%

Textile Effects

(1)%

(1)%

1%

2%

(1)Excludes revenues from tolling arrangements, byproducts and raw materials.
(2)Excludes sales volumes of byproducts and raw materials.

Polyurethanes

The decrease in revenues in our Polyurethanes segment for 2019 compared to 2018 was due to lower MDI average selling prices, partially offset by higher MDI sales volumes. MDI average selling prices decreased primarily due to a decline in component MDI selling prices in China and Europe. MDI sales volumes increased primarily due to the start-up of our new Chinese MDI facility in the third quarter of 2018. The decrease in segment adjusted EBITDA was primarily due to lower MDI margins driven by lower MDI pricing, partially offset by higher MDI sales volumes.

Performance Products

The decrease in revenues in our Performance Products segment for 2019 compared to 2018 was due to lower sales volumes and lower average selling prices. Sales volumes decreased primarily due to weakened market conditions. Average selling prices decreased primarily due to lower raw material costs and weakened market conditions. The decrease in segment adjusted EBITDA was primarily due to lower sales volumes and lower margins, primarily in our ethyleneamines and maleic anhydride businesses, partially offset by higher margins in our performance amines business.

Advanced Materials

The decrease in revenues in our Advanced Materials segment for 2019 compared to 2018 was due to lower sales volumes and lower average selling prices. Sales volumes decreased primarily due to lower sales volumes in our industrial, power and automotive related markets, partially offset by favorable product mix effect from sales volumes in our aerospace components market. Average selling prices decreased primarily due to the impact of a stronger U.S. dollar against major international currencies, partially offset by higher local currency selling prices. The decrease in segment adjusted EBITDA was primarily due to lower sales volumes, higher raw material and fixed costs and the impact of a stronger U.S. dollar against major international currencies.

Textile Effects

The decrease in revenues in our Textile Effects segment for 2019 compared to 2018 was due to lower sales volumes, partially offset by higher average selling prices. Sales volumes decreased primarily due to lower demand resulting from market uncertainties surrounding U.S. and China trade. Average selling prices increased in response to higher raw material costs, partially offset by the impact of a stronger U.S. dollar against major international currencies. The decrease in segment adjusted EBITDA was primarily due to lower sales volumes and higher raw materials costs, partially offset by higher average selling prices and lower fixed costs.

Corporate and other

Corporate and other includes unallocated corporate overhead, unallocated foreign currency exchange gains and losses, LIFO inventory valuation reserve adjustments, loss on early extinguishment of debt, unallocated restructuring, impairment and plant closing costs, nonoperating income and expense and gains and losses on the disposition of corporate assets. For 2019, adjusted EBITDA from Corporate and other for Huntsman Corporation increased by $16 million to a loss of $155 million from a loss of $171 million for 2018. For 2019, adjusted EBITDA from Corporate and other for Huntsman International increased by $17 million to a loss of $150 million from a loss of $167 million for 2018. The increase in adjusted EBITDA from Corporate and other resulted primarily from a benefit from a LIFO inventory

48

Table of Contents

reserve adjustment and a decrease in corporate overhead costs, partially offset by an increase in unallocated foreign currency exchange loss.

Year Ended December 31, 2018 Compared with Year Ended December 31, 2017

As discussed in “Note 4. Discontinued Operations and Business Dispositions—Sale of Chemical Intermediates Businesses” and “Note 4. Discontinued Operations and Business Dispositions—Separation and Deconsolidation of Venator” to our consolidated financial statements, the results from continuing operations for all periods presented exclude the results of our Chemical Intermediates Businesses, the results of Venator and the results of our former polymers, base chemicals and Australian styrenics businesses for all periods presented. The decrease of $299 million in net income attributable to Huntsman Corporation and the decrease of $306 million in net income attributable to Huntsman International was the result of the following items:

Revenues for the year ended December 31, 2018 increased by $759 million, or 11%, as compared with the 2017 period. The increase was primarily due to higher average selling prices in all our segments and higher sales volumes in our Polyurethanes and Performance Products segments. See “—Segment Analysis” below.

Our gross profit and the gross profit of Huntsman International for the year ended December 31, 2018 increased by $113 million and $110 million, respectively, or 7% each, as compared with the 2017 period. The increase resulted from higher gross margins in all our segments. See “—Segment Analysis” below.

Our operating expenses and the operating expenses of Huntsman International for the year ended December 31, 2018 increased by $67 million each, or 8% each, as compared with the 2017 period, primarily related to an increase in selling, general and administrative expenses and research and development costs.

Restructuring, impairment and plant closing (credits) costs for the year ended December 31, 2018 was a credit of $7 million compared to a cost of $19 million in the 2017 period. For more information on restructuring activities, see “Note 13. Restructuring, Impairment and Plant Closing Costs” to our consolidated financial statements.

During 2018 and 2017, we incurred $2 million and $28 million, respectively, in merger-related costs related to the terminated merger between Huntsman and Clariant Ltd.

Our interest expense and the interest expense of Huntsman International for the year ended December 31, 2018 decreased by $50 million and $45 million, respectively, or 30% and 25%, respectively, as compared with the 2017 period. The decrease was due to the early repayments on our term loans during the second half of 2017.

Equity in income of investment in unconsolidated affiliates for the year ended December 31, 2018 was $55 million compared to $13 million in the 2017 period. The increase was primarily attributable to the PO/MTBE joint venture with Sinopec, of which we hold a 49% interest, which began commercial operations during the second half of 2017.

We elected the fair value option to account for our equity method investment in Venator post deconsolidation. Accordingly, in December 2018, we recorded a pretax loss of $57 million to record our equity method investment in Venator at fair value. This loss was recorded in “Fair value adjustments to Venator investment” in the accompanying statements of operations. Furthermore, in connection with the December 3, 2018 sale of Venator shares to Bank of America N.A., we recorded a forward swap. At December 31, 2018, we recorded a loss of $5 million in “Fair value adjustments to Venator investment” in the accompanying statements of operations to record the forward swap at fair value. Under the fair value option to account for our equity method investment in Venator, amounts recorded in “Fair value adjustments to Venator investment” could fluctuate depending upon the change in market value of Venator common stock.

Loss on early extinguishment of debt for the year ended December 31, 2018 decreased to $3 million from $54 million in the 2017 period. During the year ended December 31, 2017, we recorded a loss on early extinguishment of debt of $49 million related to early repayments on our term loans.

49

Table of Contents

Our other income, net and the other income, net of Huntsman International for the year ended December 31, 2018 increased by $24 million and $21 million, respectively, as compared with the 2017 period, primarily attributable to higher pension-related credits in the 2018 period.

Our income tax expense for the year ended December 31, 2018 increased to $45 million from $20 million in the 2017 period. The income tax expense of Huntsman International for the year ended December 31, 2018 increased to $41 million from $17 million in the 2017 period. The increase in tax expense was primarily due to the increase in pre-tax income and the additional finalized impact of the U.S. Tax Reform Act, resulting in an additional net $32 million tax expense, which is partially offset by the release of valuation allowances in Switzerland, the U.K. and Luxembourg. Our income tax expense is significantly affected by the mix of income and losses in the tax jurisdictions in which we operate, as impacted by the presence of valuation allowances in certain tax jurisdictions. For further information concerning income taxes, see “Note 20. Income Taxes” to our consolidated financial statements.

Segment Analysis

Year Ended December 31, 2018 Compared to Year Ended December 31, 2017

Percent

Change

December 31, 

Favorable

2018


2017


(Unfavorable)

Revenues

Polyurethanes

$

4,282

$

3,764

14%

Performance Products

1,301

1,156

13%

Advanced Materials

1,116

1,040

7%

Textile Effects

824

776

6%

Corporate and eliminations

81

109

NM

Total

$

7,604

$

6,845

11%

Huntsman Corporation

Segment adjusted EBITDA(1)

Polyurethanes

$

809

$

776

4%

Performance Products

197

155

27%

Advanced Materials

225

219

3%

Textile Effects

101

83

22%

Corporate and other

(171)

(193)

11%

Total

$

1,161

$

1,040

12%

Huntsman International

Segment adjusted EBITDA(1)

Polyurethanes

$

809

$

776

4%

Performance Products

197

155

27%

Advanced Materials

225

219

3%

Textile Effects

101

83

22%

Corporate and other

(167)

(189)

12%

Total

$

1,165

$

1,044

12%

NM—Not meaningful

50

Table of Contents

(1)For more information, including reconciliation of segment adjusted EBITDA to net income of Huntsman Corporation or Huntsman International, as appropriate, see “Note 27. Operating Segment Information” to our consolidated financial statements.

Year ended December 31, 2018 vs 2017

Average Selling Price(1)

Local

Foreign Currency

Mix &

Sales


Currency


Translation Impact


Other


Volumes(2)

Period-Over-Period (Decrease) Increase

Polyurethanes

3%

2%

1%

8%

Performance Products

15%

1%

(5)%

2%

Advanced Materials

1%

2%

4%

Textile Effects

2%

4%

(1)Excludes revenues from tolling arrangements, byproducts and raw materials.
(2)Excludes sales volumes of byproducts and raw materials.

Polyurethanes

The increase in revenues in our Polyurethanes segment for 2018 compared to 2017 was due to higher average selling prices and higher sales volumes. MDI average selling prices increased in response to strong market conditions during the first three quarters of 2018. MDI sales volumes increased due to increased demand across most major markets as well as the start-up of our new Chinese MDI facility in 2018. The increase in segment adjusted EBITDA was primarily due to higher MDI margins and volumes in 2018.

Performance Products

The increase in revenues in our Performance Products segment for 2018 compared to 2017 was due to higher average selling prices and higher sales volumes. Average selling prices increased primarily due to strong market conditions across several of our derivatives businesses and in response to higher raw material costs. Sales volumes increased in our amines and maleic anhydride businesses. The increase in segment adjusted EBITDA was primarily due to higher margins and the impact of hurricane related production outages during 2017.

Advanced Materials

The increase in revenues in our Advanced Materials segment for 2018 compared to 2017 was due to higher average selling prices as sales volumes remained relatively unchanged. Average selling prices increased in response to higher raw material costs and the impact of a weaker U.S. dollar against major international currencies. Sales volumes remained relatively unchanged as higher sales volumes across most markets in our core specialty business were offset by lower sales volumes in our commodity markets due to challenging industry conditions. The increase in segment adjusted EBITDA was primarily due to higher specialty sales volumes, partially offset by higher raw material and fixed costs.

Textile Effects

The increase in revenues in our Textile Effects segment for 2018 compared to 2017 was due to higher average selling prices as sales volumes remained relatively unchanged. Average selling prices increased in response to higher raw material costs. Sales volumes remained relatively unchanged as higher sales volumes in our specialty business was offset by lower sales volumes in our value business. The increase in segment adjusted EBITDA was primarily due to higher average selling prices, partially offset by higher raw material costs and higher selling, general and administrative costs.

Corporate and other

Corporate and other includes unallocated corporate overhead, unallocated foreign currency exchange gains and losses, LIFO inventory valuation reserve adjustments, loss on early extinguishment of debt, unallocated restructuring, impairment and plant closing costs, nonoperating income and expense and gains and losses on the disposition of corporate assets. For 2018, adjusted EBITDA from Corporate and other for Huntsman Corporation increased by $22

51

Table of Contents

million to a loss of $171 million from a loss of $193 million for 2017. For 2018, adjusted EBITDA from Corporate and other for Huntsman International increased by $22 million to a loss of $167 million from a loss of $189 million for 2017. The increase in segment adjusted EBITDA from Corporate and other resulted primarily from a decrease in unallocated corporate overhead and a decrease in LIFO inventory reserves.

Liquidity and Capital Resources

The following is a discussion of our liquidity and capital resources and generally does not include separate information with respect to Huntsman International in accordance with General Instruction I of Form 10-K.

Cash Flows Year Ended December 31, 2019 Compared with Year Ended December 31, 2018

Net cash provided by operating activities from continuing operations for 2019 and 2018 was $656 million and $704 million, respectively. The decrease in net cash provided by operating activities from continuing operations during 2019 compared with 2018 was primarily attributable to decreased operating income as described in “—Results of Operations” above, partially offset by a $74 million favorable variance in operating assets and liabilities for 2019 as compared with 2018.

Net cash used in investing activities from continuing operations for 2019 and 2018 was $201 million and $615 million, respectively. During 2019 and 2018, we paid $274 million and $251 million, respectively, for capital expenditures. During 2018, we paid $366 million for the acquisition of a business, net of cash acquired. During 2019, we received $49 million in proceeds from the sale of assets in connection with the closure of our Textile Effects facilities in Basel, Switzerland. During 2019 and 2018, we received proceeds of $16 million and $3 million, respectively, from the settlement of the December 3, 2018 sale of Venator ordinary shares to Bank of America N.A.

Net cash used in financing activities for 2019 and 2018 was $450 million and $424 million, respectively. The increase in net cash used in financing activities was primarily due to increased repayments on our $1.2 billion senior unsecured revolving credit facility (“2018 Revolving Credit Facility”) in the 2019 period, the repayment of our 2020 Senior Notes in the first quarter of 2019 and cash paid to acquire the 50% noncontrolling interest that we did not own in the Sasol-Huntsman joint venture. The increase was partially offset by proceeds from the issuance of our 2029 Senior Notes in the first quarter of 2019, proceeds from the 2019 Term Loan in the third quarter of 2019 and a decrease in our repurchase of shares of our common stock under the share repurchase program.

Free cash flow from continuing operations for 2019 and 2018 were proceeds of cash of $389 million and $454 million, respectively. The reduction in free cash flow was attributable to the changes in cash flows from operating and investing activities from continuing operations, excluding acquisition and disposition activities.

Cash Flows for Year Ended December 31, 2018 Compared to the Year Ended December 31, 2017

Net cash provided by operating activities from continuing operations for 2018 and 2017 was $704 million and $672 million, respectively. The increase in net cash provided by operating activities from continuing operations during 2018 compared with 2017 was primarily attributable to increased operating income as described in “—Results of Operations” above, partially offset by a $35 million unfavorable variance in operating assets and liabilities for 2018 compared with 2017.

Net cash used in investing activities from continuing operations for 2018 and 2017 was $615 million and $217 million, respectively. During 2018 and 2017, we paid $251 million and $234 million, respectively, for capital expenditures and paid $366 million and $14 million, respectively, for the acquisition of businesses, net of cash acquired. For more information concerning business acquisitions, see “Note 3. Business Combinations and Acquisitions” to our consolidated financial statements. During 2018 and 2017, we received proceeds of nil and $25 million, respectively, from the sale of assets and received nil and $7 million, respectively, from the termination of cross-currency interest rate contracts.

Net cash used in financing activities for 2018 and 2017 was $424 million and $519 million, respectively. The decrease in net cash used in financing activities was primarily due to borrowings on our 2018 Revolving Credit Facility and proceeds from the secondary offering of Venator in 2018 as well as net repayments of long-term debt in the 2017 period, partially offset by our repurchase of shares of our common stock under the share repurchase program and

52

Table of Contents

increased dividends paid to common stockholders and noncontrolling interests in 2018 as well as proceeds from the IPO of Venator in 2017.

Free cash flow from continuing operations for 2018 and 2017 were cash proceeds of $454 million and $472 million, respectively. The reduction in free cash flow was attributable to the changes in cash flows from operating and investing activities from continuing operations, excluding acquisition and disposition activities.

Changes in Financial Condition

The following information summarizes our working capital (dollars in millions):

December 31, 

December 31, 

Increase

Percent


2019


2018


(Decrease)


Change

Cash and cash equivalents

$

525

$

340

$

185

54%

Accounts and notes receivable, net

953

1,183

(230)

(19)%

Inventories

914

1,000

(86)

(9)%

Prepaid expenses

83

58

25

43%

Other current assets

72

145

(73)

(50)%

Current assets held for sale(1)

1,208

232

976

421%

Total current assets

3,755

2,958

797

27%

Accounts payable

822

793

29

4%

Accrued liabilities

420

497

(77)

(15)%

Current portion of debt

212

96

116

121%

Current operating lease liabilities

42

42

NM

Current liabilities held for sale(1)

512

225

287

128%

Total current liabilities

2,008

1,611

397

25%

Working capital

$

1,747

$

1,347

$

400

30%

NM—Not meaningful

(1)The assets and liabilities held for sale are classified as current as of December 31, 2019 because we completed the sale of our Chemical Intermediates Businesses on January 3, 2020. For more information, see “Note 4. Discontinued Operations and Business Dispositions—Sale of Chemical Intermediates Businesses” to our consolidated financial statements.

Our working capital increased by $400 million as a result of the net impact of the following significant changes:

The increase in cash and cash equivalents of $185 million resulted from the matters identified on our consolidated statements of cash flows.

Accounts and notes receivable decreased by $230 million primarily due to lower revenues in the fourth quarter of 2019 compared to the fourth quarter of 2018.

Inventories decreased by $86 million primarily due to lower inventory costs and volumes.

Prepaid expenses increased by $25 million primarily due to higher prepaid insurance.

Other current assets decreased by $73 million primarily due to lower bank acceptance drafts and lower current income taxes receivable.

Accrued liabilities decreased by $77 million primarily due to a decrease in current income taxes payable and the payment of accrued compensation, partially offset by an increase in taxes other than income.

Current portion of debt increased by $116 million primarily due to new borrowings under the 2019 Term Loan in the third quarter of 2019, partially offset by increased repayments on our 2018 Revolving Credit Facility.

53

Table of Contents

Current operating lease liabilities were $42 million as of December 31, 2019 as a result of the adoption of the new lease standard on January 1, 2019.

Direct and Subsidiary Debt

See “Note 15. Debt—Direct and Subsidiary Debt” to our consolidated financial statements.

Debt Issuance Costs

See “Note 15. Debt—Direct and Subsidiary Debt—Debt Issuance Costs” to our consolidated financial statements.

Revolving Credit Facility

See “Note 15. Debt—Direct and Subsidiary Debt—Revolving Credit Facility” to our consolidated financial statements.

Term Loan Credit Facility

See “Note 15. Debt—Direct and Subsidiary Debt—Term Loan Credit Facility” to our consolidated financial statements.

A/R Programs

See “Note 15. Debt—Direct and Subsidiary Debt—A/R Programs” to our consolidated financial statements.

Notes

See “Note 15. Debt—Direct and Subsidiary Debt—Notes” to our consolidated financial statements.

Variable Interest Entity Debt

See “Note 15. Debt—Direct and Subsidiary Debt—Variable Interest Entity Debt” to our consolidated financial statements.

Note Payable from Huntsman International to Huntsman Corporation

See “Note 15. Debt—Direct and Subsidiary Debt—Note Payable from Huntsman International to Huntsman Corporation” to our consolidated financial statements.

Compliance With Covenants

See “Note 15. Debt—Compliance with Covenants” to our consolidated financial statements.

Maturities

See “Note 15. Debt—Maturities” to our consolidated financial statements.

Short-Term and Long-Term Liquidity

We depend upon our cash, 2018 Revolving Credit Facility, U.S. accounts receivable securitization program (“U.S. A/R Program”) and European accounts receivable securitization program (“EU A/R Program” and collectively with the U.S. A/R Program, “A/R Programs”) and other debt instruments to provide liquidity for our operations and working capital needs. As of December 31, 2019, we had $1,684 million of combined cash and unused borrowing capacity, consisting of $525 million in cash, $1,153 million in availability under our 2018 Revolving Credit Facility and $6 million in availability under our A/R Programs. Our liquidity can be significantly impacted by various factors. The following matters had, or are expected to have, a significant impact on our liquidity:

Cash proceeds from our accounts receivable and inventory, net of accounts payable, were approximately $236 million for 2019, as reflected in our consolidated statements of cash flows. We expect volatility in our working capital components to continue.

54

Table of Contents

During 2020, we expect to spend between approximately $300 million to $325 million on capital expenditures for continuing operations, including spending of approximately $80 million on a new MDI splitter in Geismar, Louisiana. We expect to fund spending on all capital expenditures with cash provided by operations.

During 2019, we made contributions to our pension and postretirement benefit plans of $92 million. During 2020, we expect to contribute an additional amount of approximately $88 million to these plans.

On February 7, 2018 and on May 3, 2018, our Board of Directors authorized our Company to repurchase up to an additional $950 million in shares of our common stock in addition to the $50 million remaining under our September 2015 share repurchase authorization. Repurchases may be made through the open market, including through accelerated share repurchase programs, or in privately negotiated transactions, and repurchases may be commenced or suspended from time to time without prior notice. Shares of common stock acquired through the repurchase program are held in treasury at cost. During 2019, we repurchased 10,099,892 shares of our common stock for approximately $208 million, excluding commissions, under the repurchase program. From January 1, 2020 through January 31, 2020, we repurchased an additional 336,478 shares of our common stock for approximately $7 million, excluding commissions.

On December 3, 2018, we sold an aggregate of 4,334,389, or 4% of Venator ordinary shares to Bank of America N.A. at a price determined based on the average of the daily volume weighted average price of the ordinary shares over an agreed period. Over this agreed period, we received aggregate proceeds of $19 million, $16 million of which was received in the first quarter of 2019. The transaction allowed us to deconsolidate Venator beginning in December 2018, and following this transaction, we retained approximately 49% ownership in Venator. We elected the fair value option to account for our equity method investment in Venator post deconsolidation. Accordingly, in 2019, we recorded a loss of $19 million to record our equity method investment in Venator at fair value. Under the fair value option to account for our equity method investment in Venator, amounts recorded in “Fair value adjustments to Venator investment” could fluctuate depending upon the change in market value of Venator common stock. See “Note 4. Discontinued Operations and Business Dispositions—Separation and Deconsolidation of Venator” to our consolidated financial statements.

On March 13, 2019, Huntsman International completed a $750 million offering of its 2029 Senior Notes. On March 27, 2019, Huntsman International applied the net proceeds of this offering to redeem in full $650 million in aggregate principal amount of its 2020 Senior Notes and associated costs and accrued interest of $21 million and $12 million, respectively. In addition, we recognized a loss on early extinguishment of debt of $23 million. See “Note 15. Debt—Direct and Subsidiary DebtNotes” to our consolidated financial statements.

On April 18, 2019, we entered into an Amended and Restated European Receivables Loan Agreement and a Master Amendment No. 7 to the U.S. Receivables Loan Agreement to, among other things, extend the respective scheduled termination dates to April 2022. See “Note 15. Debt—Direct and Subsidiary DebtA/R Programs” to our consolidated financial statements.

In September 2011, we initiated a restructuring program in our Textile Effects segment to close its production facilities and business support offices in Basel, Switzerland. In July 2019, we sold the production facilities and business support offices in Basel. Accordingly, during the third quarter of 2019, we received proceeds of $49 million related to this sale and recognized a corresponding gain on disposal of assets of $49 million.

On January 3, 2020, we completed the sale of our Chemical Intermediates Businesses to Indorama in a transaction valued at approximately $2 billion, comprising a cash purchase price of approximately $1.93 billion, which includes estimated adjustments to the purchase price for working capital, plus the transfer of approximately $72 million in net underfunded pension and other post-employment benefit liabilities. The final purchase price is subject to customary post-closing adjustments. The net after tax cash proceeds are expected to be approximately $1.6 billion.  We expect to use the net proceeds from this sale to: 1) invest in complementary strategic acquisitions that develop our technology and product portfolio, 2) continue

55

Table of Contents

investing in organic, internal opportunities, 3) prepay certain prepayable debt, and 4) continue to repurchase shares opportunistically and pay a competitive dividend.

In connection with the January 3, 2020, sale of our Chemical Intermediates Businesses to Indorama, we assigned Indorama an insurance claim related to damages we incurred from a recent fire at a neighboring third-party property near the Port Neches, Texas site. We agreed with Indorama that we will receive the first $50 million of the potential insurance recovery when and if paid. In addition, we agreed with Indorama to cover certain reinstatement costs pertaining to our damaged assets at the third-party site. We currently do not expect these costs to be material.

On September 24, 2019, Huntsman International entered into the 2019 Term Loan, pursuant to which Huntsman International borrowed an aggregate principal amount of $101 million. We used the net proceeds of the 2019 Term Loan to finance the acquisition of the 50% noncontrolling interest that we did not own in the Sasol-Huntsman maleic anhydride joint venture. Borrowings under the 2019 Term Loan will bear interest at an interest rate margin of EURIBO Rate plus 0.75%. Unless earlier terminated or prepaid in accordance with the credit agreement governing the 2019 Term Loan, the 2019 Term Loan will mature on September 22, 2020. The 2019 Term Loan is subject to substantially the same terms and conditions as the 2018 Revolving Credit Facility.

On September 30, 2019, acquired from Sasol the 50% noncontrolling interest that we did not own in the Sasol-Huntsman maleic anhydride joint venture. We paid Sasol $101 million, which included acquired cash, net of any debt. The purchase price was funded from the 2019 Term Loan.

As of December 31, 2019, we had $212 million classified as current portion of debt, including $103 million on our 2019 Term Loan, $40 million on borrowings of our 2018 Revolving Credit Facility, debt at our variable interest entities of $36 million and certain other short-term facilities and scheduled amortization payments totaling $33 million. Although we cannot provide assurances, we intend to renew, repay or extend the majority of these short-term facilities in the next twelve months.

As of December 31, 2019, we had approximately $440 million of cash and cash equivalents, including restricted cash, held by our foreign subsidiaries, including our variable interest entities. We intend to use cash held in our foreign subsidiaries to fund our local operations. Nevertheless, we could repatriate cash as dividends and the repatriation of cash as a dividend would generally not be subject to U.S. taxation as a result of the U.S. Tax Reform Act. However, such repatriation may potentially be subject to limited foreign withholding taxes.

Contractual Obligations and Commercial Commitments

Our obligations under long-term debt (including the current portion), lease agreements and other contractual commitments as of December 31, 2019 are summarized below (dollars in millions):


2020


2021 - 2022


2023 - 2024


After 2024


Total

Long-term debt, including current portion

$

212

$

1,092

$

3

$

1,082

$

2,389

Interest(1)


110


167


104


156


537

Operating leases


42


81


72


231


426

Purchase commitments(2)


1,364


1,656


840


1,894


5,754

Total(3)(4)

$

1,728

$

2,996

$

1,019

$

3,363

$

9,106

(1)   Interest calculated using interest rates as of December 31, 2019 and contractual maturity dates assuming no refinancing or extension of debt instruments.

(2)   We have various purchase commitments extending through 2039 for materials, supplies and services entered into in the ordinary course of business. Included in the purchase commitments table above are contracts which require minimum volume purchases that extend beyond one year or are renewable annually and have been renewed for 2018. Certain contracts allow for changes in minimum required purchase volumes in the event of a temporary or permanent shutdown of a facility. To the extent the contract requires a minimum notice period, such notice period has been included in the above table. The

56

Table of Contents

contractual purchase price for substantially all of these contracts is variable based upon market prices, subject to annual negotiations. We have estimated our contractual obligations by using the terms of our current pricing for each contract. We also have a limited number of contracts which require a minimum payment even if no volume is purchased. We believe that all of our purchase obligations will be utilized in our normal operations. For the years ended December 31, 2019, 2018 and 2017, we made minimum payments of $1 million, nil and nil, respectively, under such take or pay contracts without taking the product.

(3)Totals do not include commitments pertaining to our pension and other postretirement obligations. Our estimated future contributions to our pension and postretirement plans related to continuing operations are as follows (dollars in millions):


5-Year

Average


2020


2021 - 2022


2023 - 2024


Annual

Pension plans

$

83

$

148

$

121

$

61

Other postretirement obligations


5


11


10


5

(4)The above table does not reflect expected tax payments and unrecognized tax benefits due to the inability to make reasonably reliable estimates of the timing and amount of payments. Totals also do not include installment obligations for the U.S. Tax Reform Act deemed repatriation transition tax of approximately $44 million, to be paid $5 million in 2023 and $39 million after 2023. For additional discussion on unrecognized tax benefits, see “Note 20. Income Taxes” to our consolidated financial statements.

Off-Balance Sheet Arrangements

No off-balance sheet arrangements exist.

Restructuring, Impairment and Plant Closing Costs

For a discussion of restructuring plans and the costs involved, see “Note 13. Restructuring, Impairment and Plant Closing Costs” to our consolidated financial statements.

Recently Issued Accounting Pronouncements

For a discussion of recently issued accounting pronouncements, see “Note 2. Summary of Significant Accounting Policies—Recently Issued Accounting Pronouncements” to our consolidated financial statements.

Critical Accounting Policies

The preparation of financial statements and related disclosures in conformity with U.S. GAAP requires management to make judgments, estimates and assumptions that affect the reported amounts in our consolidated financial statements. Our significant accounting policies are summarized in “Note 2. Summary of Significant Accounting Policies” to our consolidated financial statements. Summarized below are our critical accounting policies:

Income Taxes

We use the asset and liability method of accounting for income taxes. Deferred income taxes reflect the net tax effects of temporary differences between the carrying amounts of assets and liabilities for financial and tax reporting purposes. We evaluate deferred tax assets to determine whether it is more likely than not that they will be realized. Valuation allowances are reviewed on a tax jurisdiction basis to analyze whether there is sufficient positive or negative evidence to support a change in judgment about the realizability of the related deferred tax assets for each jurisdiction. These conclusions require significant judgment. In evaluating the objective evidence that historical results provide, we consider the cyclicality of businesses and cumulative income or losses during the applicable period. Cumulative losses incurred over the period limits our ability to consider other subjective evidence, such as our projections of future taxable income. Changes in expected future income in applicable jurisdictions could affect the realization of deferred tax assets in those jurisdictions. As of December 31, 2019, we had total valuation allowances of $231 million. See “Note 20. Income Taxes” to our consolidated financial statements for more information regarding our valuation allowances.

57

Table of Contents

Employee Benefit Programs

We sponsor several contributory and non-contributory defined benefit plans, covering employees primarily in the U.S., the U.K., The Netherlands, Belgium and Switzerland, but also covering employees in a number of other countries. We fund the material plans through trust arrangements (or local equivalents) where the assets are held separately from us. We also sponsor unfunded postretirement plans which provide medical and, in some cases, life insurance benefits covering certain employees in the U.S. and Canada. Amounts recorded in our consolidated financial statements are recorded based upon actuarial valuations performed by various independent actuaries. Inherent in these valuations are numerous assumptions regarding expected long-term rates of return on plan assets, discount rates, compensation increases, mortality rates and health care cost trends. These assumptions are described in “Note 19. Employee Benefit Plans” to our consolidated financial statements.

Management, with the advice of actuaries, uses judgment to make assumptions on which our employee pension and postretirement benefit plan obligations and expenses are based. The effect of a 1% change in three key assumptions is summarized as follows (dollars in millions):


Statement of


Balance Sheet

Assumptions


Operations(1)


Impact(2)

Discount rate


—1% increase

$

(36)

$

(482)

—1% decrease


43


562

Expected long-term rates of return on plan assets


—1% increase


(26)


—1% decrease


26


Rate of compensation increase


—1% increase


11


49

—1% decrease


(11)


(56)

(1)Estimated increase (decrease) on 2019 net periodic benefit cost

(2)Estimated increase (decrease) on December 31, 2019 pension and postretirement liabilities and accumulated other comprehensive loss

Contingent Loss Accruals

We are subject to legal proceedings and claims arising out of our business operations. We routinely assess the likelihood of any adverse outcomes to these matters, as well as ranges of probable losses. A determination of the amount of the reserves required, if any, for these contingencies is made after analysis of each known claim. We have an active risk management program consisting of numerous insurance policies secured from many carriers. These policies often provide coverage that is intended to minimize the financial impact, if any, of the legal proceedings. The required reserves may change in the future due to new developments in each matter. For further information, see “Note 21. Commitments and Contingencies—Legal Matters” to our consolidated financial statements.

Goodwill

We test our goodwill for impairment at least annually (at the beginning of the third quarter) and when events and circumstances change that would more likely than not reduce the fair value of a reporting unit below its carrying amount. Goodwill has been assigned to reporting units for purposes of impairment testing. Approximately 64% and 30% of our goodwill balance relates to our MDI urethanes reporting unit and our Advanced Materials reporting unit, respectively. The remaining goodwill relates to two other reporting units.

Fair value is estimated using the market approach, as well as the income approach based on discounted cash flow projections. The estimated fair values of our reporting units are dependent on several significant assumptions including, among others, market information, discount rates, operating results, earnings projections and anticipated future cash flows.

We tested goodwill for impairment at the beginning of the third quarter of 2019 as part of the annual impairment testing procedures and determined that no goodwill impairment existed. Our most recent fair value determination resulted in an amount that exceeded the carrying amounts of all reporting units by a significant margin.

58

Table of Contents

ITEM 7A. QUANTITATIVE AND QUALITATIVE DISCLOSURES ABOUT MARKET RISK

We are exposed to market risks, such as changes in interest rates, foreign exchange rates and commodity prices. From time to time, we enter into transactions, including transactions involving derivative instruments, to manage certain of these exposures. We also hedge our net investment in certain European operations. Changes in the fair value of the hedge in the net investment of certain European operations are recorded in accumulated other comprehensive loss.

Interest Rate Risks

See “Note 16. Derivative Instruments and Hedging Activities—Interest Rate Risk” to our consolidated financial statements.

Foreign Exchange Rate Risk

See “Note 16. Derivative Instruments and Hedging Activities—Foreign Exchange Rate Risk” to our consolidated financial statements.

Commodity Prices Risk

See “Note 16. Derivative Instruments and Hedging Activities—Commodity Prices Risk” to our consolidated financial statements.

ITEM 8. FINANCIAL STATEMENTS AND SUPPLEMENTARY DATA

Our consolidated financial statements required by this item are included on the pages immediately following the Index to Consolidated Financial Statements appearing on page F-1.

ITEM 9. CHANGES IN AND DISAGREEMENTS WITH ACCOUNTANTS ON ACCOUNTING AND FINANCIAL DISCLOSURE

There have been no changes in our independent accountants, Deloitte & Touche LLP, or disagreements with them on matters of accounting or financial disclosure.

ITEM 9A. CONTROLS AND PROCEDURES

Evaluation of Disclosure Controls and Procedures

Our management, with the participation of our chief executive officer and chief financial officer, has evaluated the effectiveness of our disclosure controls and procedures (as defined in Rules 13a-15(e) and 15d-15(e) under the Exchange Act) as of December 31, 2019. Based on this evaluation, our chief executive officer and chief financial officer have concluded that, as of December 31, 2019, our disclosure controls and procedures were effective, in that they ensure that information required to be disclosed by us in the reports that we file or submit under the Exchange Act is (1) recorded, processed, summarized and reported within the time periods specified in the SEC’s rules and forms, and (2) accumulated and communicated to our management, including our chief executive officer and chief financial officer, as appropriate to allow timely decisions regarding required disclosure.

Changes in Internal Control Over Financial Reporting

No changes to our internal control over financial reporting occurred during the quarter ended December 31, 2019 that have materially affected, or are reasonably likely to materially affect, our internal control over financial reporting (as defined in Rules 13a-15(f) and 15d-15(f) under the Exchange Act).

Management’s Report on Internal Control Over Financial Reporting

Management is responsible for establishing and maintaining adequate internal control over financial reporting. Our internal control framework and processes for our Company and Huntsman International are designed to provide reasonable assurance to management, Huntsman International’s Board of Managers and our Board of Directors regarding

59

Table of Contents

the reliability of financial reporting and the preparation of our consolidated financial statements in accordance with accounting principles generally accepted in the United States of America.

Our internal control over financial reporting for our Company and Huntsman International includes those policies and procedures that:

pertain to the maintenance of records that, in reasonable detail, accurately and fairly reflect the transactions and dispositions of the assets of our Company and Huntsman International;
provide reasonable assurance that transactions are recorded properly to allow for the preparation of financial statements in accordance with generally accepted accounting principles, and that receipts and expenditures of our Company and Huntsman International are being made only in accordance with authorizations of management and Directors of our Company and Huntsman International;
provide reasonable assurance regarding prevention or timely detection of unauthorized acquisition, use or disposition of our assets that could have a material effect on our consolidated financial statements; and
provide reasonable assurance as to the detection of fraud.

Because of its inherent limitations, a system of internal control over financial reporting can provide only reasonable assurance and may not prevent or detect misstatements. Further, because of changing conditions, effectiveness of internal control over financial reporting may vary over time.

Our management assessed the effectiveness of our internal control over financial reporting for our Company and Huntsman International and concluded that, as of December 31, 2019, such internal control is effective. In making this assessment, management used the criteria set forth by the Committee of Sponsoring Organizations of the Treadway Commission in Internal Control—Integrated Framework (2013).

Our independent registered public accounting firm, Deloitte & Touche LLP, with direct access to our Board of Directors through our Audit Committee, have audited our consolidated financial statements prepared by our Company and Huntsman International and have issued attestation reports on internal control over financial reporting for our Company and Huntsman International.

60

Table of Contents

REPORT OF INDEPENDENT REGISTERED PUBLIC ACCOUNTING FIRM

To the Board of Directors and Stockholders of

Huntsman Corporation

Opinion on Internal Control over Financial Reporting

We have audited the internal control over financial reporting of Huntsman Corporation and subsidiaries (the “Company”) as of December 31, 2019, based on criteria established in Internal Control — Integrated Framework (2013) issued by the Committee of Sponsoring Organizations of the Treadway Commission (COSO). In our opinion, the Company maintained, in all material respects, effective internal control over financial reporting as of December 31, 2019, based on criteria established in Internal Control — Integrated Framework (2013) issued by COSO.

We have also audited, in accordance with the standards of the Public Company Accounting Oversight Board (United States) (PCAOB), the consolidated financial statements as of and for the year ended December 31, 2019 of the Company and our report dated February 13, 2020, expressed an unqualified opinion on those financial statements and included an explanatory paragraph regarding the Company’s adoption of a new accounting standard.

Basis for Opinion

The Company’s management is responsible for maintaining effective internal control over financial reporting and for its assessment of the effectiveness of internal control over financial reporting, included in the accompanying Management’s Report on Internal Control Over Financial Reporting. Our responsibility is to express an opinion on the Company’s internal control over financial reporting based on our audit. We are a public accounting firm registered with the PCAOB and are required to be independent with respect to the Company in accordance with the U.S. federal securities laws and the applicable rules and regulations of the Securities and Exchange Commission and the PCAOB.

We conducted our audit in accordance with the standards of the PCAOB. Those standards require that we plan and perform the audit to obtain reasonable assurance about whether effective internal control over financial reporting was maintained in all material respects. Our audit included obtaining an understanding of internal control over financial reporting, assessing the risk that a material weakness exists, testing and evaluating the design and operating effectiveness of internal control based on the assessed risk, and performing such other procedures as we considered necessary in the circumstances. We believe that our audit provides a reasonable basis for our opinion.

Definition and Limitations of Internal Control over Financial Reporting

A company’s internal control over financial reporting is a process designed to provide reasonable assurance regarding the reliability of financial reporting and the preparation of financial statements for external purposes in accordance with generally accepted accounting principles. A company’s internal control over financial reporting includes those policies and procedures that (1) pertain to the maintenance of records that, in reasonable detail, accurately and fairly reflect the transactions and dispositions of the assets of the company; (2) provide reasonable assurance that transactions are recorded as necessary to permit preparation of financial statements in accordance with generally accepted accounting principles, and that receipts and expenditures of the company are being made only in accordance with authorizations of management and directors of the company; and (3) provide reasonable assurance regarding prevention or timely detection of unauthorized acquisition, use, or disposition of the company’s assets that could have a material effect on the financial statements.

Because of its inherent limitations, internal control over financial reporting may not prevent or detect misstatements. Also, projections of any evaluation of effectiveness to future periods are subject to the risk that controls may become inadequate because of changes in conditions, or that the degree of compliance with the policies or procedures may deteriorate.

/s/ DELOITTE & TOUCHE LLP

Houston, Texas

February 13, 2020

We have served as the Company’s auditor since 1984.

61

Table of Contents

ITEM 9B. OTHER INFORMATION

None.

PART III

ITEM 10. DIRECTORS, EXECUTIVE OFFICERS AND CORPORATE GOVERNANCE

Information relating to our Directors (including identification of our Audit Committee’s financial expert(s)) and executive officers will be disclosed in the definitive Proxy Statement for our Annual Meeting of Stockholders and is incorporated herein by reference. See also the information regarding executive officers of the registrant set forth in Part I under the caption “Executive Officers of the Registrant” in reliance on General Instruction G to Form 10-K.

Code of Ethics

We have adopted a code of ethics, as defined by Item 406(b) of Regulation S-K under the Exchange Act, that applies to our principal executive officer, principal financial officer and principal accounting officer or controller. A copy of the code of ethics is posted on our website, at www.huntsman.com. We intend to disclose any amendments to, or waivers from, our code of ethics on our website.

ITEM 11. EXECUTIVE COMPENSATION

Information relating to executive compensation and our equity compensation plans will be disclosed in the definitive Proxy Statement for our Annual Meeting of Stockholders and is incorporated herein by reference.

ITEM 12. SECURITY OWNERSHIP OF CERTAIN BENEFICIAL OWNERS AND MANAGEMENT AND RELATED STOCKHOLDER MATTERS

Information with respect to beneficial ownership of our common stock by each Director and all Directors and officers of our Company as a group will be disclosed in the definitive Proxy Statement for our Annual Meeting of Stockholders and is incorporated herein by reference.

Information relating to any person who beneficially owns in excess of five percent of the total outstanding shares of our common stock will be disclosed in the definitive Proxy Statement for our Annual Meeting of Stockholders and is incorporated herein by reference.

Information with respect to compensation plans under which equity securities are authorized for issuance will be disclosed in the definitive Proxy Statement for our Annual Meeting of Stockholders and is incorporated herein by reference.

ITEM 13. CERTAIN RELATIONSHIPS AND RELATED TRANSACTIONS, AND DIRECTOR INDEPENDENCE

Information with respect to certain relationships and related transactions will be disclosed in the definitive Proxy Statement for our Annual Meeting of Stockholders and is incorporated herein by reference.

ITEM 14. PRINCIPAL ACCOUNTANT FEES AND SERVICES

Information with respect to principal accountant fees and services, and the disclosure of the Audit Committee’s pre-approval policies and procedures are contained in the definitive Proxy Statement for our Annual Meeting of Stockholders and are incorporated herein by reference.

62

Table of Contents

PART IV

ITEM 15. EXHIBITS AND FINANCIAL STATEMENT SCHEDULES

(a)Documents filed with this report.
1.Consolidated Financial Statements:

See Index to Consolidated Financial Statements on page F-1

2.Financial Statement Schedules:

Other than as stated on the Index to Consolidated Financial Statements on page F-1 with respect to Schedule I and Schedule II, financial statement schedules are omitted because they are not required or are not applicable or the required information is shown in the consolidated financial statements or notes thereto.

3.Exhibits:

The exhibits to this report are listed on the Exhibit Index below.

(b)Description of exhibits.

EXHIBIT INDEX

Incorporated by Reference

Number


Description


Form


Exhibit


Filing Date

2.1

Equity and Asset Purchase Agreement, dated as of August 7, 2019, by and among Huntsman International LLC, Indorama Ventures Holdings L.P., and Indorama Ventures Public Company Limited.

8-K

2.1

August 12, 2019

3.1

Amended and Restated Certificate of Incorporation of Huntsman Corporation

8-K

3.1

May 12, 2014

3.2

Fifth Amended and Restated Bylaws of Huntsman Corporation dated as of December 21, 2016

8-K

3.1

December 23, 2016

4.1

Registration Rights Agreement dated as of February 10, 2005, by and among Huntsman Corporation and the stockholders signatory thereto (File No. 001-32427)

8-K

10.1

February 16, 2005

4.2

Form of stock certificate of Huntsman Corporation

S-1

4.68

February 8, 2005

4.3

Form of Restricted Stock Unit Agreement for Outside Directors, effective for grants prior to February 6, 2008

S-8

4.8

February 10, 2006

4.4

Form of Restricted Stock Unit Agreement for Outside Directors, effective for grants from February 6, 2008 to September 21, 2010 (File No. 001-32427)

10-K

4.32

February 22, 2008

4.5

Indenture, dated as of December 23, 2013, by and among Huntsman International LLC, the guarantors named therein, Citibank, N.A., London Branch, as paying agent, registrar and transfer agent, and Wilmington Trust, National Association, as trustee

8-K

4.1

December 23, 2013

4.6

Form of 5.125% Senior Note (included as Exhibit A to Exhibit 4.8)

8-K

4.2

December 23, 2013

4.7

Indenture, dated as of November 13, 2014, by and among Huntsman International LLC, the guarantors named therein, and Wilmington Trust, National Association, as trustee

8-K

4.1

November 17, 2014

4.8

Form of 5.125% Senior Note (included as Exhibit A to Exhibit 4.11)

8-K

4.2

November 17, 2014

4.9

Indenture, dated as of March 31, 2015, by and among Huntsman International LLC, the guarantors named therein, Citibank, N.A., London Branch, as paying agent, transfer agent, registrar and authenticating agent, and Wilmington Trust, National Association, as trustee

8-K

4.1

April 2, 2015

4.10

Form of 4.25% Senior Notes due 2025 (included as Exhibit A to Exhibit 4.14)

8-K

4.2

April 2, 2015

4.11

Indenture, dated as of March 13, 2019, by and between Huntsman International LLC and Wilmington Trust, National Association, as trustee.

8-K

4.1

March 13, 2019

63

Table of Contents

Incorporated by Reference

Number


Description


Form


Exhibit


Filing Date

4.12

First Supplemental Indenture, dated as of March 13, 2019, by and between Huntsman International LLC and Wilmington Trust, National Association, as trustee.

8-K

4.2

March 13, 2019

4.13

Form of 4.500% Senior Notes due 2029 (included as Exhibit A to Exhibit 4.12)

8-K

4.3

March 13, 2019

4.14*

Description of Securities

10.1

Employment Agreement with Anthony Hankins

S-1/A

10.27

January 28, 2005

10.2

Huntsman Corporation Stock Incentive Plan

S-1/A

10.19

February 8, 2005

10.3

Form of Nonqualified Stock Option Agreement, effective for grants prior to February 21, 2011

S-1/A

10.20

February 8, 2005

10.4

Form of Indemnification Agreement

S-1/A

10.25

February 8, 2005

10.5

Amended and Restated Huntsman Supplemental Executive Retirement Plan (File No. 001-32427)

8-K

10.1

December 30, 2005

10.6

Huntsman Supplemental Executive MPP Plan (File No. 001-32427)

8-K

10.2

December 30, 2005

10.7

Amended and Restated Huntsman Supplemental Savings Plan (File No. 001-32427)

8-K

10.3

December 30, 2005

10.8

Huntsman Outside Directors Elective Deferral Plan (File No. 001-32427)

8-K

10.4

December 30, 2005

10.9

First Amendment to Huntsman Supplemental Executive Retirement Plan (File No. 001-32427)

10-K

10.32

February 22, 2008

10.10

First Amendment to Huntsman Supplemental Executive MPP Plan (File No. 001-32427)

10-K

10.33

February 22, 2008

10.11

First Amendment to Huntsman Supplemental Savings Plan (File No. 001-32427)

10-K

10.34

February 22, 2008

10.12

Second Amendment to Huntsman Supplemental Savings Plan (File No. 001-32427)

10-K

10.35

February 22, 2008

10.13

First Amendment to Huntsman Outside Directors Elective Deferral Plan (File No. 001-32427)

10-K

10.36

February 22, 2008

10.14

U.S. Receivables Loan Agreement dated as of October 16, 2009 among Huntsman Receivables Finance II LLC, Huntsman (Europe) BVBA, the several entities party thereto as lenders, the several financial institutions party thereto as funding agents, the several commercial paper conduits party thereto as conduit lenders, the several financial institutions party thereto as committed lenders, Wachovia Bank National Association, as administrative agent, and Wachovia Bank National Association, as collateral Agent (File No. 001-32427)

8-K

10.1

October 22, 2009

10.15

U.S. Contribution Agreement dated as of October 16, 2009 between Huntsman International LLC and Huntsman Receivables Finance II LLC (File No. 001-32427)

8-K

10.2

October 22, 2009

10.16

European Receivables Loan Agreement dated as of October 16, 2009 between Huntsman Receivables Finance LLC, Huntsman (Europe) BVBA, the several entities party thereto as lenders, the several financial institutions party thereto as funding agents, Barclays Bank Plc, as administrative agent, and Barclays Bank Plc, as collateral agent (File No. 001-32427)

8-K

10.3

October 22, 2009

10.17

European Contribution Agreement dated as of October 16, 2009 between Huntsman International LLC and Huntsman Receivables Finance LLC (File No. 001-32427)

8-K

10.4

October 22, 2009

10.18

Second Amendment to Huntsman Supplemental Executive Retirement Plan (File No. 001-32427)

10-K

10.38

February 17, 2011

10.19

Third Amendment to Huntsman Supplemental Executive Retirement Plan (File No. 001-32427)

10-K

10.39

February 17, 2011

10.20

Form of Nonqualified Stock Option Agreement effective for grants from February 2, 2011 to May 5, 2016 (File No. 001-32427)

10-K

10.42

February 17, 2011

10.21

Form of Restricted Stock Unit Agreement for Outside Directors effective for grants from February 2, 2011 to May 5, 2016 (File No. 001-32427)

10-K

10.43

February 17, 2011

10.22

Master Amendment No. 2 to the U.S. Receivables Loan Agreement, U.S. Servicing Agreement and Transaction Documents dated as of April 18, 2011 (File No. 001-32427)

8-K

10.1

April 20, 2011

64

Table of Contents

Incorporated by Reference

Number


Description


Form


Exhibit


Filing Date

10.23

Master Amendment No. 2 to the European Receivables Loan Agreement, European Servicing Agreement and Transaction Documents dated as of April 15, 2011 (File No. 001-32427)

8-K

10.2

April 20, 2011

10.24

Second Amendment to Huntsman Outside Directors Elective Deferral Plan (File No. 001-32427)

10-Q

10.5

May 5, 2011

10.25

Third Amendment to Huntsman Outside Directors Elective Deferral Plan (File No. 001-32427)

10-Q

10.6

May 5, 2011

10.26

Huntsman Corporation Stock Incentive Plan (amended and restated) (File No. 001-32427)

S-8

4.1

May 10, 2011

10.27

First Amendment to the Huntsman Corporation Stock Incentive Plan (as amended and restated) (File No. 001-32427)

10-K

10.56

February 12, 2013

10.28

Master Amendment No. 3 to the U.S. Receivables Loan Agreement, U.S. Servicing Agreement and Transaction Documents dated as of April 29, 2013

8-K

10.1

May 2, 2013

10.29

Master Amendment No. 3 to the European Receivables Loan Agreement dated as of April 29, 2013

8-K

10.2

May 2, 2013

10.30

Huntsman Executive Severance Plan (as amended and restated)

10-Q

10.3

October 29, 2013

10.31

Huntsman Corporation Stock Incentive Plan (amended and restated)

8-K

10.1

May 12, 2014

10.32

Amendment to the Huntsman Corporation Stock Incentive Plan Nonqualified Stock Option Agreement effective for grants through May 5, 2016

10-K

10.66

February 18, 2015

10.33

Master Amendment No. 4 to the European Receivables Loan Agreement, the Servicing Agreement, the Liquidation Servicer Agreement and the Transaction Documents, dated as of March 5, 2015

8-K

10.1

March 9, 2015

10.34

Master Amendment No. 4 to the U.S. Receivables Loan Agreement, U.S. Servicing Agreement and Transaction Documents and Waiver, dated as of March 30, 2015

8-K

10.2

April 2, 2015

10.35

Huntsman Corporation 2016 Stock Incentive Plan

8-K

10.1

May 11, 2016

10.36

Form of Nonqualified Stock Option Agreement effective for grants from May 5, 2016 to January 31, 2017

S-8

99.1

May 31, 2016

10.37

Form of Restricted Stock Agreement effective for grants from May 5, 2016 to January 31, 2017

S-8

99.2

May 31, 2016

10.38

Form of Phantom Share Agreement effective for grants from May 5, 2016 to January 31, 2017

S-8

99.3

May 31, 2016

10.39

Form of Phantom Share Agreement

10-K

10.66

February 15, 2017

10.40

Form of Performance Share Unit Award Agreement

10-K

10.67

February 15, 2017

10.41

Form of Nonqualified Stock Option Agreement

10-K

10.68

February 15, 2017

10.42

Form of Restricted Stock Agreement

10-K

10.69

February 15, 2017

10.43

Form of Stock Unit Agreement for Outside Directors

10-K

10.70

February 15, 2017

10.44

Form of Notice of Award of Common Stock

10-K

10.71

February 15, 2017

10.45

Amended and Restated European Receivables Loan Agreement dated as of April 21, 2017 between Huntsman Receivables Finance LLC, Vantico Group S.à r.l., the several entities party thereto as lenders, the several financial institutions party thereto as funding agents, Barclays Bank Plc, as administrative agent, and Barclays Bank Plc, as collateral agent

10-Q

10.1

April 26, 2017

10.46

Master Amendment No. 6 to the U.S. Receivables Loan Agreement, U.S. Servicing Agreement, U.S Receivables Purchase Agreement and Transaction Documents dated as of April 21, 2017

10-Q

10.2

April 26, 2017

10.47

Amended and Restated Severance Agreement dated December 19, 2017 between Huntsman Corporation and Peter R. Huntsman

8-K

10.2

December 22, 2017

10.48

Credit Agreement, dated May 21, 2018, between Huntsman International LLC, JPMorgan Chase Bank, N.A., as administrative agent, Bank of America, N.A. and Citibank, N.A. as co-syndication agents, and Goldman Sachs Bank USA and PNC Bank, National Association, as co-documentation agents, and the lenders thereto.

8-K

10.1

May 23, 2018

10.49

Master Amendment No. 7 to the U.S. Receivables Loan Agreement, U.S. Servicing Agreement, U.S. Receivables Purchase Agreement and Transaction Documents, dated as of April 18, 2019

8-K

10.1

April 24, 2019

10.50

Amended and Restated European Receivables Loan Agreement, dated as of April 18, 2019

8-K

10.2

April 24, 2019

65

Table of Contents

Incorporated by Reference

Number


Description


Form


Exhibit


Filing Date

10.51

Letter Agreement dated as of June 3, 2015, between Rohit Aggarwal and Huntsman (Singapore) Pte Ltd

10-Q

10.1

April 30, 2019

10.52*

Master Amendment No. 8 to the U.S. Receivables Loan Agreement, U.S. Servicing Agreement, U.S. Receivables Purchase Agreement and Transaction Documents, dated as of December 3, 2019

21.1*

Subsidiaries of Huntsman Corporation

23.1*

Consent of Independent Registered Public Accounting Firm

31.1*

Certification of Chief Executive Officer pursuant to Section 302 of the Sarbanes-Oxley Act of 2002

31.2*

Certification of Chief Financial Officer pursuant to Section 302 of the Sarbanes-Oxley Act of 2002

32.1*

Certification of Chief Executive Officer pursuant to Section 906 of the Sarbanes-Oxley Act of 2002

32.2*

Certification of Chief Financial Officer pursuant to Section 906 of the Sarbanes-Oxley Act of 2002

101.INS*

XBRL Instance Document - the instance document does not appear in the Interactive Data File because its XBRL tags are embedded within the Inline XBRL document.

101.SCH*

XBRL Taxonomy Extension Schema

101.CAL*

XBRL Taxonomy Extension Calculation Linkbase

101.LAB*

XBRL Taxonomy Extension Label Linkbase

101.PRE*

XBRL Taxonomy Extension Presentation Linkbase

101.DEF*

XBRL Taxonomy Extension Definition Linkbase

104

The cover page from this Annual Report on Form 10-K formatted in Inline XBRL

*Filed herewith.

66

Table of Contents

SIGNATURES

Pursuant to the requirements of Section 13 or 15(d) of the Securities Exchange Act of 1934, the registrants have duly caused this report to be signed on their behalf by the undersigned, thereunto duly authorized.

Dated: February 13, 2020

Huntsman Corporation
Huntsman International LLC

By:

/s/ Sean Douglas

Sean Douglas
Executive Vice President and Chief Financial Officer

Pursuant to the requirements of the Securities Exchange Act of 1934, this report has been signed below by the following persons on behalf of Huntsman Corporation in the capacities indicated on the 13th day of February 2020.

/s/ Peter R. Huntsman


/s/ Sean Douglas

Peter R. Huntsman

Chairman, President and Chief Executive Officer

(Principal Executive Officer)

Sean Douglas
Executive Vice President and Chief Financial Officer (Principal Financial Officer)

/s/ Randy W. Wright

/s/ Wayne A. Reaud

Randy W. Wright
Vice President and Controller (Authorized Signatory and Principal Accounting Officer)

Wayne A. Reaud
Chairman of the Litigation Committee and Director

/s/ Nolan D. Archibald

/s/ M. Anthony Burns

Nolan D. Archibald
Vice Chairman, Chairman of the Nominating and Corporate Governance Committee and Lead Independent Director

M. Anthony Burns
Chairman of the Audit Committee and Director

/s/ Sir Robert J. Margetts

/s/ Dr. Mary C. Beckerle

Sir Robert J. Margetts
Director

Dr. Mary C. Beckerle
Director

/s/ Daniele Ferrari

/s/ Vice Admiral Jan E. Tighe

Daniele Ferrari
Director

Vice Admiral Jan E. Tighe
Director

67

Table of Contents

Pursuant to the requirements of the Securities Exchange Act of 1934, this report has been signed below by the following persons on behalf of Huntsman International LLC in the capacities indicated on the 13th day of February 2020.

/s/ Peter R. Huntsman

/s/ Sean Douglas

Peter R. Huntsman
President, Chief Executive Officer and Manager (Principal Executive Officer)

Sean Douglas
Executive Vice President, Chief Financial Officer and Manager (Principal Financial Officer)

/s/ Randy W. Wright

/s/ David M. Stryker

Randy W. Wright
Vice President and Controller (Authorized Signatory and Principal Accounting Officer)

David M. Stryker
Executive Vice President, General Counsel,

Secretary and Manager

68

Table of Contents

HUNTSMAN CORPORATION AND SUBSIDIARIES

HUNTSMAN INTERNATIONAL LLC AND SUBSIDIARIES

INDEX TO CONSOLIDATED FINANCIAL STATEMENTS


Page

Huntsman Corporation and Subsidiaries:

Consolidated Financial Statements

Report of Independent Registered Public Accounting Firm

F-2

Consolidated Balance Sheets as of December 31, 2019 and 2018

F-4

Consolidated Statements of Operations for the Years Ended December 31, 2019, 2018 and 2017

F-5

Consolidated Statements of Comprehensive Income for the Years Ended December 31, 2019, 2018 and 2017

F-6

Consolidated Statements of Equity for the Years Ended December 31, 2019, 2018 and 2017

F-7

Consolidated Statements of Cash Flows for the Years Ended December 31, 2019, 2018 and 2017

F-8

Huntsman International LLC and Subsidiaries:

Consolidated Financial Statements

Report of Independent Registered Public Accounting Firm

F-10

Consolidated Balance Sheets as of December 31, 2019 and 2018

F-11

Consolidated Statements of Operations for the Years Ended December 31, 2019, 2018 and 2017

F-12

Consolidated Statements of Comprehensive Income for the Years Ended December 31, 2019, 2018 and 2017

F-13

Consolidated Statements of Equity for the Years Ended December 31, 2019, 2018 and 2017

F-14

Consolidated Statements of Cash Flows for the Years Ended December 31, 2019, 2018 and 2017

F-15

Huntsman Corporation and Subsidiaries and Huntsman International LLC and Subsidiaries:

Notes to Consolidated Financial Statements

F-17

Schedules to Consolidated Financial Statements

Schedule to Consolidated Financial Statements, Schedule I—Condensed Financial Information of Registrant (Huntsman Corporation only)

F-80

Schedule to Consolidated Financial Statements, Schedule II—Valuation and Qualifying Accounts (Huntsman Corporation and Subsidiaries and Huntsman International LLC and Subsidiaries)

F-85

F-1

Table of Contents

REPORT OF INDEPENDENT REGISTERED PUBLIC ACCOUNTING FIRM

To the Board of Directors and Stockholders of Huntsman Corporation

Opinion on the Financial Statements

We have audited the accompanying consolidated balance sheets of Huntsman Corporation and subsidiaries (the “Company”) as of December 31, 2019 and 2018, the related consolidated statements of operations, comprehensive income (loss), equity, and cash flows for each of the three years in the period ended December 31, 2019, and the related notes and the schedules listed in the Index on page F-1 (collectively referred to as the “financial statements”). In our opinion, the financial statements present fairly, in all material respects, the financial position of the Company as of December 31, 2019 and 2018, and the results of its operations and its cash flows for each of the three years in the period ended December 31, 2019, in conformity with accounting principles generally accepted in the United States of America.

We have also audited, in accordance with the standards of the Public Company Accounting Oversight Board (United States) (PCAOB), the Company’s internal control over financial reporting as of December 31, 2019, based on criteria established in Internal Control—Integrated Framework (2013) issued by the Committee of Sponsoring Organizations of the Treadway Commission and our report dated February 13, 2020, expressed an unqualified opinion on the Company’s internal control over financial reporting.

Change in Accounting Principle

As discussed in Note 2 to the financial statements, effective January 1, 2019, the Company adopted the Financial Accounting Standards Board Accounting Standards Update No. 2016-02, Leases (Topic 842).

Basis for Opinion

These financial statements are the responsibility of the Company’s management. Our responsibility is to express an opinion on the Company’s financial statements based on our audits. We are a public accounting firm registered with the PCAOB and are required to be independent with respect to the Company in accordance with the US federal securities laws and the applicable rules and regulations of the Securities and Exchange Commission and the PCAOB.

We conducted our audits in accordance with the standards of the PCAOB. Those standards require that we plan and perform the audits to obtain reasonable assurance about whether the financial statements are free of material misstatement, whether due to error or fraud. Our audits included performing procedures to assess the risks of material misstatement of the financial statements, whether due to error or fraud, and performing procedures that respond to those risks. Such procedures included examining, on a test basis, evidence regarding the amounts and disclosures in the financial statements. Our audits also included evaluating the accounting principles used and significant estimates made by management, as well as evaluating the overall presentation of the financial statements. We believe that our audits provide a reasonable basis for our opinion.

Critical Audit Matter

The critical audit matter communicated below is a matter arising from the current-period audit of the financial statements that was communicated or required to be communicated to the audit committee and that (1) relates to accounts or disclosures that are material to the financial statements and (2) involved our especially challenging, subjective, or complex judgments. The communication of critical audit matters does not alter in any way our opinion on the financial statements, taken as a whole, and we are not, by communicating the critical audit matter below, providing a separate opinion on the critical audit matter or on the accounts or disclosures to which it relates.

Income Taxes—Realizability of Deferred Tax Assets—Refer to Notes 2 and 20 to the financial statements

Critical Audit Matter Description

The Company recognizes deferred income taxes for tax attributes and for differences between the financial statement and tax carrying amounts of assets and liabilities at enacted statutory tax rates in effect for the years in which the deferred tax liability or asset are expected to be settled or realized. A valuation allowance is provided to offset deferred tax assets if, based upon the available evidence, it is more likely than not that some or all of the deferred tax assets will not be realized. The Company files tax returns in multiple jurisdictions with complex tax laws and regulations. Valuation

F-2

Table of Contents

allowances are evaluated on a tax jurisdiction basis to analyze whether there is sufficient positive or negative evidence to support a change in judgment about the realizability of the related deferred tax assets for each jurisdiction. In evaluating the objective evidence that historical results provide, the Company considers the cyclicality of businesses and cumulative income or losses during the applicable period. Cumulative losses incurred over the period limits the Company’s ability to consider other subjective evidence such as taxable income for the future. The Company’s valuation allowances as of December 31, 2019, were $231 million.

We identified management’s determination that it is not more likely than not that sufficient taxable income will be generated in the future to realize some of its deferred tax assets as a critical audit matter because of the significant judgments and estimates management makes related to future taxable income. This required a high degree of auditor judgment and an increased extent of effort, including the need to involve our income tax specialists, when performing audit procedures to evaluate the reasonableness of management’s estimates of future taxable income.

How the Critical Audit Matter Was Addressed in the Audit

Our audit procedures related to estimated future taxable income and the determination of whether it is more likely than not that the deferred tax assets will be realized included the following, among others:

We tested the effectiveness of controls over the valuation allowance for income taxes, including management’s controls over the estimates of future taxable income and the determination of whether it is more likely than not that the deferred tax assets will be realized.
With the assistance of our income tax specialists, we considered the following sources of management’s estimated future taxable income:
Estimates of future taxable income
Future reversals of existing temporary differences
Taxable income in historical periods (when carryback was permitted)
We tested the reasonableness of management’s estimates of future taxable income by comparing the estimates to:
Historical taxable income
Internal communications to management and the Board of Directors
Forecasted information included in Company press releases as well as in analyst and industry reports for the Company and certain of its peer companies
We evaluated whether the taxable income in prior carryback years was of the appropriate character and available under the tax law.
We evaluated the reasonableness of the methods, assumptions, and judgments used by management to determine whether a valuation allowance was necessary.

/s/ deloitte & touche llp

Houston, Texas
February 13, 2020

We have served as the Company’s auditor since 1984.

F-3

Table of Contents

HUNTSMAN CORPORATION AND SUBSIDIARIES

CONSOLIDATED BALANCE SHEETS

(In Millions, Except Share Amounts)

December 31, 

December 31, 


2019


2018

ASSETS

Current assets:

Cash and cash equivalents(a)

$

525

$

340

Accounts and notes receivable (net of allowance for doubtful accounts of $19 and $21, respectively), ($221 and $341 pledged as collateral, respectively)(a)

940

1,165

Accounts receivable from affiliates

13

18

Inventories(a)

914

1,000

Prepaid expenses

83

58

Other current assets(a)

72

145

Current assets held for sale

1,208

232

Total current assets

3,755

2,958

Property, plant and equipment, net(a)

2,383

2,353

Investment in unconsolidated affiliates

535

526

Intangible assets, net(a)

197

213

Goodwill

276

275

Deferred income taxes

292

324

Notes receivable from affiliate

34

34

Operating lease right-of-use assets

396

Other noncurrent assets(a)

452

393

Noncurrent assets held for sale

877

Total assets

$

8,320

$

7,953

LIABILITIES AND EQUITY

Current liabilities:

Accounts payable(a)

$

765

$

761

Accounts payable to affiliates

57

32

Accrued liabilities(a)

420

497

Current portion of debt(a)

212

96

Current operating lease liabilities(a)

42

Current liabilities held for sale

512

225

Total current liabilities

2,008

1,611

Long-term debt(a)

2,177

2,224

Deferred income taxes

29

137

Noncurrent operating lease liabilities(a)

384

Other noncurrent liabilities(a)

898

949

Noncurrent liabilities held for sale

283

Total liabilities

5,496

5,204

Commitments and contingencies (Notes 21 and 22)

Equity

Huntsman Corporation stockholders’ equity:

Common stock $0.01 par value, 1,200,000,000 shares authorized, 257,405,496 and 256,006,849 shares issued and 224,295,868 and 232,994,172 shares outstanding, respectively

3

3

Additional paid-in capital

4,008

3,984

Treasury stock, 33,112,572 and 23,012,680 shares, respectively

(635)

(427)

Unearned stock-based compensation

(17)

(16)

Retained earnings

690

292

Accumulated other comprehensive loss

(1,362)

(1,316)

Total Huntsman Corporation stockholders’ equity

2,687

2,520

Noncontrolling interests in subsidiaries

137

229

Total equity

2,824

2,749

Total liabilities and equity

$

8,320

$

7,953

(a)At December 31, 2019 and December 31, 2018, respectively, nil and $7 of cash and cash equivalents, $13 and $30 of accounts and notes receivable (net), $35 and $49 of inventories, nil and $5 of other current assets, $180 and $265 of property, plant and equipment (net), nil and $10 of intangible assets (net), $20 and $52 of other noncurrent assets, $100 and $123 of accounts payable, $10 and $30 of accrued liabilities, $36 and $25 of current portion of debt, $4 and nil of current operating lease liabilities, $29 and $61 of long-term debt, $11 and nil of noncurrent operating lease and $87 and $97 of other noncurrent liabilities from consolidated variable interest entities are included in the respective Balance Sheet captions above. See “Note 8. Variable Interest Entities.”

See accompanying notes to consolidated financial statements.

F-4

Table of Contents

HUNTSMAN CORPORATION AND SUBSIDIARIES

CONSOLIDATED STATEMENTS OF OPERATIONS

(In Millions, Except Share and Per Share Amounts)

Year ended December 31, 

2019

2018

2017

Revenues:

Trade sales, services and fees, net

$

6,664

$

7,451

$

6,684

Related party sales

133

153

161

Total revenues

6,797

7,604

6,845

Cost of goods sold

5,415

5,840

5,194

Gross profit

1,382

1,764

1,651

Operating expenses:

Selling, general and administrative

786

789

759

Research and development

137

145

132

Restructuring, impairment and plant closing (credits) costs

(41)

(7)

19

Merger costs

2

28

Other operating expense (income), net

31

8

(16)

Total operating expenses

913

937

922

Operating income

469

827

729

Interest expense

(111)

(115)

(165)

Equity in income of investment in unconsolidated affiliates

54

55

13

Fair value adjustments to Venator investment

(18)

(62)

Loss on early extinguishment of debt

(23)

(3)

(54)

Other income, net

20

32

8

Income from continuing operations before income taxes

391

734

531

Income tax benefit (expense)

38

(45)

(20)

Income from continuing operations

429

689

511

Income (loss) from discontinued operations, net of tax

169

(39)

230

Net income

598

650

741

Net income attributable to noncontrolling interests

(36)

(313)

(105)

Net income attributable to Huntsman Corporation

$

562

$

337

$

636

Basic (loss) income per share:

Income from continuing operations attributable to Huntsman Corporation common stockholders

$

1.72

$

2.55

$

1.71

Income (loss) from discontinued operations attributable to Huntsman Corporation common stockholders, net of tax

0.74

(1.13)

0.96

Net income attributable to Huntsman Corporation common stockholders

$

2.46

$

1.42

$

2.67

Weighted average shares

228.9

238.1

238.4

Diluted (loss) income per share:

Income from continuing operations attributable to Huntsman Corporation common stockholders

$

1.70

$

2.52

$

1.66

Income (loss) from discontinued operations attributable to Huntsman Corporation common stockholders, net of tax

0.74

(1.13)

0.95

Net income attributable to Huntsman Corporation common stockholders

$

2.44

$

1.39

$

2.61

Weighted average shares

230.6

241.6

243.9

Amounts attributable to Huntsman Corporation common stockholders:

Income from continuing operations

$

393

$

608

$

406

Income (loss) from discontinued operations, net of tax

169

(271)

230

Net income

$

562

$

337

$

636

See accompanying notes to consolidated financial statements.

F-5

Table of Contents

HUNTSMAN CORPORATION AND SUBSIDIARIES

CONSOLIDATED STATEMENTS OF COMPREHENSIVE INCOME

(In Millions)

Year ended December 31, 

2019


2018


2017

Net income

$

598

$

650

$

741

Other comprehensive (loss) income, net of tax:

Foreign currency translations adjustments

2

(192)

210

Pension and other postretirement benefits adjustments

(37)

(39)

86

Other, net

(1)

(9)

Other comprehensive (loss) income, net of tax

(36)

(240)

296

Comprehensive income

562

410

1,037

Comprehensive income attributable to noncontrolling interests

(31)

(266)

(127)

Comprehensive income attributable to Huntsman Corporation

$

531

$

144

$

910

See accompanying notes to consolidated financial statements.

F-6

Table of Contents

HUNTSMAN CORPORATION AND SUBSIDIARIES

CONSOLIDATED STATEMENTS OF EQUITY

(In Millions, Except Share Amounts)

Huntsman Corporation Stockholders’ Equity

(Accumulated

Accumulated

Shares

Additional

Unearned

deficit)

other

Noncontrolling

Common

Common

paid-in

Treasury

stock-based

retained

comprehensive

interests in

Total


stock


stock


capital


stock


compensation


earnings


loss


subsidiaries


equity

Beginning balance, January 1, 2017

236,370,347

$

3

$

3,447

$

(150)

$

(17)

$

(325)

$

(1,671)

$

180

$

1,467

Net income


636


105

741

Other comprehensive income


403


(107)

296

Issuance of nonvested stock awards


18


(18)


Vesting of stock awards

1,316,975


8


8

Recognition of stock-based compensation


10


18


28

Repurchase and cancellation of stock awards

(402,978)


(12)


(12)

Stock options exercised

2,929,262


53


(18)


35

Disposition of a portion of Venator


413


413

Costs of the IPO and secondary offering of Venator


(58)


(58)

Conversion of restricted awards to Venator awards


(2)


2


Noncontrolling interest from partial disposal of Venator


602

602

Dividends paid to noncontrolling interests


(34)

(34)

Contribution from noncontrolling interests


5

5

Dividends declared on common stock ($0.50 per share)


(120)


(120)

Balance, December 31, 2017

240,213,606

3

3,889

(150)

(15)

161

(1,268)

751

3,371

Cumulative effect of changes in fair value of equity investments

10

(10)

Net income

337

313

650

Other comprehensive loss

(198)

(42)

(240)

Issuance of nonvested stock awards

14

(14)

Vesting of stock awards

1,135,003

11

11

Recognition of stock-based compensation

8

13

21

Repurchase and cancellation of stock awards

(259,643)

(30)

(30)

Stock options exercised

2,310,663

46

(29)

17

Treasury stock repurchased

(10,405,457)

(277)

(277)

Disposition of a portion of Venator


18


18

Costs of the secondary offering of Venator


(2)


(2)

Noncontrolling interest from partial disposal of Venator


27

27

Deconsolidation of Venator

160

(751)

(591)

Accrued and unpaid dividends

(1)

(1)

Dividends paid to noncontrolling interests

(69)

(69)

Dividends declared on common stock ($0.65 per share)

(156)

(156)

Balance, December 31, 2018

232,994,172

3

3,984

(427)

(16)

292

(1,316)

229

2,749

Net income

562

36

598

Other comprehensive loss

(46)

10

(36)

Issuance of nonvested stock awards

17

(17)

Vesting of stock awards

1,643,368

7

7

Recognition of stock-based compensation

7

16

23

Repurchase and cancellation of stock awards

(488,441)

(12)

(12)

Stock options exercised

246,661

4

(2)

2

Treasury stock repurchased

(10,099,892)

(208)

(208)

Acquisition of noncontrolling interests, net of tax

(11)

(73)

(84)

Dividends declared to noncontrolling interests

(65)

(65)

Dividends declared on common stock ($0.65 per share)

(150)

(150)

Balance, December 31, 2019


224,295,868

$

3

$

4,008

$

(635)

$

(17)

$

690

$

(1,362)

$

137

$

2,824

See accompanying notes to consolidated financial statements.

F-7

Table of Contents

HUNTSMAN CORPORATION AND SUBSIDIARIES

CONSOLIDATED STATEMENTS OF CASH FLOWS

(In Millions)

Year ended December 31, 


2019


2018


2017

Operating Activities:

Net income

$

598

$

650

$

741

Less: (Income) loss from discontinued operations, net of tax

(169)

39

(230)

Income from continuing operations

429

689

511

Adjustments to reconcile income from continuing operations to net cash provided by operating activities from continuing operations:

Equity in income of investment in unconsolidated affiliates

(54)

(55)

(13)

Unrealized losses on fair value adjustments to Venator investment

19

62

Cash received from return on investment in unconsolidated subsidiary

24

Depreciation and amortization

270

255

236

Noncash lease expense

55

(Gain) loss on disposal of businesses/assets, net

(49)

3

(8)

Loss on early extinguishment of debt

23

3

54

Noncash interest expense

3

1

8

Noncash restructuring and impairment charges (credits)

3

(22)

1

Deferred income taxes

(93)

(167)

(95)

Noncash loss (gain) on foreign currency transactions

8

(3)

(5)

Stock-based compensation

29

27

36

Other, net

9

5

6

Changes in operating assets and liabilities:

Accounts and notes receivable

138

(22)

(161)

Inventories

77

(80)

(88)

Prepaid expenses

(27)

(9)

(11)

Other current assets

53

59

23

Other noncurrent assets

(90)

(41)

(46)

Accounts payable

21

12

127

Accrued liabilities

(50)

44

54

Other noncurrent liabilities

(142)

(57)

43

Net cash provided by operating activities from continuing operations

656

704

672

Net cash provided by operating activities from discontinued operations

241

503

547

Net cash provided by operating activities

897

1,207

1,219

Investing Activities:

Capital expenditures

(274)

(251)

(234)

Acquisition of a business, net of cash acquired

(366)

(14)

Proceeds from sale of assets

50

25

Cash received from termination of cross-country interest rate contacts

7

Cash received from forward swap contract related to the sale of investment in Venator

16

3

Other

7

(1)

(1)

Net cash used in investing activities from continuing operations

(201)

(615)

(217)

Net cash used in investing activities from discontinued operations

(59)

(358)

(207)

Net cash used in investing activities

(260)

(973)

(424)

(continued)

F-8

Table of Contents

HUNTSMAN CORPORATION AND SUBSIDIARIES

CONSOLIDATED STATEMENTS OF CASH FLOWS (Continued)

(In Millions)

Year ended December 31, 


2019


2018


2017

Financing Activities:

Net (repayments) borrowings on revolving loan facilities

$

(89)

$

125

$

(41)

Net (repayments) borrowings on overdraft facilities

(1)

1

Repayments of long-term debt

(676)

(68)

(2,058)

Proceeds from issuance of long-term debt

742

24

Proceeds from long-term debt of Venator

750

Repayments of short-term debt

(8)

(15)

Borrowings on short-term debt

102

6

8

Repayments of notes payable

(27)

(29)

(27)

Borrowings on note payable

37

27

31

Debt issuance costs paid

(8)

(4)

(21)

Costs of early extinguishment of debt

(21)

Dividends paid to common stockholders

(150)

(156)

(120)

Dividends paid to noncontrolling interests

(41)

(69)

(34)

Cash paid for noncontrolling interest

(101)

Contribution from noncontrolling interests

5

Repurchase of common stock

(208)

(277)

Repurchase and cancellation of stock awards

(12)

(30)

(12)

Proceeds from issuance of common stock

2

17

35

Proceeds from the IPO of Venator

1,012

Cash paid for expenses for the IPO of Venator

(58)

Proceeds from the secondary offering of Venator

44

Cash paid for expenses of the secondary offering of Venator

(2)

Other

1

1

Net cash used in financing activities

(450)

(424)

(519)

Effect of exchange rate changes on cash

(2)

(35)

18

Increase in cash, cash equivalents and restricted cash

185

(225)

294

Cash, cash equivalents and restricted cash from continuing operations at beginning of period

340

481

396

Cash, cash equivalents and restricted cash from discontinued operations at beginning of period

238

29

Deconsolidation of cash, cash equivalents and restricted cash from Venator

(154)

Cash, cash equivalents and restricted cash at end of period

$

525

$

340

$

719

Supplemental cash flow information:

Cash paid for interest

$

111

$

163

$

175

Cash paid for income taxes

100

179

25

As of December 31, 2019, 2018 and 2017, the amount of capital expenditures in accounts payable was $64 million, $66 million and $51 million, respectively. In addition, as of December 31, 2018, the amount of cash interest and cash income taxes included in our supplemental cash flow information related to cash paid for interest and cash paid for income taxes that was paid by Venator was $46 million and $38 million, respectively. As of December 31, 2017, the amount of cash interest and cash income taxes included in our supplemental cash flow information related to cash paid for interest and cash paid for income taxes that was paid by Venator after the IPO date was $6 million and $16 million, respectively.

See accompanying notes to consolidated financial statements.

F-9

Table of Contents

REPORT OF INDEPENDENT REGISTERED PUBLIC ACCOUNTING FIRM

To the Board of Managers and Members of

Huntsman International LLC

Opinion on the Financial Statements

We have audited the accompanying consolidated balance sheets of Huntsman International LLC and subsidiaries (the "Company") as of December 31, 2019 and 2018, the related consolidated statements of operations, comprehensive income, equity, and cash flows for each of the three years in the period ended December 31, 2019, and the related notes and the schedule listed in the Index on page F-1 (collectively referred to as the “financial statements”). In our opinion, the financial statements present fairly, in all material respects, the financial position of the Company as of December 31, 2019 and 2018, and the results of its operations and its cash flows for each of the three years in the period ended December 31, 2019, in conformity with accounting principles generally accepted in the United States of America.

Change in Accounting Principle

As discussed in Note 2 to the financial statements, effective January 1, 2019, the Company adopted the Financial Accounting Standards Board Accounting Standards Update No. 2016-02, Leases (Topic 842).

Basis for Opinion

These financial statements are the responsibility of the Company's management. Our responsibility is to express an opinion on the Company’s financial statements based on our audits. We are a public accounting firm registered with the PCAOB and are required to be independent with respect to the Company in accordance with the U.S. federal securities laws and the applicable rules and regulations of the Securities and Exchange Commission and the PCAOB.

We conducted our audits in accordance with the standards of the PCAOB. Those standards require that we plan and perform the audit to obtain reasonable assurance about whether the financial statements are free of material misstatement, whether due to error or fraud. The Company is not required to have, nor were we engaged to perform, an audit of its internal control over financial reporting. As part of our audits, we are required to obtain an understanding of internal control over financial reporting but not for the purpose of expressing an opinion on the effectiveness of the Company’s internal control over financial reporting. Accordingly, we express no such opinion.

Our audits included performing procedures to assess the risks of material misstatement of the financial statements, whether due to error or fraud, and performing procedures that respond to those risks. Such procedures included examining, on a test basis, evidence regarding the amounts and disclosures in the financial statements. Our audits also included evaluating the accounting principles used and significant estimates made by management, as well as evaluating the overall presentation of the financial statements. We believe that our audits provide a reasonable basis for our opinion.

/s/ DELOITTE & TOUCHE LLP

Houston, Texas

February 13, 2020

We have served as the Company’s auditor since 1984.

F-10

Table of Contents

HUNTSMAN INTERNATIONAL LLC AND SUBSIDIARIES

CONSOLIDATED BALANCE SHEETS

(In Millions, Except Unit Amounts)

December 31, 

December 31, 

2019

2018

ASSETS

Current assets:

Cash and cash equivalents(a)


$

525


$

340

Accounts and notes receivable (net of allowance for doubtful accounts of $19 and $21, respectively), ($221 and $341 pledged as collateral, respectively)(a)

940

1,165

Accounts receivable from affiliates

410

399

Inventories(a)

914

1,000

Prepaid expenses

82

57

Other current assets(a)

79

147

Current assets held for sale

1,208

232

Total current assets

4,158

3,340

Property, plant and equipment, net(a)

2,383

2,353

Investment in unconsolidated affiliates

535

526

Intangible assets, net(a)

197

213

Goodwill

276

275

Deferred income taxes

292

324

Notes receivable from affiliate

34

34

Operating lease right-of-use assets

396

Other noncurrent assets(a)

452

393

Noncurrent assets held for sale

-

877

Total assets

$

8,723

$

8,335


LIABILITIES AND EQUITY

Current liabilities:

Accounts payable(a)

$

765

$

761

Accounts payable to affiliates

143

104

Accrued liabilities(a)

417

494

Notes payable to affiliates

100

100

Current portion of debt(a)

212

96

Current operating lease liabilities(a)

42

Current liabilities held for sale

512

225

Total current liabilities

2,191

1,780

Long-term debt(a)

2,177

2,224

Notes payable to affiliates

280

488

Deferred income taxes

29

135

Noncurrent operating lease liabilities(a)

384

Other noncurrent liabilities(a)

890

937

Noncurrent liabilities held for sale

-

283

Total liabilities

5,951

5,847

Commitments and contingencies (Notes 21 and 22)

Equity

Huntsman International LLC members’ equity:

Members’ equity, 2,728 units issued and outstanding

3,675

3,658

Retained earnings (accumulated deficit)

312

(91)

Accumulated other comprehensive loss

(1,352)

(1,308)

Total Huntsman International LLC members’ equity

2,635

2,259

Noncontrolling interests in subsidiaries

137

229

Total equity

2,772

2,488

Total liabilities and equity

$

8,723

$

8,335

(a)At December 31, 2019 and December 31, 2018, respectively, nil and $7 of cash and cash equivalents, $13 and $30 of accounts and notes receivable (net), $35 and $49 of inventories, nil and $5 of other current assets, $180 and $265 of property, plant and equipment (net), nil and $10 of intangible assets (net), $20 and $52 of other noncurrent assets, $100 and $123 of accounts payable, $10 and $30 of accrued liabilities, $36 and $25 of current portion of debt, $4 and nil of current operating lease liabilities, $29 and $61 of long-term debt, $11 and nil of noncurrent operating lease liabilities and $87 and $97 of other noncurrent liabilities from consolidated variable interest entities are included in the respective Balance Sheet captions above. See “Note 8. Variable Interest Entities.”

See accompanying notes to consolidated financial statements.

F-11

Table of Contents

HUNTSMAN INTERNATIONAL LLC AND SUBSIDIARIES

CONSOLIDATED STATEMENTS OF OPERATIONS

(In Millions)

Year ended December 31, 


2019

2018

2017

Revenues:

Trade sales, services and fees, net

$

6,664

$

7,451

$

6,684

Related party sales

133

153

161

Total revenues

6,797

7,604

6,845

Cost of goods sold

5,415

5,837

5,188

Gross profit

1,382

1,767

1,657

Operating expenses:

Selling, general and administrative

781

784

754

Research and development

137

145

132

Restructuring, impairment and plant closing (credits) costs

(41)

(7)

19

Merger costs

2

28

Other operating expense (income), net

31

8

(16)

Total operating expenses

908

932

917

Operating income

474

835

740

Interest expense

(126)

(136)

(181)

Equity in income of investment in unconsolidated affiliates

54

55

13

Fair value adjustments to Venator investment

(18)

(62)

Loss on early extinguishment of debt

(23)

(3)

(54)

Other income, net

16

27

6

Income from continuing operations before income taxes

377

716

524

Income tax benefit (expense)

41

(41)

(17)

Income from continuing operations

418

675

507

Income (loss) from discontinued operations, net of tax

169

(39)

227

Net income

587

636

734

Net income attributable to noncontrolling interests

(36)

(313)

(105)

Net income attributable to Huntsman International LLC

$

551

$

323

$

629

See accompanying notes to consolidated financial statements.

F-12

Table of Contents

HUNTSMAN INTERNATIONAL LLC AND SUBSIDIARIES

CONSOLIDATED STATEMENTS OF COMPREHENSIVE INCOME

(In Millions)

Year ended December 31, 

2019


2018


2017

Net income

$

587

$

636

$

734

Other comprehensive (loss) income, net of tax:

Foreign currency translations adjustment

2

(194)

210

Pension and other postretirement benefits adjustments

(35)

(37)

112

Other, net

(1)

(6)

(1)

Other comprehensive (loss) income, net of tax

(34)

(237)

321

Comprehensive income

553

399

1,055

Comprehensive income attributable to noncontrolling interests

(31)

(266)

(127)

Comprehensive income attributable to Huntsman International LLC

$

522

$

133

$

928

See accompanying notes to consolidated financial statements.

F-13

Table of Contents

HUNTSMAN INTERNATIONAL LLC AND SUBSIDIARIES

CONSOLIDATED STATEMENTS OF EQUITY

(In Millions, Except Unit Amounts)

Huntsman International LLC Members

(Accumulated

Accumulated

deficit)

other

Noncontrolling

Members’ equity

retained

comprehensive

interests in

Total


Units


Amount


earnings


loss


subsidiaries


equity

Beginning balance, January 1, 2017


2,728


$

3,226


$

(779)


$

(1,691)


$

180


$

936

Net income


629


105


734

Other comprehensive income


428


(107)


321

Dividends paid to parent


(120)


(120)

Contribution from parent


35


35

Dividends paid to noncontrolling interests


(34)


(34)

Contribution from noncontrolling interests


5


5

Disposition of a portion of Venator

413

413

Costs of the IPO and secondary offering of Venator


(58)


(58)

Noncontrolling interest from partial disposal of Venator


602

602

Balance, December 31, 2017


2,728

3,616

(270)

(1,263)

751

2,834

Cumulative effect of changes in fair value of equity investments


10


(10)


Net income


323


313


636

Other comprehensive income


(195)


(42)


(237)

Dividends paid to parent


(154)


(154)

Contribution from parent


26


26

Dividends paid to noncontrolling interests


(69)


(69)

Disposition of a portion of Venator


18


18

Costs of secondary offering of Venator


(2)


(2)

Noncontrolling interest from partial disposal of Venator


27


27

Deconsolidation of Venator


160


(751)


(591)

Balance, December 31, 2018

2,728


3,658


(91)


(1,308)


229


2,488

Net income


551


36


587

Other comprehensive income


(44)


10


(34)

Dividends paid to parent


(148)


(148)

Contribution from parent


28


28

Dividends declared to noncontrolling interests


(65)


(65)

Acquisition of noncontrolling interests, net of tax


(11)


(73)


(84)

Balance, December 31, 2019


2,728

$

3,675

$

312

$

(1,352)

$

137

$

2,772

See accompanying notes to consolidated financial statements.

F-14

Table of Contents

HUNTSMAN INTERNATIONAL LLC AND SUBSIDIARIES

CONSOLIDATED STATEMENTS OF CASH FLOWS

(In Millions)

Year ended December 31, 


2019


2018


2017

Operating Activities:

Net income

$

587

$

636

$

734

Less: (Income) loss from discontinued operations, net of tax

(169)

39

(227)

Income from continuing operations

418

675

507

Adjustments to reconcile income from continuing operations to net cash provided by operating activities from continuing operations:

Equity in income of investment in unconsolidated affiliates

(54)

(55)

(13)

Unrealized gains on fair value adjustments to Venator investment

19

62

Cash received from return on investment in unconsolidated subsidiary

24

Depreciation and amortization

270

252

228

Noncash lease expense

55

(Gain) loss on disposal of businesses/assets, net

(49)

3

(8)

Loss on early extinguishment of debt

23

3

54

Noncash interest expense

18

22

25

Noncash restructuring and impairment charges (credits)

3

(22)

1

Deferred income taxes

(91)

(172)

(90)

Noncash loss (gain) on foreign currency transactions

8

(3)

(5)

Noncash compensation

28

26

35

Other, net

10

7

7

Changes in operating assets and liabilities:

Accounts and notes receivable

138

(23)

(159)

Inventories

77

(80)

(88)

Prepaid expenses

(27)

(8)

(10)

Other current assets

48

59

20

Other noncurrent assets

(90)

(41)

(46)

Accounts payable

7

(9)

111

Accrued liabilities

(51)

44

48

Other noncurrent liabilities

(139)

(53)

49

Net cash provided by operating activities from continuing operations

645

687

666

Net cash provided by operating activities from discontinued operations

241

503

542

Net cash provided by operating activities

886

1,190

1,208

Investing Activities:

Capital expenditures

(274)

(251)

(234)

Proceeds from sale of businesses/assets

50

25

Acquisition of a business, net of cash acquired

(366)

(14)

Increase in receivable from affiliate

(1)

(16)

(15)

Cash received from termination of cross-country interest rate contacts

7

Cash received from forward swap contract related to the sale of investment in Venator

16

3

Other, net

7

Net cash used in investing activities from continuing operations

(202)

(630)

(231)

Net cash used in investing activities from discontinued operations

(59)

(358)

(207)

Net cash used in investing activities

(261)

(988)

(438)

(continued)

F-15

Table of Contents

HUNTSMAN INTERNATIONAL LLC AND SUBSIDIARIES

CONSOLIDATED STATEMENTS OF CASH FLOWS (Continued)

(In Millions)

Year ended December 31, 


2019


2018


2017

Financing Activities:

Net (repayments) borrowings on revolving loan facilities

$

(89)

$

125

$

(41)

Net borrowings (repayments) on overdraft facilities

(1)

1

Repayments of long-term debt

(676)

(68)

(2,058)

Proceeds from issuance of long-term debt

742

24

Proceeds from long-term debt of Venator

750

Repayments of short-term debt

(8)

(15)

Borrowings on short-term debt

102

6

8

Repayments of notes payable to affiliate

(207)

(255)

Proceeds from issuance of notes payable to affiliate

47

Repayments of notes payable

(27)

(29)

(27)

Borrowings on notes payable

37

27

31

Debt issuance costs paid

(8)

(4)

(21)

Costs of early extinguishment of debt

(21)

Dividends paid to parent

(148)

(154)

(120)

Dividends paid to noncontrolling interests

(41)

(69)

(34)

Cash paid for noncontrolling interest

(101)

Contribution from noncontrolling interests

5

Proceeds from the IPO of Venator

1,012

Cash paid for expenses for the IPO of Venator

(58)

Proceeds from the secondary offering of Venator

44

Cash paid for expenses of the secondary offering of Venator

(2)

Other

(1)

(2)

1

Net cash used in financing activities

(438)

(390)

(495)

Effect of exchange rate changes on cash

(2)

(35)

18

Increase in cash, cash equivalents and restricted cash

185

(223)

293

Cash, cash equivalents and restricted cash from continuing operations at beginning of period

340

479

395

Cash, cash equivalents and restricted cash from discontinued operations at beginning of period

238

29

Deconsolidation of cash, cash equivalents and restricted cash of Venator

(154)

Cash, cash equivalents and restricted cash at end of period

$

525

$

340

$

717

Supplemental cash flow information:

Cash paid for interest

$

111

$

163

$

175

Cash paid for income taxes

100

179

25

As of December 31, 2019, 2018 and 2017 the amount of capital expenditures in accounts payable was $64 million, $66 million and $51 million, respectively. During the years ended 2019, 2018 and 2017, Huntsman Corporation contributed $28 million, $26 million and $35 million, respectively, related to stock-based compensation for continuing operations. In addition, as of December 31, 2018, the amount of cash interest and cash income taxes included in our supplemental cash flow information related to cash paid for interest and cash paid for income taxes that was paid by Venator was $46 million and $38 million, respectively. As of December 31, 2017, the amount of cash interest and cash income taxes included in our supplemental cash flow information related to cash paid for interest and cash paid for income taxes that was paid by Venator after the IPO date was $6 million and $16 million, respectively.

See accompanying notes to consolidated financial statements.

F-16

Table of Contents

HUNTSMAN CORPORATION AND SUBSIDIARIES
HUNTSMAN INTERNATIONAL LLC AND SUBSIDIARIES
NOTES TO CONSOLIDATED FINANCIAL STATEMENTS

1. GENERAL

Definitions

For convenience in this report, the terms “Company,” “our” or “we” may be used to refer to Huntsman Corporation and, unless the context otherwise requires, its subsidiaries and predecessors. Any references to the “Company” “we” “us” or “our” as of a date prior to October 19, 2004 (the date of our Company’s formation) are to Huntsman Holdings, LLC and its subsidiaries (including their respective predecessors). In this report, “Huntsman International” refers to Huntsman International LLC (our wholly-owned subsidiary) and, unless the context otherwise requires, its subsidiaries; “AAC” refers to Arabian Amines Company, our consolidated manufacturing joint venture with the Zamil Group; “HPS” refers to Huntsman Polyurethanes Shanghai Ltd. (our consolidated splitting joint venture with Shanghai Chlor-Alkali Chemical Company, Ltd); and “SLIC” refers to Shanghai Liengheng Isocyanate Company (our unconsolidated manufacturing joint venture with BASF and three Chinese chemical companies).

In this report, we may use, without definition, the common names of competitors or other industry participants. We may also use the common names or abbreviations for certain chemicals or products.

Description of Business

We are a global manufacturer of differentiated organic chemical products. We operate in four segments: Polyurethanes, Performance Products, Advanced Materials and Textile Effects. Our products comprise a broad range of chemicals and formulations, which we market globally to a diversified group of consumer and industrial customers. Our products are used in a wide range of applications, including those in the adhesives, aerospace, automotive, construction products, personal care and hygiene, durable and non-durable consumer products, digital inks, electronics, insulation, medical, packaging, coatings and construction, power generation, refining, synthetic fiber, textile chemicals and dye industries. We are a leading global producer in many of our key product lines, including MDI, amines, maleic anhydride, epoxy-based polymer formulations, textile chemicals and dyes.

Company

Our Company, a Delaware corporation, was formed in 2004 to hold the Huntsman businesses, which were founded by Jon M. Huntsman. Mr. Huntsman founded the predecessor to our Company in 1970 as a small polystyrene plastics packaging company. Since then, we have grown through a series of acquisitions and now own a global portfolio of businesses.

Currently, we operate all of our businesses through Huntsman International, our wholly-owned subsidiary. Huntsman International is a Delaware limited liability company and was formed in 1999.

Recent Developments

Sale of Chemical Intermediates Businesses

On January 3, 2020, we completed the sale of our Chemical Intermediates Businesses to Indorama in a transaction valued at approximately $2 billion, comprising a cash purchase price of approximately $1.93 billion, which includes estimated adjustments to the purchase price for working capital, plus the transfer of approximately $72 million in net underfunded pension and other post-employment benefit liabilities. The final purchase price is subject to customary post-closing adjustments. The net after tax cash proceeds are expected to be approximately $1.6 billion. For more information, see “Note 4. Discontinued Operations and Business Dispositions—Sale of Chemical Intermediates Businesses.”

Icynene-Lapolla Acquisition

On December 5, 2019, we entered into an agreement with an affiliate of FFL Partners, LLC to acquire Icynene-Lapolla, a leading North American manufacturer and distributor of spray polyurethane foam insulation systems for residential and commercial applications. Icynene-Lapolla operates two manufacturing facilities located in Houston,

F-17

Table of Contents

HUNTSMAN CORPORATION AND SUBSIDIARIES
HUNTSMAN INTERNATIONAL LLC AND SUBSIDIARIES
NOTES TO CONSOLIDATED FINANCIAL STATEMENTS
(Continued)

Texas and Mississauga, Ontario. Under terms of the agreement, we agreed to pay $350 million, subject to customary closing adjustments, in an all-cash transaction to be funded from available liquidity. The transaction is expected to close in the first quarter of 2020. The acquired business is expected to be integrated into our Polyurethanes segment.

Acquisition of Remaining Interest in Sasol-Huntsman Joint Venture

On September 30, 2019, we acquired from Sasol, our former joint venture partner, the 50% noncontrolling interest that we did not own in the Sasol-Huntsman maleic anhydride joint venture. The joint venture owned a manufacturing facility in Moers, Germany with capacity to produce 230 million pounds of maleic anhydride. We paid Sasol $101 million, which included acquired cash, net of any debt. The purchase price was funded from the 2019 Term Loan.”

Huntsman Corporation and Huntsman International Financial Statements

Except where otherwise indicated, these notes relate to the consolidated financial statements for both our Company and Huntsman International. The differences between our consolidated financial statements and Huntsman International’s consolidated financial statements relate primarily to the following:

purchase accounting recorded at our Company for the 2003 step-acquisition of Huntsman International Holdings LLC, the former parent company of Huntsman International that was merged into Huntsman International in 2005;
the different capital structures; and
a note payable from Huntsman International to us.

2. SUMMARY OF SIGNIFICANT ACCOUNTING POLICIES

Carrying Value of Long-Lived Assets

We review long-lived assets and all amortizable intangible assets for impairment whenever events or changes in circumstances indicate that the carrying amount of these assets may not be recoverable. Recoverability is based upon current and anticipated undiscounted cash flows, and we recognize an impairment when such estimated cash flows are less than the carrying value of the asset. Measurement of the amount of impairment, if any, is based upon the difference between carrying value and fair value. Fair value is generally estimated by discounting estimated future cash flows using a discount rate commensurate with the risks involved or selling price of assets held for sale.

Cash and Cash Equivalents

We consider cash in checking accounts and cash in short-term highly liquid investments with remaining maturities of three months or less at the date of purchase, to be cash and cash equivalents.

Cost of Goods Sold

We classify the costs of manufacturing and distributing our products as cost of goods sold. Manufacturing costs include variable costs, primarily raw materials and energy, and fixed expenses directly associated with production. Manufacturing costs also include, among other things, plant site operating costs and overhead (including depreciation), production planning and logistics costs, repair and maintenance costs, plant site purchasing costs, and engineering and technical support costs. Distribution, freight and warehousing costs are also included in cost of goods sold.

Derivatives and Hedging Activities

All derivatives, whether designated in hedging relationships or not, are recorded on our balance sheet at fair value. If the derivative is designated as a fair value hedge, the changes in the fair value of the derivative and the hedged

F-18

Table of Contents

HUNTSMAN CORPORATION AND SUBSIDIARIES
HUNTSMAN INTERNATIONAL LLC AND SUBSIDIARIES
NOTES TO CONSOLIDATED FINANCIAL STATEMENTS
(Continued)

items are recognized in earnings. If the derivative is designated as a cash flow hedge, changes in the fair value of the derivative are recorded in accumulated other comprehensive loss, to the extent effective, and will be recognized in the income statement when the hedged item affects earnings. Changes in the fair value of the hedge in the net investment of certain international operations are recorded in other comprehensive income (loss), to the extent effective. The effectiveness of a cash flow hedging relationship is established at the inception of the hedge, and after inception we perform effectiveness assessments at least every three months. A derivative designated as a cash flow hedge is determined to be effective if the change in value of the hedge divided by the change in value of the hedged item is within a range of 80% to 125%. Hedge ineffectiveness in a cash flow hedge occurs only if the cumulative gain or loss on the derivative hedging instrument exceeds the cumulative change in the expected future cash flows on the hedged transaction. For a derivative that does not qualify or has not been designated as a hedge, changes in fair value are recognized in earnings.

Environmental Expenditures

Environmental related restoration and remediation costs are recorded as liabilities when site restoration and environmental remediation and clean-up obligations are either known or considered probable and the related costs can be reasonably estimated. Other environmental expenditures that are principally maintenance or preventative in nature are recorded when expended and incurred and are expensed or capitalized as appropriate. See “Note 22. Environmental, Health and Safety Matters.”

Equity Method Investments

We account for our equity investments where we own a non-controlling interest, but exercise significant influence, under the equity method of accounting. Under the equity method of accounting, our original cost of the investment is adjusted for our share of equity in the earnings of the equity investee and reduced by dividends and distributions of capital received, unless the fair value option is elected, in which case the investment balance is marked to fair value each reporting period and the impact of changes in fair value of the equity investment are reported in earnings. We elected the fair value option to account for our equity method investment in Venator. For more information, see “Note 4. Discontinued Operations and Business Dispositions—Separation and Deconsolidation of Venator.” The change in the fair value related to our equity method investment in Venator is presented in “Fair value adjustments to Venator investment” on the consolidated statements of operations.

Foreign Currency Translation

The accounts of our operating subsidiaries outside of the U.S., unless they are operating in highly inflationary economic environments, consider the functional currency to be the currency of the economic environment in which they operate. Accordingly, assets and liabilities are translated at rates prevailing at the balance sheet date. Revenues, expenses, gains and losses are translated at a weighted average rate for the period. Cumulative translation adjustments are recorded to equity as a component of accumulated other comprehensive loss.

If a subsidiary operates in an economic environment that is considered to be highly inflationary (100% cumulative inflation over a three-year period), the U.S. dollar is considered to be the functional currency and gains and losses from remeasurement to the U.S. dollar from the local currency are included in the statement of operations. Where a subsidiary’s operations are effectively run, managed, financed and contracted in U.S. dollars, such as certain finance subsidiaries outside of the U.S., the U.S. dollar is considered to be the functional currency.

Foreign currency transaction gains and losses are recorded in other operating expense (income), net in our consolidated statements of operations and were (losses) gains of $(8) million, $3 million and $5 million for the years ended December 31, 2019, 2018 and 2017, respectively.

Income Taxes

We use the asset and liability method of accounting for income taxes. Deferred income taxes reflect the net tax effects of temporary differences between the carrying amounts of assets and liabilities for financial and tax reporting

F-19

Table of Contents

HUNTSMAN CORPORATION AND SUBSIDIARIES
HUNTSMAN INTERNATIONAL LLC AND SUBSIDIARIES
NOTES TO CONSOLIDATED FINANCIAL STATEMENTS
(Continued)

purposes. We evaluate deferred tax assets to determine whether it is more likely than not that they will be realized. Valuation allowances are reviewed on a tax jurisdiction basis to analyze whether there is sufficient positive or negative evidence to support a change in judgment about the realizability of the related deferred tax assets for each jurisdiction. These conclusions require significant judgment. In evaluating the objective evidence that historical results provide, we consider the cyclicality of businesses and cumulative income or losses during the applicable period. Cumulative losses incurred over the period limits our ability to consider other subjective evidence such as our projections for the future. Changes in expected future income in applicable jurisdictions could affect the realization of deferred tax assets in those jurisdictions.

On December 22, 2017, the U.S. Tax Reform Act was signed into law. The U.S. Tax Reform Act significantly revised the U.S. corporate income tax regime by, among other things, lowering the U.S. corporate tax rate from 35% to 21%, (effective January 1, 2018), creation of the base erosion anti-abuse tax provision (“BEAT”) and a new provision designed to tax global intangible low-taxed income (“GILTI”) (effective January 1, 2018) and imposing a repatriation tax on deemed repatriated earnings of foreign subsidiaries.

As a result of the enactment of the U.S. Tax Reform Act, the Company recorded a net tax benefit of $20 million over 2017 and 2018. We recorded a net tax benefit of $135 million due to a remeasurement of deferred U.S. tax assets and liabilities (including a provisional tax benefit of $137 million in 2017, partially offset by a final tax expense of $2 million in 2018) offset by tax expense of $115 million due to the transition tax on the deemed repatriation of deferred foreign income (including a provisional tax expense of $85 million in 2017 and a $30 million measurement period adjustment in 2018). We did not make the election to reclassify the income tax effects of the U.S. Tax Reform Act from accumulated other comprehensive income to retained earnings.

Accounting for uncertainty in income taxes prescribes a recognition threshold and measurement attribute for the financial statement recognition and measurement of a tax position taken or expected to be taken in a tax return. The application of income tax law is inherently complex. We are required to determine if an income tax position meets the criteria of more-likely-than-not to be realized based on the merits of the position under tax law, in order to recognize an income tax benefit. This requires us to make significant judgments regarding the merits of income tax positions and the application of income tax law. Additionally, if a tax position meets the recognition criteria of more-likely-than-not we are required to make judgments and apply assumptions to measure the amount of the tax benefits to recognize. These judgments are based on the probability of the amount of tax benefits that would be realized if the tax position was challenged by the taxing authorities. Interpretations and guidance surrounding income tax laws and regulations change over time. As a consequence, changes in assumptions and judgments can materially affect amounts recognized in our consolidated financial statements. For further information concerning taxes, see “Note 20. Income Taxes.”

Intangible Assets and Goodwill

Intangible assets are stated at cost (fair value at the time of acquisition) and are amortized using the straight-line method over the estimated useful lives or the life of the related agreement as follows:

Patents and technology

5 - 30 years

Trademarks

9 - 30 years

Licenses and other agreements

5 - 15 years

Other intangibles

5 - 15 years

Goodwill represents costs in excess of fair values assigned to the underlying net assets of acquired businesses. Goodwill is not subject to any method of amortization, but is tested for impairment annually (at the beginning of the third quarter) and when events and circumstances change that would more likely than not reduce the fair value of a reporting unit below its carrying amount. When the fair value is less than the carrying value of the related reporting unit, we are required to reduce the amount of goodwill through a charge to earnings. Fair value is estimated using the market approach, as well as the income approach based on discounted cash flow projections. Goodwill has been assigned to reporting units for purposes of impairment testing.

F-20

Table of Contents

HUNTSMAN CORPORATION AND SUBSIDIARIES
HUNTSMAN INTERNATIONAL LLC AND SUBSIDIARIES
NOTES TO CONSOLIDATED FINANCIAL STATEMENTS
(Continued)

During 2019, goodwill decreased by approximately $2 million due to the finalization of the valuation of the assets and liabilities of an acquisition, partially offset by a net increase of approximately $1 million due to changes in foreign currency exchange rates. See “Note 3. Business Combinations and Acquisitions.”

Inventories

Inventories are stated at the lower of cost or market, with cost determined using LIFO, first-in first-out, and average costs methods for different components of inventory.

Legal Costs

We expense legal costs, including those legal costs incurred in connection with a loss contingency, as incurred.

Net Income Per Share Attributable to Huntsman Corporation

Basic income per share excludes dilution and is computed by dividing net income attributable to Huntsman Corporation common stockholders by the weighted average number of shares outstanding during the period. Diluted income per share reflects all potential dilutive common shares outstanding during the period and is computed by dividing net income available to Huntsman Corporation common stockholders by the weighted average number of shares outstanding during the period increased by the number of additional shares that would have been outstanding as dilutive securities.

Basic and diluted income per share is determined using the following information (in millions):

Year ended December 31, 


2019


2018


2017

Numerator:

Basic and diluted income from continuing operations:

Income from continuing operations attributable to Huntsman Corporation

$

393

$

608

$

406

Basic and diluted net income:

Net income attributable to Huntsman Corporation


$

562

$

337

$

636

Denominator:

Weighted average shares outstanding

228.9

238.1

238.4

Dilutive shares:

Stock-based awards

1.7

3.5

5.5

Total weighted average shares outstanding, including dilutive shares

230.6

241.6

243.9

Additional stock-based awards of 3.0 million, 0.8 million and 0.8 million weighted average equivalent shares of stock were outstanding during the years ended December 31, 2019, 2018 and 2017, respectively. However, these stock-based awards were not included in the computation of diluted earnings per share for the respective periods mentioned because the effect would be anti-dilutive.

Other Noncurrent Assets

Periodic maintenance and repairs applicable to major units of manufacturing facilities (a “turnaround”) are accounted for on the deferral basis by capitalizing the costs of the turnaround and amortizing the costs over the estimated period until the next turnaround.

Principles of Consolidation

Our consolidated financial statements include the accounts of our wholly owned and majority owned subsidiaries and any variable interest entities for which we are the primary beneficiary. All intercompany accounts and transactions have been eliminated.

F-21

Table of Contents

HUNTSMAN CORPORATION AND SUBSIDIARIES
HUNTSMAN INTERNATIONAL LLC AND SUBSIDIARIES
NOTES TO CONSOLIDATED FINANCIAL STATEMENTS
(Continued)

Property, Plant and Equipment

Property, plant and equipment is stated at cost less accumulated depreciation. Depreciation is computed using the straight-line method over the estimated useful lives or lease term as follows:

Buildings and equipment

5 - 50 years

Plant and equipment

3 - 30 years

Furniture, fixtures and leasehold improvements

5 - 20 years

Interest expense capitalized as part of plant and equipment was $4 million, $4 million and $9 million for the years ended December 31, 2019, 2018 and 2017, respectively.

Normal maintenance and repairs of plant and equipment are charged to expense as incurred. Renewals, betterments and major repairs that materially extend the useful life of the assets are capitalized, and the assets replaced, if any, are retired.

Reclassifications

Certain amounts in the consolidated financial statements for prior periods have been reclassified to conform with the current presentation. These reclassifications were to record the assets and liabilities of our Chemical Intermediates Businesses as held for sale and its results of operations as discontinued operations. See “Note 1. General—Recent Developments—Sale of Chemical Intermediates Businesses” as well as “Note 4. Discontinued Operations and Business Dispositions—Sale of Chemical Intermediates Businesses.”

Revenue Recognition

We generate substantially all of our revenue through product sales in which revenue is recognized at a point in time. We recognize revenue when control of the promised goods is transferred to our customers. Control of goods usually passes to the customer at the time shipment is made. Revenue is measured as the amount that reflects the consideration that we expect to be entitled to in exchange for those goods. See “Note 18. Revenue Recognition.”

Securitization of Accounts Receivable

Under our A/R Programs, we grant an undivided interest in certain of our trade receivables to the special purpose entities (“SPE”) in the U.S. and EU. This undivided interest serves as security for the issuance of debt. The A/R Programs provide for financing in both U.S. dollars and euros. The amounts outstanding under our A/R Programs are accounted for as secured borrowings. See “Note 15. Debt—Direct and Subsidiary Debt—A/R Programs.”

Stock-Based Compensation

We measure the cost of employee services received in exchange for an award of equity instruments based on the grant-date fair value of the award. That cost, net of estimated forfeitures, will be recognized over the period during which the employee is required to provide services in exchange for the award. See “Note 24. Stock-Based Compensation Plan.”

Use of Estimates

The preparation of financial statements in conformity with GAAP requires management to make estimates and assumptions that affect the reported amounts of assets and liabilities and disclosure of contingent assets and liabilities at the date of the financial statements and the reported amounts of revenues and expenses during the reporting period. Actual results could differ from those estimates.

Accounting Pronouncements Adopted During 2019

In February 2016, the Financial Accounting Standards Board (“FASB”) issued Accounting Standards Update (“ASU”) No. 2016-02, Leases (Topic 842). The amendments in this ASU increase transparency and comparability

F-22

Table of Contents

HUNTSMAN CORPORATION AND SUBSIDIARIES
HUNTSMAN INTERNATIONAL LLC AND SUBSIDIARIES
NOTES TO CONSOLIDATED FINANCIAL STATEMENTS
(Continued)

among entities by recognizing lease assets and lease liabilities on the balance sheet and disclosing key information about leasing arrangements. The amendments in this ASU require lessees to recognize in the statement of financial position a liability to make lease payments (the lease liability) and a right-of-use asset representing its right to use the underlying asset for the lease term. In January 2018, the FASB issued ASU No. 2018-01, Leases (Topic 842): Land Easement Practical Expedient for Transition to Topic 842, providing an optional transition practical expedient to not evaluate under Topic 842 existing or expired land easements that were not previously accounted for as leases under the current leases guidance in Topic 840, and in July 2018, the FASB issued ASU No. 2018-11, Leases (Topic 842): Targeted Improvements, providing an optional transition method allowing entities to initially apply the new lease standard at the adoption date and recognize a cumulative-effect adjustment to the opening balance of retained earnings in the period of adoption. The amendments in these ASUs are effective for fiscal years, and interim periods within those fiscal years, beginning after December 15, 2018. Reporting entities can elect to recognize and measure leases under these amendments at the beginning of the earliest period presented using a modified retrospective approach or otherwise elect the transition method provided under ASU No. 2018-11. On January 1, 2019, we adopted the amendments in these ASUs using the transition method that allowed us to initially apply the new lease standard at the adoption date. The initial adoption of the new lease standard had a material impact on our consolidated balance sheets, but did not have an impact on our consolidated statements of operations. The most significant impact was the recognition of operating lease liabilities and operating lease right-of-use assets. On January 1, 2019, we recognized operating lease liabilities of $400 million and operating lease right-of-use assets of $371 million. As a result of the adoption of these amendments, we revised our accounting policy for leases as detailed in “Note 9. Leases.”

In August 2017, the FASB issued ASU No. 2017-12, Derivatives and Hedging (Topic 815): Targeted Improvements to Accounting for Hedging Activities. The amendments in this ASU better align an entity’s risk management activities and financial reporting for hedging relationships through changes to both the designation and measurement guidance for qualifying hedging relationships as well as the recognition and presentation of the effects of the hedging instrument and the hedged item in the financial statements to increase the understandability of the results of an entity’s intended hedging strategies. The amendments in this ASU also include certain targeted improvements to ease the application of current guidance related to the assessment of hedge effectiveness. The amendments in this ASU are effective for fiscal years beginning after December 15, 2018, including interim periods within those fiscal years. Transition requirements and elections should be applied to hedging relationships existing on the date of adoption. For cash flow and net investment hedges, an entity should apply a cumulative-effect adjustment related to eliminating the separate measurement of ineffectiveness, and the amended presentation and disclosure guidance is required only prospectively. We adopted the amendments in this ASU effective January 1, 2019, and the initial adoption of this ASU did not have a significant impact on our consolidated financial statements.

In August 2018, the SEC issued a final rule, SEC Final Rule Release No. 33-10532, Disclosure Update and Simplification, that amends certain of its disclosure requirements that have become redundant, duplicative, overlapping, outdated or superseded, in light of other SEC disclosure requirements or U.S. GAAP. For filings on Form 10-Q, the final rule, amongst other items, extends to interim periods the annual requirement to disclose changes in stockholders’ equity. As amended by the final rule, registrants must now analyze changes in stockholders’ equity, in the form of a reconciliation, for the then current and comparative year-to-date interim periods, with subtotals for each interim period. The final rule became effective on November 5, 2018, that date being 30 days after its publication in the Federal Register. We applied these changes in the presentation of stockholders’ equity beginning in the first quarter of 2019.

Accounting Pronouncements Pending Adoption in Future Periods

In August 2018, the FASB issued ASU No. 2018-14, Compensation—Retirement Benefits—Defined Benefit Plans—General (Topic 820): Disclosure Framework—Changes to the Disclosure Requirements for Defined Benefit Plans. The amendments in this ASU modify certain disclosure requirements for employers that sponsor defined benefit pension or other postretirement plans by removing disclosures that no longer are considered cost beneficial, clarifying the specific requirements of disclosures and adding disclosure requirements identified as relevant. The amendments in this ASU are effective for fiscal years ending after December 15, 2020 and should be applied on a retrospective basis to all periods presented. Early adoption is permitted. We do not expect the adoption of the amendments in this ASU to have a significant impact on our consolidated financial statements.

F-23

Table of Contents

HUNTSMAN CORPORATION AND SUBSIDIARIES
HUNTSMAN INTERNATIONAL LLC AND SUBSIDIARIES
NOTES TO CONSOLIDATED FINANCIAL STATEMENTS
(Continued)

In August 2018, the FASB issued ASU No. 2018-15, Intangibles—Goodwill and Other—Internal-Use Software (Subtopic 350-40): Customer’s Accounting for Implementation Costs Incurred in a Cloud Computing Arrangement That Is a Service Contract. The amendments in this ASU align the requirements for capitalizing implementation costs incurred in a hosting arrangement that is a service contract with the requirements for capitalizing implementation costs incurred to develop or obtain internal-use software (and hosting arrangements that include an internal-use software license). The amendments in this ASU are effective for fiscal years beginning after December 15, 2019, including interim periods within those fiscal years. Early adoption is permitted in any interim period after the issuance of this ASU. We do not expect the adoption of the amendments in this ASU to have a significant impact on our consolidated financial statements.

3. BUSINESS COMBINATIONS AND ACQUISITIONS

Acquisition of Remaining Interest in Sasol-Huntsman Joint Venture

On September 30, 2019, we acquired from Sasol, our former joint venture partner, the 50% noncontrolling interest that we did not own in the Sasol-Huntsman maleic anhydride joint venture. We paid Sasol $101 million, which included acquired cash, net of any debt. The purchase price was funded from the 2019 Term Loan. See “Note 15. Debt—Direct and Subsidiary Debt—Term Loan Credit Facility.” In connection with this acquisition, we recorded an adjustment to additional paid-in capital, net of tax, of $11 million. Prior to acquiring the 50% noncontrolling interest that we did not own, we accounted for Sasol-Huntsman as a variable interest entity. See “Note 8. Variable Interest Entities.”

The effects of changes in our ownership interest in Sasol-Huntsman on the equity attributable to Huntsman Corporation and Huntsman International are as follows (dollars in millions):

Year ended December 31, 

2019

2018

2017

Net income attributable to Huntsman Corporation shareholders

$

562

$

337

$

636

Decrease in Huntsman Corporation’s paid-in capital for purchase of 50% interest in Sasol-Huntsman

(11)

Net transfers to noncontrolling interest

(11)

Change from net income attributable to Huntsman Corporation shareholders and transfers to noncontrolling interest

$

551

$

337

$

636

Year ended December 31, 

2019

2018

2017

Net income attributable to Huntsman International shareholders

$

551

$

323

$

629

Decrease in Huntsman International’s paid-in capital for purchase of 50% interest in Sasol-Huntsman

(11)

Net transfers to noncontrolling interest

(11)

Change from net income attributable to Huntsman International shareholders and transfers to noncontrolling interest

$

540

$

323

$

629

Acquisition of Demilec

On April 23, 2018, we acquired 100% of the outstanding equity interests of Demilec for approximately $353 million, including working capital adjustments, in an all-cash transaction, which was funded from our Prior Credit Facility and our U.S. A/R Program. Demilec is a leading North American manufacturer and distributor of spray polyurethane foam formulations for residential and commercial applications. The acquired business was integrated into our Polyurethanes segment. Transaction costs charged to expense related to this acquisition were approximately $5 million in 2018 and were recorded in other operating expense (income), net in our consolidated statements of operations.

F-24

Table of Contents

HUNTSMAN CORPORATION AND SUBSIDIARIES
HUNTSMAN INTERNATIONAL LLC AND SUBSIDIARIES
NOTES TO CONSOLIDATED FINANCIAL STATEMENTS
(Continued)

The Demilec Acquisition was aligned with our stated strategy to grow our downstream polyurethanes business and leverage our global platform to expand Demilec’s portfolio of spray polyurethane foam formulations into international markets.

We have accounted for the Demilec Acquisition using the acquisition method. As such, we determined the fair value of tangible and intangible assets acquired and liabilities assumed. The allocation of acquisition cost to the assets acquired and liabilities assumed is summarized as follows (dollars in millions):

Fair value of assets acquired and liabilities assumed:

Cash paid for the Demilec Acquisition in Q2 2018

$

357

Purchase price adjustment received in Q3 2018

(4)

Net acquisition cost

$

353

Cash

$

1

Accounts receivable

31

Inventories

23

Prepaid expenses and other current assets

1

Property, plant and equipment, net

21

Intangible assets

177

Goodwill

140

Accounts payable

(16)

Accrued liabilities

(3)

Deferred income taxes

(22)

Other noncurrent liabilities

Total fair value of net assets acquired

$

353

As a result of a preliminary valuation of the assets and liabilities, reallocations were made during 2018 in certain property, plant and equipment, intangible asset, goodwill and deferred tax balances. As a result of the finalization of the valuation of the assets and liabilities, additional reallocations were made in 2019 in certain goodwill, other noncurrent liabilities and deferred tax balances. Intangible assets acquired consist primarily of trademarks, trade secrets and customer relationships, all of which are being amortized over 15 years. We have assigned any excess of the acquisition cost of the fair values to goodwill. During the third quarter of 2018, we received $4 million related to the settlement of certain purchase price adjustments. The goodwill recognized is attributable primarily to projected future profitable growth, penetration into downstream markets and synergies.

The acquired business had revenues and net income of $142 million and $5 million, respectively, for the period from the date of acquisition to December 31, 2018.

If this acquisition were to have occurred on January 1, 2017, the following estimated pro forma revenues, net income, net income attributable to Huntsman Corporation and Huntsman International and income per share for Huntsman Corporation would have been reported (dollars in millions):

Pro Forma (Unaudited)

Year ended December 31, 

2018

2017

Revenues

$

7,662

$

7,010

Net income

639

728

Net income attributable to Huntsman Corporation

326

623

F-25

Table of Contents

HUNTSMAN CORPORATION AND SUBSIDIARIES
HUNTSMAN INTERNATIONAL LLC AND SUBSIDIARIES
NOTES TO CONSOLIDATED FINANCIAL STATEMENTS
(Continued)

Pro Forma (Unaudited)

Year ended December 31, 

2018

2017

Revenues

$

7,662

$

7,010

Net income

625

721

Net income attributable to Huntsman International

312

616

4. DISCONTINUED OPERATIONS AND BUSINESS DISPOSITIONS

Sale of Chemical Intermediates Businesses

On January 3, 2020, we completed the sale of our Chemical Intermediates Businesses to Indorama in a transaction valued at approximately $2 billion, comprising a cash purchase price of approximately $1.93 billion, which includes estimated adjustments to the purchase price for working capital, plus the transfer of approximately $72 million in net underfunded pension and other post-employment benefit liabilities. The final purchase price is subject to customary post-closing adjustments. The net after tax cash proceeds are expected to be approximately $1.6 billion. Beginning in the third quarter of 2019, we reported the assets and liabilities of our Chemical Intermediates Businesses as held for sale and reported its results of operations as discontinued operations. Certain amounts for prior periods have similarly been retrospectively reflected for all periods presented. In connection with this sale, we entered into long-term supply agreements with Indorama for certain raw materials at market prices supplied by the Chemical Intermediates Businesses.

The following table reconciles the carrying amounts of major classes of assets and liabilities of discontinued operations to total assets and liabilities of discontinued operations that are classified as held for sale in our consolidated balance sheets (dollars in millions):

December 31, 

December 31, 

2019


2018

Carrying amounts of major classes of assets held for sale:

Accounts receivable

$

145

$

89

Inventories

105

134

Other current assets

9

Total current assets

232

Property, plant and equipment, net

720

711

Operating lease right-of-use assets

69

Deferred income taxes

4

Other noncurrent assets

165

166

Total noncurrent assets

877

Total assets held for sale(1)

$

1,208

$

1,109

Carrying amounts of major classes of liabilities held for sale:

Accounts payable

$

152

$

168

Accrued liabilities

26

57

Current operating lease liabilities

20

Total current liabilities

225

Deferred income taxes

135

159

Noncurrent operating lease liabilities

51

Other noncurrent liabilities

128

124

Total noncurrent liabilities

283

Total liabilities held for sale(1)

$

512

$

508

(1)The assets and liabilities held for sale are classified as current as of December 31, 2019 because the sale of our

F-26

Table of Contents

HUNTSMAN CORPORATION AND SUBSIDIARIES
HUNTSMAN INTERNATIONAL LLC AND SUBSIDIARIES
NOTES TO CONSOLIDATED FINANCIAL STATEMENTS
(Continued)

Chemical Intermediates Businesses was completed on January 3, 2020.

The following table reconciles major line items constituting pretax income of discontinued operations to after-tax income (loss) of discontinued operations as presented in our consolidated statements of operations (dollars in millions):

Huntsman Corporation

Year ended December 31, 

2019

2018

2017

Major line items constituting pretax income of discontinued operations(1):

Trade sales, services and fees, net(2)

$

1,545

$

3,923

$

3,747

Cost of goods sold(2)

1,287

2,847

3,198

Other expense items, net that are not major

54

332

208

Income from discontinued operations before income taxes

204

744

341

Income tax expense

(35)

(86)

(111)

Loss on disposal

(427)

Valuation allowance

(270)

Income (loss) from discontinued operations, net of tax

169

(39)

230

Net income attributable to noncontrolling interests

(6)

(10)

Net income (loss) attributable to discontinued operations

$

169

$

(45)

$

220

Huntsman International

Year ended December 31, 

2019

2018

2017

Major line items constituting pretax income of discontinued operations(1):

Trade sales, services and fees, net(2)

$

1,545

$

3,923

$

3,747

Cost of goods sold(2)

1,287

2,847

3,201

Other expense items, net that are not major

54

332

208

Income from discontinued operations before income taxes

204

744

338

Income tax expense

(35)

(86)

(111)

Loss on disposal

(427)

Valuation allowance

(270)

Income (loss) from discontinued operations, net of tax

169

(39)

227

Net income attributable to noncontrolling interests

(6)

(10)

Net income (loss) attributable to discontinued operations

$

169

$

(45)

$

217

(1)Discontinued operations include our Chemical Intermediates Businesses, our Australian styrenics operations and our North American polymers and base chemicals operations for all periods presented. We began accounting for our investment in Venator as an equity method investment on December 3, 2018. Therefore, the summarized financial data only includes the results of Venator applicable to the period from January 1, 2017 through December 2, 2018.

(2)Includes eliminations of trade sales, services and fees, net and cost of sales between continuing operations and discontinued operations.

Separation and Deconsolidation of Venator

In August 2017, we separated the P&A Business and conducted an IPO of ordinary shares of Venator, formerly a wholly-owned subsidiary of Huntsman. Additionally, in December 2017, we conducted a secondary offering of

F-27

Table of Contents

HUNTSMAN CORPORATION AND SUBSIDIARIES
HUNTSMAN INTERNATIONAL LLC AND SUBSIDIARIES
NOTES TO CONSOLIDATED FINANCIAL STATEMENTS
(Continued)

Venator ordinary shares. All of such ordinary shares were sold by Huntsman, and Venator did not receive any proceeds from the offerings.

On January 3, 2018, the underwriters purchased an additional 1,948,955 Venator ordinary shares pursuant to their over-allotment option, which reduced Huntsman’s ownership interest in Venator to approximately 53%. Beginning in the third quarter of 2017, we reported the results of operations of Venator as discontinued operations.

On December 3, 2018, we sold an aggregate of 4,334,389, or 4%, of Venator ordinary shares to Bank of America N.A. at a price determined based on the average of the daily volume weighted average price of Venator ordinary shares over an agreed period (the “Forward Swap”). Over this agreed period, we received aggregate proceeds of $19 million, $16 million of which was received in the first quarter of 2019. Following this transaction, we retained approximately 49% ownership in Venator and this transaction allowed us to deconsolidate Venator beginning in December 2018, and thus we began accounting for our remaining interest in Venator as an equity method investment and elected the fair value option to account for our equity method investment in Venator.

Although we intend to monetize our remaining 49% ownership in Venator, our ability to sell our ordinary shares of Venator at a reasonable price is dependent upon the prevailing market value of Venator common stock. The depressed Venator stock price inhibits our ability to sell our remaining shares of Venator at a reasonable price, which could continue for more than twelve months. Therefore, in December 2018, our equity method investment in Venator did not meet the held for sale criteria and our equity method investment in Venator was recorded in continuing operations.

During the first quarter of 2019, we recorded a gain of $1 million to record the Forward Swap at fair value. Additionally, for year ended December 31, 2019, we recorded a loss of $19 million to record our investment in Venator at fair value. These gains and losses were recorded in “Fair value adjustments to Venator investment” on our consolidated statements of operations.

5. INVENTORIES

Inventories consisted of the following (dollars in millions):

December 31, 

December 31, 


2019


2018

Raw materials and supplies

$

175

$

191

Work in progress

49

51

Finished goods

718

798

Total

942

1,040

LIFO reserves

(28)

(40)

Net inventories

$

914

$

1,000

For December 31, 2019 and 2018, approximately 9% and 6% of inventories were recorded using the LIFO cost method, respectively.

F-28

Table of Contents

HUNTSMAN CORPORATION AND SUBSIDIARIES
HUNTSMAN INTERNATIONAL LLC AND SUBSIDIARIES
NOTES TO CONSOLIDATED FINANCIAL STATEMENTS
(Continued)

6. PROPERTY, PLANT AND EQUIPMENT

The cost and accumulated depreciation of property, plant and equipment were as follows (dollars in millions):

Huntsman Corporation

December 31, 


2019


2018

Land

$

103

$

105

Buildings


605


602

Plant and equipment


4,695


4,550

Construction in progress


285


249

Total


5,688


5,506

Less accumulated depreciation


(3,305)


(3,153)

Net

$

2,383

$

2,353

Depreciation expense for 2019, 2018 and 2017 was $245 million, $239 million and $226 million, respectively.

Huntsman International

December 31,


2019


2018

Land

$

103

$

105

Buildings


605


602

Plant and equipment


4,749


4,604

Construction in progress


285


249

Total


5,742


5,560

Less accumulated depreciation


(3,359)


(3,207)

Net

$

2,383

$

2,353

Depreciation expense for 2019, 2018 and 2017 was $245 million, $236 million and $217 million, respectively.

7. INVESTMENT IN UNCONSOLIDATED AFFILIATES

Our ownership percentage and investment in unconsolidated affiliates were as follows (dollars in millions):

December 31, 


2019


2018

Equity Method:

Venator Materials PLC (49%)(1)

$

200

$

219

BASF Huntsman Shanghai Isocyanate Investment BV (50%)(2)

112

120

Nanjing Jinling Huntsman New Material Co., Ltd. (49%)


196


163

Jurong Ningwu New Material Development Co., Ltd. (30%)


27


24

Total investments

$

535

$

526

(1)We account for our remaining investment in Venator as an equity method investment using the fair value option. For more information see “Note 4. Discontinued Operations and Business Dispositions—Separation and Deconsolidation of Venator.”

(2)We own 50% of BASF Huntsman Shanghai Isocyanate Investment BV. BASF Huntsman Shanghai Isocyanate Investment BV owns a 70% interest in SLIC, thus giving us an indirect 35% interest in SLIC.

F-29

Table of Contents

HUNTSMAN CORPORATION AND SUBSIDIARIES
HUNTSMAN INTERNATIONAL LLC AND SUBSIDIARIES
NOTES TO CONSOLIDATED FINANCIAL STATEMENTS
(Continued)

Summarized Financial Information of Unconsolidated Affiliates

Summarized financial information of our unconsolidated affiliates as of December 31, 2019 and 2018 and for the years ended December 31, 2019, 2018 and 2017 is as follows (dollars in millions):

December 31, 


2019


2018

Current assets

$

1,439

$

1,548

Non-current assets

2,436

2,444

Current liabilities

688

781

Non-current liabilities


1,614


1,683

Noncontrolling interests


7


8

Year ended December 31,

2019(1)


2018(1)


2017

Revenues

$

4,025

$

2,181

$

1,109

Gross profit


454

221

112

Income from continuing operations


99

124

34

Net income

99

124

34

(1)

We began accounting for our investment in Venator as an equity method investment on December 3, 2018. Therefore, the summarized financial data only includes information for Venator for the year ended December 31, 2019 and the period from December 3, 2018 through December 31, 2018.

8. VARIABLE INTEREST ENTITIES

We evaluate our investments and transactions to identify variable interest entities for which we are the primary beneficiary. We hold a variable interest in the following joint ventures for which we are the primary beneficiary:

Rubicon LLC is our 50%-owned joint venture with Lanxess that manufactures products for our Polyurethanes and Performance Products segments. The structure of the joint venture is such that the total equity investment at risk is not sufficient to permit the joint venture to finance its activities without additional financial support. By virtue of the operating agreement with this joint venture, we purchase a majority of the output, absorb a majority of the operating costs and provide a majority of the additional funding.
AAC is our 50%-owned joint venture with Zamil group that manufactures products for our Performance Products segment. As required in the operating agreement governing this joint venture, we purchase all of AAC’s production and sell it to our customers. Substantially all of the joint venture’s activities are conducted on our behalf.
Sasol-Huntsman was our 50%-owned joint venture with Sasol that owned and operated a maleic anhydride facility in Moers, Germany. This joint venture manufactured products for our Performance Products segment. Sasol-Huntsman used our technology and expertise, and we bore a disproportionate amount of risk of loss due to a related-party loan to Sasol-Huntsman for which we bore the default risk. On September 30, 2019, we acquired the 50% noncontrolling interest that we did not own in the Sasol-Huntsman. As such, as of September 30, 2019, this joint venture was no longer accounted for as a variable interest entity. See “Note 3. Business Combinations and Acquisitions.”

Creditors of these entities have no recourse to our general credit. See “Note 15. Debt—Direct and Subsidiary Debt.” As the primary beneficiary of these variable interest entities at December 31, 2019, the joint ventures’ assets, liabilities and results of operations are included in our consolidated financial statements.

F-30

Table of Contents

HUNTSMAN CORPORATION AND SUBSIDIARIES
HUNTSMAN INTERNATIONAL LLC AND SUBSIDIARIES
NOTES TO CONSOLIDATED FINANCIAL STATEMENTS
(Continued)

The following table summarizes the carrying amount of our variable interest entities’ assets and liabilities included in our consolidated balance sheets as of December 31, 2019 and 2018 (dollars in millions):

December 31, 

December 31, 


2019(1)


2018

Current assets

$

50

$

92

Property, plant and equipment, net

180

265

Operating lease right-of-use assets

16

Other noncurrent assets

132

136

Deferred income taxes

30

32

Intangible assets

10

Goodwill

14

Total assets

$

408

$

549

Current liabilities

$

151

$

178

Long-term debt

29

61

Deferred income taxes

11

Noncurrent operating lease liabilities

11

Other noncurrent liabilities

87

97

Total liabilities

$

278

$

347

(1)As of September 30, 2019, Sasol-Huntsman was no longer accounted for as a variable interest entity.

The revenues, income from continuing operations before income taxes and net cash provided by operating activities for our variable interest entities are as follows (dollars in millions):

Year ended December 31, 


2019(1)


2018


2017

Revenues

$

95

$

154

$

132

Income from continuing operations before income taxes


17


40


25

Net cash provided by operating activities


81


65


51

(1)As of September 30, 2019, Sasol-Huntsman was no longer accounted for as a variable interest entity. Therefore, this financial data only includes information for Sasol-Huntsman applicable to the period from January 1, 2019 through September 30, 2019.

9. LEASES

On January 1, 2019, we adopted the new lease standard using the optional transition method provided under ASU No. 2018-11, which allowed us to initially apply the amendments of the new lease standard at the adoption date. Upon adoption of the new lease standard, we elected the package of three practical expedient permitted under the transition guidance within the new lease standard, which among other things, allowed us to carry forward the historical lease classification on existing leases at adoption. In addition, we elected the practical expedient related to land easements, which allowed us to carry forward our accounting treatment for land easements on existing agreements. We also elected the hindsight practical expedient to determine the lease term for existing leases.

The determination of whether a contract is or contains a lease is performed at the lease inception date. Lease right-of-use assets and lease liabilities are recognized at the lease commencement date based on the present value of lease payments over the lease term, using incremental borrowing rates as the implicit rates are not readily determinable for our leases. The incremental borrowing rates are determined on a collateralized basis and vary from lease to lease depending on the country where the leased asset exists and the term of the lease arrangement. We combine lease components with non-lease components and account for them as a single lease component for all classes of underlying assets, except for leases of manufacturing and research facilities and administrative offices. For these assets, non-lease components are separated from lease components and accounted for as normal operating expenses.

F-31

Table of Contents

HUNTSMAN CORPORATION AND SUBSIDIARIES
HUNTSMAN INTERNATIONAL LLC AND SUBSIDIARIES
NOTES TO CONSOLIDATED FINANCIAL STATEMENTS
(Continued)

We primarily lease manufacturing and research facilities, administrative offices, land, tanks, railcars and equipment. Leases with an initial term of 12 months or less are not recognized on the balance sheet; we recognize lease expense for these leases on a straight-line basis over the lease term. Our variable lease cost was nil for the year ended December 31, 2019. Our leases have remaining lives from one month to 38 years. Certain lease agreements include one or more options to renew, at our discretion, with renewal terms that can extend the lease term by approximately one year to 30 years or more. Renewal and termination options that we are reasonably certain to exercise have been included in the calculation of the lease right-of-use assets and lease liabilities. None of our lease agreements contain material residual value guarantees or material restrictions or covenants.

The components of operating lease expense, cash flows and supplemental noncash information from continuing operations are as follows (dollars in millions):

Year ended

December 31, 2019

Operating lease expense:

Cost of goods sold

$

35

Selling, general and administrative

15

Research and development

6

Total operating lease expense(1)(2)

$

56

Cash paid for amounts included in the measurement of lease liabilities:

Operating cash flows from operating leases

$

53

Supplemental noncash information:

Leased assets obtained in exchange for new operating lease liabilities

$

416

(1)Total operating lease expense includes short-term lease expense of approximately $1 million for the year ended December 31, 2019.
(2)Total operating lease expense for the years ended December 31, 2018 and 2017 were $55 million and $60 million, respectively.

The weighted-average lease term and discount rate for our operating leases from continuing operations are as follows:

Weighted-average remaining lease term

11 years

Weighted-average discount rate

4.1%

F-32

Table of Contents

HUNTSMAN CORPORATION AND SUBSIDIARIES
HUNTSMAN INTERNATIONAL LLC AND SUBSIDIARIES
NOTES TO CONSOLIDATED FINANCIAL STATEMENTS
(Continued)

The undiscounted future cash flows of operating lease liabilities from continuing operations as of December 31, 2019 are as follows (dollars in millions):

Year ending December 31,

2020

$

58

2021

57

2022

52

2023

48

2024

45

Thereafter

268

Total lease payments

528

Less imputed interest

(102)

Total

$

426

Future minimum lease payments under operating leases from continuing operations as of December 31, 2018 are as follows (dollars in millions):

Year ending December 31,

2019

$

37

2020

33

2021

36

2022

34

2023

32

Thereafter

224

$

396

As of December 31, 2019, we have additional leases, primarily for leases of manufacturing facilities, that have not yet commenced of approximately $43 million. These leases will commence beginning in 2020 through 2021 with lease terms of up to 20 years.

10. INTANGIBLE ASSETS

The gross carrying amount and accumulated amortization of intangible assets were as follows (dollars in millions):

Huntsman Corporation

December 31, 2019

December 31, 2018


Carrying


Accumulated


Carrying


Accumulated


Amount

Amortization

Net

Amount

Amortization

Net

Patents, trademarks and technology

$

314

$

230

$

84

$

293

$

209

$

84

Licenses and other agreements


140


48


92


134


29


105

Non-compete agreements


3


2


1


3


2


1

Other intangibles


61


41


20


64


41


23

Total

$

518

$

321

$

197

$

494

$

281

$

213

Amortization expense was $16 million, $6 million and $3 million for the years ended December 31, 2019, 2018 and 2017, respectively.

F-33

Table of Contents

HUNTSMAN CORPORATION AND SUBSIDIARIES
HUNTSMAN INTERNATIONAL LLC AND SUBSIDIARIES
NOTES TO CONSOLIDATED FINANCIAL STATEMENTS
(Continued)

Huntsman International

December 31, 2019

December 31, 2018


Carrying


Accumulated


Carrying


Accumulated


Amount

Amortization

Net

Amount

Amortization

Net

Patents, trademarks and technology

$

314

$

230

$

84

$

293

$

209

$

84

Licenses and other agreements


140


48


92


134


29


105

Non-compete agreements


3


2


1


3


2


1

Other intangibles


70


50


20


72


49


23

Total

$

527

$

330

$

197

$

502

$

289

$

213

Amortization expense was $16 million, $6 million and $4 million for the years ended December 31, 2019, 2018 and 2017, respectively.

Our and Huntsman International’s estimated future amortization expense for intangible assets over the next five years is as follows (dollars in millions):

Year ending December 31,


2020


$

16

2021

15

2022

15

2023

15

2024

15

11. OTHER NONCURRENT ASSETS

Other noncurrent assets consisted of the following (dollars in millions):

December 31, 


2019


2018

Capitalized turnaround costs, net

$

223

$

172

Catalyst assets, net


24


26

Other


205


195

Total

$

452

$

393

Amortization expense of catalyst assets for the years ended December 31, 2019, 2018 and 2017 was $9 million, $10 million and $7 million, respectively.

12. ACCRUED LIABILITIES

Accrued liabilities consisted of the following (dollars in millions):

Huntsman Corporation

December 31, 


2019


2018

Payroll and related accruals

$

100

$

126

Taxes other than income taxes


64


44

Income taxes


59


86

Volume and rebate accruals


53


59

Other miscellaneous accruals


144


182

Total

$

420

$

497

F-34

Table of Contents

HUNTSMAN CORPORATION AND SUBSIDIARIES
HUNTSMAN INTERNATIONAL LLC AND SUBSIDIARIES
NOTES TO CONSOLIDATED FINANCIAL STATEMENTS
(Continued)

Huntsman International

December 31, 


2019


2018

Payroll and related accruals

$

100

$

126

Taxes other than income taxes


64


44

Income taxes


59


86

Volume and rebate accruals


53


59

Other miscellaneous accruals


141


179

Total

$

417

$

494

13. RESTRUCTURING, IMPAIRMENT AND PLANT CLOSING (CREDITS) COSTS

2019 Restructuring Activities

In September 2011, we implemented the Textile Effects Restructuring Plan, including the closure of our production facilities and business support offices in Basel, Switzerland. In connection with this plan, in July 2019, we sold the production facilities and business support offices in Basel. Accordingly, during the third quarter of 2019, we received proceeds of $49 million related to this sale and recognized a corresponding gain on disposal of assets of $49 million.

2018 Restructuring Activities

In September 2011, we implemented the Textile Effects Restructuring Plan. In connection with this plan, we recorded restructuring reserves covering, among other things, a non-cancelable long-term service agreement. In the fourth quarter of 2018, we settled this agreement in exchange for the payment of $10 million, $8 million of which was paid in 2019 and $2 million will be paid in 2023. In connection with this settlement, we reversed the related restructuring reserve and recorded a net credit of $29 million in the fourth quarter of 2018. In addition, during 2018, we recorded a credit of $4 million primarily related to a gain on the sale of land at the Basel, Switzerland site.

Our Corporate and other segment recorded restructuring expense of $15 million in 2018 related to corporate initiatives.

2017 Restructuring Activities

In September 2011, we implemented the Textile Effects Restructuring Plan. In connection with this restructuring plan, during the year ended December 31, 2017, our Textile Effects segment recorded restructuring expense of approximately $6 million associated with this initiative, including $2 million for non-cancelable long-term contract termination costs and $4 million for decommissioning.

During the first quarter of 2017, we implemented a restructuring program to improve competitiveness in our Textile Effects segment. In connection with this restructuring program, we recorded restructuring expense of $7 million in the year ended December 31, 2017 related primarily to workforce reductions.

F-35

Table of Contents

HUNTSMAN CORPORATION AND SUBSIDIARIES
HUNTSMAN INTERNATIONAL LLC AND SUBSIDIARIES
NOTES TO CONSOLIDATED FINANCIAL STATEMENTS
(Continued)

14. OTHER NONCURRENT LIABILITIES

Other noncurrent liabilities consisted of the following (dollars in millions):

Huntsman Corporation

December 31, 


2019


2018

Pension liabilities

$

650

$

664

Other postretirement benefits


55


54

Employee benefit accrual


38


32

Other


155


199

Total

$

898

$

949

Huntsman International

December 31, 

2019


2018

Pension liabilities


$

650


$

664

Other postretirement benefits


55


54

Employee benefit accrual


38


32

Other


147


187

Total

$

890

$

937

15. DEBT

Outstanding debt, net of debt issuance costs, of consolidated entities consisted of the following (dollars in millions):

Huntsman Corporation

December 31, 

December 31, 


2019

2018

Senior Credit Facilities:


Revolving facility

$

40

$

50

Amounts outstanding under A/R programs

167

252

Term loan

103

Senior notes

1,963

1,892

Variable interest entities

65

86

Other

51

40

Total debt

$

2,389

$

2,320

Total current portion of debt

$

212

$

96

Long-term portion of debt

2,177

2,224

Total debt

$

2,389

$

2,320

F-36

Table of Contents

HUNTSMAN CORPORATION AND SUBSIDIARIES
HUNTSMAN INTERNATIONAL LLC AND SUBSIDIARIES
NOTES TO CONSOLIDATED FINANCIAL STATEMENTS
(Continued)

Huntsman International

December 31, 

December 31, 


2019

2018

Senior Credit Facilities:

Revolving facility

$

40

$

50

Amounts outstanding under A/R programs

167

252

Term loan

103

Senior notes

1,963

1,892

Variable interest entities

65

86

Other

51

40

Total debt, excluding debt to affiliates

$

2,389

$

2,320

Total current portion of debt

$

212

$

96

Long-term portion of debt

2,177

2,224

Total debt, excluding debt to affiliates

$

2,389

$

2,320

Notes payable to affiliates-current

100

100

Notes payable to affiliates-noncurrent

280

488

Total debt

$

2,769

$

2,908

Direct and Subsidiary Debt

Huntsman Corporation’s direct debt and guarantee obligations consist of a guarantee of certain indebtedness incurred from time to time to finance certain insurance premiums. Substantially all of our other debt, including the facilities described below, has been incurred by our subsidiaries (primarily Huntsman International); Huntsman Corporation is not a guarantor of such subsidiary debt.

Certain of our subsidiaries are designated as nonguarantor subsidiaries and have third-party debt agreements. These debt agreements contain certain restrictions with regard to dividends, distributions, loans or advances. In certain circumstances, the consent of a third party would be required prior to the transfer of any cash or assets from these subsidiaries to us.

Debt Issuance Costs

We record debt issuance costs related to a debt liability on the balance sheet as a reduction in the face amount of that debt liability. As of December 31, 2019 and 2018, the amount of debt issuance costs directly reducing the debt liability was $11 million and $8 million, respectively. We record the amortization of debt issuance costs as interest expense.

Revolving Credit Facility

On May 21, 2018, Huntsman International entered into the 2018 Revolving Credit Facility. Borrowings under the 2018 Revolving Credit Facility will bear interest at the rates specified in the credit agreement governing the 2018 Revolving Credit Facility, which will vary based on the type of loan and Huntsman International’s debt ratings. Unless earlier terminated, the 2018 Revolving Credit Facility will mature in May 2023. Huntsman International may increase the 2018 Revolving Credit Facility commitments up to an additional $500 million, subject to the satisfaction of certain conditions.

In connection with entering into the 2018 Revolving Credit Facility, Huntsman International terminated all commitments and repaid all obligations under the Prior Credit Facility. In addition, we recognized a loss of early extinguishment of debt of $3 million. Upon the termination of the Prior Credit Facility, all guarantees of the obligations under the Prior Credit Facility were terminated, and all liens granted under the Prior Credit Facility were released. As of December 31, 2019, our 2018 Revolving Credit Facility was as follows (dollars in millions):

F-37

Table of Contents

HUNTSMAN CORPORATION AND SUBSIDIARIES
HUNTSMAN INTERNATIONAL LLC AND SUBSIDIARIES
NOTES TO CONSOLIDATED FINANCIAL STATEMENTS
(Continued)

Unamortized

Discounts and

Committed

Principal

Debt Issuance

Carrying

Facility

Amount


Outstanding


Costs


Value


Interest Rate(2)


Maturity

2018 Revolving Credit Facility

$

1,200

$

40

(1)

$

(1)

$

40

(1)

USD LIBOR plus 1.50%

2023

(1)On December 31, 2019, we had an additional $7 million (U.S. dollar equivalents) of letters of credit and bank guarantees issued and outstanding under our 2018 Revolving Credit Facility.

(2)Interest rates on borrowings under the 2018 Revolving Credit Facility vary based on the type of loan and Huntsman International’s debt ratings. The then applicable interest rate as of December 31, 2019 was 1.50% above LIBOR.

Term Loan Credit Facility

On September 24, 2019, Huntsman International entered into the 2019 Term Loan, pursuant to which Huntsman International borrowed an aggregate principal amount of €92 million (or $101 million equivalent). We used the net proceeds from the 2019 Term Loan to finance our acquisition of the 50% noncontrolling interest that we did not own in the Sasol-Huntsman maleic anhydride joint venture. Borrowings under the 2019 Term Loan will bear interest at an interest rate of EURIBO Rate plus 0.75%, with a EURIBO Rate floor at zero. Unless earlier terminated or prepaid in accordance with the credit agreement governing the 2019 Term Loan, the 2019 Term Loan will mature on September 22, 2020. The 2019 Term Loan is subject to substantially the same terms and conditions as the 2018 Revolving Credit Facility.

A/R Programs

Our A/R Programs are structured so that we transfer certain of our trade receivables to the U.S. special purpose entity (“U.S. SPE”) and the European special purpose entity (“EU SPE”) in transactions intended to be true sales or true contributions. The receivables collateralize debt incurred by the U.S. SPE and the EU SPE.

On April 18, 2019, we entered into amendments to the EU A/R Program (the “European Amendment”) and the U.S. A/R Program (the “U.S. Amendment”). The European Amendment, among other things, extended the scheduled commitment termination date of the loan facility to April 2022, reduced the facility maximum funding availability from €150 million to €100 million and made certain other amendments. The U.S. Amendment, among other things, extended the scheduled commitment termination date of the loan facility to April 2022 and made certain other amendments.

Information regarding our A/R Programs as of December 31, 2019 was as follows (monetary amounts in millions):


Maximum Funding


Amount


Facility


Maturity


Availability(1)


Outstanding


Interest Rate(2)

U.S. A/R Program


April 2022

$

250

$

100

(3)  

Applicable rate plus 0.90%

EU A/R Program


April 2022

100

60


Applicable rate plus 1.30%

(or approximately $112)

(or approximately $67)

(1)The amount of actual availability under our A/R Programs may be lower based on the level of eligible receivables sold, changes in the credit ratings of our customers, customer concentration levels and certain characteristics of the accounts receivable being transferred, as defined in the applicable agreements.
(2)The applicable rate for our U.S. A/R Program is defined by the lender as USD LIBOR. The applicable rate for our EU A/R Program is either GBP LIBOR, USD LIBOR or EURIBOR.
(3)As of December 31, 2019, we had approximately $5 million (U.S. dollar equivalents) of letters of credit issued and outstanding under our U.S. A/R Program.

F-38

Table of Contents

HUNTSMAN CORPORATION AND SUBSIDIARIES
HUNTSMAN INTERNATIONAL LLC AND SUBSIDIARIES
NOTES TO CONSOLIDATED FINANCIAL STATEMENTS
(Continued)

In December 2019, we entered into amendments to the U.S. A/R program and the EU A/R program. The European amendment allowed the removal of pledged obligors related to the Chemical Intermediates Businesses sold to Indorama. The U.S. amendment allowed the removal of pledged obligors related to the Chemical Intermediates Businesses sold to Indorama as well as reduced the maximum funding capacity from $250 million to $150 million upon completion of the sale on January 3, 2020.

As of December 31, 2019 and December 31, 2018, $221 million and $341 million, respectively, of accounts receivable were pledged as collateral under our A/R Programs.

Notes

As of December 31, 2019, we had outstanding the following notes (monetary amounts in millions):

Unamortized

Premiums,

Discounts

and Debt

Notes


Maturity


Interest Rate


Amount Outstanding


Issuance Costs

2021 Senior Notes


April 2021


5.125

%

445 (€445 carrying value $(496))

$

2022 Senior Notes


November 2022


5.125

%

$400 ($398 carrying value)

(2)

2025 Senior Notes


April 2025


4.250

%

300 (€298 carrying value $(333))

(2)

2029 Senior Notes


February 2029


4.500

%

$750 ($736 carrying value)

(14)

The 2021, 2022, 2025 and 2029 Senior Notes are general unsecured senior obligations of Huntsman International. The indentures impose certain limitations on the ability of Huntsman International and its subsidiaries to, among other things, incur additional indebtedness secured by any principal properties, incur indebtedness of nonguarantor subsidiaries, enter into sale and leaseback transactions with respect to any principal properties and consolidate or merge with or into any other person or lease, sell or transfer all or substantially all of its properties and assets. Upon the occurrence of certain change of control events, holders of the 2021, 2022, 2025 and 2029 Senior Notes will have the right to require that Huntsman International purchase all or a portion of such holder’s notes in cash at a purchase price equal to 101% of the principal amount thereof plus accrued and unpaid interest to the date of repurchase.

On March 13, 2019, Huntsman International completed a $750 million offering of its 4.50% senior notes due 2029 (“2029 Senior Notes”). On March 27, 2019, Huntsman International applied the net proceeds of the offering of the 2029 Senior Notes to redeem in full $650 million in aggregate principal amount of its 4.875% senior notes due 2020 (“2020 Senior Notes”) and also paid associated costs and accrued interest of $21 million and $12 million, respectively. In addition, we recognized a loss on early extinguishment of debt of $23 million.

The 2029 Senior Notes bear interest at 4.50% per year, payable semi-annually on May 1 and November 1, and will mature on May 1, 2029. Huntsman International may redeem the 2029 Senior Notes in whole or in part at any time prior to February 1, 2029 at a price equal to 100% of the principal amount thereof plus a “make-whole” premium and accrued and unpaid interest. Huntsman International may redeem the 2029 Senior Notes at any time, in whole or from time to time in part, on or after February 1, 2029 at a redemption price equal to 100% of the principal amount of the notes to be redeemed, plus accrued and unpaid interest.

Variable Interest Entity Debt

As of December 31, 2019, AAC, our consolidated 50%-owned joint venture, had $65 million outstanding under its loan commitments and debt financing arrangements. As of December 31, 2019, we have $36 million classified as current debt and $29 million as long-term debt on our consolidated balance sheets. We do not guarantee these loan commitments, and AAC is not a guarantor of any of our other debt obligations.

F-39

Table of Contents

HUNTSMAN CORPORATION AND SUBSIDIARIES
HUNTSMAN INTERNATIONAL LLC AND SUBSIDIARIES
NOTES TO CONSOLIDATED FINANCIAL STATEMENTS
(Continued)

Note Payable from Huntsman International to Huntsman Corporation

As of December 31, 2019, we have a loan of $380 million to our subsidiary, Huntsman International. The Intercompany Note is unsecured and $100 million of the outstanding amount is classified as current as of December 31, 2019 on our consolidated balance sheets. As of December 31, 2019, under the terms of the Intercompany Note, Huntsman International promises to pay us interest on the unpaid principal amount at a rate per annum based on the previous monthly average borrowing rate obtained under our U.S. A/R Program, less 10 basis points (provided that the rate shall not exceed an amount that is 25 basis points less than the monthly average borrowing rate obtained for the U.S. LIBOR-based borrowings under our 2018 Revolving Credit Facility).

Compliance With Covenants

Our 2018 Revolving Credit Facility contains a financial covenant regarding the leverage ratio of Huntsman International and its subsidiaries. The 2018 Revolving Credit Facility also contains other customary covenants and events of default for credit facilities of this type. Upon an event of default that is not cured or waived within any applicable cure periods, in addition to other remedies that may be available to the lenders, the obligations under the 2018 Revolving Credit Facility may be accelerated.

The agreements governing our A/R Programs also contain certain receivable performance metrics. Any material failure to meet the applicable A/R Programs’ metrics could lead to an early termination event under the A/R Programs, which could require us to cease our use of such facilities, prohibiting us from additional borrowings against our receivables or, at the discretion of the lenders, requiring that we repay the A/R Programs in full. An early termination event under the A/R Programs would also constitute an event of default under our 2018 Revolving Credit Facility, which could require us to pay off the balance of the 2018 Revolving Credit Facility in full and could result in the loss of our 2018 Revolving Credit Facility.

We believe that we are in compliance with the covenants governing our material debt instruments, including our 2018 Revolving Credit Facility, our A/R Programs and our notes.

Maturities

The scheduled maturities of our debt (excluding debt to affiliates) by year as of December 31, 2019 are as follows (dollars in millions):

Year ending December 31, 


2020

$

212

2021


522

2022


570

2023


1

2024


2

Thereafter


1,082

$

2,389

16. DERIVATIVE INSTRUMENTS AND HEDGING ACTIVITIES

We are exposed to market risks, such as changes in interest rates, foreign exchange rates and commodity prices. From time to time, we enter into transactions, including transactions involving derivative instruments, to manage certain of these exposures. We also hedge our net investment in certain European operations. Changes in the fair value of the hedge in the net investment of certain European operations are recorded in accumulated other comprehensive loss.

In connection with the December 3, 2018 sale of Venator ordinary shares to Bank of America N.A., we recorded a forward swap. See “Note 4. Discontinued Operations and Business Dispositions—Separation and Deconsolidation of Venator” and “Note 17. Fair Value.”

F-40

Table of Contents

HUNTSMAN CORPORATION AND SUBSIDIARIES
HUNTSMAN INTERNATIONAL LLC AND SUBSIDIARIES
NOTES TO CONSOLIDATED FINANCIAL STATEMENTS
(Continued)

Interest Rate Risk

Through our borrowing activities, we are exposed to interest rate risk. Such risk arises due to the structure of our debt portfolio, including the mix of fixed and floating interest rates. Actions taken to reduce interest rate risk include managing the mix and rate characteristics of various interest-bearing liabilities, as well as entering into interest rate derivative instruments.

From time to time, we may purchase interest rate swaps and/or other derivative instruments to reduce the impact of changes in interest rates on our floating-rate exposures. Under interest rate swaps, we agree with other parties to exchange, at specified intervals, the difference between fixed-rate and floating-rate interest amounts calculated by reference to an agreed notional principal amount. On January 9, 2019, we entered into a six-year $17 million notional value interest rate hedge with a fixed rate of 2.66%. This swap was designated as a cash flow hedge and the effective portion of the changes in the fair value of the swap was recorded in other comprehensive (loss) income. In November 2019, we terminated this swap and paid $1 million to our counterparties. This $1 million settlement will be amortized from accumulated other comprehensive loss to earnings.

During 2019, there were no other reclassifications from accumulated other comprehensive loss to earnings. The actual amount that will be reclassified to earnings over the next twelve months may vary from this amount due to changing market conditions. We would be exposed to credit losses in the event of nonperformance by a counterparty to our derivative financial instruments. We anticipate, however, that the counterparties will be able to fully satisfy their obligations under the contracts. Market risk arises from changes in interest rates.

Foreign Exchange Rate Risk

Our cash flows and earnings are subject to fluctuations due to exchange rate variation. Our revenues and expenses are denominated in various currencies. We enter into foreign currency derivative instruments to minimize the short-term impact of movements in foreign currency rates. Where practicable, we generally net multicurrency cash balances among our subsidiaries to help reduce exposure to foreign currency exchange rates. Certain other exposures may be managed from time to time through financial market transactions, principally through the purchase of spot or forward foreign exchange contracts (generally with maturities of three months or less). We do not hedge our currency exposures in a manner that would eliminate the effect of changes in exchange rates on our cash flows and earnings. As of December 31, 2019 and 2018, we had approximately $135 million and $151 million, respectively, notional amount (in U.S. dollar equivalents) outstanding in foreign currency contracts with a term of approximately one month.

In November 2014, we entered into two five-year cross-currency interest rate contracts and one eight-year cross-currency interest rate contract to swap an aggregate notional $200 million for an aggregate notional €161 million. The swap was designated as a hedge of net investment for financial reporting purposes. In August 2017, we terminated these cross-currency interest rate contracts and received $7 million from the counterparties.

A portion of our debt is denominated in euros. We also finance certain of our non-U.S. subsidiaries with intercompany loans that are, in many cases, denominated in currencies other than the entities’ functional currency. We manage the net foreign currency exposure created by this debt through various means, including cross-currency swaps, the designation of certain intercompany loans as permanent loans because they are not expected to be repaid in the foreseeable future and the designation of certain debt and swaps as net investment hedges.

Foreign currency transaction gains and losses on intercompany loans that are not designated as permanent loans are recorded in earnings. Foreign currency transaction gains and losses on intercompany loans that are designated as permanent loans are recorded in other comprehensive (loss) income. From time to time, we review such designation of intercompany loans.

We review our non-U.S. dollar denominated debt and derivative instruments to determine the appropriate amounts designated as hedges. As of December 31, 2019, we have designated approximately €435 million (approximately $485 million) of euro-denominated debt as a hedge of our net investment. For the years ended December 31, 2019, 2018 and 2017, the amounts recognized on the hedge of our net investment were a gain of $14 million, a gain of $35 million and a loss of $96 million, respectively, and were recorded in other comprehensive (loss) income.

F-41

Table of Contents

HUNTSMAN CORPORATION AND SUBSIDIARIES
HUNTSMAN INTERNATIONAL LLC AND SUBSIDIARIES
NOTES TO CONSOLIDATED FINANCIAL STATEMENTS
(Continued)

Commodity Prices Risk

Inherent in our business is exposure to price changes for several commodities. However, our exposure to changing commodity prices is somewhat limited since the majority of our raw materials are acquired at posted or market related prices, and sales prices for many of our finished products are at market related prices which are largely set on a monthly or quarterly basis in line with industry practice. Consequently, we do not generally hedge our commodity exposures.

17. FAIR VALUE

The fair values of our financial instruments were as follows (dollars in millions):

December 31, 2019

December 31, 2018

Carrying

Estimated

Carrying

Estimated

Value


Fair Value


Value


Fair Value

Non-qualified employee benefit plan investments

$

28

$

28

$

23

$

23

Forward swap contract related to the sale of investment in Venator

14

14

Long-term debt (including current portion)

(2,389)

(2,544)

(2,320)

(2,403)

The carrying amounts reported in the balance sheets of cash and cash equivalents, accounts receivable and accounts payable approximate fair value because of the immediate or short-term maturity of these financial instruments. We elected the fair value option to account for our equity method investment in Venator post deconsolidation. The fair value of our remaining investment in Venator reported in investment in unconsolidated affiliates is obtained through market observable pricing using prevailing market prices (Level 1). See “Note 4. Discontinued Operations and Business Dispositions—Separation and Deconsolidation of Venator.” The fair values of non-qualified employee benefit plan investments are obtained through market observable pricing using prevailing market prices. The estimated fair values of our long-term debt are based on quoted market prices for the identical liability when traded as an asset in an active market (Level 1).

The fair value estimates presented herein are based on pertinent information available to management as of December 31, 2019 and 2018. Although management is not aware of any factors that would significantly affect the estimated fair value amounts, such amounts have not been comprehensively revalued for purposes of these financial statements since December 31, 2019, and current estimates of fair value may differ significantly from the amounts presented herein.

F-42

Table of Contents

HUNTSMAN CORPORATION AND SUBSIDIARIES
HUNTSMAN INTERNATIONAL LLC AND SUBSIDIARIES
NOTES TO CONSOLIDATED FINANCIAL STATEMENTS
(Continued)

The following assets and liabilities are measured at fair value on a recurring basis (dollars in millions):

Fair Value Amounts Using

Quoted prices

Significant other

Significant

in active markets

observable

unobservable 

December 31, 

for identical

inputs

 inputs

Description


2019


assets (Level 1)


(Level 2)


(Level 3)

Assets:


Equity securities:

Non-qualified employee benefit plan investments

$

28

$

28

$

$

Fair Value Amounts Using

Quoted prices

Significant other

Significant

in active markets

observable

unobservable 

December 31, 

for identical

inputs

 inputs

Description


2018


assets (Level 1)


(Level 2)


(Level 3)

Assets:

Equity securities:

Non-qualified employee benefit plan investments

$

23

$

23

$

$

Derivatives:

Forward swap contract related to the sale of investment in Venator(1)

14

14

$

37

$

23

$

14

$

(1)In connection with the December 3, 2018 sale of Venator ordinary shares to Bank of America N.A., we recorded a forward swap. In February 2019, we settled this forward swap and received $16 million from the counterparty.

During the years ended December 31, 2019 and 2018, there were no instruments measured at fair value on a recurring basis using significant unobservable inputs (Level 3), and there were no gains or losses (realized or unrealized) included in earnings for instruments categorized as Level 3 within the fair value hierarchy.

18. REVENUE RECOGNITION

We generate substantially all of our revenues through sales in the open market and long-term supply agreements. We recognize revenue when control of the promised goods is transferred to our customers. Control of goods usually passes to the customer at the time shipment is made. Revenue is measured as the amount that reflects the consideration that we expect to be entitled to in exchange for those goods. Sales, value add, and other taxes we collect concurrent with revenue-producing activities are excluded from revenue. Incidental items that are immaterial in the context of the contract are recognized as expense. We have elected to account for all shipping and handling activities as fulfillment costs. We have also elected to expense commissions when incurred as the amortization period of the commission asset that we would have otherwise recognized is less than one year.

F-43

Table of Contents

HUNTSMAN CORPORATION AND SUBSIDIARIES
HUNTSMAN INTERNATIONAL LLC AND SUBSIDIARIES
NOTES TO CONSOLIDATED FINANCIAL STATEMENTS
(Continued)

The following table disaggregates our revenue by major source for the years ended December 31, 2019 and 2018 (dollars in millions):

2019

Polyurethanes

Performance Products

Advanced Materials

Textile Effects

Corporate and Eliminations

Total

Primary Geographic Markets(1)

U.S. and Canada

$

1,475

$

531

$

289

$

62

$

(64)

$

2,293

Europe

1,051

316

410

128

(9)

1,896

Asia Pacific

1,078

248

269

446

(2)

2,039

Rest of world

307

63

76

127

(4)

569

$

3,911

$

1,158

$

1,044

$

763

$

(79)

$

6,797

Major Product Groupings

MDI urethanes

$

3,911

$

3,911

Differentiated

$

1,158

1,158

Specialty

$

891

891

Non-specialty

153

153

Textile chemicals and dyes and digital inks

$

763

763

Eliminations

$

(79)

(79)

$

3,911

$

1,158

$

1,044

$

763

$

(79)

$

6,797

2018

Polyurethanes

Performance Products

Advanced Materials

Textile Effects

Corporate and Eliminations

Total

Primary Geographic Markets(1)

U.S. and Canada

$

1,426

$

586

$

285

$

68

$

122

$

2,487

Europe

1,277

368

445

135

(16)

2,209

Asia Pacific

1,236

278

301

485

(24)

2,276

Rest of world

343

69

85

136

(1)

632

$

4,282

$

1,301

$

1,116

$

824

$

81

$

7,604

Major Product Groupings

MDI urethanes

$

4,282

$

4,282

Differentiated

$

1,301

1,301

Specialty

$

932

932

Non-specialty

184

184

Textile chemicals and dyes and digital inks

$

824

824

Eliminations

$

81

81

$

4,282

$

1,301

$

1,116

$

824

$

81

$

7,604

(1)Geographic information for revenues is based upon countries into which product is sold.

Substantially all of our revenue is generated through product sales in which revenue is recognized at a point in time. At contract inception, we assess the goods and services, if any, promised in our contracts and identify a performance obligation for each promise to transfer to the customer a good or service that is distinct. In substantially all cases, a contract has a single performance obligation to deliver a promised good to the customer. Revenue is recognized when control of the product is transferred to the customer (i.e., when our performance obligation is satisfied), which typically occurs at shipment. Further, in determining whether control has transferred, we consider if there is a present right to payment and legal title, along with risks and rewards of ownership having transferred to the customer.

The amount of consideration we receive and revenue we recognize is based upon the terms stated in the sales contract, which may contain variable consideration such as discounts or rebates. We allocate the transaction price to each distinct product based on their relative standalone selling price. The product price as specified on the purchase order or in

F-44

Table of Contents

HUNTSMAN CORPORATION AND SUBSIDIARIES
HUNTSMAN INTERNATIONAL LLC AND SUBSIDIARIES
NOTES TO CONSOLIDATED FINANCIAL STATEMENTS
(Continued)

the sales contract is considered the standalone selling price as it is an observable input that depicts the price as if sold to a similar customer in similar circumstances. In order to estimate the applicable variable consideration, we use historical and current trend information to estimate the amount of discounts or rebates to which customers are likely to be entitled. Historically, actual discount or rebate adjustments relative to those estimated and included when determining the transaction price have not materially differed. Payment terms vary but are generally less than one year. As our standard payment terms are less than one year, we have elected to not assess whether a contract has a significant financing component. In the normal course of business, we do not accept product returns unless the item is defective as manufactured. We establish provisions for estimated returns based on an analysis of historical experience.

19. EMPLOYEE BENEFIT PLANS

Defined Benefit and Other Postretirement Benefit

We provide a trusteed, non contributory defined benefit pension plan (the “Plan”) that covers the majority of our U.S. employees. Effective July 1, 2004, the Plan formula for employees not covered by a collective bargaining agreement was converted to a cash balance design. For represented employees, participation in the cash balance design was subject to the terms of negotiated contracts. For participating employees, benefits accrued under the prior formula were converted to opening cash balance accounts. The cash balance benefit formula provides annual pay credits from 6% to 12% of eligible pay, depending on age and service, plus accrued interest. The conversion to the cash balance plan did not have a significant impact on the accrued benefit liability, the funded status or ongoing pension expense.

Beginning July 1, 2014, the Huntsman Defined Benefit Pension Plan was closed to new non-union entrants and as of April 1, 2015, it was closed to new union entrants. In addition, as of January 1, 2015, Rubicon LLC closed its defined benefit plan to new entrants. Following the closure of these plans, new hires have been provided with a defined contribution plan with a non-discretionary employer contribution of 6% of pay and a company match of up to 4% of pay, for a total company contribution of up to 10% of pay. We also sponsor unfunded postretirement benefit plans other than pensions, which provide medical and life insurance benefits. Effective August 1, 2015, the post retirement benefit plans were closed to new entrants.

Our postretirement benefit plans provide access to two fully insured Medicare Part D plans including prescription drug benefits affected by the Medicare Prescription Drug, Improvement and Modernization Act of 2003 (the “Act”). We cannot determine whether the medical benefits provided by our postretirement benefit plans are actuarially equivalent to those provided by the Act. We do not collect a subsidy and our net periodic postretirement benefits cost, and related benefit obligation, do not reflect an amount associated with the subsidy. We do not subsidize the premium cost of these plans; the premiums are entirely paid by the retirees.

We sponsor defined benefit plans in a number of countries outside of the U.S. The availability of these plans, and their specific design provisions, are consistent with local competitive practices and regulations.

F-45

Table of Contents

HUNTSMAN CORPORATION AND SUBSIDIARIES
HUNTSMAN INTERNATIONAL LLC AND SUBSIDIARIES
NOTES TO CONSOLIDATED FINANCIAL STATEMENTS
(Continued)

The following table sets forth the funded status of the plans for us and Huntsman International and the amounts recognized in our consolidated balance sheets at December 31, 2019 and 2018 (dollars in millions):

Defined Benefit Plans

Other Postretirement Benefit Plans

2019

2018

2019

2018

U.S.

Non-U.S.

U.S.

Non-U.S.

U.S.

Non-U.S.

U.S.

Non-U.S.

Plans

Plans

Plans

Plans

Plans

Plans

Plans

Plans

Change in benefit obligation


Benefit obligation at beginning of year

$

956

$

2,157

$

1,028

$

2,259

$

59

$

$

69

$

Service cost


20


30


23


32


1


2


Interest cost


41


37


39


37


3


2


Participant contributions


6


5


2


2


Plan amendments


(9)


4


Foreign currency exchange rate changes


7


(74)


Settlements/transfers/divestitures


20


(2)


(6)


(3)


1


Actuarial (gain) loss


65


224


(67)


(30)


(9)


Benefits paid


(78)


(73)


(61)


(73)


(6)


(7)


Benefit obligation at end of year

$

1,024

$

2,377

$

956

$

2,157

$

60

$

$

59

$

Change in plan assets

Fair value of plan assets at beginning of year

$

697

$

1,751

$

747

$

1,883

$

$

$

$

Actual return on plan assets


107


224


(27)


(38)


Foreign currency exchange rate changes


11


(62)


Participant contributions


6


5


2


2


Settlement/transfers/divestitures

19

(2)

(6)

(3)

Company contributions


45


43


44


39


4


5


Benefits paid


(78)


(73)


(61)


(73)


(6)


(7)

Fair value of plan assets at end of year

$

790

$

1,960

$

697

$

1,751

$

$

$

$

Funded status

Fair value of plan assets

$

790

$

1,960

$

697

$

1,751

$

$

$

$

Benefit obligation


1,024


2,377


956


2,157


60


59


Accrued benefit cost

$

(234)

$

(417)

$

(259)

$

(406)

$

(60)

$

$

(59)

$

Amounts recognized in balance sheet:

Noncurrent asset

$

$

10

$

$

10

$

$

$

$

Current liability


(5)


(6)


(5)


(6)


(5)


(5)


Noncurrent liability


(229)


(421)


(254)


(410)


(55)


(54)


Total

$

(234)

$

(417)

$

(259)

$

(406)

$

(60)

$

$

(59)

$

F-46

Table of Contents

HUNTSMAN CORPORATION AND SUBSIDIARIES
HUNTSMAN INTERNATIONAL LLC AND SUBSIDIARIES
NOTES TO CONSOLIDATED FINANCIAL STATEMENTS
(Continued)

Huntsman Corporation

Defined Benefit Plans

Other Postretirement Benefit Plans

2019

2018

2019

2018

U.S.

Non-U.S.

U.S.

Non-U.S.

U.S.

Non-U.S.

U.S.

Non-U.S.

Plans

Plans

Plans

Plans

Plans

Plans

Plans

Plans

Amounts recognized in accumulated other comprehensive loss:


Net actuarial loss

$

394

$

840

$

401

$

784

$

20

$

$

21

$

Prior service credit


(11)


(32)


(13)


(27)


(33)


(38)


Total

$

383

$

808

$

388

$

757

$

(13)

$

$

(17)

$

Huntsman International

Defined Benefit Plans

Other Postretirement Benefit Plans

2019

2018

2019

2018

U.S.

Non-U.S.

U.S.

Non-U.S.

U.S.

Non-U.S.

U.S.

Non-U.S.

Plans

Plans

Plans

Plans

Plans

Plans

Plans

Plans

Amounts recognized in accumulated other comprehensive loss:


Net actuarial loss

$

395

$

846

$

402

$

793

$

20

$

$

21

$

Prior service credit


(11)


(31)


(13)


(27)


(33)


(38)


Total

$

384

$

815

$

389

$

766

$

(13)

$

$

(17)

$

The amounts in accumulated other comprehensive loss that are expected to be recognized as components of net periodic benefit cost of continuing operations during the next fiscal year are as follows (dollars in millions):

Huntsman Corporation

Other Postretirement

Defined Benefit Plans

Benefit Plans

Non-U.S.

Non-U.S.

U.S. Plans

Plans

U.S. Plans

Plans

Actuarial loss


$

28


$

53


$

1


$

Prior service credit


(2)


(5)


(5)


Total

$

26

$

48

$

(4)

$

Huntsman International

Other Postretirement

Defined Benefit Plans

Benefit Plans

Non-U.S.

Non-U.S.

U.S. Plans

Plans

U.S. Plans

Plans

Actuarial loss


$

28


$

56


$

1


$

Prior service credit


(2)


(5)


(5)


Total

$

26

$

51

$

(4)

$

F-47

Table of Contents

HUNTSMAN CORPORATION AND SUBSIDIARIES
HUNTSMAN INTERNATIONAL LLC AND SUBSIDIARIES
NOTES TO CONSOLIDATED FINANCIAL STATEMENTS
(Continued)

Components of net periodic benefit costs of continuing operations for the years ended December 31, 2019, 2018 and 2017 were as follows (dollars in millions):

Huntsman Corporation

Defined Benefit Plans

U.S. plans

Non-U.S. plans

2019

2018

2017

2019

2018

2017

Service cost


$

20


$

23


$

22


$

30


$

32


$

33

Interest cost


41


39


39


37


37


35

Expected return on plan assets


(53)


(54)


(48)


(102)


(109)


(100)

Amortization of prior service credit


(2)


(2)


(2)


(4)


(5)


(5)

Amortization of actuarial loss


23


31


27


45


38


45

Settlement loss

2

1

Special termination benefits


1

Net periodic benefit cost (credit)

$

29

$

39

$

38

$

7

$

(7)

$

9

Other Postretirement Benefit Plans

U.S. plans

Non-U.S. plans

2019

2018

2017

2019

2018

2017

Service cost


$

1


$

2


$

2


$


$


$

Interest cost


3


2


3


Amortization of prior service credit


(5)


(5)


(6)


Amortization of actuarial loss


1


2


3


Net periodic benefit cost

$

$

1

$

2

$

$

$

Huntsman International

Defined Benefit Plans

U.S. plans

Non-U.S. plans

2019

2018

2017

2019

2018

2017

Service cost


$

20


$

23


$

22


$

30


$

32


$

33

Interest cost


41


39


39


37


37


35

Expected return on plan assets


(53)


(54)


(48)


(102)


(109)


(100)

Amortization of prior service credit


(2)


(2)


(2)


(4)


(5)


(5)

Amortization of actuarial loss


23


31


27


48


41


48

Settlement loss

2

1

Special termination benefits


1

Net periodic benefit cost (credit)

$

29

$

39

$

38

$

10

$

(4)

$

12

Other Postretirement Benefit Plans

U.S. plans

Non-U.S. plans

2019

2018

2017

2019

2018

2017

Service cost


$

1


$

2


$

2


$


$


$

Interest cost


3


2


3


Amortization of prior service credit


(5)


(5)


(6)


Amortization of actuarial loss


1


2


3


Net periodic benefit cost

$

$

1

$

2

$

$

$

F-48

Table of Contents

HUNTSMAN CORPORATION AND SUBSIDIARIES
HUNTSMAN INTERNATIONAL LLC AND SUBSIDIARIES
NOTES TO CONSOLIDATED FINANCIAL STATEMENTS
(Continued)

The amounts recognized in net periodic benefit cost and other comprehensive income (loss) as of December 31, 2019, 2018 and 2017 were as follows (dollars in millions):

Huntsman Corporation

Defined Benefit Plans

U.S. plans

Non-U.S. plans

2019

2018

2017

2019

2018

2017

Current year actuarial loss (gain)


$

19


$

18


$

42


$

101


$

117


$

(42)

Amortization of actuarial loss


(26)


(34)


(30)


(45)


(38)


(61)

Current year prior service (credits) cost


(10)


4


(2)

Amortization of prior service credit


2


2


2


4


5


4

Settlements

(2)

1

Curtailment (gain)/loss

3

Total recognized in other comprehensive income (loss)


(5)


(16)


14


51


88


(98)

Amounts related to discontinued operations

9

(4)

37

Total recognized in other comprehensive income (loss) in continuing operations

4

(20)

14

51

88

(61)

Net periodic benefit cost


29


39


38


7


(7)


9

Total recognized in net periodic benefit cost and other comprehensive income (loss)

$

33

$

19

$

52

$

58

$

81

$

(52)

Other Postretirement Benefit Plans

U.S. plans

Non-U.S. plans

2019

2018

2017

2019

2018

2017

Current year actuarial loss (gain)


$


$

(10)


$

(12)


$


$


$

Amortization of actuarial loss


(1)


(2)


(3)


(1)

Current year prior service credit


Amortization of prior service credit


5


6


6


2

Total recognized in other comprehensive income (loss)


4


(6)


(9)


1

Amounts related to discontinued operations

(6)

(1)

Total recognized in other comprehensive income (loss) in continuing operations

(2)

(6)

(9)

Net periodic benefit cost


1


2


Total recognized in net periodic benefit cost and other comprehensive income (loss)

$

(2)

$

(5)

$

(7)

$

$

$

F-49

Table of Contents

HUNTSMAN CORPORATION AND SUBSIDIARIES
HUNTSMAN INTERNATIONAL LLC AND SUBSIDIARIES
NOTES TO CONSOLIDATED FINANCIAL STATEMENTS
(Continued)

Huntsman International

Defined Benefit Plans

U.S. plans

Non-U.S. plans

2019

2018

2017

2019

2018

2017

Current year actuarial loss


$

19


$

18


$

42


$

101


$

117


$

(42)

Amortization of actuarial loss


(26)


(34)


(30)


(48)


(41)


(68)

Current year prior service credit


(10)


4


(2)

Amortization of prior service credit


2


2


2


4


5


4

Settlements

(2)

1

Curtailment (gain)/loss

3

Total recognized in other comprehensive income (loss)


(5)


(16)


14


48


85


(105)

Amounts related to discontinued operations

9

(4)

42

Total recognized in other comprehensive income (loss) in continuing operations

4

(20)

14

48

85

(63)

Net periodic benefit cost


29


39


38


10


(4)


12

Total recognized in net periodic benefit cost and other comprehensive income (loss)

$

33

$

19

$

52

$

58

$

81

$

(51)

Other Postretirement Benefit Plans

U.S. plans

Non-U.S. plans

2019

2018

2017

2019

2018

2017

Current year actuarial loss (gain)


$


$

(10)


$

(12)


$


$


$

Amortization of actuarial loss


(1)


(2)


(3)


(1)

Current year prior service credit


Amortization of prior service credit


5


6


6


2

Total recognized in other comprehensive income (loss)


4


(6)


(9)


1

Amounts related to discontinued operations

(6)

(1)

Total recognized in other comprehensive income (loss) in continuing operations

(2)

(6)

(9)

Net periodic benefit cost


1


2


Total recognized in net periodic benefit cost and other comprehensive income (loss)

$

(2)

$

(5)

$

(7)

$

$

$

The following weighted-average assumptions were used to determine the projected benefit obligation at the measurement date and the net periodic pension cost for the year:

Defined Benefit Plans


U.S. plans

Non-U.S. plans


2019

2018

2017

2019

2018

2017


Projected benefit obligation


Discount rate


3.59

%  

4.39

%  

3.74

%  

1.07

%  

1.75

%  

1.65

%  

Rate of compensation increase


4.09

%  

4.10

%  

4.10

%  

2.65

%  

2.95

%  

3.38

%  

Net periodic pension cost

Discount rate


4.39

%  

3.74

%  

4.24

%  

1.75

%  

1.65

%  

1.82

%  

Rate of compensation increase


4.07

%  

4.10

%  

4.14

%  

2.64

%  

3.38

%  

3.51

%  

Expected return on plan assets


7.52

%  

7.52

%  

7.53

%  

5.89

%  

5.88

%  

5.68

%  

F-50

Table of Contents

HUNTSMAN CORPORATION AND SUBSIDIARIES
HUNTSMAN INTERNATIONAL LLC AND SUBSIDIARIES
NOTES TO CONSOLIDATED FINANCIAL STATEMENTS
(Continued)

Other Postretirement Benefit Plans


U.S. plans

Non-U.S. plans


2019

2018

2017

2019

2018

2017


Projected benefit obligation


Discount rate


3.46

%  

4.26

%  

3.58

%  

2.90

%  

3.50

%  

3.30

%

Net periodic pension cost

Discount rate


4.26

%  

3.58

%  

4.04

%  

3.50

%  

3.30

%  

3.50

%

At December 31, 2019 and 2018 the health care trend rate used to measure the expected increase in the cost of benefits was assumed to be 6.50%, decreasing to 5% in 2025 and after. Assumed health care cost trend rates can have a significant effect on the amounts reported for the postretirement benefit plans. A one-percent point change in assumed health care cost trend rates would have the following effects (dollars in millions):


Increase


Decrease

Asset category

Effect on total of service and interest cost

$

$

Effect on postretirement benefit obligation


2


(1)

The projected benefit obligation and fair value of plan assets for the defined benefit plans with projected benefit obligations in excess of plan assets as of December 31, 2019 and 2018 were as follows (dollars in millions):

U.S. plans

Non-U.S. plans

2019

2018

2019

2018

Projected benefit obligation in excess of plan assets


Projected benefit obligation

$

1,024

$

956

$

2,203

$

1,790

Fair value of plan assets


790


697


1,777


1,375

The projected benefit obligation, accumulated benefit obligation and fair value of plan assets for the defined benefit plans with an accumulated benefit obligation in excess of plan assets as of December 31, 2019 and 2018 were as follows (dollars in millions):

U.S. plans

Non-U.S. plans

2019

2018

2019

2018

Accumulated benefit obligation in excess of plan assets


Projected benefit obligation

$

1,024

$

956

$

1,066

$

986

Accumulated benefit obligation


1,019


935


991


919

Fair value of plan assets


790


697


664


608

F-51

Table of Contents

HUNTSMAN CORPORATION AND SUBSIDIARIES
HUNTSMAN INTERNATIONAL LLC AND SUBSIDIARIES
NOTES TO CONSOLIDATED FINANCIAL STATEMENTS
(Continued)

Expected future contributions and benefit payments related to continuing operations are as follows (dollars in millions):

U.S. Plans

Non-U.S. Plans

Other

Other

Defined

Postretirement

Defined

Postretirement

Benefit

Benefit

Benefit

Benefit


Plans


Plans


Plans


Plans

2020 expected employer contributions

To plan trusts

$

45

$

5

$

38

$

Expected benefit payments

2020


59


5


78


2021


62


5


77


2022


65


5


81


2023


69


5


85


2024


98


5


84


2025 - 2029


325


24


447


Our investment strategy with respect to pension assets is to pursue an investment plan that, over the long term, is expected to protect the funded status of the plan, enhance the real purchasing power of plan assets, and not threaten the plan’s ability to meet currently committed obligations. Additionally, our investment strategy is to achieve returns on plan assets, subject to a prudent level of portfolio risk. Plan assets are invested in a broad range of investments. These investments are diversified in terms of domestic and international equities, both growth and value funds, including small, mid and large capitalization equities; short-term and long-term debt securities; real estate; and cash and cash equivalents. The investments are further diversified within each asset category. The portfolio diversification provides protection against a single investment or asset category having a disproportionate impact on the aggregate performance of the plan assets.

Our pension plan assets are managed by outside investment managers. The investment managers value our plan assets using quoted market prices, other observable inputs or unobservable inputs. For certain assets, the investment managers obtain third-party appraisals at least annually, which use valuation techniques and inputs specific to the applicable property, market, or geographic location. During 2019, there were no transfers into or out of Level 3 assets.

We have established target allocations for each asset category. Our pension plan assets are periodically rebalanced based upon our target allocations.

The fair value of plan assets for the pension plans was $2.8 billion and $2.4 billion at December 31, 2019 and 2018, respectively. The following plan assets are measured at fair value on a recurring basis (dollars in millions):

Fair Value Amounts Using

Quoted prices in active

Significant other

Significant

December 31, 

markets for identical

observable inputs

unobservable inputs

Asset category

2019

assets (Level 1)

(Level 2)

(Level 3)

U.S. pension plans:


Equities

$

422

$

283

$

139

$

Fixed income


301


220


81


Real estate/other


67


67

Cash


Total U.S. pension plan assets

$

790

$

503

$

220

$

67

Non-U.S. pension plans:

Equities

$

535

$

228

$

307

$

Fixed income


847


560


287


Real estate/other


505


99


349


57

Cash


73


72


1


Total Non-U.S. pension plan assets

$

1,960

$

959

$

944

$

57

F-52

Table of Contents

HUNTSMAN CORPORATION AND SUBSIDIARIES
HUNTSMAN INTERNATIONAL LLC AND SUBSIDIARIES
NOTES TO CONSOLIDATED FINANCIAL STATEMENTS
(Continued)

Fair Value Amounts Using

Quoted prices in active

Significant other

Significant

December 31, 

Markets for identical

Observable inputs

Unobservable inputs

Asset category

2018

assets (Level 1)

(Level 2)

(Level 3)

U.S. pension plans:


Equities

$

349

$

242

$

107

$

Fixed income


283


212


71


Real estate/other


65


65

Cash


Total U.S. pension plan assets

$

697

$

454

$

178

$

65

Non-U.S. pension plans:

Equities

$

471

$

161

$

310

$

Fixed income


747


496


251


Real estate/other


497


93


348


56

Cash


36


36


Total Non-U.S. pension plan assets

$

1,751

$

786

$

909

$

56

The following table reconciles the beginning and ending balances of plan assets measured at fair value using unobservable inputs (Level 3) (dollars in millions):

Real Estate/Other

Year ended December 31, 

2019

2018

Fair Value Measurements of Plan Assets Using Significant Unobservable Inputs (Level 3)


Balance at beginning of period

$

121

$

117

Return on pension plan assets


4


4

Purchases, sales and settlements


(1)


Transfers into (out of) Level 3


Balance at end of period

$

124

$

121

Based upon historical returns, the expectations of our investment committee and outside advisors, the expected long-term rate of return on the pension assets is estimated to be between 5.68% and 7.53%. The asset allocation for our pension plans at December 31, 2019 and 2018 and the target allocation for 2020, by asset category are as follows:


Target


Allocation

Allocation at December 31, 


Asset category

2020

2019

2018


U.S. pension plans:

Equities


53

%  

54

%  

50

%  

Fixed income


39

%  

38

%  

41

%  

Real estate/other


5

%  

8

%  

9

%  

Cash

3

%  

%  


Total U.S. pension plans


100

%  

100

%  

100

%  

Non-U.S. pension plans:

Equities


31

%  

27

%  

27

%  

Fixed income


44

%  

43

%  

43

%  

Real estate/other


15

%  

26

%  

28

%  

Cash


10

%  

4

%  

2

%  

Total non-U.S. pension plans


100

%  

100

%  

100

%  

Equity securities in our pension plans did not include any direct investments in equity securities of our Company or our affiliates at the end of 2019.

F-53

Table of Contents

HUNTSMAN CORPORATION AND SUBSIDIARIES
HUNTSMAN INTERNATIONAL LLC AND SUBSIDIARIES
NOTES TO CONSOLIDATED FINANCIAL STATEMENTS
(Continued)

Defined Contribution Plans—U.S.

We had a money purchase pension plan that covered substantially all of our domestic employees who were hired prior to January 1, 2004. Employer contributions were made based on a percentage of employees’ earnings (ranging up to 8%). During 2014, we closed this plan to non-union participants, and in 2015, we closed this plan to union associates. We continue to provide equivalent benefits to those who were covered under this plan into their salary deferral account.

We have a salary deferral plan covering substantially all U.S. employees. Plan participants may elect to make voluntary contributions to this plan up to a specified amount of their compensation. We contribute an amount equal to the participant’s contribution, not to exceed 4 % of the participant’s compensation. For new hires who are not eligible for the cash balance plan, and associates who were covered by the money purchase pension plan prior to its closure, we contribute an additional amount into their salary deferral accounts, not to exceed 6% of the participant’s compensation.

Our total combined expense for the above defined contribution plans for each of the years ended December 31, 2019, 2018 and 2017 was $17 million, $16 million and $16 million, respectively.

Defined Contribution Plans—Non-U.S.

We have defined contribution plans in a variety of non-U.S. locations.

All UK associates are eligible to participate in the Huntsman UK Pension Plan, a contract-based arrangement with a third party. Company contributions vary by business during a five-year transition period. Plan participants elect to make voluntary contributions to this plan up to a specified amount of their compensation. We contribute a matching amount not to exceed 12% of the participant’s salary for new hires and 15% of the participant’s salary for all other participants.

Our total combined expense for these defined contribution plans for the years ended December 31, 2019, 2018 and 2017 was $4 million, $4 million and $5 million, respectively, primarily related to the Huntsman UK Pension Plan.

Supplemental Salary Deferral Plan and Supplemental Executive Retirement Plan

The Huntsman Supplemental Savings Plan (the “SSP”) is a non-qualified plan covering key management employees and allows participants to defer amounts that would otherwise be paid as compensation. The participant can defer up to 75% of their salary and bonus each year. This plan also provides benefits that would be provided under the Huntsman Salary Deferral Plan if that plan were not subject to legal limits on the amount of contributions that can be allocated to an individual in a single year. The SSP was amended and restated effective as of January 1, 2005 to allow eligible executive employees to comply with Section 409A of the Internal Revenue Code of 1986.

The Huntsman Supplemental Executive Retirement Plan (the “SERP”) is an unfunded non-qualified pension plan established to provide certain executive employees with benefits that could not be provided, due to legal limitations, under the Huntsman Defined Benefit Pension Plan, a qualified defined benefit pension plan, and the Huntsman Money Purchase Pension Plan, a qualified money purchase pension plan.

Assets of these plans are included in other noncurrent assets and as of December 31, 2019 and 2018 were $39 million and $32 million, respectively. During each of the years ended December 31, 2019, 2018 and 2017, we expensed a total of $1 million as contributions to the SSP and the SERP.

Stock-Based Incentive Plan

On May 5, 2016, our stockholders approved a new Huntsman Corporation 2016 Stock Incentive Plan (the “2016 Stock Incentive Plan”), which reserved 8.2 million shares for issuance. The Huntsman Corporation Stock Incentive Plan, as amended and restated (the “Prior Plan”), remains in effect for outstanding awards granted pursuant to the Prior Plan, but no further awards may be granted under the Prior Plan. Under the 2016 Stock Incentive Plan, we may grant nonqualified stock options, incentive stock options, stock appreciation rights, restricted stock, phantom stock, performance share units and other stock-based awards to our employees, directors and consultants and to employees and consultants of our subsidiaries, provided that incentive stock options may be granted solely to employees. The terms of

F-54

Table of Contents

HUNTSMAN CORPORATION AND SUBSIDIARIES
HUNTSMAN INTERNATIONAL LLC AND SUBSIDIARIES
NOTES TO CONSOLIDATED FINANCIAL STATEMENTS
(Continued)

the grants under both the 2016 Stock Incentive Plan and the Prior Plan are fixed at the grant date. As of December 31, 2019, we had approximately 8 million shares remaining under the 2016 Stock Incentive Plan available for grant. See “Note 24. Stock-Based Compensation Plan.”

International Plans

International employees are covered by various post-employment arrangements consistent with local practices and regulations. Such obligations are included in other long-term liabilities in our consolidated balance sheets.

20. INCOME TAXES

The following is a summary of U.S. and non-U.S. provisions for current and deferred income taxes (dollars in millions):

Huntsman Corporation

Year ended December 31, 

2019

2018

2017

Income tax (benefit) expense:


U.S.

Current

$

(17)

$

57

$

23

Deferred


(181)


(30)


(133)

Non-U.S.

Current


71


153


88

Deferred


89


(135)


42

Total

$

(38)

$

45

$

20

Huntsman International

Year ended December 31, 

2019

2018

2017

Income tax (benefit) expense:


U.S.

Current

$

(21)

$

57

$

16

Deferred


(179)


(34)


(130)

Non-U.S.

Current


70


153


88

Deferred


89


(135)


43

Total

$

(41)

$

41

$

17

F-55

Table of Contents

HUNTSMAN CORPORATION AND SUBSIDIARIES
HUNTSMAN INTERNATIONAL LLC AND SUBSIDIARIES
NOTES TO CONSOLIDATED FINANCIAL STATEMENTS
(Continued)

The following schedule reconciles the differences between the U.S. federal income taxes at the U.S. statutory rate to our provision for income taxes (dollars in millions):

Huntsman Corporation

Year ended December 31, 

2019

2018

2017

Income from continuing operations before income taxes


$

391


$

734


$

531

Expected tax expense at U.S. statutory rate of 21%, 21% and 35%, respectively

$

82

$

154

$

186

Change resulting from:

State tax expense net of federal benefit


(3)


(1)


(2)

Non-U.S. tax rate differentials


9


27


(67)

U.S. Tax Reform Act impact

(1)

32

(52)

Currency exchange gains/losses(net)


(5)


(10)


15

Venator investment basis difference and fair market value adjustments


(199)


18


Tax losses related to Venator investment

(18)


Non-U.S. income subject to U.S. tax not offset by U.S. foreign tax credits


7


16


Tax authority audits and dispute resolutions


(6)


5


9

Share-based compensation excess tax benefits


(4)


(14)


(10)

Change in valuation allowance


56


(185)


(72)

Deferred tax effects of non-U.S. tax rate changes


36


(2)


4

Impact of equity method investments


(13)


(14)


(3)

Other non-U.S. tax effects, including nondeductible expenses transfer pricing adjustments and various withholding taxes


19


19


3

Other U.S. tax effects, including nondeductible expenses and other credits


2


9

Total income tax (benefit) expense

$

(38)

$

45

$

20

F-56

Table of Contents

HUNTSMAN CORPORATION AND SUBSIDIARIES
HUNTSMAN INTERNATIONAL LLC AND SUBSIDIARIES
NOTES TO CONSOLIDATED FINANCIAL STATEMENTS
(Continued)

Huntsman International

Year ended December 31, 

2019

2018

2017

Income from continuing operations before income taxes


$

377


$

716


$

524

Expected tax expense at U.S. statutory rate of 21%, 21% and 35%, respectively

$

79

$

150

$

183

Change resulting from:

State tax expense net of federal benefit


(3)


(1)


(2)

Non-U.S. tax rate differentials


9


27


(67)

U.S. Tax Reform Act impact

(1)

32

(53)

Currency exchange gains/losses(net)


(5)


(10)


15

Venator investment basis difference and fair market value adjustments


(199)


18


Tax losses related to Venator investment

(18)


Non-U.S. income subject to U.S. tax not offset by U.S. foreign tax credits


7


16


Tax authority audits and dispute resolutions


(6)


5


9

Share-based compensation excess tax benefits


(4)


(14)


(10)

Change in valuation allowance


56


(185)


(72)

Deferred tax effects of non-U.S. tax rate changes


36


(2)


4

Impact of equity method investments


(13)


(14)


(3)

Other non-U.S. tax effects, including nondeductible expenses transfer pricing adjustments and various withholding taxes


19


19


4

Other U.S. tax effects, including nondeductible expenses and other credits


2


9

Total income tax (benefit) expense

$

(41)

$

41

$

17

During 2019 and 2018, the average statutory rate for countries with pre-tax income, primarily our operations in China, Germany, India and Luxembourg, was higher than the average statutory rate for countries with pre-tax losses, resulting in a net expense of $9 million and $27 million, respectively, as compared to the 21% U.S. statutory rate reflected in the reconciliation above. During 2017, the average statutory rate for countries with pre-tax income, primarily our Polyurethanes segment in The Netherlands, China and the U.K., as well as our Advanced Materials segment in Switzerland and our Corporate segment in Luxembourg, was lower than the average statutory rate for countries with pre-tax losses, almost all of which had statutory rates lower than the U.S. of 35%, resulting in net benefits as compared to the U.S. statutory rate of $67 million, reflected in the reconciliation above. In certain non-U.S. tax jurisdictions, our U.S. GAAP functional currency is different than the local tax currency. As a result, foreign exchange gains and losses will impact our effective tax rate. For 2019, 2018 and 2017, this resulted in a $5 million tax benefit, a $10 million tax benefit and a $15 million tax expense, respectively.

In 2019, we recorded $199 million of deferred tax assets in connection with our tax basis in our Venator investment being greater than our book basis, which the deferred tax asset was partially offset by a valuation allowance of $46 million (for a net tax benefit of $153 million), as further discussed below. Effective January 1, 2019, Switzerland reduced certain conditional income tax rates resulting in a decrease in our net deferred tax assets and a corresponding noncash income tax expense of $32 million for the year ended December 31, 2019.

The U.S. Tax Reform Act established new tax laws that affected 2019 and 2018, including, but not limited to, a reduction of the U.S. federal corporate tax rate and the creation of the BEAT and GILTI provisions. Under U.S. GAAP, we have elected to treat the GILTI as a current-period expense when incurred.

The stated purpose of the GILTI rules is to generate additional U.S. tax related to income in non-U.S. jurisdictions which incur less than a blended 13.125% non-U.S. tax rate. Our non-U.S. income is subject to a blended rate greater than 13.125%; however, in practice, the GILTI regulations result in additional tax liability as a result of

F-57

Table of Contents

HUNTSMAN CORPORATION AND SUBSIDIARIES
HUNTSMAN INTERNATIONAL LLC AND SUBSIDIARIES
NOTES TO CONSOLIDATED FINANCIAL STATEMENTS
(Continued)

expense allocations which limit the ability to utilize foreign tax credits against the GILTI inclusion. For 2019 and 2018 we have incurred $ 7 million and $16 million of tax expense resulting from these expense allocations.

We recorded a net tax benefit of $20 million over 2017 and 2018 related to enactment of the U.S. Tax Reform Act. As a result of the U.S. Tax Reform Act, we recorded a net tax benefit of $135 million due to remeasurement of deferred U.S. tax assets and liabilities (including a provisional tax benefit of $137 million in 2017 offset by a final tax expense of $2 million in 2018), offset by a tax expense of $115 million due to the transition tax on deemed repatriation of deferred foreign income (including a provisional tax expense of $85 million in 2017 and a $30 million remeasurement period adjustment in 2018). We did not make the election to reclassify the income tax effects of the U.S. Tax Reform Act from accumulated other comprehensive income to retained earnings.

The components of income (loss) from continuing operations before income taxes were as follows (dollars in millions):

Huntsman Corporation

Year ended December 31, 

2019

2018

2017

U.S.


$

(106)


$

(38)


$

(143)

Non-U.S.


497


772


674

Total

$

391

$

734

$

531

Huntsman International

Year ended December 31, 

2019

2018

2017

U.S.


$

(120)


$

(56)


$

(150)

Non-U.S.


497


772


674

Total

$

377

$

716

$

524

F-58

Table of Contents

HUNTSMAN CORPORATION AND SUBSIDIARIES
HUNTSMAN INTERNATIONAL LLC AND SUBSIDIARIES
NOTES TO CONSOLIDATED FINANCIAL STATEMENTS
(Continued)

Components of deferred income tax assets and liabilities were as follows (dollars in millions):

Huntsman Corporation

December 31, 

2019

2018

Deferred income tax assets:


Net operating loss carryforwards

$

281

$

359

Pension and other employee compensation


172


180

Property, plant and equipment


15


15

Intangible assets


56


76

Basis difference in Venator investment

199

Operating leases

98

Other, net


72


50

Total

$

893

$

680

Deferred income tax liabilities:

Property, plant and equipment

$

(218)

$

(199)

Pension and other employee compensation


(1)


Intangible assets

(27)

(33)

Unrealized currency gains

(43)

(37)

Operating leases

(102)

Other, net


(8)


(9)

Total

$

(399)

$

(278)

Net deferred tax asset before valuation allowance

$

494

$

402

Valuation allowance—net operating losses and other


(231)


(215)

Net deferred tax asset

$

263

$

187

Non-current deferred tax asset


292


324

Non-current deferred tax liability


(29)


(137)

Net deferred tax asset

$

263

$

187

F-59

Table of Contents

HUNTSMAN CORPORATION AND SUBSIDIARIES
HUNTSMAN INTERNATIONAL LLC AND SUBSIDIARIES
NOTES TO CONSOLIDATED FINANCIAL STATEMENTS
(Continued)

Huntsman International

December 31, 

2019

2018

Deferred income tax assets:


Net operating loss carryforwards

$

281

$

359

Pension and other employee compensation


172


180

Property, plant and equipment


15


15

Intangible assets


56


76

Basis difference in Venator investment

199

Operating leases

98

Other, net


72


50

Total

$

893

$

680

Deferred income tax liabilities:

Property, plant and equipment

$

(218)

$

(199)

Pension and other employee compensation


(1)


Intangible assets

(27)

(33)

Unrealized currency gains

(43)

(37)

Operating leases

(102)

Other, net


(8)


(7)

Total

$

(399)

$

(276)

Net deferred tax asset before valuation allowance

$

494

$

404

Valuation allowance—net operating losses and other


(231)


(215)

Net deferred tax asset

$

263

$

189

Non-current deferred tax asset


292


324

Non-current deferred tax liability


(29)


(135)

Net deferred tax asset

$

263

$

189

We evaluate deferred tax assets to determine whether it is more likely than not that they will be realized. Valuation allowances are reviewed each period on a tax jurisdiction by jurisdiction basis to analyze whether there is sufficient positive or negative evidence to support a change in judgment about the realizability of the related deferred tax assets. These conclusions require significant judgment. In evaluating the objective evidence that historical results provide, we consider the cyclicality of businesses and cumulative income or losses during the applicable period. Cumulative losses incurred over the period limits our ability to consider other subjective evidence such as our projections for the future. Our judgments regarding valuation allowances are also influenced by the costs and risks associated with any tax planning idea associated with utilizing a deferred tax asset.

We have gross net operating losses (“NOLs”) of $1,185 million in various non-U.S. jurisdictions. While the majority of the non-U.S. NOLs have no expiration date, $175 million have a limited life (of which $162 million are subject to a valuation allowance) and $88 million are scheduled to expire in 2020 (of which $87 million are subject to a valuation allowance). We had $111 million and $91 million of  NOLs expire unused in 2019 and 2018, respectively, all of which were subject to a valuation allowance.

Included in the $1,185 million of gross non-U.S. NOLs is $581 million attributable to our Luxembourg entities. As of December 31, 2019 due to the uncertainty surrounding the realization of the benefits of these losses, there is a valuation allowance of $92 million against these net tax-effected NOLs of $145 million.

During 2019, based on our expectation that our remaining interest in Venator will be sold on or before December 31, 2023, we recorded $153 million of deferred tax benefit relating to the portion of the $199 million tax basis greater than book basis in our Venator investment. We expect to be able to utilize such future capital losses on our Venator investment against capital gains anticipated on the sale of our Chemical Intermediates Businesses. We established a valuation allowance of $46 million on the excess unrealizable built-in capital loss deferred tax asset. We also realized $18 million of tax benefit relating to realized tax losses on our investment in Venator. During 2019, we also

F-60

Table of Contents

HUNTSMAN CORPORATION AND SUBSIDIARIES
HUNTSMAN INTERNATIONAL LLC AND SUBSIDIARIES
NOTES TO CONSOLIDATED FINANCIAL STATEMENTS
(Continued)

established $11 million of valuation allowances on the remaining Australia NOLs that are no longer more-likely-than-not realizable following the sale of the Australia portion of the Chemical Intermediates Businesses.

During 2018, we released valuation allowances of $132 million. We released significant valuation allowances on certain net deferred tax assets in Switzerland based upon the increased and sustained profitability in our Advanced Materials and Textile Effects businesses. Given Switzerland’s limited seven-year carryover of NOLs, we expect that some of our NOLs will expire unused. Therefore, we recorded a partial release of the valuation allowance of $80 million in the second quarter of 2018. In addition, based upon the separation of Venator from our U.K. combined group and the increased and sustained profitability in our Polyurethanes business in the U.K., we released significant valuation allowances on certain net deferred tax assets in the U.K. Because the U.K. places limitations on the utilization of certain NOLs and limitations on other deferred tax assets, we recorded a partial valuation allowance release of $15 million in the second quarter of 2018. We also released $24 million of significant valuation allowances on certain net deferred tax assets in Luxembourg in the third quarter of 2018 as a result of changes in estimated future taxable income resulting from increased intercompany receivables and, therefore, increased income in Luxembourg, our primary treasury center outside of the U.S. We also had miscellaneous non-significant valuation allowance releases totaling $13 million in 2018.

During 2017, we released valuation allowances of $22 million. In Italy, we released valuation allowances of $7 million on certain net deferred assets of our Polyurethanes business. On March 1, 2017 and April 1, 2017, we de-merged the Italian legal entities containing our Polyurethanes business from our combined Italian tax group. The historical and expected continued profitability of those Polyurethanes businesses resulted in the release of the associated valuation allowance. In Luxembourg, we released valuation allowances of $15 million as a result of changes in estimated future taxable income resulting from increased intercompany receivables and, therefore, increased income in Luxembourg, our primary treasury center outside of the U.S.

Uncertainties regarding expected future income in certain jurisdictions could affect the realization of deferred tax assets in those jurisdictions and result in additional valuation allowances in future periods, or, in the case of unexpected pre-tax earnings, the release of valuation allowances in future periods.

The following is a summary of changes in the valuation allowance (dollars in millions):

Huntsman Corporation


2019


2018


2017

Valuation allowance as of January 1

$

215

$

412

$

484

Valuation allowance as of December 31


231


215


412

Net (increase) decrease


(16)


197


72

Foreign currency movements


3


11

(Decrease) increase to deferred tax assets with no impact on operating tax expense, including an offsetting (decrease) increase to valuation allowances


(40)


(15)


(11)

Change in valuation allowance per rate reconciliation

$

(56)

$

185

$

72

Components of change in valuation allowance affecting tax expense:

Pre-tax income and losses in jurisdictions with valuation allowances resulting in no tax expense or benefit

$

(133)

$

53

$

50

Releases of valuation allowances in various jurisdictions


132


22

Establishments of valuation allowances in various jurisdictions


77


Change in valuation allowance per rate reconciliation

$

(56)

$

185

$

72

F-61

Table of Contents

HUNTSMAN CORPORATION AND SUBSIDIARIES
HUNTSMAN INTERNATIONAL LLC AND SUBSIDIARIES
NOTES TO CONSOLIDATED FINANCIAL STATEMENTS
(Continued)

Huntsman International


2019


2018


2017

Valuation allowance as of January 1

$

215

$

412

$

487

Valuation allowance as of December 31


231


215


412

Net (increase) decrease


(16)


197


75

Foreign currency movements


3


11

(Decrease) increase to deferred tax assets with no impact on operating tax expense, including an offsetting (decrease) increase to valuation allowances


(40)


(15)


(14)

Change in valuation allowance per rate reconciliation

$

(56)

$

185

$

72

Components of change in valuation allowance affecting tax expense:

Pre-tax income and losses in jurisdictions with valuation allowances resulting in no tax expense or benefit

$

(133)

$

53

$

49

Releases of valuation allowances in various jurisdictions


132


23

Establishments of valuation allowances in various jurisdictions


77


Change in valuation allowance per rate reconciliation

$

(56)

$

185

$

72

The following is a reconciliation of our unrecognized tax benefits (dollars in millions):


2019


2018

Unrecognized tax benefits as of January 1

$

26

$

23

Gross increases and decreases—tax positions taken during a prior period


4


1

Gross increases and decreases—tax positions taken during the current period


1


3

Decreases related to settlements of amounts due to tax authorities


Reductions resulting from the lapse of statutes of limitation


(4)


Foreign currency movements


1


(1)

Unrecognized tax benefits as of December 31

$

28

$

26

As of December 31, 2019 and 2018, the amount of unrecognized tax benefits (not including interest and penalty expense) which, if recognized, would affect the effective tax rate is $15 million and $23 million, respectively.

During 2019, we concluded and settled tax examinations in the U.S. (federal and various states). During 2018, we concluded and settled tax examinations in various jurisdictions including but not limited to, Egypt and the U.S. (federal and various states). During 2017, we concluded and settled tax examinations in various jurisdictions, including, but not limited to, China and the U.S. (various states).

During 2019 for unrecognized tax benefits that impact tax expense, we recorded a net decrease in unrecognized tax benefits with a corresponding income tax benefit (not including interest and penalty expense) of $10 million. During 2018 and 2017, for unrecognized tax benefits that impact tax expense, we recorded a net increase in unrecognized tax benefits with a corresponding income tax expenses (not including interest and penalty expense) of $5 million and $9 million, respectively.

F-62

Table of Contents

HUNTSMAN CORPORATION AND SUBSIDIARIES
HUNTSMAN INTERNATIONAL LLC AND SUBSIDIARIES
NOTES TO CONSOLIDATED FINANCIAL STATEMENTS
(Continued)

In accordance with our accounting policy, we continue to recognize interest and penalties accrued related to unrecognized tax benefits in income tax expense.

Year ended December 31, 

2019

2018

2017

Interest expense included in tax expense


$

2


$


$

Penalties expense included in tax expense


2


December 31, 

2019

2018

Accrued liability for interest


$

5


$

3

Accrued liability for penalties


2


We conduct business globally and, as a result, we file income tax returns in U.S. federal, various U.S. state and various non-U.S. jurisdictions. The following table summarizes the tax years that remain subject to examination by major tax jurisdictions:

Tax Jurisdiction


Open Tax Years

Belgium


2017 and later

China


2009 and later

Germany


2014 and later

Hong Kong


2013 and later

India


2004 and later

Italy


2015 and later

Mexico


2014 and later

Switzerland


2013 and later

The Netherlands


2016 and later

Thailand

2012 and later

United Kingdom


2017 and later

United States federal


2017 and later

Certain of our U.S. and non-U.S. income tax returns are currently under various stages of audit by applicable tax authorities and the amounts ultimately agreed upon in resolution of the issues raised may differ materially from the amounts accrued.

We estimate that it is reasonably possible that certain of our non-U.S. unrecognized tax benefits could change within 12 months of the reporting date with a resulting decrease in the unrecognized tax benefits within a reasonably possible range of $12 million to $14 million. For the 12-month period from the reporting date, we would expect that a substantial portion of the decrease in our unrecognized tax benefits would not result in a corresponding benefit to our income tax expense.

The U.S. Tax Reform Act included a mandatory one-time tax on accumulated earnings of foreign subsidiaries, and as a result, all previously unremitted earnings for which no U.S. deferred tax liability had been accrued have now been subject to U.S. tax. For subsidiaries with local withholding taxes, we intend to continue to invest most of these earnings indefinitely within the local country and do not expect to incur any significant, additional taxes related to such amounts.

21. COMMITMENTS AND CONTINGENCIES

Purchase Commitments

We have various purchase commitments extending through 2039 for materials, supplies and services entered into in the ordinary course of business. Included in the purchase commitments table below are contracts which require minimum volume purchases that extend beyond one year or are renewable annually and have been renewed for 2019. Certain contracts allow for changes in minimum required purchase volumes in the event of a temporary or permanent

F-63

Table of Contents

HUNTSMAN CORPORATION AND SUBSIDIARIES
HUNTSMAN INTERNATIONAL LLC AND SUBSIDIARIES
NOTES TO CONSOLIDATED FINANCIAL STATEMENTS
(Continued)

shutdown of a facility. To the extent the contract requires a minimum notice period, such notice period has been included in the table below. The contractual purchase prices for substantially all of these contracts are variable based upon market prices, subject to annual negotiations. We have estimated our contractual obligations by using the terms of our current pricing for each contract. We also have a limited number of contracts which require a minimum payment even if no volume is purchased. We believe that all of our purchase obligations will be utilized in our normal operations. We made minimum payments of $1 million, nil and nil for the years ended December 31, 2019, 2018 and 2017, respectively, under such take or pay contracts without taking the product.

Total purchase commitments as of December 31, 2019 are as follows (dollars in millions):

Year ending December 31,


2020

$

1,364

2021


905

2022


751

2023


424

2024


416

Thereafter


1,894

$

5,754

Legal Matters

We are a party to various other proceedings instituted by private plaintiffs, governmental authorities and others arising under provisions of applicable laws, including various environmental, products liability and other laws. Except as otherwise disclosed in this report, we do not believe that the outcome of any of these matters will have a material effect on our financial condition, results of operations or liquidity.

22. ENVIRONMENTAL, HEALTH AND SAFETY MATTERS

EHS Capital Expenditures

We may incur future costs for capital improvements and general compliance under EHS laws, including costs to acquire, maintain and repair pollution control equipment. For the years ended December 31, 2019, 2018 and 2017, our capital expenditures for EHS matters totaled $42 million, $32 million and $32 million, respectively. Because capital expenditures for these matters are subject to evolving regulatory requirements and depend, in part, on the timing, promulgation and enforcement of specific requirements, our capital expenditures for EHS matters have varied significantly from year to year and we cannot provide assurance that our recent expenditures are indicative of future amounts we may spend related to EHS and other applicable laws.

Environmental Reserves

We have accrued liabilities relating to anticipated environmental cleanup obligations, site reclamation and closure costs and known penalties. Liabilities are recorded when potential liabilities are either known or considered probable and can be reasonably estimated. Our liability estimates are calculated using present value techniques as appropriate and are based upon requirements placed upon us by regulators, available facts, existing technology and past experience. The environmental liabilities do not include amounts recorded as asset retirement obligations. We had accrued $4 million and $5 million for environmental liabilities as of December 31, 2019 and 2018, respectively. Of these amounts, $1 million and $2 million were classified as accrued liabilities in our consolidated balance sheets as of December 31, 2019 and 2018, respectively, and $3 million were classified as other noncurrent liabilities in our consolidated balance sheets for both December 31, 2019 and 2018. In certain cases, our remediation liabilities may be payable over periods of up to 30 years. We may incur losses for environmental remediation in excess of the amounts accrued; however, we are not able to estimate the amount or range of such potential excess.

F-64

Table of Contents

HUNTSMAN CORPORATION AND SUBSIDIARIES
HUNTSMAN INTERNATIONAL LLC AND SUBSIDIARIES
NOTES TO CONSOLIDATED FINANCIAL STATEMENTS
(Continued)

Environmental Matters

Under the Comprehensive Environmental Response, Compensation, and Liability Act (“CERCLA”) and similar state laws, a current or former owner or operator of real property in the U.S. may be liable for remediation costs regardless of whether the release or disposal of hazardous substances was in compliance with law at the time it occurred, and a current owner or operator may be liable regardless of whether it owned or operated the facility at the time of the release. Outside the U.S., analogous contaminated property laws, such as those in effect in France and Australia, can hold past owners and/or operators liable for remediation at former facilities. Currently, there are approximately six former facilities or third-party sites in the U.S. for which we have been notified of potential claims against us for cleanup liabilities, including, but not limited to, sites listed under CERCLA. Based on current information and past experiences at other CERCLA sites, we do not expect these third-party claims to have a material impact on our consolidated financial statements.

Under the Resource Conservation and Recovery Act (“RCRA”) in the U.S. and similar state laws, we may be required to remediate contamination originating from our properties as a condition to our hazardous waste permit. Some of our manufacturing sites have an extended history of industrial chemical manufacturing and use, including on-site waste disposal. We are aware of soil, groundwater or surface contamination from past operations at some of our sites, and we may find contamination at other sites in the future. For example, our Port Neches, Texas, and Geismar, Louisiana, facilities are the subject of ongoing remediation requirements imposed under RCRA. Similar laws exist in a number of locations in which we currently operate, or previously operated, manufacturing facilities, such as Australia, India, France, Hungary and Italy.

North Maybe Mine Remediation

The North Maybe Canyon Mine site is a CERCLA site and involves a former phosphorous mine near Soda Springs, Idaho, which is believed to have been operated by several companies, including a predecessor company to us. In 2004, the U.S. Forest Service notified us that we are a CERCLA potentially responsible party (“PRP”) for contamination originating from the site. In February 2010, we and Wells Cargo (another PRP) agreed to conduct a Remedial Investigation/Feasibility Study of a portion of the site and are currently engaged in that process. At this time, we are unable to reasonably estimate our potential liabilities at this site.

23. HUNTSMAN CORPORATION STOCKHOLDERS’ EQUITY

Share Repurchase Program

On February 7, 2018 and on May 3, 2018, our Board of Directors authorized us to repurchase up to an additional $950 million in shares of our common stock in addition to the $50 million remaining under our September 2015 share repurchase authorization. The share repurchase program will be supported by our free cash flow generation. Repurchases may be made through the open market, including through accelerated share repurchase programs, or in privately negotiated transactions, and repurchases may be commenced or suspended from time to time without prior notice. Shares of common stock acquired through the repurchase program are held in treasury at cost. During the year ended December 31, 2019, we repurchased 10,099,892 of our common stock for approximately $208 million, excluding commissions, under the repurchase program. From January 1, 2020 through January 31, 2020, we repurchased an additional 336,478 shares of our common stock for approximately $7 million, excluding commissions.

F-65

Table of Contents

HUNTSMAN CORPORATION AND SUBSIDIARIES
HUNTSMAN INTERNATIONAL LLC AND SUBSIDIARIES
NOTES TO CONSOLIDATED FINANCIAL STATEMENTS
(Continued)

Dividends on Common Stock

The following tables represent dividends on common stock for our Company for the years ended December 31, 2019 and 2018 (dollars in millions, except per share payment amounts):

2019

Approximate

Per share

amount

Quarter ended

payment amount

paid

March 31, 2019


$

0.1625


$

39

June 30, 2019


0.1625


38

September 30, 2019


0.1625


38

December 31, 2019


0.1625


35

2018

Approximate

Per share

amount

Quarter ended

payment amount

paid

March 31, 2018


$

0.1625


$

39

June 30, 2018


0.1625


39

September 30, 2018


0.1625


39

December 31, 2018


0.1625


39

24. STOCK-BASED COMPENSATION PLAN

Under the 2016 Stock Incentive Plan, we may grant nonqualified stock options, incentive stock options, stock appreciation rights, restricted stock, phantom stock, performance share units and other stock-based awards to our employees, directors and consultants and to employees and consultants of our subsidiaries, provided that incentive stock options may be granted solely to employees. The terms of the grants under both the 2016 Stock Incentive Plan and the Prior Plan are fixed at the grant date. Initially, there were approximately 8.2 million shares available for issuance under the 2016 Stock Incentive Plan. However, the number of shares available for issuance may be adjusted to include any shares surrendered, exchanged, forfeited or settled in cash pursuant to the Prior Plan. As of December 31, 2019, we had approximately 8 million shares remaining under the 2016 Stock Incentive Plan available for grant. Option awards have a maximum contractual term of 10 years and generally must have an exercise price at least equal to the market price of our common stock on the date the option award is granted. Outstanding stock-based awards generally vest over a three-year period.

The compensation cost under the 2016 Stock Incentive Plan and the Prior Plan for our Company and Huntsman International were as follows (dollars in millions):

Year ended December 31, 

2019


2018


2017

Huntsman Corporation compensation cost

$

29

$

27

$

36

Huntsman International compensation cost

28

26

35

The total income tax benefit recognized in the statement of operations for stock-based compensation arrangements was $8 million, $18 million and $18 million for the years ended December 31, 2019, 2018 and 2017, respectively.

Stock Options

The fair value of each stock option award is estimated on the date of grant using the Black-Scholes valuation model that uses the assumptions noted in the following table. Expected volatilities are based on the historical volatility of our common stock through the grant date. The expected term of options granted was estimated based on the contractual term of the instruments and employees’ expected exercise and post-vesting employment termination behavior. The risk-free rate for periods within the contractual life of the option was based on the U.S. Treasury yield curve in effect at

F-66

Table of Contents

HUNTSMAN CORPORATION AND SUBSIDIARIES
HUNTSMAN INTERNATIONAL LLC AND SUBSIDIARIES
NOTES TO CONSOLIDATED FINANCIAL STATEMENTS
(Continued)

the time of grant. The assumptions noted below represent the weighted averages of the assumptions utilized for all stock options granted during the year.

Year ended December 31, 

2019

2018

2019

Dividend yield

2.9

%

1.6

%

2.4

%

Expected volatility

54.0

%

55.2

%

56.9

%

Risk-free interest rate

2.5

%

2.6

%

2.0

%

Expected life of stock options granted during the period

5.9

years

5.9

years

5.9

years

A summary of stock option activity under the 2016 Stock Incentive Plan and the Prior Plan as of December 31, 2019 and changes during the year then ended is presented below:

Weighted

Weighted

Average

Average

Remaining

Aggregate

Exercise

Contractual

Intrinsic

Option Awards


Shares


Price


Term


Value

(in thousands)

(years)

(in millions)

Outstanding at January 1, 2019


4,545

$

17.81

Granted

896

22.66

Exercised

(366)

11.19

Forfeited

(50)

25.59

Outstanding at December 31, 2019

5,025

19.08

6.2

$

30

Exercisable at December 31, 2019

3,600

16.90

5.3

27

The weighted-average grant-date fair value of stock options granted during 2019, 2018 and 2017 was $9.27, $15.20 and $9.26 per option, respectively. As of December 31, 2019, there was $8 million of total unrecognized compensation cost related to nonvested stock option arrangements granted under the 2016 Stock Incentive Plan and the Prior Plan. That cost is expected to be recognized over a weighted-average period of approximately 1.8 years.

During the years ended December 31, 2019, 2018 and 2017, the total intrinsic value of stock options exercised was approximately $4 million, $78 million and $48 million, respectively. Cash received from stock options exercised during the years ended December 31, 2019, 2018 and 2017 was approximately $2 million, $17 million and $35 million, respectively. The cash tax benefit from stock options exercised during the years ended December 31, 2019, 2018 and 2017 was approximately $1 million, $17 million, and $15 million, respectively.

Nonvested Shares

Nonvested shares granted under the 2016 Stock Incentive Plan and the Prior Plan consist of restricted stock and performance share unit awards, which are accounted for as equity awards, and phantom stock, which is accounted for as a liability award because it can be settled in either stock or cash.

The fair value of each performance share unit award is estimated using a Monte Carlo simulation model that uses various assumptions, including an expected volatility rate and a risk-free interest rate. For the years ended December 31, 2019, 2018 and 2017, the weighted-average expected volatility rate was 34.6%, 44.3% and 45.0%, respectively, and the weighted average risk-free interest rate was 2.5%, 2.3% and 1.5%, respectively. For the performance share unit awards granted during the years ended December 31, 2019, 2018 and 2017, the number of shares earned varies based upon the Company achieving certain performance criteria over a three-year performance period. The performance criteria are total stockholder return of our common stock relative to the total stockholder return of a specified industry peer group for the three-year performance periods.

F-67

Table of Contents

HUNTSMAN CORPORATION AND SUBSIDIARIES
HUNTSMAN INTERNATIONAL LLC AND SUBSIDIARIES
NOTES TO CONSOLIDATED FINANCIAL STATEMENTS
(Continued)

A summary of the status of our nonvested shares as of December 31, 2019 and changes during the year then ended is presented below:

Equity Awards

Liability Awards

Weighted

Weighted

Average

Average

Grant-Date

Grant-Date


Shares


Fair Value


Shares


Fair Value

(in thousands)

(in thousands)

Nonvested at January 1, 2019

1,923

$

19.08

504

$

20.66

Granted

709

24.60

256

22.64

Vested

(974)

(1)(2)

13.65

(313)

16.32

Forfeited

(18)

26.29

(20)

25.33

Nonvested at December 31, 2019

1,640

24.61

427

24.80

(1)As of December 31, 2019, a total of 389,095 restricted stock units were vested but not yet issued, of which 30,486 vested during 2019. These shares have not been reflected as vested shares in this table because, in accordance with the restricted stock unit agreements, shares of common stock are not issued for vested restricted stock units until termination of employment.
(2)A total of 412,246 performance share unit awards are reflected in the vested shares in this table, which represents the target number of performance share unit awards for this grant and were included in the balance at December 31, 2018. During the year ended December 31, 2019, an additional 357,006 performance share unit awards with a grant date fair value of $10.22 vested above the target in accordance the performance criteria of these awards.

As of December 31, 2019, there was $22 million of total unrecognized compensation cost related to nonvested share compensation arrangements granted under the Stock Incentive Plan and the Prior Plan. That cost is expected to be recognized over a weighted-average period of approximately 1.8 years. The value of share awards that vested during the years ended December 31, 2019, 2018 and 2017 was $24 million, $24 million and $22 million, respectively.

F-68

Table of Contents

HUNTSMAN CORPORATION AND SUBSIDIARIES
HUNTSMAN INTERNATIONAL LLC AND SUBSIDIARIES
NOTES TO CONSOLIDATED FINANCIAL STATEMENTS
(Continued)

25. OTHER COMPREHENSIVE (LOSS) INCOME

Other comprehensive loss consisted of the following (dollars in millions):

Huntsman Corporation


Pension and


Other


Foreign

other

comprehensive

Amounts

Amounts

currency

postretirement

income of

attributable to

attributable to

translation

benefits

unconsolidated

noncontrolling

Huntsman

adjustment(a)

adjustments(b)

affiliates

Other, net

Total

interests

Corporation

Beginning balance, January 1, 2019

$

(371)

$

(994)

$

8

$

5

$

(1,352)

$

36

$

(1,316)

Other comprehensive (loss) income before reclassifications, gross

(112)

(1)

(113)

5

(108)

Tax benefit

2

25

27

27

Amounts reclassified from accumulated other comprehensive loss, gross(c)

62

62

62

Tax expense

(12)

(12)

(12)

Net current-period other comprehensive (loss) income

2

(37)

(1)

(36)

5

(31)

Acquisition of noncontrolling interest

(15)

(15)

Ending balance, December 31, 2019

$

(369)

$

(1,031)

$

8

$

4

$

(1,388)

$

26

$

(1,362)

(a)Amounts are net of tax of $68 and $71 as of December 31, 2019 and January 1, 2019, respectively.
(b)Amounts are net of tax of $148 and $135 as of December 31, 2019 and January 1, 2019, respectively.
(c)See table below for details about these reclassifications.


Pension and


Other


Foreign

other

comprehensive

Amounts

Amounts

currency

postretirement

income of

attributable to

attributable to

translation

benefits

unconsolidated

noncontrolling

Huntsman

adjustment(a)

adjustments(b)

affiliates

Other, net

Total

interests

Corporation

Beginning balance, January 1, 2018

$

(249)

$

(1,189)

$

3

$

24

$

(1,411)

$

143

$

(1,268)

Cumulative effect of changes in fair value of equity investments

(10)

(10)

(10)

Revised beginning balance, January 1, 2018

(249)

(1,189)

3

14

(1,421)

143

(1,278)

Other comprehensive (loss) income before reclassifications, gross

(186)

(130)

(316)

47

(269)

Tax expense (benefit)

(6)

27

(3)

18

18

Amounts reclassified from accumulated other comprehensive loss, gross(c)

77

77

77

Tax expense

(13)

(6)

(19)

(19)

Net current-period other comprehensive (loss) income

(192)

(39)

(9)

(240)

47

(193)

Disposition of a portion of Venator

(5)

(5)

Deconsolidation of Venator

70

285

5

360

(149)

211

Tax expense

(51)

(51)

(51)

Ending balance, December 31, 2018

$

(371)

$

(994)

$

8

$

5

$

(1,352)

$

36

$

(1,316)

(a)Amounts are net of tax of $71 and $65 as of December 31, 2018 and January 1, 2018, respectively.
(b)Amounts are net of tax of $135 and $172 as of December 31, 2018 and January 1, 2018, respectively.
(c)See table below for details about these reclassifications.

F-69

Table of Contents

HUNTSMAN CORPORATION AND SUBSIDIARIES
HUNTSMAN INTERNATIONAL LLC AND SUBSIDIARIES
NOTES TO CONSOLIDATED FINANCIAL STATEMENTS
(Continued)

Amounts reclassified

from accumulated

other

comprehensive loss

Affected line item in

Details about Accumulated Other

Year ended December 31,

where net income

Comprehensive Loss Components(a):


2019

2018

2017


is presented

Amortization of pension and other postretirement benefits:

Prior service credit

$

(11)

$

(12)

$

(15)

(b)

Settlement loss

1

2

Actuarial loss

72

87

95

(b)(c)

62

77

80

Total before tax

(12)

(13)

(14)

Income tax expense

Total reclassifications for the period

$

50

$

64

$

66

Net of tax

(a)

Pension and other postretirement benefits amounts in parentheses indicate credits on our consolidated statements of operations.

(b)

These accumulated other comprehensive loss components are included in the computation of net periodic pension costs. See “Note 19. Employee Benefit Plans.”

(c)

Amounts contain approximately $7, $22 and $22 of prior service credit and actuarial loss related to discontinued operations for the years ended December 31, 2019, 2018 and 2017, respectively.

Huntsman International


Foreign
currency
translation
adjustment(a)


Pension
and other
postretirement
benefits
adjustments(b)


Other
comprehensive
income of
unconsolidated
affiliates


Other, net


Total


Amounts
attributable to
noncontrolling
interests


Amounts
attributable to
Huntsman
International

Beginning balance, January 1, 2019


$

(376)


$

(977)


$

8


$

1


$

(1,344)


$

36


$

(1,308)

Other comprehensive (loss) income before reclassifications, gross

(113)

(1)

(114)

5

(109)

Tax benefit

2

25

27

27

Amounts reclassified from accumulated other comprehensive loss, gross(c)

65

65

65

Tax expense

(12)

(12)

(12)

Net current-period other comprehensive (loss) income

2

(35)

(1)

(34)

5

(29)

Acquisition of noncontrolling interest

(15)

(15)

Ending balance, December 31, 2019

$

(374)

$

(1,012)

$

8

$

$

(1,378)

$

26

$

(1,352)

(a)Amounts are net of tax of $55 and $57 as of December 31, 2019 and January 1, 2019, respectively.
(b)Amounts are net of tax of $174 and $161 as of December 31, 2019 and January 1, 2019, respectively.
(c)See table below for details about these reclassifications.


Foreign
currency
translation
adjustment(a)


Pension
and other
postretirement
benefits
adjustments(b)


Other
comprehensive
income of
unconsolidated
affiliates


Other, net


Total


Amounts
attributable to
noncontrolling
interests


Amounts
attributable to
Huntsman
International

Beginning balance, January 1, 2018


$

(252)


$

(1,174)


$

3


$

17


$

(1,406)


$

143


$

(1,263)

Cumulative effect of changes in fair value of equity investments

(10)

(10)

(10)

Revised beginning balance, January 1, 2018

(252)

(1,174)

3

7

(1,416)

143

(1,273)

Other comprehensive (loss) income before reclassifications, gross

(188)

(130)

(318)

47

(271)

Tax expense (benefit)

(6)

27

(1)

20

20

Amounts reclassified from accumulated other comprehensive loss, gross(c)

80

80

80

Tax expense

(14)

(5)

(19)

(19)

Net current-period other comprehensive (loss) income

(194)

(37)

(6)

(237)

47

(190)

Disposition of a portion of Venator

(5)

(5)

Deconsolidation of Venator

70

285

5

360

(149)

211

Tax expense

(51)

(51)

(51)

Ending balance, December 31, 2018

$

(376)

$

(977)

$

8

$

1

$

(1,344)

$

36

$

(1,308)

(a)Amounts are net of tax of $57 and $51 as of December 31, 2018 and January 1, 2018, respectively.
(b)Amounts are net of tax of $161 and $199 as of December 31, 2018 and January 1, 2018, respectively.

F-70

Table of Contents

HUNTSMAN CORPORATION AND SUBSIDIARIES
HUNTSMAN INTERNATIONAL LLC AND SUBSIDIARIES
NOTES TO CONSOLIDATED FINANCIAL STATEMENTS
(Continued)

(c)See table below for details about these reclassifications.

Amounts reclassified

from accumulated

other

comprehensive loss

Affected line item in

Details about Accumulated Other

Year ended December 31,

where net income

Comprehensive Loss Components(a):


2019

2018

2017


is presented

Amortization of pension and other postretirement benefits:

Prior service credit

$

(11)

$

(12)

$

(15)

(b)

Settlement loss

1

2

Actuarial loss

75

90

101

(b)(c)

65

80

86

Total before tax

(12)

(14)

(15)

Income tax expense

Total reclassifications for the period

$

53

$

66

$

71

Net of tax

(a)Pension and other postretirement benefits amounts in parentheses indicate credits on our consolidated statements of operations.
(b)These accumulated other comprehensive loss components are included in the computation of net periodic pension costs. See “Note 19. Employee Benefit Plans.”
(c)Amounts contain approximately $7 and $22 and $29 of prior service credit and actuarial loss related to discontinued operations for the years ended December 31, 2019, 2018 and 2017, respectively.

Items of other comprehensive income (loss) of our Company and our consolidated affiliates have been recorded net of tax, with the exception of the foreign currency translation adjustments related to subsidiaries with earnings permanently reinvested. The tax effect is determined based upon the jurisdiction where the income or loss was recognized and is net of valuation allowances.

26. RELATED PARTY TRANSACTIONS

Our consolidated financial statements include the following transactions with our affiliates not otherwise disclosed (dollars in millions):

Year ended December 31, 

2019

2018

2017

Sales to:


Unconsolidated affiliates

$

133

$

153

$

161

Inventory purchases from:

Unconsolidated affiliates


434


411


291

27. OPERATING SEGMENT INFORMATION

We derive our revenues, earnings and cash flows from the manufacture and sale of a wide variety of differentiated and commodity chemical products. We have four operating segments, which are also our reportable segments: Polyurethanes, Performance Products, Advanced Materials and Textile Effects. We have organized our business and derived our operating segments around differences in product lines. Beginning in the third quarter of 2019, we reported the results of our Chemical Intermediates Businesses as discontinued operations and the related assets and liabilities as held for sale in our consolidated financial statements for all periods presented. See “Note 4. Discontinued Operations and Business Dispositions—Sale of Chemical Intermediates Businesses.” In addition, in connection with the Venator IPO in August 2017, we separated Venator and, beginning in the third quarter of 2017, we reported the results of operations of Venator as discontinued operations in our consolidated financial statements. On December 3, 2018, we further reduced our remaining investment in Venator by the sale of Venator ordinary shares which allowed us to deconsolidate Venator and account for our remaining interest in Venator as an equity method investment using the fair

F-71

Table of Contents

HUNTSMAN CORPORATION AND SUBSIDIARIES
HUNTSMAN INTERNATIONAL LLC AND SUBSIDIARIES
NOTES TO CONSOLIDATED FINANCIAL STATEMENTS
(Continued)

value option post consolidation. See “Note 4. Discontinued Operations and Business Dispositions—Separation and Deconsolidation of Venator.”

The major products of each reportable operating segment are as follows:

Segment


Products

Polyurethanes

MDI, polyols, TPU and aniline

Performance Products

Specialty amines, ethyleneamines, maleic anhydride and technology licenses

Advanced Materials

Basic liquid and solid epoxy resins; specialty resin compounds; cross-linking, matting and curing agents; epoxy, acrylic and polyurethane-based formulations

Textile Effects

Textile chemicals, dyes and digital inks

Sales between segments are generally recognized at external market prices and are eliminated in consolidation. We use adjusted EBITDA to measure the financial performance of our global business units and for reporting the results of our operating segments. This measure includes all operating items relating to the businesses. The adjusted EBITDA of operating segments excludes items that principally apply to our Company as a whole. The revenues and adjusted EBITDA for each of our reportable operating segments are as follows (dollars in millions):

F-72

Table of Contents

HUNTSMAN CORPORATION AND SUBSIDIARIES
HUNTSMAN INTERNATIONAL LLC AND SUBSIDIARIES
NOTES TO CONSOLIDATED FINANCIAL STATEMENTS
(Continued)

Year ended December 31, 

2019


2018


2017

Revenues:


Polyurethanes

$

3,911

$

4,282

$

3,764

Performance Products

1,158

1,301

1,156

Advanced Materials

1,044

1,116

1,040

Textile Effects

763

824

776

Corporate and eliminations

(79)

81

109

Total

$

6,797

$

7,604

$

6,845

Huntsman Corporation:

Segment adjusted EBITDA(1):

Polyurethanes

$

548

$

809

$

776

Performance Products

168

197

155

Advanced Materials

201

225

219

Textile Effects

84

101

83

Corporate and other(2)

(155)

(171)

(193)

Total

846

1,161

1,040

Reconciliation of adjusted EBITDA to net income:

Interest expense—continuing operations

(111)

(115)

(165)

Interest expense—discontinued operations

(36)

(19)

Income tax benefit (expense)—continuing operations

38

(45)

(20)

Income tax expense—discontinued operations

(35)

(86)

(111)

Depreciation and amortization—continuing operations

(270)

(255)

(236)

Depreciation and amortization—discontinued operations

(61)

(88)

(151)

Net income attributable to noncontrolling interests

36

313

105

Other adjustments:

Business acquisition and integration expenses and purchase accounting inventory adjustments

(5)

(9)

(19)

Merger costs

(2)

(28)

EBITDA from discontinued operations

265

171

511

Noncontrolling interest of discontinued operations

(232)

(49)

Fair value adjustments to Venator investment

(18)

(62)

Loss on early extinguishment of debt

(23)

(3)

(54)

Certain legal settlements and related (expenses) income

(6)

(1)

11

(Loss) gain on sale of businesses/assets

(21)

9

Certain nonrecurring information technology project implementation costs

(4)

Amortization of pension and postretirement actuarial losses

(66)

(67)

(69)

Plant incident remediation costs

(8)

(1)

U.S. Tax Reform Act impact on noncontrolling interest

6

Restructuring, impairment and plant closing and transition credits (costs)

41

6

(19)

Net income

$

598

$

650

$

741

Year ended December 31,


2019


2018


2017

Depreciation and Amortization:


Polyurethanes

$

120

$

108

$

92

Performance Products


81


78


78

Advanced Materials


36


37


33

Textile Effects


16


16


14

Corporate and other


17


16


19

Total

$

270

$

255

$

236

F-73

Table of Contents

HUNTSMAN CORPORATION AND SUBSIDIARIES
HUNTSMAN INTERNATIONAL LLC AND SUBSIDIARIES
NOTES TO CONSOLIDATED FINANCIAL STATEMENTS
(Continued)

Year ended December 31,


2019


2018


2017

Capital Expenditures:


Polyurethanes

$

185

$

153

$

158

Performance Products


32


48


35

Advanced Materials


24


20


21

Textile Effects


22


20


16

Corporate and other


11


10


4

Total

$

274

$

251

$

234

December 31, 


2019


2018

Total Assets:


Polyurethanes

$

3,437

$

3,129

Performance Products


1,125


1,161

Advanced Materials


774


796

Textile Effects


511


571

Corporate and other


1,265


1,187

Total

$

7,112

$

6,844

December 31, 


2019


2018

Goodwill:


Polyurethanes

$

177

$

173

Performance Products


16


16

Advanced Materials


83


86

Total

$

276

$

275

F-74

Table of Contents

HUNTSMAN CORPORATION AND SUBSIDIARIES
HUNTSMAN INTERNATIONAL LLC AND SUBSIDIARIES
NOTES TO CONSOLIDATED FINANCIAL STATEMENTS
(Continued)

Year ended December 31, 

2019


2018


2017

Huntsman International:


Segment adjusted EBITDA(1):

Polyurethanes

$

548

$

809

$

776

Performance Products

168

197

155

Advanced Materials

201

225

219

Textile Effects

84

101

83

Corporate and other(2)

(150)

(167)

(189)

Total

851

1,165

1,044

Reconciliation of adjusted EBITDA to net income:

Interest expense—continuing operations

(126)

(136)

(181)

Interest expense—discontinued operations

(36)

(19)

Income tax benefit (expense)—continuing operations

41

(41)

(17)

Income tax expense—discontinued operations

(35)

(86)

(111)

Depreciation and amortization—continuing operations

(270)

(252)

(228)

Depreciation and amortization—discontinued operations

(61)

(88)

(151)

Net income attributable to noncontrolling interests

36

313

105

Other adjustments:

Business acquisition and integration expenses and purchase accounting inventory adjustments

(5)

(9)

(23)

Merger costs

(2)

(28)

EBITDA from discontinued operations

265

171

511

Noncontrolling interest of discontinued operations

(232)

(49)

Fair value adjustments to Venator investment

(18)

(62)

Loss on early extinguishment of debt

(23)

(3)

(54)

Certain legal settlements and related (expenses) income

(6)

(1)

11

(Loss) gain on sale of businesses/assets

(21)

10

Certain nonrecurring information technology project implementation costs

(4)

Amortization of pension and postretirement actuarial losses

(70)

(71)

(72)

Plant incident remediation costs

(8)

(1)

U.S. Tax Reform Act impact on noncontrolling interest

6

Restructuring, impairment and plant closing and transition credits (costs)

41

6

(19)

Net income

$

587

$

636

$

734

Year ended December 31,


2019


2018


2017

Depreciation and Amortization:


Polyurethanes

$

120

$

108

$

92

Performance Products


81


78


78

Advanced Materials


36


37


33

Textile Effects


16


16


14

Corporate and other


17


13


11

Total

$

270

$

252

$

228

F-75

Table of Contents

HUNTSMAN CORPORATION AND SUBSIDIARIES
HUNTSMAN INTERNATIONAL LLC AND SUBSIDIARIES
NOTES TO CONSOLIDATED FINANCIAL STATEMENTS
(Continued)

Year ended December 31,


2019


2018


2017

Capital Expenditures:


Polyurethanes

$

185

$

153

$

158

Performance Products


32


48


35

Advanced Materials


24


20


21

Textile Effects


22


20


16

Corporate and other


11


10


4

Total

$

274

$

251

$

234

December 31, 


2019


2018

Total Assets:


Polyurethanes

$

3,437

$

3,129

Performance Products


1,125


1,161

Advanced Materials


774


796

Textile Effects


511


571

Corporate and other


1,668


1,569

Total

$

7,515

$

7,226

December 31, 


2019


2018

Goodwill:


Polyurethanes

$

177

$

173

Performance Products


16


16

Advanced Materials


83


86

Total

$

276

$

275

(1)         We use segment adjusted EBITDA as the measure of each segment’s profit or loss. We believe that segment adjusted EBITDA more accurately reflects what management uses to make decisions about resources to be allocated to the segments and assess their financial performance. Segment adjusted EBITDA is defined as net income of Huntsman Corporation or Huntsman International, as appropriate, before interest, income tax, depreciation and amortization, net income attributable to noncontrolling interests and certain Corporate and other items, as well as eliminating the following adjustments: (a) business acquisition and integration expenses and purchase accounting inventory adjustments; (b) merger costs; (c) EBITDA from discontinued operations; (d) noncontrolling interest of discontinued operations; (e) fair value adjustments to Venator investment; (f) loss on early extinguishment of debt; (g) certain legal settlements and related income (expenses); (h) gain on sale of businesses/assets; (i) certain nonrecurring information technology project implementation costs; (j) amortization of pension and postretirement actuarial losses; (k) plant incident remediation costs; (l) U.S. Tax Reform Act impact on noncontrolling interest; and (m) restructuring, impairment, plant closing and transition credits (costs).

(2)          Corporate and other includes unallocated corporate overhead, unallocated foreign exchange gains and losses, LIFO inventory valuation reserve adjustments, nonoperating income and expense, benzene sales and gains and losses on the disposition of corporate assets.

F-76

Table of Contents

HUNTSMAN CORPORATION AND SUBSIDIARIES
HUNTSMAN INTERNATIONAL LLC AND SUBSIDIARIES
NOTES TO CONSOLIDATED FINANCIAL STATEMENTS
(Continued)

Year ended December 31,


2019


2018


2017

Revenues by geographic area(1):

United States

$

2,025

$

2,136

$

1,828

China


1,076


1,260


1,122

Germany


541


537


507

India


319


352


336

Other nations


2,836


3,319


3,052

Total

$

6,797

$

7,604

$

6,845

December 31, 


2019


2018

Long-lived assets(2):


United States

$

970

$

944

The Netherlands


334


331

China


247


247

Saudi Arabia


154


161

Germany


137


143

Switzerland

106

108

Singapore


94


96

Other nations


341


323

Total

$

2,383

$

2,353

(1)    Geographic information for revenues is based upon countries into which product is sold.

(2)    Long-lived assets consist of property, plant and equipment, net.

F-77

Table of Contents

HUNTSMAN CORPORATION AND SUBSIDIARIES
HUNTSMAN INTERNATIONAL LLC AND SUBSIDIARIES
NOTES TO CONSOLIDATED FINANCIAL STATEMENTS
(Continued)

28. SELECTED UNAUDITED QUARTERLY FINANCIAL DATA

A summary of selected unaudited quarterly financial data for the years ended December 31, 2019 and 2018 is as follows (dollars in millions, except per share amounts):

Huntsman Corporation

Three months ended

March 31, 

June 30, 

September 30, 

December 31, 


2019


2019


2019


2019

Revenues

$

1,669

$

1,784

$

1,687

$

1,657

Gross profit


359


373


340


310

Restructuring, impairment and plant closing costs (credits)


1


(43)


1

Income (loss) from continuing operations


108


83


(27)


265

Net income


131


118


41


308

Net income attributable to noncontrolling interests

12

8

11

5

Net income attributable to Huntsman Corporation


119


110


30


303

Basic income per share(4):


Income (loss) from continuing operations attributable to Huntsman Corporation common stockholders


0.41


0.33


(0.17)


1.16

Net income attributable to Huntsman Corporation common stockholders


0.51


0.48


0.13


1.35

Diluted income per share(4):


Income (loss) from continuing operations attributable to Huntsman Corporation common stockholders


0.41


0.32


(0.17)


1.15

Net income attributable to Huntsman Corporation common stockholders


0.51


0.47


0.13


1.34

Three months ended

March 31, 

June 30, 

September 30, 

December 31, 


2018


2018


2018(1)


2018(2)

Revenues

$

1,838

$

1,977

$

1,968

$

1,821

Gross profit


466


479


467


352

Restructuring, impairment and plant closing costs (credits)


2


1


5


(15)

Income from continuing operations


189


242


197


61

Net income (loss)


350


623


(8)


(315)

Net income attributable to noncontrolling interests(3)

76

209

3

25

Net income (loss) attributable to Huntsman Corporation


274


414


(11)


(340)

Basic income per share(4):


Income from continuing operations attributable to Huntsman Corporation common stockholders


0.70


0.93


0.72


0.20

Net income (loss) attributable to Huntsman Corporation common stockholders


1.14


1.73


(0.05)


(1.45)

Diluted income per share(4):


Income from continuing operations attributable to Huntsman Corporation common stockholders


0.68


0.91


0.72


0.19

Net income (loss) attributable to Huntsman Corporation common stockholders


1.11


1.71


(0.05)


(1.43)

F-78

Table of Contents

HUNTSMAN CORPORATION AND SUBSIDIARIES
HUNTSMAN INTERNATIONAL LLC AND SUBSIDIARIES
NOTES TO CONSOLIDATED FINANCIAL STATEMENTS
(Continued)

Huntsman International

Three months ended


March 31, 

June 30, 

September 30, 

December 31, 


2019


2019


2019


2019

Revenues

$

1,669

$

1,784

$

1,687

$

1,657

Gross profit


359


373


340


310

Restructuring, impairment and plant closing costs (credits)


1


(43)


1

Income (loss) from continuing operations


105


80


(30)


268

Net income


128


115


38


311

Net income attributable to noncontrolling interests

12

8

11

5

Net income attributable to Huntsman International


116


107


27


306

Three months ended

March 31, 

June 30, 

September 30, 

December 31, 


2018


2018


2018(1)


2018(2)

Revenues

$

1,838

$

1,977

1,968

$

1,821

Gross profit


467


480

468


352

Restructuring, impairment and plant closing costs (credits)


2


1

5


(15)

Income from continuing operations


186


239

194


56

Net income (loss)


347


620

(11)


(320)

Net income attributable to noncontrolling interests(3)

76

209

3

25

Net income (loss) attributable to Huntsman International


271


411

(14)


(345)

(1)During the third quarter of 2018, we recognized a net after tax valuation allowance of $270 million to adjust the carrying amount of the assets and liabilities held for sale and the amount of accumulated comprehensive income recorded in equity related to Venator to the lower of cost or estimated fair value, less cost to sell. This loss was recorded in discontinued operations on our consolidated statements of operations. For more information see “Note 4. Discontinued Operations and Dispositions – Separation and Deconsolidation of Venator.”

(2)In connection with the deconsolidation of Venator, we recorded a pretax loss of $427 million during the fourth quarter of 2018 to record our remaining ownership interest in Venator at fair value. This loss was recorded in discontinued operations on our consolidated statements of operations. We elected the fair value option to account for our equity method investment in Venator post deconsolidation. Accordingly, at December 31, 2018, we recorded a pretax loss of $57 million to record our equity method investment in Venator at fair value. This loss was recorded in “Fair value adjustments to Venator investment” on our consolidated statements of operations. Furthermore, in connection with the December 3, 2018 sale of Venator shares to Bank of America N.A., we recorded a forward swap. During December 2018, we recorded a loss of $5 million in “Fair value adjustments to Venator investment” on our consolidated statements of operations to record the forward swap at fair value. For more information, see “Note 4. Discontinued Operations and Dispositions – Separation and Deconsolidation of Venator.”

(3)In connection with the Venator IPO in August 2017, we separated the P&A Business and, beginning in the third quarter of 2017, we reported the results of operations of Venator as discontinued operations on our consolidated financial statements. On December 3, 2018, we further reduced our investment in Venator by the sale of Venator ordinary shares which allowed us to deconsolidate Venator beginning in December 2018. See “Note 4. Discontinued Operations and Business Dispositions—Separation of Venator.”
(4)Basic and diluted income per share are computed independently for each of the quarters presented based on the weighted average number of common shares outstanding during that period. Therefore, the sum of quarterly basic and diluted per share information may not equal annual basic and diluted earnings per share.

F-79

Table of Contents

HUNTSMAN CORPORATION (PARENT ONLY)

Schedule I—Condensed Financial Information of Registrant

HUNTSMAN CORPORATION (Parent Only)

BALANCE SHEETS

(In Millions, Except Share and Per Share Amounts)

December 31, 

2019

2018

ASSETS


Prepaid assets

$

1

$

1

Receivable from affiliate


86


72

Note receivable from affiliate


100


100

Total current assets


187


173

Note receivable from affiliate-noncurrent


280


488

Investment in and advances to affiliates


2,626


2,251

Total assets

$

3,093

$

2,912

LIABILITIES AND STOCKHOLDERS’ EQUITY


Payable to affiliate

$

396

$

381

Accrued liabilities


3


3

Total current liabilities


399


384

Other noncurrent liabilities


7


8

Total liabilities


406


392

STOCKHOLDERS’ EQUITY


Common stock $0.01 par value, 1,200,000,000 shares authorized, 257,405,496 and 256,006,849 shares issued and 224,295,868 and 232,994,172 shares outstanding, respectively


3


3

Additional paid-in capital


4,008


3,984

Treasury stock, 33,112,572 and 23,012,680 shares, respectively


(635)


(427)

Unearned stock-based compensation


(17)


(16)

Retained earnings


690


292

Accumulated other comprehensive loss


(1,362)


(1,316)

Total stockholders’ equity


2,687


2,520

Total liabilities and stockholders’ equity

$

3,093

$

2,912

This statement should be read in conjunction with the notes to the consolidated financial statements.

F-80

Table of Contents

HUNTSMAN CORPORATION (Parent Only)

STATEMENTS OF OPERATIONS

(In Millions)

Year ended December 31, 

2019

2018

2017

Selling, general and administrative expenses


$

(5)


$

(4)


$

(4)

Interest income


15


21


16

Equity in income of subsidiaries


401


163


501

Dividend income—affiliate


148


154


120

Other income

3

3

3

Net income

$

562

$

337

$

636

This statement should be read in conjunction with the notes to the consolidated financial statements.

F-81

Table of Contents

HUNTSMAN CORPORATION (Parent Only)

STATEMENTS OF COMPREHENSIVE INCOME

(In Millions)

Year ended December 31, 

2019

2018

2017

Net income


$

562


$

337


$

636

Other comprehensive income, net of tax:


Foreign currency translations adjustments


2


(192)


210

Pension and other postretirement benefits adjustments


(37)


(39)


86

Other, net


35


304


105

Other comprehensive income, net of tax


73


401

Comprehensive income


562


410


1,037

Comprehensive income attributable to noncontrolling interests


(31)


(266)


(127)

Comprehensive income attributable to Huntsman Corporation

$

531

$

144

$

910

This statement should be read in conjunction with the notes to the consolidated financial statements.

F-82

Table of Contents

HUNTSMAN CORPORATION (Parent Only)

STATEMENTS OF STOCKHOLDERS’ EQUITY

(In Millions, Except Share Amounts)

Huntsman Corporation Stockholders’ Equity

(Accumulated

Accumulated

Shares

Additional

Unearned

deficit)

other

Common

Common

paid-in

Treasury

stock-based

retained

comprehensive

Total


stock


stock


capital


stock


compensation


earnings


loss


equity

Beginning balance, January 1, 2017

236,370,347

$

3

$

3,447

$

(150)

$

(17)

$

(325)

$

(1,671)

$

1,287

Net income

636

636

Other comprehensive income

403

403

Issuance of nonvested stock awards

18

(18)

Vesting of stock awards

1,316,975

8

8

Recognition of stock-based compensation

10

18

28

Repurchase and cancellation of stock awards

(402,978)

(12)

(12)

Stock options exercised

2,929,262

53

(18)

35

Disposition of a portion of Venator

413

413

Costs of the IPO and secondary offering of Venator

(58)

(58)

Conversion of restricted awards to Venator awards

(2)

2

Dividends declared on common stock

(120)

(120)

Balance, December 31, 2017

240,213,606

3

3,889

(150)

(15)

161

(1,268)

2,620

Cumulative effect of changes in fair value of equity investments

10

(10)

Net income

337

337

Other comprehensive loss

(198)

(198)

Issuance of nonvested stock awards

14

(14)

Vesting of stock awards

1,135,003

11

11

Recognition of stock-based compensation

8

13

21

Repurchase and cancellation of stock awards

(259,643)

(30)

(30)

Stock options exercised

2,310,663

46

(29)

17

Treasury stock repurchased

(10,405,457)

(277)

(277)

Disposition of a portion of Venator


18


18

Costs of the secondary offering of Venator


(2)


(2)

Deconsolidation of Venator

160

160

Accrued and unpaid dividends

(1)

(1)

Dividends declared on common stock

(156)

(156)

Balance, December 31, 2018

232,994,172

3

3,984

(427)

(16)

292

(1,316)

2,520

Net income

562

562

Other comprehensive loss

(46)

(46)

Issuance of nonvested stock awards

17

(17)

Vesting of stock awards

1,643,368

7

7

Recognition of stock-based compensation

7

16

23

Repurchase and cancellation of stock awards

(488,441)

(12)

(12)

Stock options exercised

246,661

4

(2)

2

Treasury stock repurchased

(10,099,892)

(208)

(208)

Acquisition of noncontrolling interests, net of tax

(11)

(11)

Dividends declared on common stock

(150)

(150)

Balance, December 31, 2019


224,295,868

$

3

$

4,008

$

(635)

$

(17)

$

690

$

(1,362)

$

2,687

This statement should be read in conjunction with the notes to the consolidated financial statements.

F-83

Table of Contents

HUNTSMAN CORPORATION (Parent Only)

STATEMENTS OF CASH FLOWS

(In Millions)

Year ended December 31, 

2019

2018

2017

Operating Activities:


Net income

$

562

$

337

$

636

Equity in income of subsidiaries


(401)


(163)


(501)

Stock-based compensation


1


1


1

Noncash interest income


(15)


(21)


(16)

Changes in operating assets and liabilities


13


19


10

Net cash provided by operating activities


160


173


130

Investing Activities:


Loan to affiliate


(47)

Repayments of loan by affiliate


207


255


Net cash provided by (used in) investing activities


207


255


(47)

Financing Activities:


Dividends paid to common stockholders


(150)


(156)


(120)

Repurchase and cancellation of stock awards


(12)


(30)


(12)

Proceeds from issuance of common stock


2


17


35

Repurchase of common stock


(208)


(277)


Increase in payable to affiliates


1


16


15

Net cash used in financing activities


(367)


(430)


(82)

(Decrease) increase in cash and cash equivalents


(2)


1

Cash and cash equivalents at beginning of period


2


1

Cash and cash equivalents at end of period

$

$

$

2

This statement should be read in conjunction with the notes to the consolidated financial statements.

F-84

Table of Contents

HUNTSMAN CORPORATION AND SUBSIDIARIES

Schedule II—Valuation and Qualifying Accounts

(In Millions)

Column A


Column B


Column C


Column D


Column E

Additions

Charges

Balance at

(credits)

Charged

Balance

beginning

to cost and

to other

at end

Description

of period


expenses

accounts

Deductions

of period

Allowance for doubtful accounts:


Year ended December 31, 2019

$

21

$

1

$

(3)

$

$

19

Year ended December 31, 2018


24


2


(5)

21

Year ended December 31, 2017


23


3


(2)


24

HUNTSMAN INTERNATIONAL LLC AND SUBSIDIARIES

Schedule II—Valuation and Qualifying Accounts

(In Millions)

Column A


Column B


Column C


Column D


Column E


Additions


Charges


Balance at


(credits)


Charged


Balance


beginning


to cost and


to other


at end

Description

of period


expenses

accounts

Deductions

of period

Allowance for doubtful accounts:


Year ended December 31, 2019

$

21

$

1

$

(3)

$

$

19

Year ended December 31, 2018

24

2

(5)

21

Year ended December 31, 2017


23


3


(2)


24

F-85