UNITED STATES
SECURITIES AND EXCHANGE COMMISSION
WASHINGTON, D.C. 20549
Form 10-K
|
(Mark One)
|
|
|
|
ý
|
|
ANNUAL REPORT PURSUANT TO SECTION 13 OR
15(d) OF THE SECURITIES EXCHANGE ACT OF 1934
|
|
|
|
|
|
For the fiscal year ended
December 31, 2005
|
|
|
|
|
|
OR
|
|
|
|
o
|
|
TRANSITION REPORT PURSUANT TO SECTION 13 OR
15(d) OF THE SECURITIES EXCHANGE ACT OF 1934
|
|
|
|
For the transition period from to
|
Commission file number 333-85141
HUNTSMAN INTERNATIONAL LLC
(Exact name of registrant as specified in its charter)
|
Delaware
|
|
87-0630358
|
|
(State or other jurisdiction of
incorporation or organization)
|
|
(I.R.S. Employer
Identification No.)
|
500 Huntsman Way
Salt Lake City, Utah 84108
(801) 584-5700
(Address of principal executive office and telephone number)
Securities registered pursuant to Section 12(b) of
the Exchange Act: None
Securities registered pursuant to Section 12(g) of
the Exchange Act: None
Indicate
by check mark if the Registrant is a well-known seasoned issuer, as defined in Rule 405
of the Securities Act. YES o NO ý
Indicate
by check mark if the Registrant is not required to file reports pursuant to Section 13
or Section 15(d) of the Exchange
Act. YES o NO ý
Indicate
by check mark whether the Registrant (1) has filed all reports required to
be filed by Section 13 or 15(d) of the Exchange Act during the
preceding 12 months (or for such shorter period that the Registrant was
required to file such reports), and (2) has been subject to such filing
requirements for the past 90 days. YES ý NO o
Indicate
by check mark if disclosure of delinquent filers pursuant to Item 405 of
Regulation S-K is not contained herein, and will not be contained, to the
best of the Registrant’s knowledge, in definitive proxy or information
statements incorporated by reference in Part III of this Form 10-K or
any amendment to this Form 10-K. ý
Indicate
by check mark whether the Registrant is a large accelerated filer, an
accelerated filer, or a non-accelerated filer.
See definition of “accelerated filer and large accelerated filer” in Rule 12b-2
of the Exchange Act. (Check one):
|
Large accelerated filer o
|
|
Accelerated filer o
|
|
Non-accelerated filer ý
|
Indicate
by check mark whether the Registrant is a shell company (as defined in Rule 12b-2
of the Exchange Act). YES o NO ý
On June 30,
2005, the last business day of the Registrant’s second fiscal quarter, all of
the Registrant’s units of membership interest were held by an affiliate.
Accordingly, the market value of units of membership interest held by
non-affiliates is zero.
On March 17,
2006, 2,058 units of membership interest of the Registrant were outstanding.
Documents Incorporated by Reference: None
The Registrant meets the conditions set forth in General
Instruction I(1)(a) and (b) of Form 10-K and is therefore filing
this form with a reduced disclosure format.
HUNTSMAN INTERNATIONAL LLC
2005 ANNUAL REPORT ON FORM 10-K
TABLE OF CONTENTS
i
HUNTSMAN INTERNATIONAL LLC
2005 ANNUAL REPORT ON FORM 10-K
Certain
information set forth in this report contains “forward-looking statements”
within the meaning of the federal securities laws. Forward-looking statements
include statements concerning our plans, objectives, goals, strategies, future
events, future revenues or performance, capital expenditures, financing needs,
plans or intentions relating to acquisitions and other information that is not
historical information. In some cases, forward-looking statements can be
identified by terminology such as “believes,” “expects,” “may,” “will,” “should,”
“anticipates,” or “intends” or the negative of such terms or other comparable
terminology, or by discussions of strategy. We may also make additional forward-looking
statements from time to time. All such subsequent forward-looking statements, whether
written or oral, by us or on our behalf, are also expressly qualified by these
cautionary statements.
All
forward-looking statements, including without limitation, management’s
examination of historical operating trends, are based upon our current expectations
and various assumptions. Our expectations, beliefs and projections are
expressed in good faith and we believe there is a reasonable basis for them,
but, there can be no assurance that management’s expectations, beliefs and
projections will result or be achieved. All forward-looking statements apply
only as of the date made. We undertake no obligation to publicly update or
revise forward-looking statements which may be made to reflect events or
circumstances after the date made or to reflect the occurrence of unanticipated
events.
There
are a number of risks and uncertainties that could cause our actual results to
differ materially from the forward-looking statements contained in or
contemplated by this report. Any forward-looking statements should be
considered in light of the risks set forth in “Part I. Item 1A. Risk
Factors” and elsewhere in this report.
This
report may include information with respect to market share, industry
conditions and forecasts that we obtained from internal industry research,
publicly available information (including industry publications and surveys),
and surveys and market research provided by consultants. The publicly available
information and the reports, forecasts and other research provided by
consultants generally state that the information contained therein has been
obtained from sources believed to be reliable, but there can be no assurance as
to the accuracy and completeness of such information. We have not independently
verified any of the data from third-party sources, nor have we ascertained the
underlying economic assumptions relied upon therein. Similarly, our internal
research and forecasts are based upon our management’s understanding of
industry conditions, and such information has not been verified by any
independent sources.
For
convenience in this report, the terms “Company,” “our,” “us” or “we” may be
used to refer to Huntsman International LLC and, unless the context otherwise
requires, its subsidiaries. In this report, “Huntsman Corporation” refers to
Huntsman Corporation, and, unless the context otherwise requires, its
subsidiaries, “HIH” refers to Huntsman International Holdings LLC, “Huntsman
LLC” or “HLLC” refers to Huntsman LLC, and, unless the context otherwise
requires, its subsidiaries, “AdMat Holdings” refers to Huntsman Advanced
Materials Holdings LLC and, unless the context otherwise requires, its
subsidiaries, “AdMat” refers to Huntsman Advanced Materials LLC and, unless the
context otherwise requires, its subsidiaries, “HMP” refers to HMP Equity
Holdings Corporation, “Huntsman Holdings” refers to Huntsman Holdings, LLC, “Huntsman
Family Holdings” refers to Huntsman Family Holdings Company LLC and “MatlinPatterson”
refers to MatlinPatterson Global Opportunities Partners L.P. and its affiliates.
ii
PART I
ITEM 1. BUSINESS
History
We are
a Delaware limited liability company and all of our membership interests are
owned by Huntsman Corporation. We were formed in 1999 in connection with a transaction
between HIH, Huntsman Specialty Chemicals Corporation (“Huntsman Specialty”)
and Imperial Chemical Industries PLC (“ICI”). In that transaction, on June 30,
1999, HIH acquired ICI’s polyurethane chemicals, selected petrochemicals and
titanium dioxide (“TiO2” or “Tioxide”) businesses and Huntsman
Specialty’s propylene oxide (“PO”) business. HIH also acquired the 20%
ownership interest of BP Chemicals Limited in an olefins facility located at
Wilton, U.K. and certain related assets. HIH then transferred the acquired
businesses to us and to our subsidiaries.
On August 16,
2005, we completed a merger in which Huntsman LLC, another wholly-owned
subsidiary of Huntsman Corporation, merged with and into us and we continued in
existence as the surviving entity (the “HLLC Merger”). At the same time, HIH
was also merged into our Company. Prior to the HLLC Merger, all of our
membership interests were owned by HIH, and HIH was owned 58% by Huntsman
Corporation and 42% by Huntsman LLC.
On December 20,
2005, Huntsman Corporation acquired all of the outstanding interests of AdMat
Holdings and contributed all of the outstanding equity of AdMat Holdings to us
(the “AdMat Minority Interest Transaction”). As a result, AdMat Holdings,
AdMat and its subsidiaries have become our subsidiaries. We did not pay
any consideration to Huntsman Corporation in connection with the AdMat Minority
Interest Transaction other than the issuance of additional equity to Huntsman
Corporation.
In the
AdMat Minority Interest Transaction, the equity interests of all holders in
AdMat Holdings, other than Huntsman Corporation, were converted into the right
to receive an aggregate of $125.0 million in cash (the “Minority Payment”).
In connection with the AdMat Minority Interest Transaction, we satisfied
substantially all of the Minority Payment obligation and repaid all outstanding
indebtedness of AdMat under its secured credit facility and senior secured
notes, using cash on hand and the proceeds of an increase in the term loan
under our senior secured credit facility.
For more information, see “Note 14. Long-Term Debt” to our
Consolidated Financial Statements included elsewhere in this report.
Huntsman
Corporation effected the HLLC Merger and the AdMat Minority Interest
Transaction to simplify its consolidated group’s financing and public reporting
structure, to reduce its cost of financing and to facilitate other
organizational efficiencies. The HLLC Merger and the AdMat Minority Interest
Transaction were accounted for as an exchange of shares between entities under
common control similar to the pooling method. Our consolidated financial
statements presented herein reflect the financial position, results of
operations and cash flows as if HIH, Huntsman LLC, AdMat Holdings and our
Company were combined for all periods for which they were under common control.
Prior
to the HLLC Merger and the AdMat Minority Interest Transaction, we operated our
businesses through four segments:
Polyurethanes, Performance Products, Pigments and Base Chemicals. Huntsman LLC was a manufacturer and marketer
of a wide range of chemical products with manufacturing facilities located in
North America, Europe and Australia and it operated its business through three
segments: Performance Products, Polymers and Base Chemicals. AdMat and its subsidiaries are manufacturers
and marketers of advanced epoxy, acrylic and polyurethane-based products used
in a wide variety of industrial and consumer applications and operate in a
single Advanced Materials segment. We have combined Huntsman LLC’s Performance
Products and Base Chemicals segments with our Performance Products and Base
Chemicals segments and have added Huntsman LLC’s Polymers segment and AdMat’s
Advanced Materials segment, and we now operate our business through six segments:
Polyurethanes, Advanced Materials, Performance Products, Pigments, Polymers and
Base Chemicals.
Our
six segments can be divided into two broad categories: differentiated and
commodity. We produce differentiated products primarily in our Polyurethanes,
Advanced Materials and Performance Products segments. These products serve
diverse end markets and are generally characterized by historical growth in
excess of GDP growth, resulting from product substitution and new product
development, proprietary manufacturing processes and product formulations and a
high degree of customer loyalty. Demand for these products tends to be driven
by the value-added attributes that they create in our customers’ end-use
applications. While the demand for these differentiated products is also
influenced by worldwide economic conditions and GDP growth, our differentiated
products have tended to produce more stable profit margins and higher demand
growth rates than our commodity products.
In our
commodity chemical businesses, we produce titanium dioxide derived from
titanium-bearing ores in our Pigments segment and petrochemical-based olefins,
aromatics and polyolefins products in our Polymers and Base Chemicals segments.
Since the coatings industry consumes a substantial portion of titanium dioxide
production, seasonal demand patterns in the coatings industry drive the
profitability of our Pigments segment; profitability is also driven by
industry-wide operating
1
rates, with a lag of up to twelve months due to the effects of stocking
and destocking by customers and suppliers. The profitability of our Polymers
and Base Chemicals segments has historically been cyclical in nature. The
industry has recently operated in an up cycle that resulted primarily from
strong demand reflecting global economic conditions and the fact that there
have been no recent North American or European capacity additions. However,
volatile crude oil and natural gas-based raw materials costs and a recent
weakening in demand could negatively impact the future profitability of our
Polymers and Base Chemicals segments.
Recent
Developments
Potential
Spin Off or Sale of Base Chemicals and Polymers Businesses
On
February 24, 2006, Huntsman Corporation announced that it is evaluating
strategic options for its business. This evaluation may lead to the sale of
certain of our Base Chemicals or Polymers assets or a spin off of these
segments and is consistent with the announced potential divestment discussed in
“—Pending Sale of U.S. Butadiene and MTBE Business” below. Currently, Huntsman
Corporation is in the early stages of this evaluation and there can be no
assurance that we will ultimately sell any assets or spin off our Base
Chemicals and Polymers segments.
Pending Sale
of U.S. Butadiene and MTBE Business
On February 24,
2006, Huntsman Corporation announced that it signed a letter of intent to sell
the assets of our U.S. butadiene and MTBE business operated in our Base
Chemicals segment, which includes a manufacturing facility located at Port
Neches, Texas, to Texas Petrochemicals, L.P. for a sales price of $275 million,
subject to customary adjustments. We expect the transaction to close in mid-2006.
The manufacturing facility has a capacity of approximately 900 million pounds
of butadiene per year and approximately 11,000 barrels per day of MTBE. The
business has approximately 240 employees, 2005 revenues of approximately $626
million and 2005 EBITDA of approximately $43 million.
Our PO/MTBE facilities
at Port Neches, Texas (operated in our Polyurethanes segment) and our
oxides/olefins facilities at Port Neches, Texas, along with our facilities in
nearby Port Arthur, Texas are not included in the sale.
Pending Acquisition of Textile Effects Business
On February 20,
2006, Huntsman Corporation announced that it has entered into a definitive
agreement to acquire the global Textile Effects (“TE”) business of Ciba
Specialty Chemicals Inc. for CHF 332 million ($253 million). The purchase price
will be reduced (i) by approximately CHF 75 million ($57 million) in
assumed debt and unfunded pension and other post employment liabilities and (ii) up
to approximately CHF 40 million ($31 million) in unspent restructuring costs.
The final purchase price is subject to a working capital and net debt
adjustment. The transaction is subject to customary terms and conditions, and
is expected to occur by the end of the third quarter of 2006.
The TE business has
headquarters in Basel, Switzerland, and manufactures a broad range of chemical
and dye products that enhance the performance properties and color of finished
textiles and materials. The TE business serves over 10,000 customers in 80
countries and is the leading global supplier of comprehensive solutions for the
textile industry. The TE business has approximately 4,200 employees and
operates eleven primary manufacturing facilities located in eight countries.
The TE business had approximately CHF 1.3 billion ($1 billion) in revenues and
approximately CHF 115 million ($92 million) in EBITDA in 2005. From the date of the acquisition of the TE
business through approximately the first half of 2008, we would expect to incur
restructuring costs totaling approximately $50 million and to make capital
expenditures totaling approximately $100 million associated with the TE
business.
Discussions
Concerning the Potential Sale of Huntsman Corporation
On January 31, 2006, Huntsman Corporation, our
parent, confirmed that, in late 2005, it received an indication of interest
regarding the acquisition of all of its outstanding common shares. In response
to this indication of interest, the board of directors of Huntsman Corporation
engaged financial and legal advisors to assist it in evaluating the potential
sale of Huntsman Corporation and other alternatives to enhance stockholder
value, including to continue executing its business plan. The board also formed
a special committee with authority to make a recommendation. As part of this
process, Huntsman Corporation contacted, obtained proposals from, and held
discussions with a limited number of potential acquirers or merger partners.
After careful review of the proposals received, other prospects and
alternatives available at the time, as well as thorough discussions with the
parties, the board of directors of Huntsman Corporation and its special
committee concluded that none of the proposals were in the best interests of
Huntsman Corporation stockholders.
2
Impact of 2005 U.S. Gulf Coast Storms
While
the 2005 U.S. Gulf Coast storms did not cause serious structural damage to our
facilities, they did cause operational disruptions for us and certain of our
suppliers and customers. Some of our products were temporarily negatively
impacted by restrictions on the availability of certain raw materials and our
business was adversely impacted by logistics and transportation disruptions.
Certain of our operations were suspended for much of the fourth quarter of
2005.
Energy
costs, as well as the costs of many of our key feedstocks, spiked to
unprecedented levels during the third and fourth quarters of 2005. In response
to these increased costs and tight supply conditions, we increased prices for
many of our products. Nevertheless, we estimate that these events had a direct
negative effect on our EBITDA for the six months ended December 31, 2005
of approximately $167 million, approximately $140 million of which was
incurred in the fourth quarter of 2005. The following table shows the estimated
negative impact on our EBITDA by segment for the six months ended December 31,
2005 (dollars in millions):
Estimated EBITDA* Impact
|
Segment
|
|
Six Months Ended
December 31, 2005
|
|
|
Polyurethanes
|
|
$
|
29.9
|
|
|
Advanced
Materials
|
|
2.3
|
|
|
Performance
Products
|
|
54.3
|
|
|
Pigments
|
|
3.2
|
|
|
Polymers
|
|
—
|
|
|
Base Chemicals
|
|
77.3
|
|
|
Total
|
|
$
|
167.0
|
|
* For
a discussion of EBITDA and a reconciliation of EBITDA to net income and cash
provided by operating activities, see “Part II.
Item 7. Management’s Narrative Analysis of Results of Operations—Results
of Operations.”
Related
to the continuing effects of the storms, in late January 2006, one of our
suppliers suffered two boiler failures that resulted in damages to certain of
our facilities in Jefferson County, Texas. This damage caused unplanned outages
and repair costs that we estimate will have a negative impact of approximately
$15 million on our results of operations in the first quarter of 2006. Other
than this incident, we do not expect any significant continuing impacts from the
2005 U.S. Gulf Coast storms in 2006.
We are
in the process of preparing claims for possible recovery of damages under our
insurance policies for property damage and business interruption resulting from
the 2005 U.S. Gulf Coast storms (including for the 2006 incident discussed
above at our Jefferson County, Texas facility). While we can provide no
assurances that we will recover these damages (or the amount of recovery, if
any), we anticipate obtaining at least a partial recovery, net of insurance
deductibles, by the end of 2006.
Overview
We are
among the world’s largest global manufacturers of differentiated and commodity
chemical products. We manufacture a broad range of chemical products and
formulations, which are marketed in more than 100 countries to a diversified
group of consumer and industrial customers. Our products are used in a wide
range of applications, including those in the adhesives, aerospace, automotive,
construction products, durable and non-durable consumer products, electronics,
medical, packaging, paints and coatings, power generation, refining and
synthetic fiber industries. We are a leading global producer in many of our key
product lines, including MDI, amines, surfactants, epoxy-based polymer
formulations, maleic anhydride and titanium dioxide. Our administrative,
research and development and manufacturing operations are primarily conducted
at the 67 facilities that we own or lease. Our facilities are located in 24
countries and we employ approximately 10,800 associates worldwide. Our
businesses benefit from significant integration, large production scale and
proprietary manufacturing technologies, which allow us to maintain a low-cost
position.
Our
Products and Segments
Our
business is organized around our six segments: Polyurethanes, Advanced
Materials, Performance Products, Pigments, Polymers and Base Chemicals. These
segments can be divided into two broad categories: differentiated and
commodity. We produce differentiated products primarily in our Polyurethanes,
Advanced Materials and Performance Products segments. These products serve
diverse end markets and are generally characterized by historical growth in
excess of GDP growth, resulting from product substitution and new product
development, proprietary manufacturing processes and product formulations and a
high degree of customer loyalty. Demand for these products tends to be driven
by the value-added attributes
3
that they create in our customers’ end-use applications. While the
demand for these differentiated products is also influenced by worldwide
economic conditions and GDP growth, our differentiated products have tended to
produce more stable profit margins and higher demand growth rates than our
commodity products.
In our
commodity chemical businesses, we produce titanium dioxide derived from
titanium-bearing ores in our Pigments segment and petrochemical-based olefins,
aromatics and polyolefins products in our Polymers and Base Chemicals segments.
Since the coatings industry consumes a substantial portion of titanium dioxide
production, seasonal demand patterns in the coatings industry drive the
profitability of our Pigments segment; profitability is also driven by
industry-wide operating rates, with a lag of up to twelve months due to the
effects of stocking and destocking by customers and suppliers. The
profitability of our Polymers and Base Chemicals segments has historically been
cyclical in nature. The industry has recently operated in an up cycle that
resulted primarily from strong demand reflecting global economic conditions and
the fact that there have been no recent North American or European capacity
additions. However, volatile crude oil and natural gas-based raw materials
costs and a recent weakening in demand could negatively impact the future profitability
of our Polymers and Base Chemicals segments.
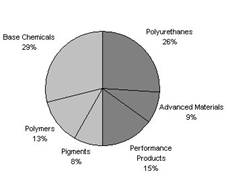
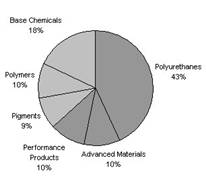
|
2005
Segment Revenues*
|
|
2005
Segment EBITDA*
|
|
|
|
|
|

|
Differentiated
|
|
|
Commodity
|
* Percentage
allocations in the segment revenues chart above reflect the allocation of all
inter-segment revenue eliminations to our Base Chemicals segment. Percentage
allocations in the segment EBITDA chart above do not give effect to $410.3 million
of corporate and other unallocated items and exclude $123.6 million of
restructuring, impairment and plant closing costs. For a detailed discussion of
our revenues, total assets and EBITDA by segment, see “Note 26. Operating
Segment Information” to our Consolidated Financial Statements included
elsewhere in this report. For a discussion of EBITDA and a reconciliation of
EBITDA to net income and cash provided by operating activities, see “Part II.
Item 7. Management’s Narrative Analysis of Results of Operations—Results
of Operations.”
The
following table identifies the key products, their principal end markets and
applications and representative customers of each of our segments:
4
|
Segment
|
|
Products
|
|
End Markets and Applications
|
|
Representative Customers
|
|
Polyurethanes
|
|
MDI, PO, polyols,
PG, TPU, aniline and MTBE(1)
|
|
automotive
interiors, refrigeration and appliance insulation, construction products,
footwear, furniture cushioning, adhesives, specialized engineering
applications and fuel additives
|
|
BMW, Electrolux,
Firestone, GE, Haier, Lear, Louisiana Pacific, Shell, Weyerhauser
|
|
|
|
|
|
|
|
|
|
Advanced
Materials
|
|
epoxy resin
compounds and formulations; cross-linking, matting and curing agents; epoxy,
acrylic and polyurethane-based adhesives and tooling resin formulations
|
|
adhesives,
aerospace, electrical power transmission, consumer electronics, civil
engineering, wind power generation and automotive
|
|
ABB, Akzo, BASF,
Boeing, Bosch, Cytec, Hexcel, Rohm & Haas, Sherwin Williams
|
|
|
|
|
|
|
|
|
|
Performance
Products
|
|
amines,
surfactants, linear alkylbenzene, maleic anhydride, other performance
chemicals, glycols, and technology licenses
|
|
detergents,
personal care products, agrochemicals, lubricant and fuel additives,
adhesives, paints and coatings, construction, marine and automotive products
and PET fibers and resins
|
|
ChevronTexaco, Colgate, Ecolab, Henkel, Monsanto,
Procter & Gamble, Unilever, Lubrizol, Reichhold
|
|
|
|
|
|
|
|
|
|
Pigments
|
|
titanium dioxide
|
|
paints and
coatings, plastics, paper, printing inks, fibers and ceramics
|
|
Akzo, Atofina, Clariant, ICI, Jotun, PolyOne
|
|
|
|
|
|
|
|
|
|
Polymers
|
|
LDPE and LLDPE,
polypropylene, EPS, styrene and APAO
|
|
flexible and
rigid packaging, adhesives and automotive, medical and construction products
|
|
Ashland, Kerr,
Kimberly Clark, Pliant, Polymer Group, PolyOne, Sealed Air
|
|
|
|
|
|
|
|
|
|
Base Chemicals
|
|
ethylene,
propylene, butadiene,(2) benzene, cyclohexane, paraxylene and MTBE(2)
|
|
packaging film,
polyester and nylon fibers, PVC, cleaning compounds, polymer resins, SBR
rubber and fuel additives
|
|
Bayer, BP,
Bridgestone/Firestone, Dow, DuPont SA, Invista, Goodyear, Nova, Shell, Solvay
|
(1) The PO/MTBE
operations in our Polyurethanes segment are not included in the announced sale
of our U.S. butadiene and MTBE business (operated in our Base Chemicals
segment). See “—Recent Developments—Pending
Sale of U.S. Butadiene and MTBE Business”
above.
(2) We have
announced the sale of our U.S. butadiene and MTBE business operated in our Base
Chemicals segment; this transaction is expected to close in mid-2006. See “—Recent Developments—Pending Sale
of U.S. Butadiene and MTBE Business” above.
Available
Information
We
maintain an Internet website at http://www.huntsman.com. Our annual reports on Form 10-K,
quarterly reports on Form 10-Q, current reports on Form 8-K and
amendments to these reports are available free of charge through our website as
soon as reasonably practicable after we file this material with the SEC. We
also provide electronic or paper copies of our SEC filings free of charge upon
request.
ITEM 1A.
RISK FACTORS
Any of the following risks could materially and
adversely affect our business, results of operations and financial condition.
We have a history of losses and may
incur losses in the future.
We incurred net losses in four of the last five
fiscal years. We will need to continue to generate additional revenues and/or
significantly reduce costs, including interest expense, in order to avoid
additional net losses in future periods. If we do achieve profitability, we may
not sustain or increase profitability on a quarterly or annual basis.
Demand for many of our products is
cyclical, and we may experience prolonged depressed market conditions for such
products.
Historically, the markets for many of our products,
particularly our commodity products, have experienced alternating periods of
tight supply, causing prices and profit margins to increase, followed by
periods of capacity additions, resulting in oversupply and declining prices and
profit margins. Currently, several of our markets continue to experience
conditions of oversupply, and the pricing of our products in these markets is
depressed. Future growth in demand for these products may not be sufficient to
alleviate any existing or future conditions of excess industry capacity, and
such conditions may be sustained or further aggravated by anticipated or
unanticipated capacity additions or other events.
We derive a substantial portion of our revenue from
sales of commodity products. Due to the commodity nature of these products,
competition in these markets is based primarily on price and to a lesser extent
on performance, product quality, product deliverability and customer service.
As a result, we may not be able to protect our market position for these
products by product differentiation and may not be able to pass on cost
increases to our customers. Historically, the prices for our commodity products
have been cyclical and sensitive to relative changes in supply and demand, the
availability and price of feedstocks and general economic conditions. Our other
products may be subject to these same factors, but, typically, the impact of
these factors is greatest on our commodity products.
Significant price volatility or
interruptions in supply of our raw materials may result in increased costs that
we may be unable to pass on to our customers, which could reduce our
profitability.
The prices of the raw materials
that we purchase from third parties are cyclical and volatile. We purchase a
substantial portion of these raw materials from third party suppliers, and the
cost of these raw materials represents a substantial portion of our operating
expenses. The prices for a number of these raw materials generally follow price
trends of, and vary with market conditions for, crude oil and natural gas
feedstocks, which are highly volatile and cyclical. In recent periods we have
experienced significantly higher crude oil prices, which have resulted in
increased raw material prices.
Although we frequently enter into supply agreements
to acquire these raw materials, these agreements typically provide for market
based pricing and provide us only limited protection against price volatility.
While we attempt to match cost increases with corresponding product price
increases, we are not always able to raise product prices immediately or at
all. Timing differences between raw material prices, which may change daily,
and contract product prices, which in many cases are negotiated only monthly or
less often, have had and may continue to have a negative effect on
profitability. If any of our suppliers is unable to meet its obligations under
present supply agreements, we may be forced to pay higher prices to obtain the
necessary raw materials from other sources and we may not be able to increase
prices for our finished products to recoup the higher raw materials cost. In
addition, if any of the raw materials that we use become unavailable within the
geographic area from which they are now sourced, then we may not be able to
obtain suitable and cost effective substitutes. Any underlying cost increase
that we are not able to pass on to our customers or any interruption in supply
of raw materials could increase our costs or decrease our revenues, which could
reduce our profitability.
5
Natural
or other disasters could disrupt our business and result in loss of revenue or
in higher expenses.
Any
natural disaster or other serious disruption at any of our facilities due to
hurricane, fire, earthquake, flood, terrorist attack or any other natural or
man-made disaster could impair our ability to use our facilities and have a
material adverse impact on our revenues and increase our costs and expenses.
Substantially all of our revenues are derived from products manufactured at
facilities, including among others, our U.S. Gulf Coast facilities, which are
exposed to the risk of natural disasters. If there is a natural disaster or
other serious disruption at any of these facilities, it could impair our
ability to adequately supply our customers and negatively impact our operating
results. In addition, many of our current and potential customers are
concentrated in specific geographic areas. A natural disaster in one of these
regions could have a material adverse impact on our U.S. and foreign
operations, operating results and financial condition.
Our available cash and access to
additional capital may be limited by our substantial leverage, which could
restrict our ability to grow our businesses.
We reduced our indebtedness net of cash, including
outstanding borrowings under our off-balance sheet accounts receivable
securitization program, during 2005 by approximately $1.6 billion, but we
still have a substantial amount of indebtedness outstanding. As of December 31,
2005, we had total consolidated outstanding indebtedness of approximately
$4.5 billion (including the current portion of long-term debt). We may
incur substantial additional debt from time to time for a variety of purposes.
Our outstanding debt could have important consequences for our businesses, including:
• a high degree of debt will make us more
vulnerable to a downturn in our businesses, our industry or the economy in
general as a significant percentage of our cash flow from operations will be
required to make payments on our indebtedness, making it more difficult to
react to changes in our business and in market or industry conditions;
• a substantial portion of our future cash flow
from operations may be required to be dedicated to the payment of principal and
interest on indebtedness, thereby reducing the funds available for other
purposes, including the growth of our businesses;
• our ability to obtain additional financing may
be constrained due to our existing level of debt; and
• part of our indebtedness is, and any future
debt may be, subject to variable interest rates, which makes us vulnerable to
increases in interest rates.
Our existing debt instruments contain restrictive
covenants that may limit our ability to utilize our cash flow to operate our
businesses by restricting our ability to, among other things, make prepayments
of certain debt, receive dividends from our subsidiaries, make investments and
merge or consolidate and transfer or sell assets.
As of December 31, 2005, the current portion of
our long term debt totaled $44.6 million. We estimate that our annual
interest expense for 2006 will be approximately $375 million. As of December 31,
2005, we had combined outstanding variable rate borrowings of approximately
$2.3 billion. Assuming a 1% increase in interest rates, without giving
effect to interest rate hedges, our annual interest rate expense would increase
by approximately $23 million.
If we are unable to generate sufficient cash flow or
are otherwise unable to obtain the funds required to meet payments of principal
and interest on our indebtedness, or if we otherwise fail to comply with the
various covenants in the instruments governing our indebtedness, we could be in
default under the terms of those instruments. In the event of a default, a
holder of the indebtedness could elect to declare all the funds borrowed under
those instruments to be due and payable together with accrued and unpaid
interest, the lenders under our credit facilities could elect to terminate
their commitments thereunder and we or one or more of our subsidiaries could be
forced into bankruptcy or liquidation. Any of the foregoing consequences could
restrict our ability to grow our business.
6
A downgrade in the ratings of the
securities of our Company or our subsidiaries could result in increased
interest and other financial expenses related to future borrowings of our
Company or our subsidiaries and could restrict our access to additional capital
or trade credit.
Standard and Poor’s Ratings Services and Moody’s
Investors Service maintain credit ratings for us and our parent, Huntsman
Corporation. Each of these ratings is currently below investment grade. Any
decision by these or other ratings agencies to downgrade such ratings in the
future could result in increased interest and other financial expenses
relating to our future borrowings and could restrict our ability to obtain
additional financing on satisfactory terms. In addition, any downgrade could
restrict our access to, and negatively impact the terms of, trade credit
extended by our suppliers of raw materials.
Existing or future litigation or
legislative initiatives restricting the use of MTBE in gasoline may subject us
or our products to environmental liability, materially reduce our sales and/or
materially increase our costs.
We
produce MTBE, an oxygenate that is blended with gasoline to reduce vehicle air
emissions and to enhance the octane rating of gasoline. The use of MTBE has
become controversial in the U.S. and elsewhere and has been curtailed and may
be eliminated in the future by legislation or regulatory action. For example,
about 25 states have adopted rules that prohibit or restrict the use of
MTBE in gasoline sold in those states. Those states account for a substantial
portion of the “pre-ban” U.S. MTBE market. In addition, the Energy Policy Act
of 2005 is beginning to have an adverse impact on our MTBE business in the
U.S., since it mandates increased use of renewable fuels and eliminates the
oxygenate requirement for reformulated gasoline established by the 1990 Clean
Air Act Amendments. Although the extent of the potential impact of the new law
is still unclear, there have been indications that certain gasoline refiners
and distributors may stop using MTBE and that certain pipeline companies may
stop shipping gasoline containing MTBE. A significant loss in demand for our
MTBE in the U.S. could result in a material loss in revenues or material costs
or expenditures. Moreover, additional phase-outs or other future regulation of
MTBE may result in a reduction in demand for our MTBE in the U.S.
In
2005, we marketed approximately 95% of our MTBE to customers located in the
U.S. for use as a gasoline additive. Most of our 2005 sales of MTBE to U.S.
customers were made pursuant to long-term agreements. During 2006 (and
concluding by the first quarter of 2007), our long-term MTBE sales agreements
will terminate. We anticipate that our 2006 sales of MTBE in the U.S. will
decrease substantially as compared to 2005 levels. Nevertheless, we expect to
continue to sell a portion of our MTBE into the U.S. market, although not
pursuant to any new long-term agreements. We have entered into sales agreements
to sell a significant percentage of our MTBE into the Latin American market,
and we currently believe that we could also sell MTBE relatively efficiently in
Europe and Asia. Nevertheless, as a result of varying market prices and
transportation costs, sales of MTBE in markets outside the U.S. may produce
lower margins than the sale of MTBE in the U.S. We may also elect to use all or
a portion of our precursor TBA to produce saleable products other than MTBE. If
we opt to produce products other than MTBE, necessary modifications to our
facilities will require us to make significant capital expenditures and the
sale of such other products may produce a lower level of cash flow than the
sale of MTBE.
A
number of lawsuits have been filed, primarily against gasoline manufacturers,
marketers and distributors, by persons seeking to recover damages allegedly arising
from the presence of MTBE in groundwater. While we have not been named as a
defendant in any litigation concerning the environmental effects of MTBE, we
cannot provide assurances that we will not be involved in any such litigation
or that such litigation will not have a material adverse effect on our
business, results of operations and financial condition.
Our results of operations may be
adversely affected by fluctuations in currency exchange rates and international
business risks.
Some of our subsidiaries conduct a significant
portion of their business outside the U.S. These operations outside the U.S.
are subject to risks normally associated with international operations. These
risks include the need to convert currencies which may be received for our
products into currencies in which our subsidiaries purchase raw
7
materials
or pay for services, which could result in a gain or loss depending on
fluctuations in exchange rates. In addition, we translate our local currency
financial results into U.S. dollars based on average exchange rates prevailing
during the reporting period or the exchange rate at the end of that period.
During times of a strengthening U.S. dollar, our reported international sales and
earnings may be reduced because the local currency may translate into fewer
U.S. dollars. Because we currently have significant operations located in the
United Kingdom and continental Europe, we are primarily exposed to fluctuations
in the pound sterling, the euro and the Swiss franc. Furthermore, we anticipate
increased exposure to the Chinese renminbi following completion of the
construction of our MDI production facilities in China through our Chinese
joint ventures, currently expected in 2006.
Other risks of international operations include trade
barriers, tariffs, exchange controls, national and regional labor strikes,
social and political risks, general economic risks and required compliance with
a variety of foreign laws, including tax laws. Furthermore, in foreign
jurisdictions where process of law may vary from country to country, we may
experience difficulty in enforcing agreements. In jurisdictions where
bankruptcy laws and practices may vary, we may experience difficulty collecting
foreign receivables through foreign legal systems. The occurrence of these
risks could disrupt the businesses of our international subsidiaries, which
could significantly affect their ability to make distributions to us.
The industries in which we compete
are highly competitive, and we may not be able to compete effectively with our
competitors that have greater financial resources, which could reduce the
trading price of our securities.
The industries in which we operate are highly
competitive. Among our competitors are some of the world’s largest chemical
companies and major integrated petroleum companies that have their own raw
material resources. Some of these companies may be able to produce products
more economically than we can. In addition, some of our competitors have
greater financial resources, which may enable them to invest significant
capital into their businesses, including expenditures for research and
development. If any of our current or future competitors develops proprietary
technology that enables them to produce products at a significantly lower cost,
our technology could be rendered uneconomical or obsolete. Moreover, certain of
our businesses use technology that is widely available. Accordingly, barriers
to entry, apart from capital availability, are low in certain commodity product
segments of our business, and the entrance of new competitors into the industry
may reduce our ability to capture improving profit margins in circumstances
where capacity utilization in the industry is increasing. Further,
petroleum-rich countries have become more significant participants in the
petrochemical industry and may expand this role significantly in the future.
Increased competition in any of our businesses could compel us to reduce the
prices of our products, which could result in reduced profit margins and/or
loss of market share and reduce the trading price of our securities.
Our operations involve risks that may
increase our operating costs, which could reduce our profitability.
Although
we take precautions to enhance the safety of our operations and minimize the
risk of disruptions, our operations are subject to hazards inherent in the
manufacturing and marketing of differentiated and commodity chemical products.
These hazards include chemical spills, pipeline leaks and ruptures, storage
tank leaks, discharges or releases of toxic or hazardous substances or gases
and other hazards incident to the manufacturing, processing, handling,
transportation and storage of dangerous chemicals. We are also potentially subject to other
hazards, including natural disasters and severe weather; explosions and fires;
transportation problems, including interruptions, spills and leaks; mechanical
failures; unscheduled downtimes; labor difficulties; remediation complications;
and other risks.
Many
of these hazards can cause bodily injury and loss of life, severe damage to or
destruction of property and equipment and environmental damage, and may result
in suspension of operations and the imposition of civil or criminal penalties
and liabilities. Furthermore, we are subject to present and future claims with
respect to workplace exposure, exposure of contractors on our premises as well
as other persons located nearby, workers' compensation and other matters.
We maintain property, business interruption and
casualty insurance policies which we believe are in accordance with customary
industry practices, but we are not fully insured against all potential hazards
and risks incident to our business. We maintain property damage and business
interruption insurance policies with aggregate limits of $1 billion per
occurrence and products liability and sudden and accidental insurance policies
with aggregate per occurrence and annual limits of $600 million. We also
maintain insurance policies covering other types of risks, including pollution
legal liability insurance. Each of these insurance policies is subject to
customary exclusions, deductibles and coverage limits. As a result of market
conditions, premiums and deductibles for certain insurance policies can
increase substantially and, in some instances, certain insurance may become
unavailable or available
8
only
for reduced amounts of coverage. If we were to incur a significant liability
for which we were not fully insured, it could materially increase our operating
costs and therefore reduce our profitability.
In addition, we are subject to various claims and
litigation in the ordinary course of business. In conjunction with many of our
past acquisitions, we have obtained indemnity agreements from the prior owners
addressing liabilities that may arise from operations and events prior to our
ownership. We are a party to several pending lawsuits and proceedings. It is
possible that a judgment could be rendered against us in these cases or others
in which we could be uninsured or not covered by indemnity and beyond the
amounts that we currently have reserved or anticipate incurring for such
matters. See “Item 1. Business—Environmental, Health and Safety Matters” and “Item
3. Legal Proceedings.”
We are subject to many environmental
and safety regulations that may result in unanticipated costs or liabilities,
which could reduce our profitability.
We are subject to extensive federal, state, local and
foreign laws, regulations, rules and ordinances relating to pollution,
protection of the environment and the generation, storage, handling,
transportation, treatment, disposal and remediation of hazardous substances and
waste materials. Actual or alleged violations of environmental laws or permit
requirements could result in restrictions or prohibitions on plant operations,
substantial civil or criminal sanctions, as well as, under some environmental
laws, the assessment of strict liability and/or joint and several liability.
Moreover, changes in environmental regulations could inhibit or interrupt our
operations, or require us to modify our facilities or operations. Accordingly,
environmental or regulatory matters may cause us to incur significant
unanticipated losses, costs or liabilities, which could reduce our
profitability. See “Item 1. Business—Environmental, Health and Safety Matters”
and “Item 3. Legal Proceedings.”
In addition, we could incur significant expenditures
in order to comply with existing or future environmental or safety laws.
Capital expenditures and costs relating to environmental or safety matters will
be subject to evolving regulatory requirements and will depend on the timing of
the promulgation and enforcement of specific standards which impose
requirements on our operations. Capital expenditures and costs beyond those
currently anticipated may therefore be required under existing or future
environmental or safety laws.
Furthermore, we may be liable for the costs of investigating
and cleaning up environmental contamination on or from our properties or at
off-site locations where we disposed of or arranged for the disposal or
treatment of hazardous materials or from disposal activities that pre-dated our
purchase of our businesses. We may therefore incur additional costs and
expenditures beyond those currently anticipated to address all such known and
unknown situations under existing and future environmental laws. See “Item 1.
Business—Environmental, Health and Safety Matters” and “Item 3. Legal
Proceedings.”
We can provide no assurance that our internal control over our
financial reporting will be effective when Section 404 of the Sarbanes-Oxley
Act of 2002 becomes applicable to us.
Under
Section 404 of the Sarbanes-Oxley Act of 2002 and the rules issued thereunder,
our management is required to conduct an evaluation of the effectiveness of our
internal control over financial reporting as of each year-end, beginning
December 31, 2006. From that point, we will be required to include in our
annual report on Form 10-K a report on our management’s assessment of the
effectiveness of our internal control over financial reporting. Our independent registered public accounting
firm will also issue an audit report on management’s assessment and on our
internal control over financial reporting.
We
have undertaken significant efforts in preparation for the requirements of
Section 404. However, given the complexities and inherent risks associated with
the operation of internal control over financial reporting, we can provide no
assurance that our internal control over financial reporting will be effective
when Section 404 becomes applicable to us.
Moreover, we can provide no assurance as to any matters that might be
reported in our management’s assessment of our internal control over financial
reporting or our independent registered public accounting firm’s audit
report. Ineffective internal control
over financial reporting could cause investors to lose confidence in our
reported financial information and could result in a lower trading price for
our securities.
Our business is dependent on our
intellectual property. If our patents are declared invalid or our trade secrets
become known to our competitors, our ability to compete may be impaired.
Proprietary protection of our processes, apparatuses
and other technology is important to our business. Consequently, we may have to
rely on judicial enforcement of our patents and other proprietary rights. While
a presumption of validity exists with respect to patents issued to us in the
U.S., there can be no assurance that any of our patents will not be challenged,
invalidated, circumvented or rendered unenforceable. Furthermore, if any
pending patent application filed by us does not result in an issued patent, or
if patents are issued to us, but such patents do not provide meaningful
protection of our intellectual property, then our ability to compete may be
adversely affected. Additionally, our competitors or other third parties may
obtain patents that restrict or preclude our ability to lawfully produce or
sell our products in a competitive manner, which could result in significantly
lower revenues, reduced profit margins and/or loss of market share.
We also rely upon unpatented proprietary know-how and
continuing technological innovation and other trade secrets to develop and
maintain our competitive position. While it is our policy to enter into
confidentiality agreements with our employees and third parties to protect our
intellectual property, these confidentiality agreements may be breached, may
not provide meaningful protection for our trade secrets or proprietary
know-how, or adequate remedies may not be available in the event of an
unauthorized use or disclosure of our trade secrets and know-how. In addition,
others could obtain knowledge of our trade secrets through independent
development or
9
other
access by legal means. The failure of our patents or confidentiality agreements
to protect our processes, apparatuses, technology, trade secrets or proprietary
know-how could result in significantly lower revenues, reduced profit margins
and/or loss of market share.
Loss of key members of our management
could disrupt our business.
We depend on the continued employment and performance
of our senior executives and other key members of management. If any of these
individuals resigns or becomes unable to continue in his present role and is
not adequately replaced, our business operations and our ability to implement
our growth strategies could be materially disrupted. We generally do not have
employment agreements with, and we do not maintain any “key man” life insurance
for, any of our executive officers.
Terrorist attacks, such as the
attacks that occurred on September 11, 2001, the continuing military
action in Iraq, general instability in various OPEC member nations, the threat
of other attacks or acts of war in the U.S. and abroad and increased security
regulations related to our industry could adversely affect our business.
The attacks of September 11, 2001, and
subsequent events, including the continuing military action in Iraq, have
caused instability in the U.S. and other financial markets and have led, and
may continue to lead, to further armed hostilities, prolonged military action
in Iraq, or further acts of terrorism in the U.S. or abroad, which could cause
further instability in financial markets. Current regional tensions and
conflicts in various OPEC member nations, including the continuing military
action in Iraq, have caused, and may cause further, increases in raw material
costs, particularly natural gas and crude oil based feedstocks, which are used
in our operations. The uncertainty surrounding the continuing military action in
Iraq and the threat of further armed hostilities or acts of terrorism may
impact any or all of our physical facilities and operations, which are located
in North America, Europe, Australia, Asia, Africa, South America and the Middle
East, or those of our customers. Furthermore, terrorist attacks, subsequent
events and future developments in any of these areas may result in reduced
demand from our customers for our products. In addition, local, state and
federal governments have begun a regulatory process that could lead to new
regulations impacting the security of chemical plant locations and the
transportation of hazardous chemicals, which could result in higher operating
costs. These developments will subject our worldwide operations to increased
risks and, depending on their magnitude, could result in significant
unanticipated costs, lower revenues and/or reduced profit margins.
Future acquisitions, partnerships and
joint ventures may require significant resources and/or result in significant
unanticipated losses, costs or liabilities.
In the future we may seek to grow our Company and
businesses by making acquisitions or entering into partnerships and joint
ventures. Any future acquisition, partnership or joint venture may require that
we make a significant cash investment, issue stock or incur substantial debt.
In addition, acquisitions, partnerships or investments may require significant
managerial attention, which may be diverted from our other operations. These
capital, equity and managerial commitments may impair the operation of our
businesses. Furthermore, any future acquisitions of businesses or facilities
could entail a number of additional risks, including:
• problems
with effective integration of operations;
• the
inability to maintain key pre-acquisition business relationships;
• increased
operating costs;
• exposure
to unanticipated liabilities; and
• difficulties
in realizing projected efficiencies, synergies and cost savings.
We
have incurred indebtedness to finance past acquisitions. We may finance future
acquisitions with additional indebtedness and/or by issuing additional equity
securities. As a result, we could face the financial risks associated with
incurring additional indebtedness such as reducing our liquidity and access to
financing markets and increasing the amount of cash flow required to service
such indebtedness.
10
ITEM 1B.
UNRESOLVED STAFF COMMENTS
As of December 31,
2005, we did not have any unresolved comments with the staff of the SEC.
ITEM 2.
PROPERTIES
We own
or lease chemical manufacturing and research facilities in the locations
indicated in the list below which we currently believe are adequate for our
short-term and anticipated long-term needs. We own or lease office space and
storage facilities throughout the U.S. and many foreign countries. Our
principal executive offices are located at 500 Huntsman Way, Salt Lake City,
Utah 84108. The following is a list of our material owned or leased properties
where manufacturing, research and main office facilities are located.
|
Location
|
|
Business Segment
|
|
Description of Facility
|
|
Salt Lake City,
Utah
|
|
—
|
|
Executive
Offices
|
|
The Woodlands,
Texas(1)
|
|
—
|
|
Operating
Headquarters, Global Technology Center
|
|
Geismar,
Louisiana(2)
|
|
Polyurethanes
|
|
MDI,
Nitrobenzene(5), Aniline(5) and Polyols Manufacturing Facilities and
Polyurethanes Systems House
|
|
Rozenburg,
Netherlands(1)
|
|
Polyurethanes
|
|
MDI
Manufacturing Facility, Polyols Manufacturing Facilities and Polyurethanes
Systems House
|
|
Auburn Hills,
Michigan(1)
|
|
Polyurethanes
|
|
Polyurethane
Research Facility
|
|
Deerpark,
Australia
|
|
Polyurethanes
|
|
Polyurethane
Systems House
|
|
Cartagena,
Colombia
|
|
Polyurethanes
|
|
Polyurethane
Systems House
|
|
Deggendorf,
Germany
|
|
Polyurethanes
|
|
Polyurethane
Systems House
|
|
Ternate, Italy
|
|
Polyurethanes
|
|
Polyurethane
Systems House
|
|
Shanghai,
China(1)
|
|
Polyurethanes
|
|
Polyurethane
Systems House
|
|
Thane
(Maharashtra), India(1)
|
|
Polyurethanes
|
|
Polyurethane
Systems House
|
|
Samuprakam,
Thailand(1)
|
|
Polyurethanes
|
|
Polyurethane
Systems House
|
|
Kuan Yin,
Taiwan(1)
|
|
Polyurethanes
|
|
Polyurethane
Systems House
|
|
Tlalnepantla,
Mexico
|
|
Polyurethanes
|
|
Polyurethane
Systems House
|
|
Mississauga,
Ontario(1)
|
|
Polyurethanes
|
|
Polyurethane
Systems House
|
|
Everberg,
Belgium
|
|
Polyurethanes
|
|
Polyurethane
Research Facility/Performance Products Regional HQ
|
|
Gateway West,
Singapore(1)
|
|
Polyurethanes
|
|
Polyurethane
Commercial Center
|
|
Derry, New
Hampshire(1)
|
|
Polyurethanes
|
|
TPU Research
Facility
|
|
Ringwood,
Illinois(1)
|
|
Polyurethanes
|
|
TPU
Manufacturing Facility
|
|
Osnabrück,
Germany
|
|
Polyurethanes
|
|
TPU
Manufacturing Facility
|
|
Port Neches,
Texas(3)
|
|
Polyurethanes,
Performance Products and Base Chemicals
|
|
Olefins,
Aromatics, EO, EG, Surfactants, Amines and PO Manufacturing Facilities
|
|
Wilton, U.K.
|
|
Polyurethanes and
Base Chemicals
|
|
Olefins and
Aromatics Manufacturing Facilities and Aniline and Nitrobenzene Manufacturing
Facilities
|
|
Bergkamen,
Germany(4)
|
|
Advanced
Materials
|
|
Synthesis
Facility
|
|
Monthey,
Switzerland
|
|
Advanced
Materials
|
|
Resins and
Synthesis Facility
|
|
Pamplona, Spain
|
|
Advanced
Materials
|
|
Resins and
Synthesis Facility
|
|
McIntosh,
Alabama
|
|
Advanced
Materials
|
|
Resins and
Synthesis Facility
|
|
Chennai,
India(3)
|
|
Advanced
Materials
|
|
Resins and
Synthesis Facility
|
|
Bad Saeckingen,
Germany(1)
|
|
Advanced
Materials
|
|
Formulating
Facility
|
|
Duxford, U.K.
|
|
Advanced
Materials
|
|
Formulating
Facility
|
|
Sadat City,
Egypt
|
|
Advanced
Materials
|
|
Formulating
Facility
|
|
Taboão da Serra,
Brazil
|
|
Advanced
Materials
|
|
Formulating
Facility
|
|
Panyu,
China(1)(4)
|
|
Advanced
Materials
|
|
Formulating
Facility
|
|
East Lansing,
Michigan
|
|
Advanced
Materials
|
|
Formulating
Facility
|
|
Istanbul,
Turkey(1)
|
|
Advanced
Materials
|
|
Formulating
Facility
|
|
Los Angeles,
California
|
|
Advanced
Materials
|
|
Formulating
Facility
|
|
Conroe, Texas
|
|
Performance
Products
|
|
Amines Manufacturing
Facility
|
|
Dayton, Texas
|
|
Performance
Products
|
|
Surfactant
Manufacturing Facility
|
|
Chocolate Bayou,
Texas(1)(5)
|
|
Performance
Products
|
|
LAB
Manufacturing Facility
|
|
Pensacola,
Florida(1)(5)
|
|
Performance
Products
|
|
Maleic Anhydride
Manufacturing Facility
|
|
Petfurdo,
Hungary(1)
|
|
Performance
Products
|
|
Amines
Manufacturing Facility
|
|
Botany,
Australia
|
|
Performance
Products
|
|
Surfactant
Manufacturing Facility
|
|
Llanelli, U.K.
|
|
Performance
Products
|
|
Amines
Manufacturing Facility
|
|
St. Mihiel,
France
|
|
Performance
Products
|
|
Surfactant
Manufacturing Facility
|
|
Lavera,
France(1)
|
|
Performance
Products
|
|
Surfactant
Manufacturing Facility
|
|
Castiglione,
Italy
|
|
Performance
Products
|
|
Surfactant
Manufacturing Facility
|
|
Patrica/Frosinone,
Italy
|
|
Performance
Products
|
|
Surfactant
Manufacturing Facility
|
|
Barcelona,
Spain(1)
|
|
Performance
Products
|
|
Surfactant
Manufacturing Facility
|
11
|
Whitehaven,
U.K.(1)(6)
|
|
Performance
Products
|
|
Surfactant
Manufacturing Facility
|
|
Freeport, Texas(1)
|
|
Performance
Products
|
|
Amines
Manufacturing Facility
|
|
Greatham, U.K.
|
|
Pigments
|
|
Titanium Dioxide
Manufacturing Facility
|
|
Grimsby, U.K.
|
|
Pigments
|
|
Titanium Dioxide
Manufacturing Facility
|
|
Calais, France
|
|
Pigments
|
|
Titanium Dioxide
Manufacturing Facility
|
|
Huelva, Spain
|
|
Pigments
|
|
Titanium Dioxide
Manufacturing Facility
|
|
Scarlino, Italy
|
|
Pigments
|
|
Titanium Dioxide
Manufacturing Facility
|
|
Teluk Kalung,
Malaysia
|
|
Pigments
|
|
Titanium Dioxide
Manufacturing Facility
|
|
Lake Charles,
Louisiana(7)
|
|
Pigments
|
|
Titanium Dioxide
Manufacturing Facility
|
|
Umbogintwini,
South Africa
|
|
Pigments
|
|
Titanium Dioxide
Manufacturing Facility
|
|
Billingham, U.K.
|
|
Pigments
|
|
Titanium Dioxide
Research and Technical Facility
|
|
Peru, Illinois
|
|
Polymers
|
|
EPS
Manufacturing Facility
|
|
Marysville, Michigan
|
|
Polymers
|
|
Polypropylene
Manufacturing Facility
|
|
Longview,
Texas(1)
|
|
Polymers
|
|
Polypropylene
Manufacturing Facility
|
|
Odessa, Texas
|
|
Polymers
|
|
Polyethylene
Manufacturing Facility
|
|
Mansonville,
Quebec
|
|
Polymers
|
|
EPS
Manufacturing Facility
|
|
West Footscray,
Australia
|
|
Polymers
|
|
Styrenics
Manufacturing Facility
|
|
Port Arthur,
Texas
|
|
Base Chemicals
|
|
Olefins and
Aromatics Manufacturing Facility
|
|
Sour Lake, Texas
|
|
Base Chemicals
|
|
Various finished
raw materials pipelines and storage facilities
|
|
North Tees, U.K.(1)
|
|
Base Chemicals
|
|
Aromatics
Manufacturing Facility and Logistics & Storage Assets
|
(1) Leased
land and/or building.
(2) The
Geismar facility is owned as follows: we own 100% of the MDI and polyol
facilities, and Rubicon LLC, a consolidated manufacturing joint venture with
Chemtura Corporation in which we own a 50% interest, owns the aniline and
nitrobenzene facilities. Rubicon LLC is a separate legal entity that operates
both the assets that we own jointly with Chemtura Corporation and our wholly-owned
assets at Geismar.
(3) 76%-owned
manufacturing joint venture with Tamilnadu Petroproducts Limited.
(4) 95%-owned
manufacturing joint venture with Guangdong Panyu Shilou Town Economic
Development Co. Ltd.
(5) These
plants are operated by Solutia under long-term operating agreements. Solutia
and certain of its affiliates have filed a voluntary petition for relief under
Chapter 11 of the U.S. Bankruptcy Code. We expect that Solutia will continue to
operate these plants, although no assurance can be given at this time. During
the course of the bankruptcy proceeding, it is possible that Solutia may reject
any of the agreements under which it operates the plants. It is also possible
that Solutia’s reorganization under Chapter 11 may fail and that it would
proceed to a liquidation under Chapter 7. If Solutia were to discontinue
operation of any of these plants, it may be difficult to arrange for
uninterrupted operation.
(6) We
have substantially reduced our operations at this site during 2005.
(7) 50%-owned
manufacturing joint venture with Kronos Louisiana, Inc., a subsidiary of
Kronos Worldwide, Inc.
ITEM 3.
LEGAL PROCEEDINGS
Discoloration
Claims
Certain
claims have been filed against us relating to discoloration of unplasticized
polyvinyl chloride products allegedly caused by our titanium dioxide (“Discoloration
Claims”). Substantially all of the titanium dioxide that is the subject of
these claims was manufactured prior to our acquisition of our titanium dioxide
business from ICI in 1999. Net of amounts we have received from insurers and
pursuant to contracts of indemnity, we have paid approximately $16 million
in costs and settlement amounts for Discoloration Claims as of December 31,
2005.
The
following table presents information about the number of Discoloration Claims
for the periods indicated. Claims include all claims for which service has been
received by us, and each such claim represents a plaintiff who is pursuing a
claim against us.
12
|
|
|
Year ended
December 31, 2005
|
|
Year ended
December 31, 2004
|
|
Year ended
December 31, 2003
|
|
|
Claims filed during period
|
|
0
|
|
1
|
|
1
|
|
|
Claims resolved during period
|
|
1
|
|
2
|
|
2
|
|
|
Claims unresolved at end of period
|
|
2
|
|
3
|
|
4
|
|
During
the year ended December 31, 2004, we settled claims for approximately
$45 million, approximately $30 million of which was paid by our
insurers or ICI and approximately $15 million of which was paid by us.
During 2004, we recorded charges of $15.1 million relating to Discoloration
Claims. During the year ended December 31, 2005, we settled a claim for
approximately $1 million, all of which was paid by ICI. The two Discoloration
Claims unresolved as of December 31, 2005 asserted aggregate damages of
approximately $63 million. An appropriate liability has been accrued for
these claims. Based on our understanding of the merits of these claims and our
rights under contracts of indemnity and insurance, we do not believe that the
net impact on our financial condition, results of operations or liquidity will
be material.
While
additional Discoloration Claims may be made in the future, we cannot reasonably
estimate the amount of loss related to such claims. Although we may incur
additional costs as a result of future claims (including settlement costs),
based on our history with Discoloration Claims to date, the fact that
substantially all of the titanium dioxide that has been the subject of these
Discoloration Claims was manufactured and sold more than six years ago, and the
fact that we have rights under contract to indemnity, including from ICI, we do
not believe that any unasserted Discoloration Claims will have a material
impact on our financial condition, results of operations, or liquidity. Based
on this conclusion and our inability to reasonably estimate our expected costs
with respect to these unasserted claims, we have made no accruals in our
financial statements as of December 31, 2005 for costs associated with
unasserted Discoloration Claims.
Ciba
Settlement
Vantico,
acquired by us in June 2003, concluded that certain of the products of its
former Electronics division may have infringed patents owned by Taiyo and it
entered into a license agreement in October 2001 with Taiyo to obtain the
right to use the Taiyo patents. This license agreement required payment of
approximately $4 million in back royalties and agreement to pay periodic
royalties for future use. We believe that Ciba Specialty Chemicals
Holdings Inc. (“Ciba”) is liable under the indemnity provisions of certain
agreements in connection with the leveraged buy-out transaction in 2000
involving Ciba and Vantico for certain payments made under the license
agreement and related costs and expenses, and we initiated an arbitration
proceeding against Ciba. In July 2004, we entered into a settlement
agreement with Ciba with respect to this matter. In general, the settlement
agreement provided that Ciba would pay us $11.1 million in 2004. We
received additional consideration in the form of modifications to certain
operating agreements between us and Ciba. In August 2004, we received
payment of the $11.1 million settlement.
Environmental
Litigation
We
have been a party to various lawsuits brought by persons alleging personal
injuries and/or property damage based upon alleged exposure to toxic air
emissions. For example, since June 2003, a number of lawsuits have been
filed in state district court in Jefferson County, Texas against several local
chemical plants and refineries, including our subsidiary, Huntsman
Petrochemical Corporation. Generally, these lawsuits have alleged that the
refineries and chemical plants located in the vicinity of the plaintiffs’ homes
discharged chemicals into the air that interfere with use and enjoyment of
property and cause health problems and/or property damages. None of these
lawsuits have included the amount of damages being sought. The following table
presents information about the number of claims asserting damages based upon
alleged exposure to toxic air emissions for the periods indicated. Claims
include all claims for which service has been received by us, and each such
claim represents a plaintiff who is pursuing a claim against us.
|
|
|
Year ended
December 31, 2005
|
|
Year ended
December 31, 2004
|
|
Year ended
December 31, 2003
|
|
|
Claims filed during period
|
|
2,104
|
|
214
|
|
721
|
|
|
Claims resolved during period
|
|
2,988
|
|
51
|
|
0
|
|
|
Claims unresolved at end of period
|
|
0
|
|
884
|
|
721
|
|
All claims filed as of December 31,
2005 have been resolved through dismissal and/or settlement.
13
In
addition, we have been named as a “premises defendant” in a number of asbestos
exposure cases, typically a claim by a non-employee of exposure to asbestos
while at a facility. In the past, these cases typically have involved multiple
plaintiffs bringing actions against multiple defendants, and the complaint has
not indicated which plaintiffs were making claims against which defendants,
where or how the alleged injuries occurred, or what injuries each plaintiff
claimed. These facts, which would be central to any estimate of probable loss,
generally have been learned only through discovery. Recent changes in Texas
tort procedures have required many pending cases to be split into multiple
cases, one for each claimant, increasing the number of pending cases reported
below for the year ended December 31, 2005. Nevertheless, the complaints
in these cases provide little additional information. We do not believe that
the increased number of cases reflects an increase in the number of underlying
claims.
Where
the alleged exposure occurred prior to our ownership or operation of the
relevant “premises,” the prior owners and operators generally have
contractually agreed to retain liability for, and to indemnify us against,
asbestos exposure claims. This indemnification is not subject to any time or
dollar amount limitations. Upon service of a complaint in one of these cases,
we tender it to the prior owner or operator. None of the complaints in these
cases state the amount of damages being sought. The prior owner or operator
accepts responsibility for the conduct of the defense of the cases and payment
of any amounts due to the claimants. In our eleven-year experience with
tendering these cases, we have not made any payment with respect to any
tendered asbestos cases. We believe that the prior owners or operators have the
intention and ability to continue to honor their indemnities, although we
cannot assure you that they will continue to do so or that we will not be
liable for these cases if they do not.
The
following table presents for the periods indicated certain information about
cases for which service has been received that we have tendered to the prior
owner or operator, all of which have been accepted.
|
|
|
Year ended
December 31, 2005
|
|
Year ended
December 31, 2004
|
|
Year ended
December 31, 2003
|
|
|
Tendered during period
|
|
284
|
|
94
|
|
|
|
|
Resolved during period
|
|
106
|
|
65
|
|
|
|
|
Unresolved at end of period
|
|
576
|
|
398
|
|
369
|
|
We
have never made any payments with respect to these cases. As of December 31,
2005, we had an accrued liability of $12.5 million relating to these cases
and a corresponding receivable of $12.5 million relating to our indemnity
protection with respect to these cases. We cannot assure you that our liability
will not exceed our accruals or that our liability associated with these cases
would not be material to our financial condition, results of operations or
liquidity.
Certain
cases in which we are a “premises defendant” are not subject to indemnification
by prior owners or operators. The following table presents for the periods
indicated certain information about these cases. Cases include all cases for
which service has been received by us.
|
|
|
Year ended
December 31, 2005
|
|
Year ended
December 31, 2004
|
|
Year ended
December 31, 2003
|
|
|
Filed during period
|
|
55
|
|
23
|
|
|
|
|
Resolved during period
|
|
56
|
|
42
|
|
|
|
|
Unresolved at end of period
|
|
34
|
|
29
|
|
48
|
|
We paid gross settlement costs for asbestos exposure
cases that are not subject to indemnification of $0.1 million,
$1.0 million and $0.2 million in 2005, 2004 and 2003, respectively. The cases for the year ended December 31,
2005 include cases filed against Rubicon LLC, which became our consolidated
subsidiary on January 1, 2005, as follows: one case filed during the
period, one case resolved during the period and six cases unresolved at the end
of the period.
As of December 31,
2005, we had an accrual of $0.9 million relating to these cases. We cannot
assure you that our liability will not exceed our accruals or that our
liability associated with these cases would not be material to our financial
condition, results of operations or liquidity.
Antitrust
Matters
We
have been named as a defendant in putative class action antitrust suits
alleging a conspiracy to fix prices in the MDI, TDI, and polyether polyols
industries that are now consolidated as the “Polyether Polyols Cases” in
multidistrict litigation known as In re Urethane Antitrust Litigation,
MDL No. 1616, Civil No. 2:04-md-01616-JWL-DJW, United States District
Court, District of Kansas, initial order transferring and consolidating cases
filed August 23, 2004. Other defendants named in the Polyether Polyols
Cases are Bayer, BASF, Dow, and Lyondell. Bayer has announced that it has entered
into a settlement agreement with the plaintiffs.
14
These
consolidated cases are in the early stages of class certification discovery.
The pleadings of the plaintiffs do not provide specifics about any alleged
illegal conduct of the defendants and we are not aware of any evidence of
illegal conduct by us or any of our employees. For these reasons, we cannot
estimate the possible loss or range of loss relating to these claims, and
therefore we have not accrued a liability for these claims. Nevertheless, we
could incur losses due to these claims in the future and those losses could be
material.
In
addition, on February 16, 2006, the Antitrust Division of the U.S.
Department of Justice served us with a grand jury subpoena requesting the
production of documents relating to sales and pricing of TDI, MDI, polyether
polyols and related systems. Bayer and Lyondell have announced that they have
also been served with subpoenas in this matter. We intend to cooperate fully in
this matter.
Tax
Dispute
In connection with the audit
of our income tax returns for the years ended 1998 through 2001, we received a
Notice of Proposed Adjustment from the Internal Revenue Service and in late 2005,
we initiated an administrative appeal before the Internal Revenue Service. The
potential liability and the potential reduction to our net operating losses
have been reserved in our financial statements. For more information on this
matter, including the potential net adjustment to our net operating losses, see
“Note 18. Income Taxes” to our Consolidated Financial Statements included
elsewhere in this report.
Other
Proceedings
We are
a party to various other proceedings instituted by private plaintiffs,
governmental authorities and others arising under provisions of applicable
laws, including various environmental, products liability and other laws.
Except as otherwise disclosed in this report, we do not believe that the
outcome of any of these matters will have a material adverse effect on our
financial condition, results of operations or liquidity. See “Item 1.
Business—Environmental, Health and Safety Matters” for a discussion of
environmental proceedings.
ITEM 4.
SUBMISSION OF MATTERS TO A VOTE OF SECURITY HOLDERS
Omitted
in accordance with General Instruction I of Form 10-K.
15
PART II
ITEM 5.
MARKET FOR REGISTRANT’S COMMON EQUITY, RELATED STOCKHOLDER MATTERS AND ISSUER
PURCHASES OF EQUITY SECURITIES
Market
Information
As of
the date of this report, there was no established public trading market for any
class of our membership interests.
Holders
As of
the date of this report, Huntsman Corporation was the only holder of record of
our membership interests.
Distributions
Our
senior secured credit facilities restrict our ability to pay dividends or other
distributions on our equity interests, including prohibiting us from making
distributions to Huntsman Corporation for the purpose of paying principal,
interest or premium on any outstanding notes of Huntsman Corporation. The
indentures governing our outstanding notes also place certain restrictions on
our ability to pay dividends and make other distributions.
The
restrictions contained in the indentures governing our notes may prevent us
from making any “restricted payments,” including (i) any dividends,
distributions or other payments to holders of our equity interests or (ii) payments
to purchase, redeem or otherwise acquire or retire for value any of our equity
interests, subject to certain exceptions contained in such indentures.
ITEM 6.
SELECTED FINANCIAL DATA
Omitted
in accordance with General Instruction I of Form 10-K.
16
ITEM 7.
MANAGEMENT’S NARRATIVE ANALYSIS OF RESULTS OF OPERATIONS
Results of Operations
The
following sets forth the condensed consolidated results of operations for the
years ended December 31, 2005, 2004 and 2003 (dollars in millions):
|
|
|
Year ended December 31,
|
|
Percent Change
|
|
|
|
|
2005
|
|
2004
|
|
2003
|
|
2005 vs. 2004
|
|
2004 vs. 2003
|
|
|
|
|
|
|
|
|
|
|
|
|
|
|
|
Revenues
|
|
$
|
12,961.6
|
|
$
|
11,426.4
|
|
$
|
7,646.3
|
|
13
|
%
|
49
|
%
|
|
Cost of goods sold
|
|
11,190.4
|
|
10,025.1
|
|
6,836.2
|
|
12
|
%
|
47
|
%
|
|
Gross profit
|
|
1,771.2
|
|
1,401.3
|
|
810.1
|
|
26
|
%
|
73
|
%
|
|
Operating expenses
|
|
815.4
|
|
667.6
|
|
518.4
|
|
22
|
%
|
29
|
%
|
|
Restructuring, impairment and plant closing costs
|
|
123.6
|
|
299.3
|
|
55.0
|
|
(59
|
)%
|
444
|
%
|
|
|
|
|
|
|
|
|
|
|
|
|
|
|
Operating income
|
|
832.2
|
|
434.4
|
|
236.7
|
|
92
|
%
|
84
|
%
|
|
|
|
|
|
|
|
|
|
|
|
|
|
|
Interest expense, net
|
|
(425.6
|
)
|
(592.6
|
)
|
(480.5
|
)
|
(28
|
)%
|
23
|
%
|
|
Loss on accounts receivable securitization program
|
|
(10.7
|
)
|
(15.6
|
)
|
(32.4
|
)
|
(31
|
)%
|
(52
|
)%
|
|
Equity in income of unconsolidated affiliates
|
|
8.2
|
|
4.0
|
|
1.7
|
|
105
|
%
|
135
|
%
|
|
Other expense
|
|
(167.5
|
)
|
(25.8
|
)
|
(0.7
|
)
|
549
|
%
|
NM
|
|
|
|
|
|
|
|
|
|
|
|
|
|
|
|
Income
(loss) from continuing operations before income taxes, minority interests and
accounting changes
|
|
236.6
|
|
(195.6
|
)
|
(275.2
|
)
|
NM
|
|
(29
|
)%
|
|
Income tax (expense) benefit
|
|
(42.8
|
)
|
22.9
|
|
(41.0
|
)
|
NM
|
|
NM
|
|
|
Minority interest (expense) income
|
|
(1.7
|
)
|
(7.2
|
)
|
1.5
|
|
(76
|
)%
|
NM
|
|
|
Income (loss) from continuing operations
|
|
192.1
|
|
(179.9
|
)
|
(314.7
|
)
|
NM
|
|
(43
|
)%
|
|
Loss from
discontinued operations (including loss on disposal of $36.4 in 2005), net of
tax
|
|
(43.9
|
)
|
(7.8
|
)
|
(2.6
|
)
|
463
|
%
|
200
|
%
|
|
Cumulative
effect of changes in accounting principle, net of tax of $3.3
|
|
(27.5
|
)
|
—
|
|
—
|
|
NM
|
|
NM
|
|
|
Net income (loss)
|
|
120.7
|
|
(187.7
|
)
|
(317.3
|
)
|
NM
|
|
(41
|
)%
|
|
|
|
|
|
|
|
|
|
|
|
|
|
|
Interest expense, net
|
|
425.6
|
|
592.6
|
|
480.5
|
|
(28
|
)%
|
23
|
%
|
|
Income tax expense (benefit) (1)
|
|
39.5
|
|
(22.9
|
)
|
41.0
|
|
NM
|
|
NM
|
|
|
Depreciation and amortization
|
|
473.9
|
|
499.0
|
|
394.2
|
|
(5
|
)%
|
27
|
%
|
|
EBITDA (2)
|
|
$
|
1,059.7
|
|
$
|
881.0
|
|
$
|
598.4
|
|
20
|
%
|
47
|
%
|
|
|
|
|
|
|
|
|
|
|
|
|
|
|
|
|
|
Net cash provided by operating activities
|
|
$
|
988.3
|
|
$
|
181.6
|
|
$
|
215.9
|
|
444
|
%
|
(16
|
)%
|
|
Net cash used in investing activities
|
|
(316.3
|
)
|
(223.0
|
)
|
(617.1
|
)
|
42
|
%
|
(64
|
)%
|
|
Net cash (used in) provided by financing activities
|
|
(780.7
|
)
|
83.4
|
|
507.4
|
|
NM
|
|
(84
|
)%
|
NM—Not meaningful
17
Included
in EBITDA are the following items of (expense) income:
|
|
|
Year ended December 31,
|
|
|
|
|
2005
|
|
2004
|
|
2003
|
|
|
|
|
(in millions)
|
|
|
Loss on early extinguishment of debt
|
|
$
|
(167.3
|
)
|
$
|
(25.6
|
)
|
$
|
—
|
|
|
Legal and contract settlement expense, net
|
|
—
|
|
(6.6
|
)
|
(2.0
|
)
|
|
Loss on accounts receivable securitization program
|
|
(10.7
|
)
|
(15.6
|
)
|
(32.4
|
)
|
|
Asset write down
|
|
—
|
|
—
|
|
(5.8
|
)
|
|
Loss from discontinued operations
|
|
(43.9
|
)
|
(7.8
|
)
|
(2.6
|
)
|
|
Cumulative effect of changes in accounting principle
|
|
(30.8
|
)
|
—
|
|
—
|
|
|
|
|
|
|
|
|
|
|
|
Restructuring, impairment and plant closing (costs)
credits:
|
|
|
|
|
|
|
|
|
Polyurethanes
|
|
(13.4
|
)
|
(36.9
|
)
|
(28.1
|
)
|
|
Advanced
Materials
|
|
(0.5
|
)
|
(9.0
|
)
|
—
|
|
|
Performance
Products
|
|
(10.0
|
)
|
(97.5
|
)
|
(22.1
|
)
|
|
Pigments
|
|
(30.1
|
)
|
(123.3
|
)
|
(6.5
|
)
|
|
Polymers
|
|
(51.6
|
)
|
(13.6
|
)
|
(0.8
|
)
|
|
Base Chemicals
|
|
(16.8
|
)
|
(16.7
|
)
|
2.5
|
|
|
Corporate and
other
|
|
(1.2
|
)
|
(2.3
|
)
|
—
|
|
|
Total restructuring,
impairment and plant closing costs
|
|
(123.6
|
)
|
(299.3
|
)
|
(55.0
|
)
|
|
|
|
|
|
|
|
|
|
|
Total
|
|
$
|
(376.3
|
)
|
$
|
(354.9
|
)
|
$
|
(97.8
|
)
|
(1) Includes
a tax benefit of $3.3 million in 2005 on the cumulative effect of changes in
accounting principle.
(2) EBITDA
is defined as net income (loss) before interest, income taxes, depreciation and
amortization. We believe that EBITDA enhances an investor’s understanding of
our financial performance and our ability to satisfy principal and interest
obligations with respect to our indebtedness. However, EBITDA should not be
considered in isolation or viewed as a substitute for net income, cash flow
from operations or other measures of performance as defined by generally
accepted accounting principles in the U.S. (“GAAP”). Moreover, EBITDA as used
herein is not necessarily comparable to other similarly titled measures of
other companies due to potential inconsistencies in the method of calculation.
Our management uses EBITDA to assess financial performance and debt service
capabilities. In assessing financial performance, our management reviews EBITDA
as a general indicator of economic performance compared to prior periods.
Because EBITDA excludes interest, income taxes, depreciation and amortization,
EBITDA provides an indicator of general economic performance that is not
affected by debt restructurings, fluctuations in interest rates or effective
tax rates, or levels of depreciation and amortization. Accordingly, our
management believes this type of measurement is useful for comparing general
operating performance from period to period and making certain related
management decisions. EBITDA is also used by securities analysts, lenders and
others in their evaluation of different companies because it excludes certain
items that can vary widely across different industries or among companies
within the same industry. For example, interest expense can be highly dependent
on a company’s capital structure, debt levels and credit ratings. Therefore,
the impact of interest expense on earnings can vary significantly among
companies. In addition, the tax positions of companies can vary because of
their differing abilities to take advantage of tax benefits and because of the
tax policies of the various jurisdictions in which they operate. As a result,
effective tax rates and tax expense can vary considerably among companies.
Finally, companies employ productive assets of different ages and utilize
different methods of acquiring and depreciating such assets. This can result in
considerable variability in the relative costs of productive assets and the
depreciation and amortization expense among companies. Our management also
believes that our investors use EBITDA as a measure of our ability to service
indebtedness as well as to fund capital expenditures and working capital
requirements. Nevertheless, our management recognizes that there are material
limitations associated with the use of EBITDA in the evaluation of our Company
as compared to net income, which reflects overall financial performance,
including the effects of interest, income taxes, depreciation and amortization.
EBITDA excludes interest expense. Because we have borrowed money in order to
finance our operations, interest expense is a necessary element of our costs
and ability to generate revenue. Therefore, any measure that excludes interest
expense has material limitations. EBITDA also excludes taxes. Because the
payment of taxes is a necessary element of our operations, any measure that
excludes tax expense has material limitations. Finally, EBITDA excludes
depreciation and amortization expense. Because we use capital assets,
depreciation and amortization expense is a necessary element of our costs and
ability to generate revenue. Therefore, any measure that excludes depreciation
and amortization expense has material limitations. Our management compensates
for the limitations of using EBITDA by using it to supplement GAAP results to
provide a more complete understanding of the factors and trends affecting the
business than GAAP results alone. Our management also uses other metrics to
evaluate capital structure, tax planning and capital investment decisions. For
example, our management uses credit ratings and net debt ratios to
18
evaluate
capital structure, effective tax rate by jurisdiction to evaluate tax planning,
and payback period and internal rate of return to evaluate capital investments.
Our management also uses trade working capital to evaluate its investment in
accounts receivable and inventory, net of accounts payable.
We
believe that net income (loss) is the performance measure calculated and
presented in accordance with GAAP that is most directly comparable to EBITDA
and that cash provided by operating activities is the liquidity measure
calculated and presented in accordance with GAAP that is most directly
comparable to EBITDA. The following table reconciles EBITDA to our net income
(loss) and to our cash provided by operations:
|
|
|
Year Ended December 31,
|
|
Percent Change
|
|
|
|
|
2005
|
|
2004
|
|
2003
|
|
2005 vs 2004
|
|
2004 vs 2003
|
|
|
|
|
(in millions)
|
|
|
|
|
|
|
EBITDA(2)
|
|
$
|
1,059.7
|
|
$
|
881.0
|
|
$
|
598.4
|
|
20
|
%
|
47
|
%
|
|
Depreciation and amortization
|
|
(473.9
|
)
|
(499.0
|
)
|
(394.2
|
)
|
(5
|
)%
|
27
|
%
|
|
Interest expense, net
|
|
(425.6
|
)
|
(592.6
|
)
|
(480.5
|
)
|
(28
|
)%
|
23
|
%
|
|
Income tax (expense) benefit (1)
|
|
(39.5
|
)
|
22.9
|
|
(41.0
|
)
|
NM
|
|
NM
|
|
|
Net income (loss)
|
|
120.7
|
|
(187.7
|
)
|
(317.3
|
)
|
NM
|
|
(41
|
)%
|
|
Cumulative
effect of changes in accounting principle, net of tax
|
|
27.5
|
|
—
|
|
—
|
|
NM
|
|
NM
|
|
|
Equity in income of unconsolidated affiliates
|
|
(8.2
|
)
|
(4.0
|
)
|
(1.7
|
)
|
105
|
%
|
135
|
%
|
|
Depreciation and amortization
|
|
473.9
|
|
499.0
|
|
394.2
|
|
(5
|
)%
|
27
|
%
|
|
Loss on early extinguishment of debt
|
|
167.3
|
|
25.6
|
|
—
|
|
554
|
%
|
NM
|
|
|
Noncash interest (including interest on affiliate
debt)
|
|
47.2
|
|
145.5
|
|
132.1
|
|
(68
|
)%
|
10
|
%
|
|
Noncash
restructuring, impairment and plant closing costs
|
|
64.1
|
|
138.0
|
|
12.2
|
|
(54
|
)%
|
NM
|
|
|
Deferred income taxes
|
|
16.2
|
|
(58.3
|
)
|
9.3
|
|
NM
|
|
NM
|
|
|
Net unrealized
losses (gains) on foreign currency transactions
|
|
23.1
|
|
(111.7
|
)
|
(78.4
|
)
|
NM
|
|
42
|
%
|
|
Loss on disposal of discontinued operations
|
|
36.4
|
|
—
|
|
—
|
|
NM
|
|
NM
|
|
|
Other, net
|
|
15.4
|
|
9.0
|
|
3.5
|
|
71
|
%
|
157
|
%
|
|
Changes in operating assets and liabilites
|
|
4.7
|
|
(273.8
|
)
|
62.0
|
|
NM
|
|
NM
|
|
|
Net cash provided by operating activities
|
|
$
|
988.3
|
|
$
|
181.6
|
|
$
|
215.9
|
|
444
|
%
|
(16
|
)%
|
NM—Not meaningful
Year
Ended December 31, 2005 Compared with the Year Ended December 31,
2004
For
the year ended December 31, 2005, we had net income of $120.7 million
on revenues of $12,961.6 million compared to a net loss of
$187.7 million on revenues of $11,426.4 million for 2004. The
improvement of $308.4 million in net income was the result of the following
items:
• Revenues for the year ended December 31,
2005 increased by $1,535.2 million, or 13%, as compared with 2004 due
principally to higher average selling prices in all of our operating segments,
primarily in response to higher raw materials and energy costs. For further
information regarding changes in selling prices and sales volumes from the
prior period, see the discussion by operating segment below.
• Gross profit for the year ended December 31,
2005 increased by $369.9 million, or 26%, as compared with 2004. This
increase in gross profit, which occurred in our Polyurethanes, Pigments and
Polymers segments, was mainly due to higher margins as average selling prices
increased more than raw material and energy costs in 2005 as compared with
2004. The decrease in gross profit in
our Advanced Materials, Performance Products and Base Chemicals segments
resulted primarily from the impact of the U.S. Gulf Coast storms which resulted
in loss of sales, repair costs and higher raw material costs.
• Operating expenses for the year ended
December 31, 2005 increased by $147.8 million, or 22%, as compared with
2004, primarily due to higher foreign currency losses.
• Restructuring, impairment and plant
closing costs for the year ended December 31, 2005 decreased to
$123.6 million from $299.3 million in 2004. For further discussion of
restructuring activities, see “Note 10. Restructuring, Impairment and
Plant Closing Costs” to our Consolidated Financial Statements included
elsewhere in this report.
• Net interest expense for the year
ended December 31, 2005 decreased by $167.0 million, or 28%, as compared
with 2004, primarily due to lower average debt balances resulting from the
repayment of debt from the proceeds of Huntsman Corporation’s initial public
offering on February 16, 2005 and operating cash flows, and from lower
average interest rates despite higher underlying interest rates on variable
rate borrowings.
19
• Other expense for the year ended December 31,
2005 increased by $141.7 million to $167.5 million from $25.8 million for 2004.
The increase was due primarily to a $141.7 million increase in loss on early
extinguishment of debt.
• Income tax expense increased by $65.7
million to $42.8 million for the year ended December 31, 2005 as compared
with a benefit of $22.9 million for 2004.
Increased tax expense was largely due to increased pre-tax income. Our tax obligations are affected by the mix
of income and losses in the tax jurisdictions in which we operate. The change in income tax expense includes
changes in our mix of income and losses, as well as non-recurring items of
expense and benefit recognized each year.
• The loss from discontinued operations
represents the operating results of our TDI business that was sold on July 6,
2005. The loss from discontinued operations of $43.9 million for the year ended
December 31, 2005 includes a loss on disposal of $36.4 million recorded in
the second quarter of 2005.
• During the fourth quarter of 2005, we
adopted Financial Accounting Standards Board Interpretation No. 47, “Accounting for Conditional Asset Retirement Obligations,”
and recorded a charge for the cumulative effect of accounting change, net of
tax, of $31.7 million. Also in the fourth quarter of 2005, we accelerated the
date for actuarial measurement of our pension and postretirement benefit
obligations from December 31 to November 30 in order to improve
internal control procedures by allowing more time to review the completeness
and accuracy of the actuarial benefit obligation measurements and recorded a
credit for the cumulative effect of accounting change, net of tax, of $4.2
million.
The
following table sets forth the revenues and EBITDA for each of our operating
segments (dollars in millions):
|
|
|
Year ended December 31,
|
|
Percent
|
|
|
|
|
2005
|
|
2004
|
|
Change
|
|
|
Revenues
|
|
|
|
|
|
|
|
|
Polyurethanes
|
|
$
|
3,396.3
|
|
$
|
2,818.0
|
|
21
|
%
|
|
Advanced Materials
|
|
1,185.3
|
|
1,162.4
|
|
2
|
%
|
|
Performance Products
|
|
1,960.9
|
|
1,927.8
|
|
2
|
%
|
|
Pigments
|
|
1,052.8
|
|
1,048.1
|
|
—
|
|
|
Polymers
|
|
1,702.0
|
|
1,451.8
|
|
17
|
%
|
|
Base Chemicals
|
|
4,462.1
|
|
3,859.0
|
|
16
|
%
|
|
Eliminations
|
|
(797.8
|
)
|
(840.7
|
)
|
(5
|
)%
|
|
Total
|
|
$
|
12,961.6
|
|
$
|
11,426.4
|
|
13
|
%
|
|
|
|
|
|
|
|
|
|
|
Segment EBITDA
|
|
|
|
|
|
|
|
|
Polyurethanes
|
|
$
|
676.3
|
|
$
|
364.0
|
|
86
|
%
|
|
Advanced Materials
|
|
154.1
|
|
151.0
|
|
2
|
%
|
|
Performance Products
|
|
157.3
|
|
91.0
|
|
73
|
%
|
|
Pigments
|
|
115.3
|
|
(30.0
|
)
|
NM
|
|
|
Polymers
|
|
102.7
|
|
77.6
|
|
32
|
%
|
|
Base Chemicals
|
|
264.3
|
|
276.2
|
|
(4
|
)%
|
|
Corporate and other
|
|
(410.3
|
)
|
(48.8
|
)
|
741
|
%
|
|
Total
|
|
$
|
1,059.7
|
|
$
|
881.0
|
|
20
|
%
|
|
|
|
|
|
|
|
|
|
|
|
|
|
|
NM—Not meaningful
20
Polyurethanes
For
the year ended December 31, 2005, Polyurethanes segment revenues increased
by $578.3 million, or 21%, as compared with 2004, primarily as a result of
increased MDI and MTBE revenues. MDI revenues increased by 25% due to 29%
higher average selling prices. The increase in MDI selling prices was driven by
improved market conditions, stronger growth in higher value applications, and
in response to higher raw material and energy costs. MDI sales volumes were 3%
lower principally due to product availability limitations and the effects of
unplanned outages related to the U.S. Gulf Coast storms. MTBE revenues
increased by 28% as a result of 38% higher average selling prices. The increase
in MTBE average selling prices was principally due to strong demand and tight
supplies in the market. MTBE sales volumes decreased by 8% primarily due to
loss of production related to unplanned outages for maintenance and the U.S.
Gulf Coast storms.
For
the year ended December 31, 2005, Polyurethanes segment EBITDA increased
by $312.3 million, or 86%, as compared with 2004. Segment EBITDA increased
primarily as a result of higher contribution margins, with average selling
prices more than offsetting increases in raw material and energy costs. Margin
improvements were partially offset by higher losses from discontinued operations
and the negative impact of the U.S. Gulf Coast storms. During the years ended December 31,
2005 and 2004, our Polyurethanes segment recorded a loss from discontinued
operations of its TDI business of $43.9 million and $7.8 million, respectively.
In addition, our Polyurethanes segment recorded restructuring, impairment and
plant closing costs of $13.4 million in the year ended December 31,
2005 as compared with $36.9 million in 2004. For further discussion of
restructuring activities, see “Note 10. Restructuring, Impairment and
Plant Closing Costs” to our Consolidated Financial Statements included
elsewhere in this report.
Advanced Materials
Advanced
Materials revenues for the year ended December 31, 2005 increased by
$22.9 million, or 2%, as compared with 2004, primarily attributable to an
8% increase in average selling prices, with sales volumes down 6%. Average
selling prices were higher due to price increase initiatives in certain markets
in response to higher raw material costs and due to a higher value product mix.
Our ongoing portfolio re-alignment activities resulted in higher sales volumes
in some of our markets, which were more than offset by lower sales volumes of
basic epoxy resins in the coatings, construction and adhesives markets and
reduced volumes of electronic laminates products.
Advanced
Materials segment EBITDA for the year ended December 31, 2005 increased by
$3.1 million, or 2%, as compared with 2004. Segment EBITDA improved on higher
revenues and an improved product mix, resulting from increased sales volumes of
higher margin adhesives and power and composite engineering applications. These
improvements more than offset higher raw material costs caused principally by
decreased supplies of materials and higher energy prices related to the U.S.
Gulf Coast storms and a reduction of $8.7 million in legal and contract
settlement gains. In addition, our Advanced Materials segment recorded
restructuring, impairment and plant closing costs of $0.5 million and
$9.0 million during the years ended December 31, 2005 and 2004,
respectively. For further discussion of restructuring activities, see “Note 10.
Restructuring, Impairment and Plant Closing Costs” to our Consolidated
Financial Statements included elsewhere in this report.
Performance Products
For
the year ended December 31, 2005, Performance Products revenues increased
by $33.1 million, or 2%, as compared with 2004, primarily as a result of
higher average selling prices for all major product lines, offset by lower
sales volumes in certain product lines. Overall, average selling prices
increased by 19% in response to higher raw material and energy costs and
improved market conditions for certain products. Sales volumes declined by 15%
principally due to the loss of production volume in the U.S. related to the
Gulf Coast storms and the unplanned outage at our PO facility, together with
lower sales of glycols and certain surfactants.
For
the year ended December 31, 2005, Performance Products segment EBITDA
increased by $66.3 million, or 73%, as compared with 2004, resulting
primarily from lower restructuring, impairment and plant closing costs and
higher margins, partially offset by lower sales volumes and the negative impact
of the U.S. Gulf Coast storms. During the years ended December 31, 2005
and 2004, the Performance Products segment recorded restructuring and plant
closing charges of $10.0 million and $97.5 million, respectively. For
further discussion of restructuring activities, see “Note 10.
Restructuring, Impairment and Plant Closing Costs” to our Consolidated
Financial Statements included elsewhere in this report.
21
Pigments
For
the year ended December 31, 2005, Pigments revenues remained relatively
unchanged at $1,052.8 million, as compared with revenues of
$1,048.1 million in 2004, resulting principally from a 6% increase in
average selling prices, offset in part by a 5% reduction in sales volumes.
Sales volumes were lower due to the restructuring of our Grimsby, U.K. and Umbogintwini,
South Africa facilities during 2004 and due to lower end-use demand across all
regions. Average selling prices increased in all regions and benefited from
price increase initiatives implemented during late 2004 and 2005.
Pigments segment EBITDA for the
year ended December 31, 2005 increased by $145.3 million to
$115.3 million from negative $30.0 million for 2004. During the years
ended December 31, 2005 and 2004, our Pigments segment recorded
restructuring, impairment and plant closing charges of $30.1 million and
$123.3 million, respectively. For further discussion of restructuring
activities, see “Note 10. Restructuring, Impairment and Plant Closing Costs” to
our Consolidated Financial Statements included elsewhere in this report. This
increase in segment EBITDA during 2005 was due primarily to the combination of
lower restructuring, impairment and plant closing costs, $15.1 million of lower
legal settlement costs related to Discoloration Claims and higher margins
during 2005.
Polymers
For
the year ended December 31, 2005, Polymers revenues increased by
$250.2 million, or 17%, as compared with 2004, due mainly to 22% higher
average selling prices, offset somewhat by lower sales volumes. Average selling
prices were higher primarily due to tighter market conditions and in response
to an increase in raw material and energy costs. Sales volumes decreased by 4%
as a result of soft demand in our Australian styrenics business and raw
materials supply shortages in our polypropylene business.
For
the year ended December 31, 2005, Polymers segment EBITDA increased by
$25.1 million, or 32%, as compared to 2004. This increase in segment
EBITDA resulted from higher contribution margins, as average selling prices
increased more than raw material and energy costs, and was partially offset by
higher restructuring, impairment and plant closing costs. During the year ended
December 31, 2005 and 2004, our Polymers segment recorded restructuring,
impairment and plant closing charges of $51.6 million and
$13.6 million, respectively. For further discussion of restructuring
activities, see “Note 10. Restructuring, Impairment and Plant Closing
Costs” to our Consolidated Financial Statements included elsewhere in this
report.
Base Chemicals
For
the year ended December 31, 2005, Base Chemicals revenues increased by
$603.1 million, or 16%, as compared with 2004. This increase was due mainly to
a 22% increase in average selling prices, partially offset by a 5% decrease in
sales volumes. Higher average selling prices were primarily due to improved
market conditions and in response to higher raw material and energy costs. The
sales volume decrease was driven principally by a loss of production volume in
the U.S. related to the Gulf Coast storms.
For the year ended December 31, 2005, Base
Chemicals segment EBITDA decreased by $11.9 million, or 4%, as compared
with 2004. This decrease in segment EBITDA was primarily due to slightly lower
contribution margins as higher average selling prices were more than offset by
higher raw materials and energy costs. The increase in raw materials and energy
costs during 2005 were caused principally by decreased supplies of materials
and energy sources related to the U.S. Gulf Coast storms. EBITDA was also lower
resulting from lost production in the U.S. related to the Gulf Coast storms.
During the year ended December 31, 2005 and 2004, our Base Chemicals
segment recorded restructuring charges of $16.8 million and
$16.7 million, respectively. For further discussion of restructuring
activities, see “Note 10. Restructuring, Impairment and Plant Closing
Costs” to our Consolidated Financial Statements included elsewhere in this
report.
Corporate and Other
Corporate
and other items includes unallocated corporate overhead, foreign exchange gains
and losses, loss on the sale of accounts receivable, loss on the early
extinguishment of debt, other non-operating income and expense and minority
interest in subsidiaries’ (income) loss. For the year ended December 31,
2005, EBITDA from corporate and other items decreased by $361.5 million to
a loss of $410.3 million from a loss of $48.8 million for 2004. The
decrease in 2005 period EBITDA resulted primarily from a $141.7 million
increase in losses on early extinguishment of debt, a $148.7 million
increase in unallocated foreign currency losses, $28.3 million higher
incentive compensation and a charge of $30.8 million for the cumulative
effect of changes in accounting principle.
Year
Ended December 31, 2004 Compared with the Year Ended December 31,
2003
Our business
has undergone significant changes as a result of a number of transactions.
Effective May 1, 2003, as a result of transactions among Huntsman LLC, HIH
and ICI, the financial results of Huntsman LLC and HIH were consolidated
22
(the “HLLC Consolidation Transaction”). Effective June 30, 2003,
as a result of our affiliate’s acquisition of the Advanced Materials business
through the acquisition of Vantico S.A. (the “AdMat Transaction”), we have
consolidated the financial results of AdMat. Because of these transactions, the
financial information for the year ended December 31, 2004 is not
comparable to the financial data for the year ended December 31, 2003.
For
the year ended December 31, 2004, we had a net loss of $187.7 million
on revenues of $11,426.4 million compared to a net loss of
$317.3 million on revenues of $7,646.3 million for 2003. The decrease
of $129.6 million in net loss was the result of the following items:
• Revenues for the year ended December 31, 2004
increased by $3,780.1 million, or 49%, to $11,426.4 million from
$7,646.3 million during 2003. Approximately 23% of this increase was due
to our consolidation with Huntsman LLC following the HLLC Consolidation
Transaction effective May 1, 2003 and our affiliate’s ownership of AdMat
effective June 30, 2003 following the AdMat Transaction, in each case for
the entire period in 2004. The remaining approximately 26% of the increase was
due to higher average selling prices in all our operating segments and higher
sales volumes in our Polyurethanes, Advanced Materials, Pigments, Polymers and
Base Chemicals segments. For details of the changes in selling prices and sales
volumes from the prior year, please see our discussion by operating segment below.
• Gross profit for the year ended December 31, 2004
increased by $591.2 million, or 73%, to $1,401.3 million from
$810.1 million in 2003. Approximately 29% of this increase was due to our
consolidation of Huntsman LLC following the HLLC Consolidation Transaction
effective May 1, 2003 and our affiliate’s ownership of AdMat effective June 30,
2003 following the AdMat Transaction, in each case for the entire period in
2004. The remaining approximately 44% of the increase was due to higher
contribution margins as average selling prices increased more than raw material
and energy costs in 2004 as compared with 2003.
• Operating expenses for the year ended December 31,
2004 increased by $149.2 million, or 29%, to $667.6 million from
$518.4 million in 2003. The majority of this increase was due to our
consolidation with Huntsman LLC following the HLLC Consolidation Transaction
effective May 1, 2003 and our affiliate’s ownership of AdMat effective June 30,
2003 following the AdMat Transaction, in each case for the entire period in
2004. Excluding the effect of the HLLC Consolidation Transaction and the AdMat
Transaction, operating expenses decreased approximately 5%.
• Restructuring, impairment and plant closing costs for the
year ended December 31, 2004 increased by $244.3 million to
$299.3 million from $55.0 million in 2003. This increase was in part
due to our consolidation with HLLC for the entire period in 2004 following the
HLLC Consolidation Transaction effective May 1, 2003. For further
discussion of restructuring activities, see “Note 10. Restructuring,
Impairment and Plant Closing Costs” to our Consolidated Financial Statements
included elsewhere in this report.
• Net interest expense for the year ended December 31,
2004 increased by $112.1 million, or 23%, to $592.6 million from
$480.5 million for 2003. Approximately 17% of this increase was due to our
consolidation with Huntsman LLC following the HLLC Consolidation Transaction
effective May 1, 2003 and our affiliate’s ownership of AdMat effective June 30,
2003 following the AdMat Transaction, in each case for the entire period in
2004. In addition, the increase was due to additional debt and higher interest
rates on our borrowings in 2004 as compared to 2003 and the compounding of
interest on the HMP Senior Discount Notes and the HLLC Senior Discount Notes,
the accrued interest of which was added to the principal balance and not paid
in cash.
• Loss on our accounts receivable securitization program
decreased $16.8 million, or 52%, to a loss of $15.6 million for the
year ended December 31, 2004 as compared to a loss of $32.4 million
for 2003. This decrease was mainly attributable to reduced losses on foreign
currency hedging contracts in 2004 as compared with 2003, primarily as a result
of an amendment to our accounts receivable securitization program permitting
Euro-denominated debt, thereby reducing the need for foreign currency hedge
contracts. Losses on the accounts receivable securitization program include the
discount on receivables sold into the program, fees and expenses associated
with the program and gains (losses) on foreign currency hedge contracts
mandated by the terms of the program to hedge currency exposures on the
collateral supporting the off-balance sheet debt issued.
• Other expense of $25.8 million in 2004 relates to the loss
on early extinguishment of debt.
• Income tax benefit was $22.9 million
for the year ended December 31, 2004 as compared to income tax expense of
$41.0 million for the year ended December 31, 2003. Our tax obligations
are affected by the mix of income and losses in the tax jurisdictions in which
we operate. Increased tax benefit was
largely due to changes in pre-tax income in certain tax jurisdictions. During 2004, additional pre-tax losses were
recorded in jurisdictions where tax benefits were provided and additional
pre-tax income was recorded in jurisdictions where tax expense was not
provided, net of valuation allowance. In
addition, during the year ended December 31, 2004 we recognized
non-recurring benefits in Spain, France, and Holland of approximately $28.3
million associated with enacted changes in tax rates, the settlement of tax
authority examinations and the reversal of previously established valuation
allowances.
23
The
following table sets forth the revenues and EBITDA for each of our operating
segments (dollars in millions):
|
|
|
Year Ended December 31,
|
|
Percent
|
|
|
|
|
2004
|
|
2003
|
|
Change
|
|
|
|
|
|
|
|
|
|
|
|
Revenues
|
|
|
|
|
|
|
|
|
Polyurethanes
|
|
$
|
2,818.0
|
|
$
|
2,235.2
|
|
26
|
%
|
|
Advanced Materials
|
|
1,162.4
|
|
517.8
|
|
124
|
%
|
|
Performance Products
|
|
1,927.8
|
|
1,348.3
|
|
43
|
%
|
|
Pigments
|
|
1,048.1
|
|
1,010.0
|
|
4
|
%
|
|
Polymers
|
|
1,451.8
|
|
774.4
|
|
87
|
%
|
|
Base Chemicals
|
|
3,859.0
|
|
2,207.3
|
|
75
|
%
|
|
Eliminations
|
|
(840.7
|
)
|
(446.7
|
)
|
88
|
%
|
|
Total
|
|
$
|
11,426.4
|
|
$
|
7,646.3
|
|
49
|
%
|
|
|
|
|
|
|
|
|
|
|
Segment EBITDA
|
|
|
|
|
|
|
|
|
Polyurethanes
|
|
$
|
364.0
|
|
$
|
233.4
|
|
56
|
%
|
|
Advanced Materials
|
|
151.0
|
|
29.4
|
|
414
|
%
|
|
Performance Products
|
|
91.0
|
|
80.9
|
|
12
|
%
|
|
Pigments
|
|
(30.0
|
)
|
105.4
|
|
NM
|
|
|
Polymers
|
|
77.6
|
|
57.8
|
|
34
|
%
|
|
Base Chemicals
|
|
276.2
|
|
79.4
|
|
248
|
%
|
|
Corporate and other
|
|
(48.8
|
)
|
12.1
|
|
NM
|
|
|
Total
|
|
$
|
881.0
|
|
$
|
598.4
|
|
47
|
%
|
NM—Not Meaningful
Polyurethanes
For
the year ended December 31, 2004, Polyurethanes revenues increased by
$582.8 million, or 26%, as compared to 2003, primarily from higher average
selling prices and higher sales volumes for MDI. MDI revenues increased by 31%,
resulting from 17% higher average selling prices and 12% higher sales volumes.
The increase in MDI average selling prices resulted principally from improved
market demand coupled with tighter supply, the strength of the major European
currencies versus the U.S. dollar and in response to higher raw material and
energy costs. Higher MDI volumes reflect further extension of markets for MDI
and recent improvements in global economic conditions.
For
the year ended December 31, 2004, Polyurethanes segment EBITDA increased
by $130.6 million, or 56%, as compared to 2003. Restructuring, impairment and plant closing
costs of $36.9 million and $28.1 million for the years ended December 31,
2004 and 2003, respectively, were included in segment EBITDA. For further
discussion of restructuring activities, see “Note 10. Restructuring, Impairment
and Plant Closing Costs” to our Consolidated Financial Statements included
elsewhere in this report. Excluding restructuring charges, segment EBITDA
increased by $139.4 million in 2004, resulting mainly from higher contribution
margins as average selling pries increased more than raw material and energy
costs.
Advanced Materials
Advanced
Materials revenues for the year ended December 31, 2004 increased by
$644.6 million, or 124%, from 2003. Approximately 83% of the increase was
attributable to our affiliate’s ownership of AdMat for the entire period in
2004 following the AdMat Transaction that was effective June 30, 2003. Approximately
17% of the increase in revenues for 2004 as compared to 2003 was due to an
increase in average selling prices and sales volumes. Average selling prices
were higher due to improved demand in certain markets in response to higher raw
material costs and, in part, to the strength of the major European currencies
versus the U.S. dollar.
For
the year ended December 31, 2004, Advanced Materials segment EBITDA
increased by $121.6 million to $151.0 million from $29.4 million
for the same period of 2003. Approximately 7% of the increase was attributable
to our affiliate’s ownership of AdMat for the entire period in 2004 following
the AdMat Transaction that was effective June 30, 2003. Approximately 93%
of the increase in segment EBITDA was primarily due to higher contribution
margins as average selling prices increased more than raw material costs.
During the year ended December 31, 2004, our Advanced Materials segment
recorded restructuring charges of $9.0 million. For further discussion of
restructuring activities, see “Note 10. Restructuring, Impairment and Plant
Closing Costs” to our Consolidated Financial Statements included elsewhere in
this report.
24
Performance Products
For
the year ended December 31, 2004, Performance Products revenues increased
by $579.5 million, or 43%, from 2003. Approximately 29% of this increase
was due to our consolidation with Huntsman LLC for the entire period in 2004 as
a result of the HLLC Consolidation Transaction effective May 1, 2003. The
remaining increase in revenues resulted primarily from higher average selling
prices for all products, offset somewhat by lower sales volumes in certain
product lines. Overall, average selling prices increased by approximately 17%
in response to higher raw material and energy costs, improved market conditions
and the strength of the major European currencies versus the U.S. dollar. Sales
volumes declined by 2% primarily due to lower sales volumes of amines and
surfactants. The reduction in surfactants sales volumes was due principally to
increased competition in the marketplace.
For
the year ended December 31, 2004, Performance Products segment EBITDA
increased by $10.1 million, or 12%, to $91.0 million from
$80.9 million for 2003. The increase in EBITDA resulted primarily from the
consolidation with HLLC for the entire period in 2004 as a result of the HLLC
Consolidation Transaction, despite higher restructuring charges. During the
years ended December 31, 2004 and 2003, the Performance Products segment
recorded restructuring charges of $97.5 million and $22.1 million,
respectively. For further discussion of restructuring activities, see “Note 10.
Restructuring, Impairment and Plant Closing Costs” to our Consolidated
Financial Statements included elsewhere in this report.
Pigments
For
the year ended December 31, 2004, Pigments revenues increased by
$38.1 million, or 4%, as compared to 2003, resulting principally from 4% higher
average selling prices. Average selling prices benefited primarily from the
strengthening of the major European currencies versus the U.S. dollar.
Pigments
segment EBITDA for the year ended December 31, 2004 decreased by
$135.4 million to a loss of $30.0 million from income of
$105.4 million in 2003. The
decrease is mainly the result of an increase in restructuring, impairment and
plant closing costs of $116.8 million and charges of $15.1 million
relating to the payment of costs and settlement amounts relating to
Discoloration Claims recorded in 2004. The remaining decrease in segment EBITDA
of $3.5 million resulted principally from a $14.5 million reduction in
EBITDA primarily in response to the strengthening of the major European
currencies versus the U.S. dollar, offset somewhat by lower fixed costs
resulting from cost reduction initiatives. During 2004 and 2003, our Pigments
segment recorded restructuring, impairment and plant closing costs of
$123.3 million and $6.5 million, respectively. For further discussion
of restructuring activities, see “Note 10. Restructuring, Impairment and Plant
Closing Costs” to our Consolidated Financial Statements included elsewhere in
this report.
Polymers
For
the year ended December 31, 2004, Polymers revenues increased by
$677.4 million, or 87%, to $1,451.8 million from $774.4 million
for 2003 due mainly to the consolidation with HLLC for the entire 2004 period
as a result of the HLLC Consolidation Transaction and to approximately 22%
higher average selling prices and approximately 3% higher sales volumes. Higher
average selling prices were primarily in response to higher raw material and
energy costs while sales volumes increased principally as a result of stronger
customer demand.
For
the year ended December 31, 2004, Polymers segment EBITDA increased by
$19.8 million to $77.6 million from $57.8 million for 2003. The
increase in segment EBITDA was primarily due to the consolidation with HLLC for
the entire 2004 period as a result of the HLLC Consolidation Transaction
despite a $13.6 million restructuring charge related to the closure of an
Australian manufacturing unit in 2004. Higher contribution margins resulted as
average selling prices increased more than raw material costs. In addition, our
Polymers segment recorded restructuring, impairment and plant closing costs of
$13.6 million and $0.8 million for the years ended December 31, 2004 and
2003, respectively. For further discussion of restructuring activities, see “Note
10. Restructuring, Impairment and Plant Closing Costs” to our Consolidated
Financial Statements included elsewhere in this report.
Base Chemicals
For
the year ended December 31, 2004, Base Chemicals revenues increased
$1,651.7 million, or 75%, from 2003. Approximately 24% of this increase
was due to our consolidation with Huntsman LLC for the entire period in 2004 as
a result of the HLLC Consolidation Transaction effective May 1, 2003. The
remaining increase in revenue is due to approximately 40% higher average
selling prices and approximately 6% higher sales volumes. Higher average
selling prices were primarily in response to higher raw material and energy
costs. Sales volumes increases were principally the result of increased demand.
25
For the year
ended December 31, 2004, Base Chemicals segment EBITDA increased by
$196.8 million, or 248%, to $276.2 million from $79.4 million
for 2003. Only 42% of this increase was due to our consolidation with Huntsman
LLC for the entire period in 2004 as a result of the HLLC Consolidation
Transaction effective May 1, 2003. Excluding the impact of the HLLC
Consolidation Transaction, segment EBITDA increased primarily as a result of
higher contribution margins as average selling prices increased more than raw
material and energy costs. In addition, our Base Chemicals segment recorded
restructuring, impairment and plant closing costs of $16.7 million for the
year ended December 31, 2004 compared with a restructuring credit of $2.5
million in 2003. For further discussion of restructuring activities, see “Note
10. Restructuring, Impairment and Plant Closing Costs” to our Consolidated
Financial Statements included elsewhere in this report.
Corporate and Other
Corporate and other items includes
unallocated corporate overhead, unallocated foreign exchange gains and losses,
loss on the sale of accounts receivable, loss on the early extinguishment of
debt, other non-operating income and expense and minority interest in
subsidiaries’ (income) loss. For the year ended December 31, 2004, EBITDA
from corporate and other items decreased by $60.9 million to a loss of
$48.8 million from income of $12.1 million for 2003, primarily due to
higher expenses associated with the early extinguishment of debt and our
consolidation of HLLC for the entire period in 2004 as a result of the HLLC
Consolidation Transaction effective May 1, 2003.
ITEM 7A. QUANTITATIVE AND QUALITATIVE
DISCLOSURES ABOUT MARKET RISK
We are exposed to market risk, including changes in currency exchange
rates, interest rates and certain commodity prices. To manage the volatility
relating to these exposures, from time to time, we enter into various
derivative transactions. We hold and issue derivative financial instruments for
economic hedging purposes only.
Currency Exchange Rates
Our cash flows and earnings are subject to fluctuations due to exchange
rate variation. Our sales prices are typically denominated in euros or U.S.
dollars. From time to time, we may enter into foreign currency derivative
instruments to minimize the short-term impact of movements in foreign currency
rates. Where practicable, we generally net multicurrency cash balances among
our subsidiaries to help reduce exposure to foreign currency exchange rates.
Certain other exposures may be managed from time to time through financial
market transactions, principally through the purchase of spot or forward
foreign exchange contracts (generally with maturities of nine months or less).
We do not hedge our currency exposures in a manner that would eliminate the
effect of changes in exchange rates on our cash flows and earnings. Our accounts
receivable securitization program in certain circumstances requires that we
enter into forward foreign currency hedges intended to hedge currency
exposures. As of December 31, 2005, our outstanding forward foreign exchange
contracts were insignificant.
A significant portion of our debt is denominated in euros. We also
finance certain of our non-U.S. subsidiaries with intercompany loans that are,
in some cases, denominated in currencies other than the entities’ functional
currency. We manage the net foreign currency exposure created by this debt
through various means, including cross-currency swaps, the designation of
certain intercompany loans that are not expected to be repaid in the
foreseeable future as permanent loans (“Permanent Loans”) and the designation
of debt and swaps as hedges.
Foreign currency transaction gains and losses on intercompany loans
that are not designated as Permanent Loans are recorded in earnings. Foreign
currency transaction gains and losses on Permanent Loans are recorded in other
comprehensive income. From time to time, we review such designation of
intercompany loans, and, during the year ended December 31, 2005, we have
increased the net amount of our Permanent Loans. This has resulted in less
volatility reported in foreign currency gains and losses reflected in earnings.
We have outstanding cross-currency interest rate swaps of fixed rate
debt. We entered into these swaps with various financial institutions in order
to more effectively hedge our overall underlying euro long-term net asset and
euro cash flow exposures. In one of the swap transactions, we agreed to swap
$175 million of 7.375% fixed rate debt for €132.4 million of 6.63%
fixed rate debt. As a result, we will pay fixed rate interest at an annual rate
of 6.63% on €132.4 million of principal and will receive fixed rate
interest at an annual rate of 7.375% on $175 million of principal through
January 1, 2010. At maturity on January 1, 2010, we are required to
pay principal of €132.4 million and will receive principal of
$175 million. Interest installments are paid semiannually on January 1
and July 1 of each year beginning July 1, 2005 through maturity. The
swap is classified as a net investment hedge under U.S. GAAP.
In another swap transaction, we agreed to swap $31.3 million of
11.0% fixed rate debt for €25.0 million of 9.4% fixed rate debt. As a
result, we will pay fixed rate interest at an annual rate of 9.4% on
€25.0 million of principal and will receive fixed rate interest of 11.0%
on $31.3 million of principal through July 15, 2007. At maturity,
July 15, 2007, we are required to pay principal of €25.0 million and
will receive principal of $31.3 million. Interest installments are paid
26
semiannually on January 15 and
July 15 of each year, beginning July 15, 2005 through maturity. The swap
is not designated as a hedge for reporting purposes under U.S. GAAP.
From time to time, we review our non-U.S. dollar denominated debt and
swaps to determine the appropriate amounts designated as hedges. As of December
31, 2005, excluding the cross-currency interest rate swaps discussed above, we
have designated approximately €330 million of our euro-denominated debt as
a hedge of our net investments.
Interest Rates
Through our borrowing activities, we are
exposed to interest rate risk. Such risk arises due to the structure of the our
debt portfolio, including the duration of the portfolio and the mix of fixed
and floating interest rates. Actions taken to reduce interest rate risk include
managing the mix and rate characteristics of various interest bearing
liabilities as well as entering into interest rate swaps, collars and options.
We may purchase both interest rate swaps and
interest rate collars to reduce the impact of changes in interest rates on our
floating-rate long-term debt. Under interest rate swaps, we agree with other
parties to exchange, at specified intervals, the difference between fixed-rate
and floating-rate interest amounts calculated by reference to an agreed
notional principal amount. When we enter into collars, the collars entitle us
to receive from the counterparties (major banks) the amounts, if any, by which
our interest payments on certain of our floating-rate borrowings exceed a
certain rate, and require us to pay to the counterparties (major banks) the
amount, if any, by which our interest payments on certain of our floating-rate
borrowings are less than a certain rate.
Interest rate contracts were recorded as a
component of other non-current liabilities as of December 31, 2005 and
2004. The effective portion of the changes in the fair value of the swaps are
recorded in accumulated other comprehensive loss, with any ineffectiveness
recorded in interest expense.
As of December 31, 2005 and 2004, we had
entered into various types of interest rate contracts to manage our interest
risk on our long-term debt as indicated below (dollars in millions):
|
|
|
2005
|
|
2004
|
|
|
Notional
amount
|
|
$
|
83.3
|
|
$
|
184.3
|
|
|
Fair value
|
|
|
|
|
|
|
Cash flow hedges
|
|
—
|
|
(2.0
|
)
|
|
Non-designated derivatives
|
|
0.4
|
|
(1.2
|
)
|
|
Maturity
|
|
2006-2010
|
|
2005-2007
|
|
|
|
|
|
|
|
|
|
We are exposed to credit losses in the event of nonperformance by a
counterparty to the derivative financial instruments. We anticipate, however,
that the counterparties will be able to fully satisfy obligations under the
contracts. Market risk arises from changes in interest rates.
Commodity Prices
Our exposure to changing commodity prices is
somewhat limited since the majority of our raw materials are acquired at posted
or market related prices, and sales prices for finished products are generally
at market related prices which are largely set on a monthly or quarterly basis
in line with industry practice. In order to reduce overall raw material cost
volatility, from time to time we enter into various commodity contracts to
hedge our purchase of commodity products. We do not hedge our commodity
exposure in a manner that would eliminate the effects of changes in commodity
prices on our cash flows and earnings. At December 31, 2005, we had in place
forward purchase and sales contracts for 15,000 tonnes and 35,000 tonnes,
respectively, of naphtha and other hydrocarbons, which do not qualify for hedge
accounting.
ITEM 8. FINANCIAL STATEMENTS AND
SUPPLEMENTARY DATA
Our Consolidated Financial Statements
required by this item are included on the pages immediately following the Index
to Consolidated Financial Statements appearing on page F-1.
ITEM 9. CHANGES IN AND DISAGREEMENTS WITH
ACCOUNTANTS ON ACCOUNTING AND FINANCIAL DISCLOSURE
There have been no changes in our independent
accountants, Deloitte & Touche LLP, or disagreements with them on
matters of accounting or financial disclosure.
27
ITEM 9A. CONTROLS AND PROCEDURES
Our management, with the participation of our chief executive officer
and chief financial officer, has evaluated the effectiveness of our disclosure controls
and procedures (as defined in Rules 13a-15(e) and 15d-15(e) under the
Securities Exchange Act of 1934 (the “Exchange Act”)) as of December 31, 2005.
Based on this evaluation, our chief executive officer and chief financial
officer have concluded that, as of December 31, 2005, our disclosure controls
and procedures were effective, in that they ensure that information required to
be disclosed by us in the reports that we file or submit under the Exchange Act
is (1) recorded, processed, summarized and reported within the time periods
specified in the Commission’s rules and forms, and (2) accumulated and
communicated to our management, including our chief executive officer and chief
financial officer, as appropriate to allow timely decisions regarding required
disclosure.
No changes to our internal control over
financial reporting occurred during the quarter ended December 31, 2005 that
have materially affected, or are reasonably likely to materially affect, our
internal control over financial reporting (as defined in Rules 13a-15(f) and
15d-15(f) under the Exchange Act). In 2005, we engaged Ernst & Young LLP to
assist our management in its documentation and evaluation of our internal
controls in preparation for the periodic management evaluations and annual
auditor attestation reports regarding the effectiveness of our “internal
control over financial reporting” that will be required when the SEC’s rules
under Section 404 of the Sarbanes-Oxley Act of 2002 become applicable to us
beginning with our Annual Report on Form 10-K for the year ending December 31,
2006 to be filed in the first quarter of 2007. We cannot give any assurance,
however, that our internal controls over financial reporting will be effective
when Section 404 becomes applicable to us. Ineffective internal controls over
financial reporting could cause investors to lose confidence in our reported
financial information and could result in a lower trading price for our
securities.
ITEM 9B. OTHER INFORMATION
None.
28
PART III
ITEM 10. DIRECTORS AND EXECUTIVE OFFICERS OF
THE REGISTRANT
Omitted in accordance with General
Instruction I of Form 10-K.
ITEM 11. EXECUTIVE COMPENSATION
Omitted in accordance with General Instruction I
of Form 10-K.
ITEM 12. SECURITY OWNERSHIP OF CERTAIN
BENEFICIAL OWNERS AND MANAGEMENT AND RELATED STOCKHOLDER MATTERS
Omitted in accordance with General Instruction I
of Form 10-K.
ITEM 13. CERTAIN RELATIONSHIPS AND RELATED
TRANSACTIONS
Omitted in accordance with General
Instruction I of Form 10-K.
ITEM 14. PRINCIPAL ACCOUNTANT FEES AND
SERVICES
The following
table shows the aggregate fees billed to our parent Huntsman Corporation by
Deloitte & Touche LLP, the member firms of Deloitte Touche Tohmatsu
and their respective affiliates (collectively, “Deloitte & Touche”) in
each of the last two fiscal years for the services indicated (dollars in
millions):
|
|
|
2005
|
|
2004
|
|
|
Audit Fees
|
|
$
|
12.9
|
|
$
|
14.4
|
|
|
Audit-Related Fees
|
|
0.9
|
|
0.6
|
|
|
Tax Fees
|
|
4.5
|
|
4.4
|
|
|
All Other Fees
|
|
—
|
|
0.3
|
|
|
Total
|
|
$
|
18.3
|
|
$
|
19.7
|
|
Audit
Fees. Fees
for audit services include fees associated with annual audits, the filing of Huntsman
Corporation’s registration statement on Form S-1 in connection with its initial
public offering, reviews of annual reports on Form 10-K and quarterly reports
on Form 10-Q, statutory audits required internationally, services related to
comfort letters and consents and assistance with other filings and public
offering documents filed with the SEC.
Audit-Related
Fees. Fees
for audit-related services principally include due diligence in connection with
acquisitions and accounting consultations, compliance with financing
arrangements and consultations on financial accounting and reporting issues.
Tax
Fees. Fees
for tax services include tax compliance, tax advice and tax planning including,
but not limited to, international tax compliance and advice, federal and state
tax advice, mergers and acquisitions tax advice and assistance with the
preparation of foreign tax returns (including expatriate tax return
preparation).
All
Other Fees. All
other fees include fees for services not included in audit fees, audit-related
fees and tax fees, such as purchase and implementation of internal control
tracking software during 2004.
Audit
Committee Pre-Approval Policies and Procedures
The Huntsman
Corporation Audit Committee (the “Audit Committee”) has, by resolution, adopted
policies and procedures regarding the pre-approval of the performance by
Deloitte & Touche of certain audit and non-audit services.
Deloitte & Touche may not perform any service enumerated in
Section 201(a) of the Sarbanes-Oxley Act of 2002, except as may otherwise
be provided by law or regulation. Deloitte & Touche may not perform
any service unless the approval of the Audit Committee is obtained prior to the
performance of the services, except as may otherwise be provided by law or
regulation. The Audit Committee has pre-approved, by category, the performance
by Deloitte & Touche of certain audit and accounting services, certain
tax services, and, provided that fees do not exceed $250,000 per individual
project, certain other tax services and audit-related services. The Audit
Committee has delegated to the committee chairperson the power to pre-approve
services beyond those previously described, provided that no services may be
approved that are prohibited pursuant to Section 201(a) of the
Sarbanes-Oxley Act of 2002 or that appear reasonably likely to compromise the
independence of Deloitte & Touche. Any pre-approval granted by the
chairperson is reviewed by the Audit Committee at its next regularly scheduled
meeting. In addition, the Audit Committee receives an annual report detailing
the prior year’s expenditures consistent with the SEC’s accountant fee disclosure
requirements.
29
PART IV
ITEM 15. EXHIBITS AND FINANCIAL STATEMENT
SCHEDULES
(a) Documents filed with
this report.
1. Consolidated
Financial Statements:
See Index to Consolidated Financial
Statements on page F-1
2. Financial Statement
Schedules:
Other than as stated on the Index to
Consolidated Financial Statements on page F-1 with respect to
Schedule II, financial statement schedules are omitted because they are
not required or are not applicable or the required information is shown in the
financial statements or notes thereto.
3. Exhibits:
The exhibits to this report are listed on the
Exhibit Index below.
(b) Description of
exhibits.
|
Number
|
|
Description
|
|
2.1
|
|
Agreement and Plan of Merger dated August 16, 2005 relating to
our merger with Huntsman LLC (incorporated by reference to Exhibit 2.1
to our current report on Form 8-K filed August 22, 2005).
|
|
|
|
|
|
2.2
|
|
Share and Asset Purchase Agreement by and between our Company, Ciba
Specialty Chemicals Holding Inc. and RM 2526 Vermogensverwaltungs GmbH dated
as of February 18, 2006 (incorporated by reference to Exhibit 2.1 to our
current report on Form 8-K filed February 24, 2006).
|
|
|
|
|
|
3.1
|
|
Certificate of Formation of our Company (incorporated by reference to
Exhibit 3.1 to our registration statement on Form S-4 (File
No. 333– 85141))
|
|
|
|
|
|
3.2
|
|
Second Amended and Restated Limited Liability Company Agreement of our
Company dated December 20, 2001 (incorporated by reference to
Exhibit 3.2 to amendment no. 1 to our annual report on Form 10-K/A
for the year ended December 31, 2001)
|
|
|
|
|
|
3.3
|
|
Certificate of Amendment to Certificate of Formation of our Company
(incorporated by reference to Exhibit 3.9 to our annual report on
Form 10-K for the year ended December 31, 2000)
|
30
|
4.1
|
|
Indenture, dated as of June 30, 1999, among our Company (f/k/a
Huntsman ICI Chemicals LLC), the Guarantors party thereto and Bank One, N.A.,
as Trustee, relating to the 10 1/8% Senior Subordinated Notes due 2009
(incorporated by reference to Exhibit 4.1 to our registration statement
on Form S-4 (File No. 333-85141))
|
|
|
|
|
|
4.2
|
|
Form of 10 1/8% Senior Subordinated Note due 2009
denominated in dollars (included as Exhibit A-3 to Exhibit 4.1)
|
31
|
4.3
|
|
Form of 10 1/8% Senior Subordinated Note due 2009
denominated in euros (included as Exhibit A-4 to Exhibit 4.1)
|
|
|
|
|
|
4.4
|
|
Form of Guarantee relating to the 10 1/8% Senior Subordinated
Notes due 2009 (included as Exhibit E of Exhibit 4.1)
|
|
|
|
|
|
4.5
|
|
First Amendment, dated January 5, 2000, to Indenture, dated as
of June 30, 1999, among our Company (f/k/a Huntsman ICI Chemicals LLC),
as Issuer, each of the Guarantors named therein and Bank One, N.A., as
Trustee (incorporated by reference to Exhibit 4.6 to our registration
statement on Form S-4 (File No. 333-85141))
|
|
|
|
|
|
4.6
|
|
Indenture, dated as of March 13, 2001, among our Company, as
Issuer, the Guarantors named therein and The Bank of New York, as Trustee,
relating to 10 1/8% Senior Subordinated Notes due 2009 (incorporated by
reference to Exhibit 4.6 to amendment no. 1 to our annual report on
Form 10-K/A for the year ended December 31, 2001)
|
|
|
|
|
|
4.7
|
|
Form of 10 1/8% Senior Subordinated Note due 2009 denominated
in dollars (included as Exhibit A-3 to Exhibit 4.6)
|
|
|
|
|
|
4.8
|
|
Form of 10 1/8% Senior Subordinated Note due 2009
denominated in euros (included as Exhibit A-4 to Exhibit 4.6)
|
|
|
|
|
|
4.9
|
|
Form of Guarantee relating to the 10 1/8% Senior Subordinated
Notes due 2009 (included as Exhibit E of Exhibit 4.6)
|
|
|
|
|
|
4.10
|
|
First Supplemental Indenture, dated as of January 11, 2002,
among our Company, as Issuer, the Guarantors named therein and The Bank of
New York, as Trustee, relating to 10 1/8% Senior Subordinated Notes due 2009
(incorporated by reference to Exhibit 4.7 to amendment no. 1 to our
annual report on Form 10-K/A for the year ended December 31, 2001)
|
|
|
|
|
|
4.11
|
|
Indenture, dated as of March 21, 2002, among our Company, as
Issuer, the Guarantors named therein and Wells Fargo Bank Minnesota, National
Association, as Trustee, relating to the 9 7/8% Senior Notes due 2009
(incorporated by reference to Exhibit 4.8 to amendment no. 1 to our
annual report on Form 10-K/A for the year ended December 31, 2001)
|
|
|
|
|
|
4.12
|
|
Form of 9 7/8% Senior Note due 2009 denominated in dollars
(included as Exhibit A-3 to Exhibit 4.11)
|
|
|
|
|
|
4.13
|
|
Form of 9 7/8% Senior Note due 2009 denominated in euros
(included as Exhibit A-4 to Exhibit 4.11)
|
|
|
|
|
|
4.14
|
|
Form of Guarantee relating to the 9 7/8% Senior Notes due 2009
(included as Exhibit E of Exhibit 4.11)
|
|
|
|
|
|
4.15
|
|
Amended and Restated Guarantee, dated as of April 11, 2003,
among the Guarantors named therein and Wells Fargo Bank Minnesota, National
Association, as Trustee, relating to the 9 7/8% Senior Notes due 2009
(incorporated by reference to Exhibit 4.15 to our registration statement
on Form S-4 (File No. 333-106482))
|
|
|
|
|
|
4.16
|
|
Indenture, dated as of December 17, 2004, among our Company, as
Issuer, the Guarantors named therein and Wells Fargo Bank, National
Association, as Trustee, relating to 7 3/8% Senior
|
32
|
|
|
Subordinated Notes due 2015 and 7 1/2% Senior Subordinated Notes due
2015 (incorporated by reference to Exhibit 4.1 to our current report on
Form 8-K dated December 17, 2004 (File No. 333-85141))
|
|
|
|
|
|
4.17
|
|
Form of 7 3/8% Senior Subordinated Notes due 2015 denominated in
dollars (included as Exhibit A-1 to Exhibit 4.16)
|
|
|
|
|
|
4.18
|
|
Form of 7 1/2% Senior Subordinated Notes due 2015 denominated in
euros (included as Exhibit A-2 to Exhibit 4.16)
|
|
|
|
|
|
4.19
|
|
Form of Guarantee (included as Exhibit E to
Exhibit 4.16)
|
|
|
|
|
|
4.20
|
|
Exchange and Registration Rights Agreement, dated as of
December 17, 2004, among our Company, the Guarantors as defined therein,
and the Purchasers as defined therein, relating to the 7 3/8% Senior
Subordinated Notes due 2015 and the 7 1/2% Senior Subordinated Notes due 2015
(incorporated by reference to Exhibit 4.2 to our current report on
Form 8-K dated December 17, 2004 (File No. 333-85141))
|
|
|
|
|
|
4.21
|
|
Supplemental Indenture dated August 16, 2005 to Indenture dated
as of June 30, 1999, as amended, among our Company, the Guarantors named
therein, and Wells Fargo Bank, National Association (as successor by
consolidation to Wells Fargo Bank Minnesota, National Association), as
trustee, relating to our Company’s dollar and euro denominated 10 1/8% senior
subordinated notes due 2009 (incorporated by reference to Exhibit 4.1 to
our current report on Form 8-K filed August 22, 2005).
|
|
|
|
|
|
4.22
|
|
Supplemental Indenture dated August 16, 2005 to Indenture dated
as of March 13, 2001, as amended, among our Company, the Guarantors
named therein, and The Bank of New York, as trustee, relating to our
Company’s euro denominated 10 1/8% senior subordinated notes due 2009
(incorporated by reference to Exhibit 4.2 to our current report on
Form 8-K filed August 22, 2005).
|
|
|
|
|
|
4.23
|
|
Supplemental Indenture dated August 16, 2005 to Indenture dated
as of March 21, 2002 among our Company, the Guarantors named therein,
and Wells Fargo Bank, National Association (as successor by consolidation to
Wells Fargo Bank Minnesota, National Association), as trustee, relating
to our Company’s 9 7/8% senior notes due 2009 (incorporated by reference to
Exhibit 4.3 to our current report on Form 8-K filed August 22,
2005).
|
|
|
|
|
|
4.24
|
|
Supplemental Indenture dated August 16, 2005 to Indenture dated
as of December 17, 2004 among our Company, the Guarantors named therein,
and Wells Fargo Bank, National Association (as successor by consolidation to
Wells Fargo Bank Minnesota, National Association), as trustee, relating to our
Company’s dollar denominated 7 3/8% senior subordinated notes due 2015 and
euro denominated 7 1/2% senior subordinated notes due 2015 (incorporated by
reference to Exhibit 4.4 to our current report on Form 8-K filed
August 22, 2005).
|
|
|
|
|
|
4.25
|
|
Indenture dated September 30, 2003 among Huntsman LLC, the Guarantors
named therein, and HSBC Bank USA, National Association, as trustee, relating
to our Company’s 11 5/8% senior secured notes due 2010, originally issued by
Huntsman LLC (incorporated by reference to Exhibit 4.36 to Huntsman LLC’s
registration statement on Form S-4 (File No. 333-112279)).
|
|
|
|
|
|
4.26
|
|
Supplemental Indenture dated July 13, 2005 to Indenture dated
September 30, 2003 among Huntsman LLC, the Guarantors named therein and
HSBC Bank USA, National Association, as trustee, relating to our Company’s
11 5/8% senior secured notes due 2010, originally issued by Huntsman LLC
(incorporated by reference to Exhibit 4.2 to the current report on
Form 8-K of Huntsman LLC filed July 15, 2005).
|
|
|
|
|
|
4.27
|
|
Supplemental Indenture dated August 16, 2005 to Indenture dated
September 30, 2003 among our Company, the Guarantors named therein and
HSBC Bank USA, National Association, as trustee, relating to our Company’s 11
5/8% senior secured notes due 2010, originally issued by Huntsman LLC
(incorporated by reference to Exhibit 4.7 to our current report on
Form 8-K filed August 22, 2005).
|
|
|
|
|
|
4.28
|
|
Indenture dated June 22, 2004 among HLLC, the Guarantors named
therein, and HSBC Bank USA, National Association, as trustee, relating to the
11 1/2% senior notes due 2012 and senior floating rate notes due 2011,
originally issued by Huntsman LLC (incorporated by reference to
Exhibit 4.1 to the quarterly report on Form 10-Q of Huntsman LLC
for the quarter ended June 30, 2004).
|
33
|
4.29
|
|
Supplemental Indenture dated July 11, 2005 to Indenture dated
June 22, 2004 among Huntsman LLC, the Guarantors named therein and HSBC
Bank USA, National Association, as trustee, relating to our Company’s 11 1/2%
senior notes due 2012 and senior floating rate notes due 2011 (incorporated
by reference to Exhibit 4.1 to the current report on Form 8-K of
HLLC filed July 15, 2005).
|
|
|
|
|
|
4.30
|
|
Supplemental Indenture dated August 16, 2005 to Indenture dated
June 22, 2004 among our Company, the Guarantors named therein and HSBC
Bank USA, National Association, as trustee, relating to our Company’s 11 1/2%
senior notes due 2012 and senior floating rate notes due 2011, originally
issued by Huntsman LLC (incorporated by reference to Exhibit 4.10 to our
current report on Form 8-K filed August 22, 2005).
|
|
|
|
|
|
4.31
|
|
Supplemental Indenture dated December 20, 2005 to Indenture
dated as of June 30, 1999, as amended, among our Company, the guarantors
named therein, and Wells Fargo Bank, National Association (as successor by
consolidation to Wells Fargo Bank Minnesota, National Association), as
trustee, relating to our Company’s dollar and euro denominated 10 1/8% senior
subordinated notes due 2009 (incorporated by reference to Exhibit 4.1 to our
current report on Form 8-K filed on December 27, 2005).
|
|
|
|
|
|
4.32
|
|
Supplemental Indenture dated December 20, 2005 to Indenture
dated as of March 13, 2001, as amended, among our Company, the Guarantors
named therein, and The Bank of New York, as trustee, relating to our
Company’s euro denominated 10 1/8% senior subordinated notes due 2009
(incorporated by reference to Exhibit 4.2 to our current report on Form 8-K
filed on December 27, 2005).
|
|
|
|
|
|
4.33
|
|
Supplemental Indenture dated December 20, 2005 to Indenture
dated as of March 21, 2002, as amended, among our Company, the Guarantors
named therein, and Wells Fargo Bank, National Association (as successor by
consolidation to Wells Fargo Bank Minnesota, National Association), as
trustee, relating to our Company’s 9 7/8% senior notes due 2009
(incorporated by reference to Exhibit 4.3 to our current report on Form 8-K
filed on December 27, 2005).
|
|
|
|
|
|
4.34
|
|
Supplemental Indenture dated December 20, 2005 to Indenture
dated as of December 17, 2004, as amended, among our Company, the Guarantors
named therein, and Wells Fargo Bank, National Association (as successor by
consolidation to Wells Fargo Bank Minnesota, National Association), as
trustee, relating to our Company’s dollar denominated 7 3/8% senior
subordinated notes due 2015 and euro denominated 7 ½% senior subordinated
notes due 2015 (incorporated by reference to Exhibit 4.4 to our current
report on Form 8-K filed on December 27, 2005).
|
|
|
|
|
|
4.35
|
|
Supplemental Indenture dated December 20, 2005 to Indenture
dated September 30, 2003 among our Company (as successor by merger to
Huntsman LLC), the Guarantors named therein and HSBC Bank USA, National
Association, as trustee, relating to our Company’s 11 5/8% senior
secured notes due 2010 (incorporated by reference to Exhibit 4.5 to our
current report on Form 8-K filed on December 27, 2005).
|
|
|
|
|
|
4.36
|
|
Supplemental Indenture dated December 20, 2005 to Indenture
dated June 22, 2004, as amended, among our Company (as successor by
merger to Huntsman LLC), the Guarantors named therein, and HSBC Bank USA,
National Association, as trustee, relating to our 11 1/2% senior notes due
2012 and senior floating rate notes due 2011 (incorporated by reference to
Exhibit 4.6 to our current report on Form 8-K filed on December 27, 2005).
|
|
|
|
|
|
10.1
|
|
Contribution Agreement, dated as of April 15, 1999, by and among
Imperial Chemical Industries PLC, Huntsman Specialty Chemicals Corporation,
Huntsman International Holdings LLC (f/k/a Huntsman ICI Holdings LLC) and our
Company (f/k/a Huntsman ICI Chemicals LLC) as amended by the first Amending
Agreement, dated June 4, 1999, the second Amending Agreement, dated
June 30, 1999, and the third Amending Agreement, dated June 30,
1999 (incorporated by reference to Exhibit 10.1 to our registration
statement on Form S-4 (File No. 333-85141))
|
|
|
|
|
|
10.2
|
|
Purchase and Sale Agreement (PO/MTBE Business), dated March 21,
1997, among Texaco, Texaco Chemical Inc. and Huntsman Specialty Chemicals
Corporation (incorporated by reference to Exhibit 10.2 to our
registration statement on Form S-4 (File No. 333-85141))
|
|
|
|
|
|
10.3
|
|
Operating and Maintenance Agreement, dated as of March 21, 1997,
by and between Huntsman Specialty Chemicals Corporation and Huntsman
Petrochemical Corporation (incorporated by reference to Exhibit 10.3 to
our registration statement on Form S-4 (File No. 333-85141))
|
34
|
10.8
|
|
Contribution Agreement, among our Company, as Contributor and
Originator, and Huntsman Receivables Finance LLC, as the Company, dated as of
December 20, 2000 (incorporated by reference to Exhibit 10.17 to
our annual report on Form 10-K for the year ended December 31,
2000)
|
|
|
|
|
|
10.9
|
|
Huntsman Master Trust Pooling Agreement, dated as of
December 21, 2000, among Huntsman Receivables Finance LLC, as Company,
Huntsman (Europe) BVBA, as Master Servicer, and Chase Manhattan Bank
(Ireland) Plc, as Trustee (incorporated by reference to Exhibit 10.18 to
our annual report on Form 10-K for the year ended December 31,
2000)
|
|
|
|
|
|
10.10
|
|
Huntsman Master Trust, Series 2000-1 Supplement, dated as of
December 21, 2000, to Pooling Agreement dated as of December 21,
2000, among Huntsman Receivables Finance LLC, as Company, Huntsman (Europe),
BVBA, as Master Servicer, The Chase Manhattan Bank, as Funding Agent, Park
Avenue Receivables Corp., as Series 2000-1 Initial Purchaser, the
several financial institutions party thereto from time to time as
Series 2000-1 APA Banks, and Chase Manhattan Bank (Ireland) Plc, as
Trustee (incorporated by reference to Exhibit 10.19 to our annual report
on Form 10-K for the year ended December 31, 2000)
|
|
|
|
|
|
10.11
|
|
Servicing Agreement, dated as of December 21, 2000, among
Huntsman Receivables Finance LLC, as the Company, Huntsman (Europe) BVBA, as
Master Servicer, Tioxide Americas Inc., Huntsman ICI Holland B.V., Tioxide
Europe Limited, our Company, Huntsman Petrochemicals (U.K.) Limited, Huntsman
Propylene Oxide Ltd., Huntsman International Fuels L.P., as Local Servicers,
Chase Manhattan Bank (Ireland) Plc, as Trustee, Pricewaterhousecoopers, as
Liquidation Servicer, and our Company, as Servicer Guarantor (incorporated by
reference to Exhibit 10.20 to our annual report on Form 10-K for
the year ended December 31, 2000)
|
|
|
|
|
|
10.12
|
|
U.S. Receivables Purchase Agreement, our Company, as Purchaser, and
Tioxide Americas Inc., Huntsman Propylene Oxide Ltd. and Huntsman
International Fuels, L.P., each as a Seller and an Originator (incorporated
by reference to Exhibit 10.21 to our annual report on Form 10-K for
the year ended December 31, 2000)
|
|
|
|
|
|
10.13
|
|
Dutch Receivables Purchase Agreement, dated as of December 21,
2000, between our Company, as Purchaser, Huntsman ICI Holland B.V., as
Originator, Huntsman ICI (Europe) B.V.B.A., as Master Servicer (incorporated
by reference to Exhibit 10.22 to our annual report on Form 10-K for
the year
|
35
|
|
|
ended December 31, 2000)
|
|
|
|
|
|
10.14
|
|
U.K. Receivables Purchase Agreement, dated as of December 20,
2000, between our Company, as Purchaser, Tioxide Europe Limited and Huntsman
Petrochemicals (U.K.) Limited, as Originators, and Huntsman (Europe)
B.V.B.A., as Master Servicer (incorporated by reference to Exhibit 10.23
to our annual report on Form 10-K for the year ended December 31,
2000)
|
|
|
|
|
|
10.17
|
|
Amendment Agreement, dated December 20, 2001, between Imperial
Chemical Industries PLC, Huntsman Specialty Chemicals Corporation, Huntsman
International Holdings LLC and our Company, to amend the Contribution
Agreement dated as of April 15, 1999 (incorporated by reference to
Exhibit 10.26 to our registration statement on Form S-4 (File
No. 333-106482))
|
|
|
|
|
|
10.18
|
|
Second Amendment, dated as of October 21, 2002, between Huntsman
Receivables Finance LLC, Huntsman (Europe), BVBA, and J.P. Morgan (Ireland)
PLC, to Series 2000-1 Supplement, dated as of December 21, 2000 (incorporated
by reference to Exhibit 10.27 to our annual report on Form 10-K for
the year ended December 31, 2002)
|
|
|
|
|
|
10.19
|
|
First Amendment to Series 2001-1 Supplement, dated as of
October 21, 2002, among Huntsman Receivables Finance LLC, Huntsman (Europe)
BVBA and J.P. Morgan Bank (Ireland) PLC (incorporated by reference to
Exhibit 10.28 to our annual report on Form 10-K for the year ended
December 31, 2002)
|
|
|
|
|
|
10.20
|
|
First Amendment to Amended and Restated Pooling Agreement, dated as
of October 21, 2002, among Huntsman Receivables Finance LLC, Huntsman
(Europe) BVBA and J.P. Morgan Bank (Ireland) PLC (incorporated by reference
to Exhibit 10.29 to our annual report on Form 10-K for the year
ended December 31, 2002)
|
|
|
|
|
|
10.21
|
|
Amended and Restated Servicing Agreement, dated as of
October 21, 2002, among Huntsman Receivables Finance LLC, as the
Company, Huntsman (Europe) BVBA, as Master Servicer, Tioxide Americas Inc.,
Huntsman Holland B.V., Tioxide Europe Limited, our Company, Huntsman
Petrochemicals (UK) Limited, Huntsman Propylene Oxide Ltd., Huntsman
International Fuels L.P., Tioxide Europe SRL, Huntsman Surface Sciences
Italia SRL, Huntsman Patrica S.R.L., Tioxide Europe S.L., Huntsman Surface
Sciences Ibérica, S.L., Tioxide Europe SAS, Huntsman Surface Sciences
(France) S.A.S., Huntsman Surface Sciences UK Ltd, Huntsman Ethyleneamines
Ltd., as Local Servicers, J.P. Morgan Bank (Ireland) PLC, as Trustee,
Pricewaterhousecoopers, as Liquidation Servicer, and our Company, as Servicer
Guarantor (incorporated by reference to Exhibit 10.30 to our annual
report on Form 10-K for the year ended December 31, 2002)
|
|
|
|
|
|
10.22
|
|
Amended and Restated U.S. Receivables Purchase Agreement, dated as of
October 21, 2002, among our Company, as Purchaser, and Tioxide Americas
Inc., Huntsman Propylene Oxide Ltd., Huntsman International Fuels L.P., and
Huntsman Ethyleneamines Ltd., each as a Seller and an Originator
(incorporated by reference to Exhibit 10.31 to our annual report on
Form 10-K for the year ended December 31, 2002)
|
|
|
|
|
|
10.23
|
|
Amended and Restated UK Receivables Purchase Agreement, dated as of
October 21, 2002, among our Company, as Purchaser, Huntsman Surface
Sciences UK Limited, Tioxide Europe Limited, and Huntsman Petrochemicals (UK)
Limited, as Originators, Huntsman (Europe) B.V.B.A, as Master Servicer
(incorporated by reference to Exhibit 10.32 to our annual report on
Form 10-K for the year ended December 31, 2002)
|
36
|
|
|
December 31, 2002)
|
|
|
|
|
|
10.25
|
|
Deed of Amendment to Contribution Agreement, dated as of
November 27, 2002, among Imperial Chemical Industries PLC, Huntsman
Specialty Chemicals Corporation, Huntsman International Holdings, LLC, and our
Company (incorporated by reference to Exhibit 10.34 to our annual report
on Form 10-K for the year ended December 31, 2002)
|
|
|
|
|
|
10.27
|
|
Business Consulting Agreement, dated as of June 3, 2003, between
our Company and Jon M. Huntsman (incorporated by reference to
Exhibit 10.41 to our registration statement on Form S-4 (File
No. 333-106482))
|
|
|
|
|
|
10.30
|
|
Credit Agreement dated August 16, 2005 among our Company,
Deutsche Bank AG New York Branch as Administrative Agent and the other
financial institutions named therein (incorporated by reference to Exhibit 10.1
to our current report on Form 8-K filed August 22, 2005)
|
|
|
|
|
|
10.31
|
|
Intercreditor Agreement dated August 16, 2005 among Deutsche
Bank AG New York Branch as collateral agent and administrative agent under
the above referenced credit agreement, and HSBC Bank USA, National
Association as trustee under the indenture governing our Company’s 11 5/8%
senior secured notes (incorporated by reference to Exhibit 10.2 to our
current report on Form 8-K filed August 22, 2005)
|
|
|
|
|
|
10.32
|
|
Collateral Security Agreement dated August 16, 2005 among our
Company, Deutsche Bank AG New York Branch and other financial institutions
named therein (incorporated by reference to Exhibit 10.3 to our current
report on Form 8-K filed August 22, 2005)
|
|
|
|
|
|
10.33
|
|
Second Amendment to Amended and Restated Pooling Agreement dated
August 16, 2005 among Huntsman Receivables Finance LLC, Huntsman
(Europe), BVBA and J.P. Morgan Bank (incorporated by reference to
Exhibit 10.4 to our current report on Form 8-K filed
August 22, 2005)
|
|
|
|
|
|
10.34
|
|
Fourth Amendment to 2000-1 Supplement dated August 16, 2005
among Huntsman Receivables Finance LLC, Huntsman (Europe), BVBA and J.P.
Morgan (Ireland) Plc (incorporated by reference to Exhibit 10.5 to our
current report on Form 8-K filed August 22, 2005)
|
|
|
|
|
|
10.35
|
|
Consent and First Amendment to Credit Agreement dated
December 20, 2005 among our Company, Deutsche Bank AG New York Branch as
Administrative Agent and the other financial institutions named therein
(incorporated by reference to Exhibit 10.1 to our current report on Form 8-K
filed on December 27, 2005)
|
|
|
|
|
|
10.36
|
|
Collateral Security Agreement Supplement No. 1 dated
December 20, 2005 among our Company, Deutsche Bank AG New York Branch,
Huntsman Advanced Materials Holdings LLC, Huntsman Advanced Materials LLC and
Huntsman Advanced Materials Americas, Inc (incorporated by reference to
Exhibit 10.2 to our current report on Form 8-K filed on December 27, 2005)
|
|
|
|
|
|
10.37
|
|
Amended and Restated Huntsman Supplemental Executive Retirement Plan
(incorporated by reference to Exhibit 10.1 to our current report on Form 8-K
filed on December 30, 2005)
|
|
|
|
|
|
10.38
|
|
Huntsman Supplemental Executive MPP Plan (incorporated by reference
to Exhibit 10.2 to our current
|
37
|
|
|
report on Form 8-K filed on December 30, 2005)
|
|
|
|
|
|
10.39
|
|
Amended and Restated Huntsman Supplemental Savings Plan (incorporated
by reference to Exhibit 10.3 to our current
|
|
|
|
report on Form 8-K filed on December 30, 2005)
|
|
|
|
|
|
10.40*
|
|
Fifth Amendment to Series 2000-1 Supplement, dated March 14, 2006,
among Huntsman Receivables Finance LLC, Huntsman (Europe), BVBA, JPMorgan
Chase Bank, N.A. and J.P. Morgan (Ireland) plc.
|
|
|
|
|
|
18.1*
|
|
Preferability Letter from Deloitte & Touche LLP
|
|
|
|
|
|
21.1
|
|
Omitted pursuant to General Instruction I of Form 10-K
|
|
|
|
|
|
31.1*
|
|
Certification of Chief Executive Officer
pursuant to Section 302 of the Sarbanes-Oxley Act of 2002
|
|
31.2*
|
|
Certification of Chief Financial Officer
pursuant to Section 302 of the Sarbanes-Oxley Act of 2002
|
|
32.1*
|
|
Certification of Chief Executive Officer
pursuant to Section 906 of the Sarbanes-Oxley Act of 2002
|
|
32.2*
|
|
Certification of Chief Financial Officer
pursuant to Section 906 of the Sarbanes-Oxley Act of 2002
|
* Filed herewith.
38
SIGNATURES
Pursuant to the requirements of
Section 13 or 15(d) of the Securities Exchange Act of 1934, the Registrant
has duly caused this report to be signed on its behalf by the undersigned,
thereunto duly authorized.
Dated: March 17, 2006
|
|
HUNTSMAN INTERNATIONAL LLC
|
|
|
|
|
|
|
|
|
By:
|
/s/ J. KIMO ESPLIN
|
|
|
|
J. Kimo Esplin
Executive Vice President and Chief
Financial Officer
|
Pursuant to the requirements of the
Securities Exchange Act of 1934, this report has been signed below by the
following persons on behalf of the Registrant and in the capacities indicated
on the 17th day of March 2006.
|
/s/ JON M. HUNTSMAN
|
|
/s/ PETER R. HUNTSMAN
|
|
Jon M. Huntsman
Chairman of the Board and Manager
|
|
Peter R. Huntsman
President, Chief Executive Officer and
Manager
(Principal Executive Officer)
|
|
|
|
|
|
|
|
|
|
/s/ J. KIMO ESPLIN
|
|
/s/ SAMUEL D. SCRUGGS
|
|
J. Kimo Esplin
Executive Vice President and Chief
Financial Officer
(Principal Financial Officer)
|
|
Samuel D. Scruggs
Executive Vice President, General Counsel,
Secretary
and Manager
|
|
|
|
|
|
/s/ L. RUSSELL HEALY
|
|
|
|
L. Russell Healy
Vice President and Controller
(Principal Accounting Officer)
|
|
|
SUPPLEMENTAL INFORMATION TO BE FURNISHED WITH REPORTS FILED PURSUANT TO
SECTION 15(d) OF THE SECURITIES EXCHANGE ACT OF 1934 BY REGISTRANTS WHICH HAVE
NOT REGISTERED SECURITIES PURSUANT TO SECTION 12 OF THE SECURITIES EXCHANGE ACT
OF 1934
The registrant has not sent to its security
holders any annual report to security holders covering the registrant’s last
fiscal year or any proxy statement, form of proxy or other proxy soliciting
material sent to more than 10 of the registrant’s security holders with respect
to any annual or other meeting of security holders.
39
HUNTSMAN
INTERNATIONAL LLC AND SUBSIDIARIES
INDEX
TO CONSOLIDATED FINANCIAL STATEMENTS
F-1
RESPONSIBILITY FOR THE CONSOLIDATED FINANCIAL
STATEMENTS
Huntsman International LLC (“Company”)
management is responsible for the preparation, accuracy and integrity of the
consolidated financial statements and other financial information included in
this Annual Report. This responsibility includes preparing the statements in
accordance with accounting principles generally accepted in the United States
of America and necessarily includes estimates based upon management’s best
judgment.
To help ensure the accuracy and integrity of
Company financial data, management maintains internal controls which are
designed to provide reasonable assurance that transactions are executed as
authorized, that they are accurately recorded and that assets are properly
safeguarded. It is essential for all Company employees to conduct their
business affairs in keeping with the highest ethical standards as outlined in
our code of conduct policy, “Business Conduct Guidelines.” Careful selection of
employees, and appropriate divisions of responsibility also help us to achieve
our control objectives.
The consolidated balance sheets of Huntsman
International LLC and subsidiaries as of December 31, 2005 and 2004, and
the related consolidated statements of operations and comprehensive loss,
members’ equity, and cash flows for the years ended December 31, 2005,
2004 and 2003 have been audited by the Company’s independent registered public
accounting firm, Deloitte & Touche LLP. Their report is shown on page
F-3.
The Board of Managers oversees the adequacy
of the Company’s control environment. Representatives of the Audit Committee
meet periodically with representatives of Deloitte & Touche LLP,
internal financial management and the internal auditor to review accounting,
control, auditing and financial reporting matters. The independent registered
public accounting firm and the internal auditor also have full and free access
to meet privately with the Audit Committee.
F-2
REPORT OF INDEPENDENT REGISTERED PUBLIC ACCOUNTING FIRM
To the Board of Managers and Members of
Huntsman International LLC and subsidiaries
We have audited the accompanying consolidated balance sheets of
Huntsman International LLC and subsidiaries (the “Company”) as of December 31,
2005 and 2004, and the related consolidated statements of operations and comprehensive
loss, members’ equity, and cash flows for each of the three years in the period
ended December 31, 2005. Our audits also included the financial statement
schedule listed in the index on page F-1. These financial statements and
financial statement schedule are the responsibility of the Company’s management.
Our responsibility is to express an opinion on the financial statements and
financial statement schedule based on our audits.
We conducted our audits in accordance with the standards of the Public
Company Accounting Oversight Board (United States). Those standards require
that we plan and perform the audit to obtain reasonable assurance about whether
the financial statements are free of material misstatement. The Company is not
required to have, nor were we engaged to perform, an audit of its internal
control over financial reporting. Our audits included consideration of internal
control over financial reporting as a basis for designing audit procedures that
are appropriate in the circumstances, but not for the purpose of expressing an
opinion on the effectiveness of the Company’s internal control over financial
reporting. Accordingly, we express no such opinion. An audit also includes
examining, on a test basis, evidence supporting the amounts and disclosures in
the financial statements, assessing the accounting principles used and
significant estimates made by management, as well as evaluating the overall
financial statement presentation. We believe that our audits provide a
reasonable basis for our opinion.
In our opinion, such consolidated financial statements present fairly,
in all material respects, the financial position of Huntsman International LLC
and subsidiaries as of December 31, 2005 and 2004, and the results of their
operations and their cash flows for each of the three years in the period ended
December 31, 2005, in conformity with accounting principles generally accepted
in the United States of America. Also, in our opinion, such financial statement
schedule, when considered in relation to the basic consolidated financial
statements taken as a whole, presents fairly in all material respects the
information set forth therein.
As discussed in Note 1 to the consolidated financial statements, the
consolidated financial statements reflect the financial position and results of
operations and cash flows as if Huntsman International Holdings LLC, Huntsman
LLC, Huntsman Advanced Materials Holdings LLC and Huntsman International LLC
were combined for all periods for which these companies were under common
control.
As discussed in Note 2 to the consolidated financial statements, the
Company adopted FASB Interpretation No. 46R, Consolidation
of Variable Interest Entities, on January 1, 2005, and FASB
Interpretation No. 47, Accounting for Conditional
Asset Retirement Obligations, on December 31, 2005.
As discussed in Note 2 to the consolidated financial statements, the
Company changed the measurement date for its pension and other postretirement
benefit plans from December 31 to November 30 during 2005.
|
/s/ DELOITTE & TOUCHE LLP
|
|
Houston, Texas
March 15, 2006
F-3
HUNTSMAN INTERNATIONAL LLC AND SUBSIDIARIES
CONSOLIDATED
BALANCE SHEETS
(Dollars
in Millions)
|
|
|
December 31,
|
|
December 31,
|
|
|
|
|
2005
|
|
2004
|
|
|
|
|
|
|
|
|
|
ASSETS
|
|
|
|
|
|
|
|
|
|
|
|
|
|
Current
assets:
|
|
|
|
|
|
|
Cash and cash equivalents
|
|
$
|
132.5
|
|
$
|
243.5
|
|
|
Restricted cash
|
|
—
|
|
8.9
|
|
|
Accounts and notes receivables (net of
allowance for doubtful accounts of $33.7 and $25.8, respectively)
|
|
1,475.2
|
|
1,585.8
|
|
|
Accounts receivable from affiliates
|
|
10.4
|
|
10.4
|
|
|
Inventories, net
|
|
1,309.2
|
|
1,253.9
|
|
|
Prepaid expenses
|
|
45.9
|
|
45.1
|
|
|
Deferred income taxes
|
|
31.2
|
|
11.9
|
|
|
Other current assets
|
|
69.9
|
|
24.9
|
|
|
Total current assets
|
|
3,074.3
|
|
3,184.4
|
|
|
|
|
|
|
|
|
|
Property,
plant and equipment, net
|
|
4,336.7
|
|
4,817.3
|
|
|
Investment
in unconsolidated affiliates
|
|
175.6
|
|
170.9
|
|
|
Intangible
assets, net
|
|
222.0
|
|
253.2
|
|
|
Goodwill
|
|
91.2
|
|
3.3
|
|
|
Deferred
income taxes
|
|
94.2
|
|
42.7
|
|
|
Receivables
from affiliates
|
|
3.0
|
|
23.6
|
|
|
Other
noncurrent assets
|
|
636.0
|
|
679.0
|
|
|
Total assets
|
|
$
|
8,633.0
|
|
$
|
9,174.4
|
|
|
|
|
|
|
|
|
|
LIABILITIES
AND MEMBERS’ EQUITY
|
|
|
|
|
|
|
|
|
|
|
|
|
|
Current
liabilities:
|
|
|
|
|
|
|
Accounts payable
|
|
$
|
1,092.7
|
|
$
|
962.1
|
|
|
Accounts payable to affiliates
|
|
8.7
|
|
34.3
|
|
|
Accrued liabilities
|
|
732.3
|
|
779.2
|
|
|
Deferred income taxes
|
|
2.4
|
|
14.5
|
|
|
Current portion of long-term debt
|
|
44.6
|
|
37.5
|
|
|
Total current liabilities
|
|
1,880.7
|
|
1,827.6
|
|
|
|
|
|
|
|
|
|
Long-term
debt
|
|
4,413.3
|
|
5,799.6
|
|
|
Long-term
debt to affiliates
|
|
—
|
|
454.6
|
|
|
Deferred
income taxes
|
|
216.9
|
|
180.2
|
|
|
Other
noncurrent liabilities
|
|
770.0
|
|
712.3
|
|
|
Total liabilities
|
|
7,280.9
|
|
8,974.3
|
|
|
Minority
interests
|
|
20.4
|
|
36.7
|
|
|
|
|
|
|
|
|
|
Commitments
and contingencies (Notes 19 and 20)
|
|
|
|
|
|
|
|
|
|
|
|
|
|
Members’
equity:
|
|
|
|
|
|
|
Members’ equity, 1,443 and 1,000 units,
respectively
|
|
2,794.0
|
|
1,524.1
|
|
|
Accumulated deficit
|
|
(1,384.0
|
)
|
(1,504.7
|
)
|
|
Accumulated other comprehensive (loss)
income
|
|
(78.3
|
)
|
144.0
|
|
|
Total members’ equity
|
|
1,331.7
|
|
163.4
|
|
|
Total liabilities and members’ equity
|
|
$
|
8,633.0
|
|
$
|
9,174.4
|
|
See accompanying notes to
consolidated financial statements.
F-4
HUNTSMAN INTERNATIONAL LLC AND SUBSIDIARIES
CONSOLIDATED
STATEMENTS OF OPERATIONS AND
COMPREHENSIVE
LOSS
(Dollars
in Millions)
|
|
|
Year Ended December 31,
|
|
|
|
|
2005
|
|
2004
|
|
2003
|
|
|
|
|
|
|
|
|
|
|
|
Revenues:
|
|
|
|
|
|
|
|
|
Trade sales, services and fees
|
|
$
|
12,857.6
|
|
$
|
11,378.5
|
|
$
|
7,491.4
|
|
|
Related party sales
|
|
104.0
|
|
47.9
|
|
154.9
|
|
|
Total revenues
|
|
12,961.6
|
|
11,426.4
|
|
7,646.3
|
|
|
Cost of
goods sold
|
|
11,190.4
|
|
10,025.1
|
|
6,836.2
|
|
|
|
|
|
|
|
|
|
|
|
Gross
profit
|
|
1,771.2
|
|
1,401.3
|
|
810.1
|
|
|
|
|
|
|
|
|
|
|
|
Operating
expenses:
|
|
|
|
|
|
|
|
|
Selling, general and administrative
|
|
677.7
|
|
652.5
|
|
510.1
|
|
|
Research and development
|
|
95.5
|
|
96.1
|
|
86.8
|
|
|
Other operating expense (income)
|
|
42.2
|
|
(81.0
|
)
|
(78.5
|
)
|
|
Restructuring, impairment and plant closing
costs
|
|
123.6
|
|
299.3
|
|
55.0
|
|
|
Total expenses
|
|
939.0
|
|
966.9
|
|
573.4
|
|
|
Operating
income
|
|
832.2
|
|
434.4
|
|
236.7
|
|
|
|
|
|
|
|
|
|
|
|
Interest
expense, net
|
|
(425.6
|
)
|
(592.6
|
)
|
(480.5
|
)
|
|
Loss on
accounts receivable securitization program
|
|
(10.7
|
)
|
(15.6
|
)
|
(32.4
|
)
|
|
Equity in
income of investment in unconsolidated affiliates
|
|
8.2
|
|
4.0
|
|
1.7
|
|
|
Loss on
early extinguishment of debt
|
|
(167.3
|
)
|
(25.6
|
)
|
—
|
|
|
Other
expense
|
|
(0.2
|
)
|
(0.2
|
)
|
(0.7
|
)
|
|
|
|
|
|
|
|
|
|
|
Income (loss) from continuing operations
before income taxes, minority interests and accounting changes
|
|
236.6
|
|
(195.6
|
)
|
(275.2
|
)
|
|
Income tax
(expense) benefit
|
|
(42.8
|
)
|
22.9
|
|
(41.0
|
)
|
|
Minority
interest (expense) income
|
|
(1.7
|
)
|
(7.2
|
)
|
1.5
|
|
|
Income
(loss) from continuing operations
|
|
192.1
|
|
(179.9
|
)
|
(314.7
|
)
|
|
Loss from discontinued operations
(including loss on disposal of $36.4 in 2005), net of tax of nil
|
|
(43.9
|
)
|
(7.8
|
)
|
(2.6
|
)
|
|
Income
(loss) before accounting changes
|
|
148.2
|
|
(187.7
|
)
|
(317.3
|
)
|
|
Cumulative
effect of changes in accounting principle, net of tax of $3.3
|
|
(27.5
|
)
|
—
|
|
—
|
|
|
Net
income (loss)
|
|
120.7
|
|
(187.7
|
)
|
(317.3
|
)
|
|
Other
comprehensive (loss) income
|
|
(222.3
|
)
|
69.9
|
|
221.5
|
|
|
|
|
|
|
|
|
|
|
|
Comprehensive
loss
|
|
$
|
(101.6
|
)
|
$
|
(117.8
|
)
|
$
|
(95.8
|
)
|
See accompanying notes to
consolidated financial statements
F-5
HUNTSMAN INTERNATIONAL LLC AND SUBSIDIARIES
CONSOLIDATED
STATEMENTS OF MEMBERS’ EQUITY (DEFICIT)
(Dollars
in Millions)
|
|
|
Members’ equity
|
|
Accumulated
|
|
Accumulated other
comprehensive (loss)
|
|
|
|
|
|
|
Units
|
|
Amount
|
|
deficit
|
|
income
|
|
Total
|
|
|
Balance,
January 1, 2003
|
|
1,000
|
|
$
|
565.5
|
|
$
|
(80.2
|
)
|
$
|
(147.4
|
)
|
$
|
337.9
|
|
|
Net loss
|
|
—
|
|
—
|
|
(317.3
|
)
|
—
|
|
(317.3
|
)
|
|
Other
comprehensive income
|
|
—
|
|
—
|
|
—
|
|
221.5
|
|
221.5
|
|
|
Contribution
from parent and Vantico
|
|
—
|
|
958.6
|
|
(919.5
|
)
|
—
|
|
39.1
|
|
|
Balance,
December 31, 2003
|
|
1,000
|
|
|
1,524.1
|
|
|
(1,317.0
|
)
|
|
74.1
|
|
|
281.2
|
|
|
Net loss
|
|
—
|
|
—
|
|
(187.7
|
)
|
—
|
|
(187.7
|
)
|
|
Other
comprehensive income
|
|
—
|
|
—
|
|
—
|
|
69.9
|
|
69.9
|
|
|
Balance,
December 31, 2004
|
|
1,000
|
|
|
1,524.1
|
|
|
(1,504.7
|
)
|
|
144.0
|
|
|
163.4
|
|
|
Net income
|
|
—
|
|
—
|
|
120.7
|
|
—
|
|
120.7
|
|
|
Other
comprehensive loss
|
|
—
|
|
—
|
|
—
|
|
(222.3
|
)
|
(222.3
|
)
|
|
Contribution
from parent, net of distributions
|
|
443
|
|
1,269.9
|
|
—
|
|
—
|
|
1,269.9
|
|
|
Balance,
December 31, 2005
|
|
1,443
|
|
$
|
2,794.0
|
|
$
|
(1,384.0
|
)
|
$
|
(78.3
|
)
|
$
|
1,331.7
|
|
See accompanying notes to
consolidated financial statements
F-6
HUNTSMAN INTERNATIONAL LLC AND SUBSIDIARIES
CONSOLIDATED
STATEMENTS OF CASH FLOWS
(Dollars
in Millions)
|
|
|
Year Ended December 31,
|
|
|
|
|
2005
|
|
2004
|
|
2003
|
|
|
Operating Activities:
|
|
|
|
|
|
|
|
|
Net income (loss)
|
|
$
|
120.7
|
|
$
|
(187.7
|
)
|
$
|
(317.3
|
)
|
|
Adjustments to reconcile net income (loss)
to net cash provided by operating activities:
|
|
|
|
|
|
|
|
|
Cumulative effect of changes in accounting
principle, net of tax
|
|
27.5
|
|
—
|
|
—
|
|
|
Equity in income of unconsolidated
affiliates
|
|
(8.2
|
)
|
(4.0
|
)
|
(1.7
|
)
|
|
Depreciation and amortization
|
|
473.9
|
|
499.0
|
|
394.2
|
|
|
Provision for losses on accounts receivable
|
|
4.2
|
|
0.7
|
|
12.0
|
|
|
Loss on disposal of assets
|
|
—
|
|
2.4
|
|
0.6
|
|
|
Loss on early extinguishment of debt
|
|
167.3
|
|
25.6
|
|
—
|
|
|
Non-cash interest expense
|
|
47.2
|
|
145.5
|
|
132.1
|
|
|
Non-cash restructuring, impairment and
plant closing costs
|
|
64.1
|
|
138.0
|
|
12.2
|
|
|
Deferred income taxes
|
|
16.2
|
|
(58.3
|
)
|
9.3
|
|
|
Net unrealized loss (gain) on foreign
currency transactions
|
|
23.1
|
|
(111.7
|
)
|
(78.4
|
)
|
|
Other, net
|
|
9.5
|
|
(1.3
|
)
|
(7.6
|
)
|
|
Minority interest in subsidiaries’ income
(loss)
|
|
1.7
|
|
7.2
|
|
(1.5
|
)
|
|
Loss on disposal of discontinued operations
|
|
36.4
|
|
—
|
|
—
|
|
|
Changes in operating assets and
liabilities:
|
|
|
|
|
|
|
|
|
Accounts and notes receivable
|
|
159.1
|
|
(226.0
|
)
|
23.4
|
|
|
Change in receivables sold, net
|
|
(93.9
|
)
|
(90.0
|
)
|
18.6
|
|
|
Inventories
|
|
(96.9
|
)
|
(155.3
|
)
|
71.8
|
|
|
Prepaid expenses
|
|
44.4
|
|
30.2
|
|
(12.2
|
)
|
|
Other current assets
|
|
(37.6
|
)
|
88.4
|
|
(49.0
|
)
|
|
Other noncurrent assets
|
|
(123.5
|
)
|
(36.7
|
)
|
(29.5
|
)
|
|
Accounts payable
|
|
73.8
|
|
19.4
|
|
(52.1
|
)
|
|
Accrued liabilities
|
|
(34.1
|
)
|
89.6
|
|
83.6
|
|
|
Other noncurrent liabilities
|
|
113.4
|
|
6.6
|
|
7.4
|
|
|
Net cash provided by operating activities
|
|
988.3
|
|
181.6
|
|
215.9
|
|
|
|
|
|
|
|
|
|
|
|
Investing Activities:
|
|
|
|
|
|
|
|
|
Capital expenditures
|
|
(338.7
|
)
|
(226.6
|
)
|
(204.8
|
)
|
|
Net investment in unconsolidated affiliates
|
|
(8.0
|
)
|
(11.8
|
)
|
—
|
|
|
Proceeds from sale of assets
|
|
18.2
|
|
5.2
|
|
0.2
|
|
|
Acquisition of business, net of cash
acquired
|
|
—
|
|
—
|
|
(377.9
|
)
|
|
Purchase of Vantico senior notes
|
|
—
|
|
—
|
|
(22.7
|
)
|
|
Net cash received from (paid to) unconsolidated
affiliates
|
|
6.2
|
|
6.0
|
|
(8.3
|
)
|
|
Other, net
|
|
(2.9
|
)
|
2.6
|
|
(2.2
|
)
|
|
Change in restricted cash
|
|
8.9
|
|
1.6
|
|
(1.4
|
)
|
|
Net cash used in investing activities
|
|
(316.3
|
)
|
(223.0
|
)
|
(617.1
|
)
|
|
|
|
|
|
|
|
|
|
|
Financing Activities:
|
|
|
|
|
|
|
|
|
Net (repayment) borrowings under revolving
loan facilities
|
|
(118.7
|
)
|
113.8
|
|
(168.3
|
)
|
|
Repayment of long-term debt
|
|
(3,461.1
|
)
|
(2,822.8
|
)
|
(602.4
|
)
|
|
Proceeds from long-term debt
|
|
2,235.0
|
|
2,869.8
|
|
813.4
|
|
|
Issuance of senior secured notes
|
|
—
|
|
—
|
|
348.0
|
|
|
Cost of raising equity capital
|
|
—
|
|
—
|
|
(10.1
|
)
|
|
Call premiums related to early
extinguishment of debt
|
|
(104.7
|
)
|
(17.0
|
)
|
—
|
|
|
Payments on notes payable
|
|
(31.6
|
)
|
(19.6
|
)
|
(1.0
|
)
|
|
Other, net
|
|
4.9
|
|
5.4
|
|
2.7
|
|
|
Net (repayments) borrowings of overdraft
facility
|
|
—
|
|
(10.6
|
)
|
5.2
|
|
|
Debt issuance costs paid
|
|
(17.3
|
)
|
(35.6
|
)
|
(44.5
|
)
|
|
Dividend to parent for acquisition of
minority interest
|
|
(124.8
|
)
|
—
|
|
—
|
|
|
Contribution from parent
|
|
837.6
|
|
—
|
|
164.4
|
|
|
Net cash (used in) provided by financing
activities
|
|
(780.7
|
)
|
83.4
|
|
507.4
|
|
|
Effect of exchange rate changes on cash
|
|
(2.3
|
)
|
11.1
|
|
8.8
|
|
|
(Decrease) increase in cash and cash
equivalents
|
|
(111.0
|
)
|
53.1
|
|
115.0
|
|
|
Cash and cash equivalents at beginning of
period
|
|
243.5
|
|
190.4
|
|
75.4
|
|
|
Cash and cash equivalents at end of period
|
|
$
|
132.5
|
|
$
|
243.5
|
|
$
|
190.4
|
|
|
|
|
|
|
|
|
|
|
|
Supplemental cash flow information:
|
|
|
|
|
|
|
|
|
Cash paid for interest
|
|
$
|
413.6
|
|
$
|
455.6
|
|
$
|
263.5
|
|
|
Cash paid for income taxes
|
|
31.5
|
|
29.2
|
|
6.8
|
|
On February 28, 2005, HMP Equity Holdings
Corporation contributed the HIH Senior Subordinated Discount Notes at an
accreted value of $422.8 million to us in exchange for equity. During
2005, Huntsman Corporation contributed $9.3 million to us related to
stock-based compensation. Also during 2005, HLLC and our Company distributed
$250 million and $120 million, respectively, to Huntsman Corporation and
Huntsman Corporation contributed $370 million to our Company.
See accompanying notes to
consolidated financial statements
F-7
HUNTSMAN INTERNATIONAL LLC AND SUBSIDIARIES
NOTES
TO CONSOLIDATED FINANCIAL STATEMENTS
1. General
Description of
Business
Huntsman International LLC (“we,” “our,” “us”
or “Company,” including its subsidiaries, unless the context otherwise
requires) is a global manufacturer and marketer of differentiated and commodity
chemicals. We manage our business through six segments: Polyurethanes, Advanced
Materials, Performance Products, Polymers, Pigments and Base Chemicals. We
manufacture our products at facilities located in North America, Europe, Asia
and Africa and sell our products throughout the world.
Certain Definitions
In this report, “Huntsman Corporation” refers
to Huntsman Corporation, and, unless the context otherwise requires, its
subsidiaries, “HIH” refers to Huntsman International Holdings LLC, “Huntsman
LLC” or “HLLC” refers to Huntsman LLC, and, unless the context otherwise
requires, its subsidiaries, “AdMat Holdings” refers to Huntsman Advanced
Materials Holdings LLC and, unless the context otherwise requires, its
subsidiaries, “AdMat” refers to Huntsman Advanced Materials LLC and, unless the
context otherwise requires, its subsidiaries, “HMP” refers to HMP Equity
Holdings Corporation, “Huntsman Holdings” refers to Huntsman Holdings, LLC, “Huntsman
Family Holdings” refers to Huntsman Family Holdings LLC and “MatlinPatterson”
refers to MatlinPatterson Global Opportunities Partners L.P. and its
affiliates.
Company
We are a Delaware limited liability company
and all of our membership interests are owned by Huntsman Corporation. We were
formed in 1999 in connection with a transaction between HIH, Huntsman Specialty
Chemicals Corporation (“Huntsman Specialty”) and Imperial Chemical Industries
PLC (“ICI”). In that transaction, on June 30, 1999, HIH acquired ICI’s
polyurethane chemicals, selected petrochemicals and titanium dioxide (“TiO2”
or “Tioxide”) businesses and Huntsman Specialty’s propylene oxide (“PO”)
business. HIH also acquired the 20% ownership interest of BP Chemicals Limited
in an olefins facility located at Wilton, U.K. and certain related assets. HIH
then transferred the acquired businesses to us and to our subsidiaries.
On August 16, 2005, we completed a merger in
which Huntsman LLC, another wholly-owned subsidiary of Huntsman Corporation,
merged with and into us and we continued in existence as the surviving entity
(the “HLLC Merger”). At the same time, HIH was also merged into our Company.
Prior to the HLLC Merger, all of our membership interests were owned by HIH,
and HIH was owned 58% by Huntsman Corporation and 42% by Huntsman LLC.
On December 20, 2005, Huntsman Corporation acquired all of the
outstanding interests of AdMat Holdings. On December 20, 2005, Huntsman
Corporation contributed all of the outstanding equity of AdMat Holdings to us
(the “AdMat Minority Interest Transaction”). As a result, AdMat Holdings,
AdMat and its subsidiaries have become our subsidiaries. We did not pay
any consideration to Huntsman Corporation in connection with the AdMat Minority
Interest Transaction other than the issuance of additional equity to Huntsman
Corporation.
Immediately prior to the AdMat Minority
Interest Transaction, the equity interests of all holders in AdMat Holdings,
other than Huntsman Corporation, were converted into the right to receive an
aggregate of $125 million in cash (the “Minority Payment”). In connection
with the AdMat Minority Interest Transaction, we satisfied substantially all of
the Minority Payment obligation and repaid all outstanding indebtedness of
AdMat under its secured credit facility and senior secured notes, using cash on
hand and the proceeds of an increase in the term loan under our senior secured
credit facility. For more information, see “Note 14. Long-Term Debt.”
Huntsman Corporation effected the HLLC Merger
and the AdMat Minority Interest Transaction to simplify its consolidated group’s
financing and public reporting structure, to reduce its cost of financing and
to facilitate other organizational efficiencies. The HLLC Merger and the AdMat
Minority Interest Transaction were accounted for as an exchange of shares
between entities under common control similar to the pooling method. Our
consolidated financial
F-8
statements presented herein
reflect the financial position, results of operations and cash flows as if HIH,
Huntsman LLC, AdMat Holdings and our Company were combined for all periods for
which they were under common control.
Prior to the HLLC Merger and the AdMat
Minority Interest Transaction, we operated our businesses through four
segments: Polyurethanes, Performance
Products, Pigments and Base Chemicals. Huntsman LLC was a manufacturer and
marketer of a wide range of chemical products with manufacturing facilities
located in North America, Europe and Australia and it operated its business
through three segments: Performance Products, Polymers and Base Chemicals. AdMat
and its subsidiaries are manufacturers and marketers of advanced epoxy, acrylic
and polyurethane-based products used in a wide variety of industrial and
consumer applications and operate in a single Advanced Materials segment. We
have combined Huntsman LLC’s Performance Products and Base Chemicals segments
with our Performance Products and Base Chemicals segments and have added
Huntsman LLC’s Polymers segment and AdMat’s Advanced Materials segment, and we
now operate our business through six segments: Polyurethanes, Advanced
Materials, Performance Products, Pigments, Polymers and Base Chemicals.
2. Summary of Significant Accounting Policies
Principles of
Consolidation
Our consolidated financial statements include
the accounts of our wholly-owned and majority-owned subsidiaries and any
variable interest entities for which we are the primary beneficiary. All intercompany
accounts and transactions have been eliminated.
Use of Estimates
The preparation of financial statements in
conformity with generally accepted accounting principles in the U.S. (“GAAP”)
requires management to make estimates and assumptions that affect the reported
amounts of assets and liabilities and disclosure of contingent assets and
liabilities at the date of the financial statements and the reported amounts of
revenues and expenses during the reporting period. Actual results could differ
from those estimates.
Reclassifications
Certain amounts in the consolidated financial
statements for prior periods have been reclassified to conform with the current
presentation.
Revenue Recognition
We generate substantially all of our revenues
through sales in the open market and long-term supply agreements. We recognize
revenue when it is realized or realizable and earned. Revenue for product sales
is recognized when a sales arrangement exists, risk and title to the product
transfer to the customer, collectibility is reasonably assured and pricing is
fixed or determinable. The transfer of risk and title to the product to the
customer usually occurs at the time shipment is made.
Revenue related to the licensing of
technology is recognized when earned.
Revenue arrangements that contain multiple
deliverables are evaluated in accordance with EITF Issue No. 00-21 “Revenue Arrangements with Multiple Deliverables” to
determine whether the arrangements should be divided into separate units of
accounting and how the arrangement consideration should be measured and
allocated among the separate units of accounting.
Cost of Goods Sold
We classify the costs of manufacturing and
distributing our products as cost of goods sold. Manufacturing costs include
variable costs, primarily raw materials and energy, and fixed expenses directly
associated with production. Manufacturing costs include, among other things,
plant site operating costs and overhead, production planning and logistics
costs, repair and maintenance costs, plant site purchasing costs, and
engineering and technical support costs. Distribution, freight and warehousing
costs are also included in cost of goods sold.
Cash and Cash
Equivalents
We consider cash in checking accounts and
cash in short-term highly liquid investments with an original maturity of three
months or less to be cash and cash equivalents.
F-9
Securitization of
Accounts Receivable
We securitize certain trade receivables in
connection with a revolving accounts receivable securitization program in which
we grant a participating undivided interest in certain of our trade receivables
to a qualified off-balance sheet entity. We retain the servicing rights and a
retained interest in the securitized receivables. Losses are recorded on the
sale and are based on the carrying value of the receivables as allocated
between the receivables sold and the retained interests and their relative fair
value at the date of the transfer. Retained interests are subsequently carried
at fair value which is estimated based on the present value of expected cash
flows, calculated using management’s best estimates of key assumptions
including credit losses and discount rates commensurate with the risks
involved. For more information, see “Note 13. Securitization of Accounts
Receivable.”
Inventories
Inventories are stated at the lower of cost
or market, with cost determined using last-in first-out, first-in first-out,
and average costs methods for different components of inventory.
Property, Plant and
Equipment
Property, plant and equipment is stated at
cost less accumulated depreciation. Depreciation is computed using the
straight-line method over the estimated useful lives or lease term as follows:
|
Buildings and equipment
|
|
10 - 60 years
|
|
|
Plant and
equipment
|
|
3 - 25 years
|
|
|
Furniture,
fixtures and leasehold improvements
|
|
5 - 20 years
|
|
Interest expense capitalized as part of plant
and equipment was $9.3 million, $6.7 million and $5.1 million
for the years ended December 31, 2005, 2004 and 2003, respectively.
Periodic maintenance and repairs applicable
to major units of manufacturing facilities (a “turnaround”) are accounted for
on the prepaid basis by capitalizing the costs of the turnaround and amortizing
the costs over the estimated period until the next turnaround. Normal
maintenance and repairs of plant and equipment are charged to expense as
incurred. Renewals, betterments and major repairs that materially extend the
useful life of the assets are capitalized, and the assets replaced, if any, are
retired.
Investment in
Unconsolidated Affiliates
Investments in companies in which we exercise
significant management influence, but do not control, are accounted for using
the equity method. Investments in companies in which we do not exercise
significant influence are accounted for using the cost method.
Intangible Assets
and Goodwill
Intangible assets are stated at cost (fair value at the time of
acquisition) and are amortized using the straight-line method over the
estimated useful lives or the life of the related agreement as follows:
|
Patents and technology
|
|
5 - 30 years
|
|
|
Trademarks
|
|
15 - 30 years
|
|
|
Licenses and
other agreements
|
|
5 - 15 years
|
|
|
Other
intangibles
|
|
5 - 15 years
|
|
Goodwill represents costs in excess of fair
values assigned to the underlying net assets of acquired businesses. Goodwill
is not subject to any method of amortization, but is tested for impairment
annually (at the beginning of the third quarter) and when events and
circumstances indicate that an impairment may have occurred. When the fair
value is less than the related carrying value of the related reporting unit, we
are required to reduce the amount of goodwill through a charge to earnings.
Fair value is estimated based on projected discounted cash flows.
Other Noncurrent
Assets
Other noncurrent assets consist primarily of
spare parts, deferred debt issuance costs, employee benefit assets and
capitalized turnaround costs. Debt issuance costs are amortized using the
interest method over the term of the related debt.
F-10
Carrying Value of
Long-Lived Assets
We review long-lived assets and all
amortizable intangible assets for impairment whenever events or changes in
circumstances indicate that the carrying amount of these assets may not be
recoverable. Recoverability is based upon current and anticipated undiscounted
cash flows and we recognize an impairment when such estimated cash flows are
less than the carrying value of the asset. Measurement of the amount of
impairment, if any, is based upon the difference between carrying value and
fair value. Fair value is generally estimated by discounting estimated future
cash flows using a discount rate commensurate with the risks involved. See “Note 10.
Restructuring, Impairment and Plant Closing Costs” and “Note 25. Discontinued
Operations.”
Financial
Instruments
The carrying amount reported in the balance
sheet for cash and cash equivalents, accounts receivable and accounts payable
approximates fair value because of the immediate or short-term maturity of
these financial instruments. The carrying value of the senior secured credit
facilities approximates fair value since they bear interest at a variable rate
plus an applicable margin. The fair value of the fixed rate and floating rate
notes is estimated based on interest rates that are currently available to us
for issuance of debt with similar terms and remaining maturities. The fair
value of government securities is estimated using prevailing market prices. See
“Note 15. Fair Value of Financial Instruments.”
Income Taxes
We use the asset and liability method of
accounting for income taxes. Deferred income taxes reflect the net tax effects
of temporary differences between the carrying amounts of assets and liabilities
for financial and tax reporting purposes. We evaluate deferred tax assets to
determine whether it is more likely than not that they will be realized.
Valuation allowances are reviewed each period on a tax jurisdiction by tax jurisdiction
basis to analyze whether there is sufficient positive or negative evidence to
support a change in judgment about the realizability of the related deferred
tax assets.
Subsequent to acquiring AdMat in June 2003,
substantially all non-U.S. operations of AdMat were treated as branches for
U.S. income tax purposes and were, therefore, subject to both U.S. and non-U.S.
income tax. Effective January 1, 2006, AdMat’s foreign operations will no
longer be treated as our branches and will not be subject to U.S. taxation on
their earnings until those earnings are repatriated to the U.S., similar to our
other non-U.S. entities.
For non-U.S. entities that are not treated as
branches for U.S. tax purposes, we do not provide for income taxes on the
undistributed earnings of these subsidiaries as earnings are reinvested and, in
the opinion of management, will continue to be reinvested indefinitely.
Derivatives and
Hedging Activities
All derivatives, whether designated in
hedging relationships or not, are recorded on the balance sheet at fair value.
If the derivative is designated as a fair-value hedge, the changes in the fair
value of the derivative and the hedged items are recognized in earnings. If the
derivative is designated as a cash-flow hedge, changes in the fair value of the
derivative are recorded in other comprehensive income, to the extent effective,
and will be recognized in the income statement when the hedged item affects
earnings. We perform effectiveness assessments in order to use hedge accounting
at each reporting period. For a derivative that does not qualify or has not
been designated as a hedge, changes in fair value are recognized in earnings.
Environmental
Expenditures
Environmental related restoration and
remediation costs are recorded as liabilities when site restoration and
environmental remediation and clean-up obligations are either known or
considered probable and the related costs can be reasonably estimated. Other
environmental expenditures that are principally maintenance or preventative in
nature are recorded when expended and expensed or capitalized as appropriate.
See “Note 20. Environmental, Health and Safety Matters.”
Asset Retirement
Obligations
We accrue for asset retirement obligations,
which consist primarily of landfill closure costs and asbestos abatement costs,
in the period in which the obligations are incurred. Asset retirement
obligations are accrued at estimated fair value. When the liability is
initially recorded, we capitalize the cost by increasing the carrying amount of
the related long-lived asset. Over time, the liability is accreted to its
settlement value and the capitalized cost is depreciated over the useful life
of the related asset. Upon settlement of the liability, we will recognize a
gain or loss for any difference between the settlement amount and the liability
recorded. See “Note 11. Asset Retirement Obligations.”
Pensions and Postretirement
Benefits
In 2005, we
changed the measurement date of our pension and postretirement benefit plans
from December 31 to November 30. We believe the one-month change of the
measurement date is preferable because it provides us more time to review the
completeness and accuracy of the actuarial benefit information which results in
an improvement in our internal control procedures. The effect of the change in
measurement date on the respective obligations and assets of the plan resulted
in a cumulative effect of a change in accounting principle credit, net of tax
of $1.5 million, of $4.2 million recorded in the year ended December 31, 2005.
See “Note 17. Employee Benefit Plans.”
F-11
Research and
Development
Research and development costs are expensed as incurred.
Foreign Currency
Translation
The accounts of our operating subsidiaries
outside of the U.S., except for certain finance subsidiaries and those
operating in highly inflationary economic environments, consider local currency
to be the functional currency. Accordingly, assets and liabilities are
translated at rates prevailing at the balance sheet date. Revenues, expenses,
gains and losses are translated at a weighted average rate for the period.
Cumulative translation adjustments are recorded to members’ equity as a
component of accumulated other comprehensive income (loss).
Subsidiaries that operate in economic
environments that are highly inflationary consider the U.S. dollar to be the
functional currency and include gains and losses from remeasurement to the U.S.
dollar from the local currency in the statement of operations. The accounts of
certain finance subsidiaries outside of the U.S. also consider the U.S. dollar
to be the functional currency.
Transaction gains and losses are recorded in
the statement of operations and were a net loss of $39.0 million, a net
gain of $118.8 million and a net gain of $103.6 million for the years
ended December 31, 2005, 2004 and 2003, respectively.
Stock-Based Compensation
We adopted SFAS No. 123R, “Share Based
Payment” on January 1, 2005. SFAS No. 123R requires entities to measure the
cost of employee services received in exchange for an award of equity
instruments based on the grant-date fair value of the award. That cost will be
recognized over the period during which the employee is required to provide
services in exchange for the award. This standard eliminates the alternative to
use the intrinsic value method of accounting for share-based payment as
previously provided in APB Opinion No. 25, “Accounting for Stock Issued to
Employees.” We have applied this standard prospectively to share-based awards
issued to our employees in connection with Huntsman Corporation’s initial
public offering of common stock on February 16, 2005. We were allocated
share-based compensation expense of $9.5 million during the year ended December
31, 2005. We did not have share-based awards prior to the awards issued in
connection with Huntsman Corporation’s initial public offering.
Discontinued Operations
On July 6, 2005, we sold our toluene di-isocyanate (“TDI”) business.
See “Note 25. Discontinued Operations.” The results of operations associated
with this business has been reported as discontinued operations in the
accompanying consolidated statements of operations. Cash flows from
discontinued operations are not presented separately in the accompanying
consolidated statements of cash flows.
Recently Issued
Accounting Pronouncements
We adopted Financial Accounting Standards
Board (“FASB”) Financial Interpretation No. (“FIN”) 46R, “Consolidation of Variable Interest Entities”
on January 1, 2005. FIN 46R addresses the requirements for business enterprises
to consolidate related entities, for which they do not have controlling
interests through voting or other rights, if they are determined to be the
primary beneficiary as a result of variable economic interests. Transfers to a
qualifying special purpose entity are not subject to this interpretation. The
adoption of the standard required us to consolidate our Rubicon LLC joint
venture. Rubicon LLC manufactures products, including aniline and DPA, for us
and our joint venture partner. Rubicon LLC borrows funds from us and a joint
venture partner to finance capital requirements and receives reimbursement of
costs incurred to operate its facilities.
In November 2004, the FASB issued Statement
of Financial Accounting Standards (“SFAS”) No. 151, “Inventory Costs—an amendment of ARB No. 43.” SFAS No. 151
requires abnormal amounts of idle facility expense, freight, handling costs,
and wasted material to be recognized as current-period charges. It also
requires that allocation of fixed production overhead to the costs of
conversion be based on the normal capacity of the production facilities. The
requirements of the standard will be effective for inventory costs incurred
during fiscal years beginning after June 15, 2005. We are reviewing SFAS No.
151 to determine the statement’s impact on our consolidated financial
statements.
We adopted FIN 47, “Accounting for Conditional Asset Retirement Obligations” on
December 31, 2005. FIN 47 clarifies the term conditional asset retirement
obligation used in SFAS No. 143, “Accounting for Asset Retirement Obligations,”
and clarifies when an entity would have sufficient information to reasonably
estimate the fair value of an asset retirement obligation. During the fourth
quarter of 2005, we recorded a charge for the cumulative effect of this change
in accounting principle, net of tax of $4.8 million, of $31.7 million. See “Note
11. Asset Retirement Obligations.”
F-12
In
May 2005, the FASB issued SFAS No. 154, “Accounting
Changes and Error Corrections—a replacement of APB Opinion No. 20 and FASB
Statement No. 3.” SFAS No.
154 requires retrospective application to prior periods’ financial statements
of changes in accounting principle, unless it is impracticable to determine
either the period-specific effects or the cumulative effect of the change or
unless specific transition provisions are proscribed in the accounting
pronouncements. SFAS No. 154 does not change the accounting guidance for
reporting a correction of an error in previously issued financial statements or
a change in accounting estimate. SFAS No. 154 is effective for accounting
changes and error corrections made after December 31, 2005. We will apply this
standard prospectively.
In
September 2005, the Emerging Issues Task Force (“EITF”) reached a consensus on
issue 04-13, “Accounting for Purchase and
Sales of Inventory with the Same Counterparty,” that requires
companies to recognize an exchange of finished goods for raw materials or
work-in-process within the same line of business at fair value. All other
exchanges of inventory should be reflected at the recorded amount. This
consensus is effective for transactions completed after March 31, 2006. We are
evaluating the impact of this consensus to determine its impact on our
consolidated financial statements.
3. Business Combinations and Dispositions
AdMat
Acquisition
On June 30, 2003, Huntsman
Corporation’s predecessor company, MatlinPatterson, SISU Capital Ltd. (“SISU”),
Huntsman Group Inc., and Morgan Grenfell Private Equity Limited (“MGPE”)
completed a restructuring and business combination involving Vantico, whereby
ownership of the equity of Vantico was transferred to AdMat in exchange for
substantially all of the issued and outstanding Vantico senior notes (“Vantico
Senior Notes”) and approximately $165 million of additional equity (the “AdMat
Transaction”). Huntsman Corporation acquired 88.2% of the equity of AdMat and
began reporting AdMat as a consolidated subsidiary as of June 30, 2003. In connection with the AdMat Transaction,
AdMat issued $250 million aggregate principal amount of its 11% senior
secured notes due 2010 (the “AdMat Fixed Rate Notes”) and $100 million
aggregate principal amount of its senior secured floating rate notes due 2008
at a discount of 2%, or for $98 million (the “AdMat Floating Rate Notes”
and, collectively with the AdMat Fixed Rate Notes, the “AdMat Senior Secured
Notes”). Proceeds from the issuance of the AdMat Senior Secured Notes, along
with a portion of the additional equity, were used to purchase 100% of the
Vantico senior secured credit facilities (the “Vantico Credit Facilities”).
Also in connection with the AdMat Transaction, AdMat entered into a
$60 million senior secured revolving credit facility (the “AdMat Revolving
Credit Facility”).
There were no contingent
payments or commitments in connection with the AdMat Transaction. The total June
30, 2003 purchase price of AdMat was derived from the fair value of equity
exchanged or debt instruments acquired as follows (dollars in millions):
|
Cash
paid for the Vantico Credit Facilities and other credit facilities
|
|
$
|
431.3
|
|
|
Equity
issued for Vantico Senior Notes
|
|
67.8
|
|
|
Cash
paid for Vantico Senior Notes
|
|
22.7
|
|
|
Total purchase price of AdMat
|
|
$
|
521.8
|
|
F-13
The allocation of the June
30, 2003 purchase price to the assets and liabilities of AdMat is summarized as
follows (dollars in millions):
|
Current
assets
|
|
$
|
415.8
|
|
|
Current
liabilities
|
|
(242.4
|
)
|
|
Property,
plant and equipment
|
|
397.9
|
|
|
Intangible
assets
|
|
37.0
|
|
|
Deferred
taxes, net
|
|
(8.6
|
)
|
|
Other
noncurrent assets
|
|
44.2
|
|
|
Other
noncurrent liabilities
|
|
(122.1
|
)
|
|
Total purchase price of AdMat
|
|
521.8
|
|
|
Minority
interest
|
|
(29.2
|
)
|
|
Preferred
members’ interest
|
|
(195.7
|
)
|
|
Net assets acquired
|
|
$
|
296.9
|
|
During 2005 and 2004, we
reversed certain valuation allowances on deferred tax assets and certain
restructuring reserves recorded in the June 30, 2003 AdMat Transaction and
recorded a corresponding reduction to intangible assets of $0.8 million and
$31.9 million, respectively.
The acquired intangible
assets represent trademarks and patents which have a weighted-average useful
life of approximately 15-30 years.
On March 19, 2004, Huntsman
Corporation acquired MGPE’s 2.1% equity in AdMat Holdings for
$7.2 million.
On December 20, 2005, Huntsman
Corporation acquired the remaining 9.7% ownership interests from former AdMat
minority shareholders for $124.8 million and contributed its ownership interest
to us. Huntsman Corporation completed
the acquisition of AdMat in order to simplify its organizational and financial
reporting structure and to facilitate a more efficient tax structure.
Subsequent to December 20, 2005, we own, directly or indirectly, 100% of
AdMat. We have accounted for this step
acquisition using the purchase method. The preliminary allocation of the December
20, 2005 purchase price to the assets and liabilities of AdMat is summarized as
follows (dollars in millions):
|
Current
assets
|
|
$
|
2.3
|
|
|
Property,
plant and equipment
|
|
10.9
|
|
|
Intangible
assets
|
|
3.2
|
|
|
Goodwill
|
|
88.0
|
|
|
Deferred
taxes
|
|
(0.3
|
)
|
|
Other
noncurrent liabilities
|
|
(0.6
|
)
|
|
Accumulated
other comprehensive income
|
|
(2.3
|
)
|
|
Net assets acquired
|
|
101.2
|
|
|
Reversal
of minority interest
|
|
23.6
|
|
|
Cash paid for acquisition
|
|
$
|
124.8
|
|
This purchase price
allocation is preliminary pending finalization of fair value of assets acquired
and liabilities assumed. The acquired intangible assets represent trademarks
and patents which have a weighted-average useful life of approximately
15-30 years. The goodwill, none of which is deductible for tax purposes,
was assigned to the Advanced Materials segment.
HLLC Consolidation Transaction and Merger with HLLC and HIH
Prior to May 9,
2003, HLLC owned, indirectly, approximately 61% of the membership interests of
HIH. HLLC accounted for its investment in HIH using the equity method due to the
significant management participation rights formerly granted to Imperial Chemical
Industries PLC (“ICI”) pursuant to the HIH limited liability company agreement.
On May 9, 2003, Huntsman Corporation exercised an option that it held and
purchased the ICI subsidiary that held ICI’s 30% membership interest in HIH,
and, at that time, also purchased approximately 9% of the HIH membership
interests held by institutional investors (the “HLLC Consolidation
Transaction”). As a result of the HLLC Consolidation Transaction, Huntsman
Corporation owned 100% of the HIH membership interests. Accordingly, as of May
1, 2003, we and HLLC came under common control.
As noted in the “—Company” section above, on
August 16, 2005, Huntsman LLC and HIH merged with and into our
Company. We are, and each of Huntsman LLC and HIH was, a direct or
indirect wholly owned subsidiary of Huntsman Corporation. Huntsman
Corporation effected the HLLC Merger to simplify the consolidated group’s
financing and public reporting structure, to reduce its cost of financing and
to facilitate other organizational efficiencies. As a result of the HLLC
F-14
Merger,
we succeeded to the assets, rights and obligations of Huntsman LLC. In particular, we entered into supplemental
indentures under which we assumed the obligations of Huntsman LLC under its
outstanding 11.625% senior secured notes due 2010 ($296 million outstanding
principal amount), 11.5% senior notes due 2012 ($198 million outstanding
principal amount) and senior floating rate notes due 2011 ($100 million
outstanding principal amount) (the “Former HLLC Notes”). Our
subsidiaries that previously guaranteed our outstanding debt securities have
provided guarantees of the Former HLLC Notes, and all subsidiaries of Huntsman
LLC that guaranteed the Former HLLC Notes prior to the HLLC Merger executed
supplemental indentures to guarantee all of our outstanding debt securities.
The
HLLC Merger and the AdMat Minority Interest Transaction were accounted for as
an exchange of shares between entities under common control similar to the
pooling method. Accordingly the
financial position, results of operations and cash flows of Huntsman LLC and AdMat
were combined with us effective May 1, 2003 and June 30, 2003, respectively.
The following is a summary of the assets and
liabilities recorded in connection with the HLLC Consolidation Transaction as
of May 1, 2003 (dollars in millions):
|
Current assets
|
|
$
|
835.8
|
|
|
Property, plant
and equipment, net
|
|
1,275.5
|
|
|
Noncurrent
assets
|
|
366.0
|
|
|
Current
liabilities
|
|
(507.9
|
)
|
|
Long-term debt
|
|
(1,767.7
|
)
|
|
Deferred taxes
|
|
(12.9
|
)
|
|
Noncurrent
liabilities
|
|
(227.8
|
)
|
|
|
|
|
|
|
Net liabilities
assumed
|
|
$
|
(39.0
|
)
|
Pending Acquisition
of Textile Effects Business
On February 20, 2006, we announced that we have
entered into a definitive agreement to acquire the global Textile Effects
business of Ciba Specialty Chemicals Inc. for CHF 332 million ($253 million). The purchase price will be reduced (i) by
approximately CHF 75 million ($57 million) in assumed debt and unfunded pension
and other post employment liabilities and (ii) up to approximately CHF 40
million ($31 million) in unspent restructuring costs. The final purchase price
is subject to a working capital and net debt adjustment. The transaction is
subject to customary terms and conditions, and is expected to occur by the end
of the third quarter of 2006.
Pending Sale of
U.S. Butadiene and MTBE Business
On February 24, 2006, we announced that we had signed
a letter of intent to sell the assets of our U. S. butadiene and MTBE business
operated in our Base Chemicals segment, which includes a manufacturing facility
located at Port Neches, Texas, to Texas Petrochemicals, L.P. for a sales price
of $275 million, subject to customary adjustments. We expect the transaction to
close in mid-2006. We expect to recognize a gain from this transaction upon
closing.
4. Inventories
Inventories
consisted of the following (dollars in millions):
|
|
|
December 31,
|
|
December 31,
|
|
|
|
|
2005
|
|
2004
|
|
|
Raw
materials and supplies
|
|
$
|
374.1
|
|
$
|
332.0
|
|
|
Work
in progress
|
|
82.1
|
|
91.5
|
|
|
Finished
goods
|
|
988.1
|
|
922.8
|
|
|
Total
|
|
1,444.3
|
|
1,346.3
|
|
|
LIFO
reserves
|
|
(119.7
|
)
|
(81.0
|
)
|
|
Lower
of cost or market reserves
|
|
(15.4
|
)
|
(11.4
|
)
|
|
Inventories, net
|
|
$
|
1,309.2
|
|
$
|
1,253.9
|
|
As of December 31, 2005 and 2004, approximately 15% and 18%, respectively,
of inventories were recorded using the last-in, first-out cost method (“LIFO”).
At December 31, 2005 and 2004, the excess of current cost over the stated
LIFO value was $119.7 million and $81.0 million, respectively.
For the years ended December 31, 2005, 2004, and 2003, inventory
quantities were reduced resulting in a liquidation of certain LIFO inventory
layers carried at costs that were lower than the cost of current purchases, the
effect of which reduced the net loss by approximately $0.8 million,
$2.0 million and $1.0 million, respectively.
In the normal
course of operations, we at times exchange raw materials and finished goods with
other companies for the purpose of reducing transportation costs. The net open
exchange positions are valued at our cost. Net amounts deducted from or added
to inventory under open exchange agreements, which represent the net amounts
payable or receivable by us under open exchange agreements, were approximately
$3.8 million payable and $5.3 million payable (8.8 million and 8.7 million
pounds) at December 31, 2005 and 2004, respectively.
5. Property, Plant and Equipment
The cost and accumulated depreciation of property, plant and equipment
were as follows (dollars in millions):
|
|
|
December 31,
|
|
|
|
|
2005
|
|
2004
|
|
|
Land
|
|
$
|
139.0
|
|
$
|
142.1
|
|
|
Buildings
|
|
516.9
|
|
607.5
|
|
|
Plant
and equipment
|
|
6,297.4
|
|
6,411.1
|
|
|
Construction
in progress
|
|
321.5
|
|
251.6
|
|
|
Total
|
|
7,274.8
|
|
7,412.3
|
|
|
Less
accumulated depreciation
|
|
(2,938.1
|
)
|
(2,595.0
|
)
|
|
Net
|
|
$
|
4,336.7
|
|
$
|
4,817.3
|
|
Depreciation expense for the years ended December 31, 2005, 2004
and 2003 was $436.8 million, $452.1 million and $349.6 million,
respectively.
F-15
Property, plant and equipment includes gross assets acquired under
capital leases of $21.6 million and $24.5 million at December 31,
2005 and 2004, respectively; related amounts included in accumulated
depreciation were $8.5 million and $9.1 million at December 31, 2005
and 2004, respectively.
6. Investment in Unconsolidated Affiliates
Our ownership percentage and investment in unconsolidated affiliates
were as follows (dollars in millions):
|
|
|
December 31,
|
|
|
|
|
2005
|
|
2004
|
|
|
|
|
|
|
|
|
|
Equity
Method:
|
|
|
|
|
|
|
|
|
Polystyrene
Australia Pty Ltd. (50%)
|
|
$
|
3.3
|
|
$
|
4.7
|
|
|
Sasol-Huntsman
GmbH and Co. KG (50%)
|
|
22.6
|
|
17.5
|
|
|
Louisiana
Pigment Company, L.P. (50%)
|
|
116.8
|
|
121.6
|
|
|
Rubicon,
LLC (50%)(1)
|
|
—
|
|
5.7
|
|
|
BASF
Huntsman Shanghai Isocyanate Investment BV (50%) (2)
|
|
25.9
|
|
17.9
|
|
|
Others
|
|
4.5
|
|
1.0
|
|
|
Total
equity method investments
|
|
173.1
|
|
168.4
|
|
|
|
|
|
|
|
|
|
Cost
Method:
|
|
|
|
|
|
|
Gulf
Advanced Chemicals Industry Corporation (4%)
|
|
2.5
|
|
2.5
|
|
|
Total
investments
|
|
$
|
175.6
|
|
$
|
170.9
|
|
(1) Beginning January 1, 2005, we consolidated the
results of operations and financial position of Rubicon LLC in accordance with
FIN 46R because we are the primary beneficiary of this variable interest
entity. Rubicon LLC manufactures four major products, including aniline, DPA,
MDI and polyols. Rubicon LLC borrows funds from us and a joint venture partner
to finance its capital requirements and receives reimbursement of costs
incurred to operate its facilities.
(2) We own 50% of BASF Huntsman Shanghai Isocyanate
Investment BV. BASF Huntsman Shanghai Isocyanate Investment BV owns a 70%
interest in a manufacturing joint venture, thus giving us an indirect 35%
interest in the manufacturing joint venture.
Summarized Financial Information of
Unconsolidated Affiliates
Summarized applicable financial information of Sasol-Huntsman GmbH
and Co. KG, as of December 31, 2005 and 2004 and for the years ended
December 31, 2005, 2004 and 2003 is presented below (dollars in millions):
|
|
|
December 31,
|
|
|
|
|
2005
|
|
2004
|
|
2003
|
|
|
|
|
|
|
|
|
|
|
|
Current
assets
|
|
$
|
19.3
|
|
$
|
22.3
|
|
|
|
|
Noncurrent
assets
|
|
74.7
|
|
68.9
|
|
|
|
|
Current
liabilities
|
|
7.6
|
|
8.7
|
|
|
|
|
Noncurrent
liabilities
|
|
41.2
|
|
47.5
|
|
|
|
|
Revenues
|
|
58.9
|
|
58.1
|
|
$
|
53.8
|
|
|
Gross
profit
|
|
12.1
|
|
11.9
|
|
8.6
|
|
|
Net
income
|
|
15.9
|
|
5.3
|
|
9.0
|
|
|
|
|
|
|
|
|
|
|
|
|
Summarized applicable financial information of our remaining
unconsolidated affiliates, Louisiana Pigment Company, Rubicon, LLC (for periods
prior to its consolidation on January 1, 2005), BASF AG (“BASF”), Huntsman
Shanghai Isocyanate Investment BV and Polystyrene Australia Pty Ltd. as of
December 31, 2005 and 2004 and for the years ended December 31, 2005,
2004 and 2003 is presented below (dollars in millions):
F-16
|
|
|
December 31,
|
|
|
|
|
2005
|
|
2004
|
|
2003
|
|
|
|
|
|
|
|
|
|
|
|
Assets
|
|
$
|
337.1
|
|
$
|
534.4
|
|
|
|
|
Liabilities
|
|
44.8
|
|
237.6
|
|
|
|
|
Revenues
|
|
299.8
|
|
1,055.5
|
|
$
|
814.2
|
|
|
Net
income (loss)
|
|
0.4
|
|
2.9
|
|
(5.6
|
)
|
|
|
|
|
|
|
|
|
|
|
The
Company’s equity in:
|
|
|
|
|
|
|
|
|
Net
assets
|
|
$
|
146.0
|
|
$
|
150.9
|
|
|
|
|
Net
income
|
|
0.2
|
|
1.4
|
|
$
|
(2.8
|
)
|
|
|
|
|
|
|
|
|
|
|
|
|
7. Intangible Assets
The gross carrying amount and accumulated amortization of intangible
assets were as follows (dollars in millions):
|
|
|
December 31, 2005
|
|
December 31, 2004
|
|
|
|
|
Carrying
|
|
Accumulated
|
|
|
|
Carrying
|
|
Accumulated
|
|
|
|
|
|
|
Amount
|
|
Amortization
|
|
Net
|
|
Amount
|
|
Amortization
|
|
Net
|
|
|
Patents,
trademarks, and technology
|
|
$
|
367.8
|
|
$
|
172.1
|
|
$
|
195.7
|
|
$
|
410.6
|
|
$
|
173.1
|
|
$
|
237.5
|
|
|
Licenses
and other agreements
|
|
29.2
|
|
14.5
|
|
14.7
|
|
18.3
|
|
10.8
|
|
7.5
|
|
|
Non-compete
agreements
|
|
45.0
|
|
42.8
|
|
2.2
|
|
49.9
|
|
43.1
|
|
6.8
|
|
|
Other
intangibles
|
|
21.1
|
|
11.7
|
|
9.4
|
|
2.1
|
|
0.7
|
|
1.4
|
|
|
Total
|
|
$
|
463.1
|
|
$
|
241.1
|
|
$
|
222.0
|
|
$
|
480.9
|
|
$
|
227.7
|
|
$
|
253.2
|
|
During 2005 and 2004,
the Company reversed valuation allowances on deferred tax assets and certain
restructuring reserves recorded in the AdMat Transaction and recorded a
corresponding reduction to intangible assets of approximately $0.8 million and
$31.9 million, respectively.
Amortization expense was $28.4 million,
$37.1 million and $37.5 million, for the years ended December 31, 2005, 2004
and 2003, respectively. Estimated future amortization expense for intangible
assets for the next five years is as follows (dollars in millions):
|
Year
ending December 31:
|
|
|
|
|
2006
|
|
$
|
28.6
|
|
|
2007
|
|
27.2
|
|
|
2008
|
|
25.8
|
|
|
2009
|
|
25.7
|
|
|
2010
|
|
25.5
|
|
|
|
|
|
|
8. Other Noncurrent Assets
Other noncurrent assets consisted of the following (dollars in
millions):
|
|
|
December 31,
|
|
|
|
|
2005
|
|
2004
|
|
|
|
|
|
|
|
|
|
Prepaid
pension costs
|
|
$
|
238.2
|
|
$
|
267.2
|
|
|
Debt
issuance costs
|
|
43.0
|
|
94.4
|
|
|
Capitalized
turnaround costs
|
|
83.5
|
|
116.6
|
|
|
Spare
parts inventory
|
|
121.5
|
|
103.0
|
|
|
Catalyst
assets
|
|
16.6
|
|
15.2
|
|
|
Deposits
|
|
15.2
|
|
16.7
|
|
|
Other
noncurrent assets
|
|
118.0
|
|
65.9
|
|
|
Total
|
|
$
|
636.0
|
|
$
|
679.0
|
|
F-17
Amortization expense of catalyst assets for the years ended December 31,
2005, 2004 and 2003 was $8.7 million, $9.8 million and $7.1 million,
respectively.
9. Accrued Liabilities
Accrued liabilities consisted of the following (dollars in millions):
|
|
|
December 31,
|
|
|
|
|
2005
|
|
2004
|
|
|
Payroll,
severance and related costs
|
|
$
|
108.8
|
|
$
|
166.1
|
|
|
Interest
|
|
93.9
|
|
119.3
|
|
|
Volume
and rebate accruals
|
|
88.1
|
|
94.4
|
|
|
Income
taxes
|
|
64.0
|
|
35.7
|
|
|
Taxes
(property and VAT)
|
|
87.6
|
|
83.1
|
|
|
Restructuring,
impairment and plant closing costs
|
|
55.2
|
|
122.2
|
|
|
Environmental
accruals
|
|
7.1
|
|
7.7
|
|
|
Pension
liabilities
|
|
21.8
|
|
23.1
|
|
|
Casualty
loss reserves
|
|
16.6
|
|
13.7
|
|
|
Other
miscellaneous accruals
|
|
189.2
|
|
113.9
|
|
|
Total
|
|
$
|
732.3
|
|
$
|
779.2
|
|
10. Restructuring, Impairment and Plant Closing Costs
While we continuously focus on identifying opportunities to reduce our
operating costs and maximize our operating efficiency, we have now
substantially completed our comprehensive global cost reduction program,
referred to as “Project Coronado.” Project Coronado was a program designed to
reduce our annual fixed manufacturing and selling, general and administrative
costs, as measured at 2002 levels, by $200 million. In connection with
Project Coronado, we announced the closure of eight smaller, less competitive
manufacturing units in our Polyurethanes, Advanced Materials, Performance
Products and Pigments segments. These and other actions have resulted in the
reduction of approximately 1,500 employees in these businesses since 2000.
As of December 31, 2005,
2004 and 2003, accrued restructuring, impairment and plant closing costs by
type of cost and initiative consisted of the following (dollars in millions):
F-18
|
|
|
|
|
|
|
|
|
Other
|
|
|
|
|
|
|
Workforce
|
|
Demolition and
|
|
Non-cancelable
|
|
restructuring
|
|
|
|
|
|
|
reductions(1)
|
|
decommissioning
|
|
lease costs
|
|
costs
|
|
Total(2)
|
|
|
|
|
|
|
|
|
|
|
|
|
|
|
|
Accrued
liabilities as of January 1, 2003
|
|
$
|
7.1
|
|
$
|
—
|
|
$
|
—
|
|
$
|
—
|
|
$
|
7.1
|
|
|
HLLC
balance at consolidation on May 1, 2003
|
|
3.9
|
|
3.3
|
|
0.6
|
|
|
|
7.8
|
|
|
AdMat
opening balance sheet liabilities at June 30, 2003
|
|
53.2
|
|
1.5
|
|
—
|
|
6.1
|
|
60.8
|
|
|
2003
credits for 2001 initiatives
|
|
(2.0
|
)
|
(0.3
|
)
|
(0.2
|
)
|
—
|
|
(2.5
|
)
|
|
2003
charges for 2003 initiatives
|
|
45.3
|
|
—
|
|
—
|
|
—
|
|
45.3
|
|
|
2003
payments for 2001 initiatives
|
|
(9.1
|
)
|
(0.4
|
)
|
(0.2
|
)
|
—
|
|
(9.7
|
)
|
|
2003
payments for 2003 initiatives
|
|
(32.0
|
)
|
—
|
|
—
|
|
—
|
|
(32.0
|
)
|
|
Accrued
liabilities as of December 31, 2003
|
|
66.4
|
|
4.1
|
|
0.2
|
|
6.1
|
|
76.8
|
|
|
Partial
reversal of AdMat Transaction opening balance sheet accrual
|
|
(2.9
|
)
|
—
|
|
(0.6
|
)
|
0.7
|
|
(2.8
|
)
|
|
2004
charges for 2003 initiatives
|
|
25.1
|
|
—
|
|
—
|
|
0.4
|
|
25.5
|
|
|
2004
charges for 2004 initiatives
|
|
106.5
|
|
4.9
|
|
6.4
|
|
18.0
|
|
135.8
|
|
|
2004
payments for 2003 initiatives
|
|
(48.0
|
)
|
—
|
|
(0.4
|
)
|
(3.0
|
)
|
(51.4
|
)
|
|
2004
payments for 2004 initiatives
|
|
(31.4
|
)
|
(0.6
|
)
|
—
|
|
(4.6
|
)
|
(36.6
|
)
|
|
Non-cash
settlements
|
|
—
|
|
—
|
|
(0.5
|
)
|
—
|
|
(0.5
|
)
|
|
Foreign
currency effect on reserve balance
|
|
6.3
|
|
—
|
|
—
|
|
—
|
|
6.3
|
|
|
Accrued
liabilities as of December 31, 2004
|
|
122.0
|
|
8.4
|
|
5.1
|
|
17.6
|
|
153.1
|
|
|
2005
charges for 2003 initiatives
|
|
11.8
|
|
—
|
|
2.5
|
|
0.1
|
|
14.4
|
|
|
2005
charges for 2004 initiatives
|
|
30.7
|
|
0.5
|
|
0.6
|
|
13.4
|
|
45.2
|
|
|
2005
charges for 2005 initiatives
|
|
13.6
|
|
—
|
|
—
|
|
0.2
|
|
13.8
|
|
|
Reversals
of reserves no longer required
|
|
(6.3
|
)
|
(0.1
|
)
|
(0.8
|
)
|
(6.7
|
)
|
(13.9
|
)
|
|
Partial
reversal of AdMat Transaction opening balance sheet accrual
|
|
(3.7
|
)
|
(0.8
|
)
|
—
|
|
(0.8
|
)
|
(5.3
|
)
|
|
2005
payments for 2001 initiatives
|
|
(0.4
|
)
|
—
|
|
—
|
|
—
|
|
(0.4
|
)
|
|
2005
payments for 2003 initiatives
|
|
(22.1
|
)
|
(0.2
|
)
|
(0.2
|
)
|
(1.0
|
)
|
(23.5
|
)
|
|
2005
payments for 2004 initiatives
|
|
(77.7
|
)
|
(1.7
|
)
|
(0.4
|
)
|
(6.3
|
)
|
(86.1
|
)
|
|
2005
payments for 2005 initiatives
|
|
(1.0
|
)
|
—
|
|
—
|
|
(0.9
|
)
|
(1.9
|
)
|
|
Foreign
currency effect on reserve balance
|
|
(12.7
|
)
|
(0.3
|
)
|
(0.3
|
)
|
(3.8
|
)
|
(17.1
|
)
|
|
Accrued
liabilities as of December 31, 2005
|
|
$
|
54.2
|
|
$
|
5.8
|
|
$
|
6.5
|
|
$
|
11.8
|
|
$
|
78.3
|
|
(1) Substantially
all of the positions terminated in connection with the restructuring programs
were terminated under ongoing termination benefit arrangements. Accordingly,
the related liabilities were accrued as a one-time charge to earnings in accordance
with SFAS No. 112, “Employers’
Accounting for Postemployment Benefits.”
(2) Accrued
liabilities by initiatives were as follows (dollars in millions):
|
|
|
December 31,
|
|
December 31,
|
|
|
|
|
2005
|
|
2004
|
|
|
|
|
|
|
|
|
|
2001
initiatives
|
|
$
|
1.4
|
|
$
|
2.8
|
|
|
2003
initiatives
|
|
28.4
|
|
44.8
|
|
|
2004
initiatives
|
|
47.7
|
|
99.2
|
|
|
2005
initiatives
|
|
11.6
|
|
—
|
|
|
Foreign
currency effect on reserve balance
|
|
(10.8
|
)
|
6.3
|
|
|
Total
|
|
$
|
78.3
|
|
$
|
153.1
|
|
Details with respect to
our reserves for restructuring, impairment and plant closing costs are provided
below by segment and initiative (dollars in millions):
F-19
|
|
|
|
|
Advanced
|
|
Performance
|
|
|
|
|
|
Base
|
|
Corporate
|
|
|
|
|
|
|
Polyurethanes
|
|
Materials
|
|
Products
|
|
Pigments
|
|
Polymers
|
|
Chemicals
|
|
& Other
|
|
Total
|
|
|
|
|
|
|
|
|
|
|
|
|
|
|
|
|
|
|
|
|
|
Accrued
liabilities as of January 1, 2003
|
|
$
|
7.1
|
|
$
|
—
|
|
$
|
—
|
|
$
|
—
|
|
$
|
—
|
|
$
|
—
|
|
$
|
—
|
|
$
|
7.1
|
|
|
HLLC
balance at consolidation on May 1, 2003
|
|
|
|
|
|
|
|
|
|
2.8
|
|
5.0
|
|
|
|
7.8
|
|
|
AdMat
opening balance sheet liabilities at June 30, 2003
|
|
—
|
|
60.8
|
|
—
|
|
—
|
|
—
|
|
—
|
|
—
|
|
60.8
|
|
|
2003
credits for 2001 initiatives
|
|
—
|
|
—
|
|
—
|
|
—
|
|
—
|
|
(2.5
|
)
|
—
|
|
(2.5
|
)
|
|
2003
charges for 2003 initiatives
|
|
28.1
|
|
—
|
|
10.7
|
|
6.5
|
|
—
|
|
—
|
|
—
|
|
45.3
|
|
|
2003
payments for 2001 initiatives
|
|
(7.2
|
)
|
—
|
|
—
|
|
—
|
|
—
|
|
(2.5
|
)
|
—
|
|
(9.7
|
)
|
|
2003
payments for 2003 initiatives
|
|
(12.2
|
)
|
(9.3
|
)
|
(8.3
|
)
|
(2.2
|
)
|
—
|
|
—
|
|
—
|
|
(32.0
|
)
|
|
Accrued
liabilities as of December 31, 2003
|
|
15.8
|
|
51.5
|
|
2.4
|
|
4.3
|
|
2.8
|
|
—
|
|
—
|
|
76.8
|
|
|
Adjustments
to the opening balance sheet of AdMat
|
|
—
|
|
(2.8
|
)
|
—
|
|
—
|
|
—
|
|
—
|
|
—
|
|
(2.8
|
)
|
|
2004
charges for 2003 initiatives
|
|
10.0
|
|
—
|
|
0.4
|
|
14.5
|
|
0.6
|
|
—
|
|
—
|
|
25.5
|
|
|
2004
charges for 2004 initiatives
|
|
16.4
|
|
9.0
|
|
56.6
|
|
27.3
|
|
9.4
|
|
16.7
|
|
0.4
|
|
135.8
|
|
|
2004
payments for 2003 initiatives
|
|
(11.5
|
)
|
(26.0
|
)
|
(2.4
|
)
|
(10.9
|
)
|
(0.6
|
)
|
—
|
|
—
|
|
(51.4
|
)
|
|
2004
payments for 2004 initiatives
|
|
(11.8
|
)
|
(0.1
|
)
|
(1.4
|
)
|
(14.3
|
)
|
(6.4
|
)
|
(2.2
|
)
|
(0.4
|
)
|
(36.6
|
)
|
|
Non-cash
settlements
|
|
—
|
|
(0.5
|
)
|
—
|
|
—
|
|
—
|
|
—
|
|
—
|
|
(0.5
|
)
|
|
Foreign
currency effect on reserve balance
|
|
0.1
|
|
1.9
|
|
2.6
|
|
1.1
|
|
—
|
|
0.6
|
|
—
|
|
6.3
|
|
|
Accrued
liabilities as of December 31, 2004
|
|
19.0
|
|
33.0
|
|
58.2
|
|
22.0
|
|
5.8
|
|
15.1
|
|
—
|
|
153.1
|
|
|
2005
charges for 2003 initiatives
|
|
4.1
|
|
0.2
|
|
—
|
|
10.1
|
|
—
|
|
—
|
|
—
|
|
14.4
|
|
|
2005
charges for 2004 initiatives
|
|
4.4
|
|
0.3
|
|
6.9
|
|
18.8
|
|
3.4
|
|
10.2
|
|
1.2
|
|
45.2
|
|
|
2005
charges for 2005 initiatives
|
|
—
|
|
0.4
|
|
4.0
|
|
2.6
|
|
—
|
|
6.8
|
|
—
|
|
13.8
|
|
|
Reversals
of reserves no longer required
|
|
(7.6
|
)
|
(2.9
|
)
|
(0.4
|
)
|
(2.8
|
)
|
(0.1
|
)
|
(0.1
|
)
|
—
|
|
(13.9
|
)
|
|
Partial
reversal of Admat Transaction opening balance sheet accrual
|
|
—
|
|
(5.3
|
)
|
—
|
|
—
|
|
—
|
|
—
|
|
—
|
|
(5.3
|
)
|
|
2005
payments for 2001 initiatives
|
|
(0.4
|
)
|
—
|
|
—
|
|
—
|
|
—
|
|
—
|
|
—
|
|
(0.4
|
)
|
|
2005
payments for 2003 initiatives
|
|
(4.5
|
)
|
(8.1
|
)
|
(0.8
|
)
|
(10.1
|
)
|
—
|
|
—
|
|
—
|
|
(23.5
|
)
|
|
2005
payments for 2004 initiatives
|
|
(0.8
|
)
|
(7.7
|
)
|
(33.6
|
)
|
(20.7
|
)
|
(5.2
|
)
|
(16.9
|
)
|
(1.2
|
)
|
(86.1
|
)
|
|
2005
payments for 2005 initiatives
|
|
—
|
|
(0.6
|
)
|
(0.1
|
)
|
(0.9
|
)
|
—
|
|
(0.3
|
)
|
—
|
|
(1.9
|
)
|
|
Foreign
currency effect on reserve balance
|
|
(3.3
|
)
|
(1.5
|
)
|
(8.6
|
)
|
(2.4
|
)
|
(0.5
|
)
|
(0.8
|
)
|
—
|
|
(17.1
|
)
|
|
Accrued
liabilities as of December 31, 2005
|
|
$
|
10.9
|
|
$
|
7.8
|
|
$
|
25.6
|
|
$
|
16.6
|
|
$
|
3.4
|
|
$
|
14.0
|
|
$
|
—
|
|
$
|
78.3
|
|
|
|
|
|
|
|
|
|
|
|
|
|
|
|
|
|
|
|
|
|
Current
portion of restructuring reserve
|
|
$
|
5.5
|
|
$
|
5.5
|
|
$
|
17.8
|
|
$
|
11.4
|
|
$
|
1.0
|
|
$
|
14.0
|
|
$
|
—
|
|
$
|
55.2
|
|
|
Long-term
portion of restructuring reserve
|
|
5.4
|
|
2.3
|
|
7.8
|
|
5.2
|
|
2.4
|
|
—
|
|
—
|
|
23.1
|
|
|
|
|
|
|
|
|
|
|
|
|
|
|
|
|
|
|
|
|
|
Estimated
additional future charges for current restructuring projects:
|
|
|
|
|
|
|
|
|
|
|
|
|
|
|
|
|
|
|
|
|
|
|
|
|
|
|
|
|
|
|
|
|
|
|
|
|
|
Estimated
additional charges within one year
|
|
$
|
—
|
|
$
|
2.6
|
|
$
|
0.6
|
|
$
|
5.5
|
|
$
|
6.5
|
|
$
|
0.1
|
|
$
|
—
|
|
$
|
15.3
|
|
|
|
|
|
|
|
|
|
|
|
|
|
|
|
|
|
|
|
|
|
Estimated
additional charges beyond one year
|
|
$
|
—
|
|
$
|
—
|
|
$
|
—
|
|
$
|
3.6
|
|
$
|
9.9
|
|
$
|
—
|
|
$
|
—
|
|
$
|
13.5
|
|
2005 Restructuring Activities
As of December 31, 2005
and December 31, 2004, we had reserves for restructuring, impairment and
plant closing costs of $78.3 million and $153.1 million,
respectively. During the year ended December 31, 2005, we recorded additional
net charges of $123.6 million (consisting of $59.5 million payable in cash
and $64.1 million of non-cash charges) for workforce reductions, demolition and
decommissioning and other restructuring costs associated with closure or
curtailment of activities at our smaller, less efficient manufacturing
facilities and for an impairment of long-lived assets. For purposes of
measuring impairment charges in 2005, the fair value of the assets was
determined based on estimated market prices. During the year ended December 31,
2005, we made cash payments against these reserves of $111.9 million.
As of December 31,
2005, our Polyurethanes segment restructuring reserve consisted of
$10.9 million related to various restructuring programs, including the
closure of our West Deptford, New Jersey site (as announced in 2004),
restructuring initiatives at the Rozenburg, Netherlands site (as announced in
2003), workforce reductions throughout our Polyurethanes segment (as announced
in 2003), and the closure of our Shepton Mallet, U.K. site (as announced in
2001). During 2005, we recorded asset impairment charges totaling $10.9 million
related to the closure of our West Deptford site. These restructuring
initiatives are not expected to result in additional restructuring charges.
As of December 31,
2005, our Advanced Materials segment restructuring reserve consisted of
$7.8 million related to the restructuring programs implemented in
association with the AdMat Transaction, the realignment and simplification of
the commercial and technical organization and the closure of our Kaohsiung,
Taiwan production facility. During 2005, we assessed the remaining
restructuring reserves established in association with the AdMat Transaction
and other 2004 initiatives and concluded that $5.3 million and $2.9 million,
respectively, were no longer necessary. Accordingly, we reversed these
restructuring reserves during the second quarter of 2005. The AdMat Transaction
reserve reversal was recorded as a reduction to property, plant and equipment
in accordance with EITF 95-3, “Recognition
of Liabilities in Connection with a Purchase Business Combination.”
The reversal of the restructuring reserve for the other 2004 initiatives was
recorded as a credit to earnings. These restructuring initiatives are expected
to result in additional restructuring charges of approximately $2.6 million
through 2006.
F-20
As of December 31,
2005, our Performance Products segment reserve consisted of $25.6 million
related to various restructuring programs across our European surfactants
business, including the closure of substantially all of our Whitehaven, U.K.
surfactants facility, and the realignment of our Jefferson County, Texas
operations. These restructuring activities are expected to result in additional
charges of approximately $0.6 million in 2006.
As of December 31,
2005, our Pigments segment reserve consisted of $16.6 million related to the
global workforce reductions announced in 2003, the reduction of our TiO2 production capacity announced
in 2004, and the announcement in July 2005 that our Pigments and Base
Chemicals segments would establish a single U.K. headquarters in Teesside, U.K.
This will result in the closure of our Pigments segment’s Billingham, U.K.
headquarters and the creation of a new support center for both businesses.
These restructuring initiatives are expected to result in additional
restructuring charges of approximately $9.1 million through 2007.
As of December 31, 2005,
our Polymers segment reserve consisted of $3.4 million related primarily to the
closure of our phenol manufacturing unit in Australia and restructuring
initiatives at Odessa, Texas. During the third quarter of 2005, we concluded
that the long-lived assets of our Australian styrenics business were impaired
as a result of disappointing performance and the lack of anticipated
strengthening of the styrenics market. Accordingly, our Polymers segment
recorded an impairment charge of $48.2 million during 2005 related to the
Australian styrenics assets. The fair value of the Australian styrenics assets
was determined based on estimated market prices. These restructuring
initiatives are expected to result in additional restructuring charges of
approximately $16.4 million through 2007.
As of
December 31, 2005, our Base Chemicals segment reserve consisted of
$14.0 million related primarily to the restructuring of our Jefferson
County, Texas operations, which was announced in August 2005, and workforce
reductions arising from the announced changes in work shift schedules and in
the engineering and support functions at our Wilton and North Tees, U.K.
facilities. Also included in the reserve are amounts related to an announcement
in July 2005 that our Pigments and Base Chemicals segments would establish a
single U.K. headquarters in Teesside, U.K.
2004 Restructuring Activities
As of December 31, 2004 and December 31, 2003, we had reserves
for restructuring and plant closing costs of $153.1 million and
$76.8 million, respectively. During the year ended December 31, 2004,
we recorded additional charges of $299.3 million, including
$138.0 million of charges for asset impairment and write downs, and
$161.3 million payable in cash for workforce reductions, demolition and
decommissioning and other restructuring costs associated with closure or
curtailment of activities at our smaller, less efficient manufacturing
facilities. During the 2004 period, we made cash payments against these
reserves of $88.0 million. For purposes of measuring impairment charges in
2004, the fair value of the assets was determined by using the present value of
expected cash flows.
As of
December 31, 2004, our Polyurethanes segment reserve consisted of
$19.0 million related to various restructuring programs, including the
closure of our West Deptford, New Jersey site (as announced in 2004),
restructuring initiatives at the Rozenburg, Netherlands site (as announced in
2003), workforce reductions throughout our Polyurethanes segment (as announced
in 2003), and the closure of our Shepton Mallet, U.K. site (as announced in
2001). During 2004, we recorded asset impairment charges of $10.5 million
related to the closure of our West Deptford site.
As of December 31, 2004, our Advanced Materials segment reserve
consisted of $33.0 million related to the restructuring program
implemented in association with the AdMat Transaction, the realignment and
simplification of our commercial and technical organization and the closure of
our Kaohsiung, Taiwan production facility. The restructuring program initiated
with the AdMat Transaction included reductions in costs of the global supply
chain, reductions in general and administrative costs across the business and
the centralization of operations where efficiencies could be achieved. During
2004, our Advanced Materials segment reversed $2.8 million of
restructuring reserves recorded in the AdMat Transaction that were no longer
required and recorded a corresponding reduction to intangible assets.
As of December 31, 2004, our Performance Products segment reserve
consisted of $58.2 million primarily related to various
restructuring programs primarily across our European surfactants business and
North American operations. During 2004, we
adopted a plan to reduce the workforce across all locations in our European
surfactants business by approximately 320 positions over a period of
15 months, including the closure of substantially all of our
Whitehaven, U.K. surfactants facility. We also announced a plan to close our
Guelph, Ontario manufacturing facility, maleic
anhydride briquette facility in St. Louis, Missouri, and technical facility in Austin, Texas. During 2004, we recorded asset impairment charges
totaling $40.5 million related to the closure of the Whitehaven, U.K. facility,
the Guelph, Ontario facility and the maleic anhydride briquette facility in St.
Louis, Missouri.
As of December 31, 2004, our Pigments segment reserve consisted of
$22.0 million related to the global workforce reductions announced
in 2003 and the reduction of our TiO2 production
capacity announced in 2004. During 2004, our
F-21
Pigments
segment announced that, following a review of our Pigments business, we would
idle approximately 55,000 tonnes, or about 10%, of our total TiO2
production capacity in the third and fourth quarter of 2004. In connection with
this reduction of our TiO2 production capacity, we recorded a $77.2
million asset impairment charge and a $4.3 million charge for the write-off of
spare parts inventory and other assets.
As of December 31, 2004, our Polymers segment reserve consisted of
$5.8 million related primarily to the closure of our phenol
manufacturing unit in Australia and to the demolition and decommissioning of our Odessa, Texas styrene
manufacturing facility. During 2004, we recorded asset impairment charges of
$3.6 million in connection with the closure of our phenol manufacturing
unit in Australia.
As of December 31, 2004, our Base Chemicals segment reserve
consisted of $15.1 million related to workforce reductions arising from
the announced change in work shift schedules and in the engineering and support
functions at our Wilton and North Tees, U.K. facilities.
During 2004, we recorded a restructuring charge in corporate and other
of $2.3 million, of which $1.9 million related to non-cash charges
and $0.4 million related to relocation costs.
2003 Restructuring Activities
As of December 31, 2003 and December 31, 2002, we had reserves
for restructuring and plant closing costs of $76.8 million and $7.1 million,
respectively. During the year ended December 31, 2003, we recorded
additional charges of $55.0 million, including $12.2 million of charges
for asset impairment and write downs, and $42.8 million payable in cash
for workforce reductions, demolition and decommissioning and other
restructuring costs associated with closure or curtailment of activities at our
smaller, less efficient manufacturing facilities. During the 2003 period, we
made cash payments against these reserves of $41.7 million. For purposes
of measuring impairment charges, the fair value of the assets was determined by
using the present value of expected cash flows.
As of
December 31, 2003, our Polyurethanes segment reserve consisted of
$15.8 million related to the restructuring initiatives at the Rozenburg, Netherlands
site (as announced in 2003), workforce reductions throughout our Polyurethanes
segment (as announced in 2003), and the closure of our Shepton Mallet, U.K.
site (as announced in 2001).
As of December 31, 2003, our Advanced Materials segment reserve
consisted of $51.5 million related to the restructuring program
implemented in association with the AdMat Transaction. This program included
reductions in costs of the global supply chain, reductions in general and
administrative costs across the business and the centralization of operations
where efficiencies could be achieved.
As of December 31, 2003, our Performance Products segment reserve
consisted of $2.4 million relating to the closure of a number of plants at
the Whitehaven, U.K. facility, the closure of an administrative office in
London, U.K., the rationalization of a surfactants technical center in Oldbury,
U.K., and the restructuring of a facility in Barcelona, Spain. During
2003, we recorded asset impairment charges of $11.4 million in connection with
the plant facility closure at Whitehaven,
U.K.
As of December 31, 2003, our Pigments segment reserve consisted of
$4.3 million related to workforce reductions of approximately 63 employees
across our global Pigments operations. The overall cost reduction program to be
completed through 2005 for our Pigments segment involved approximately 250
employees.
As of December 31, 2003, our Polymers segment reserve consisted of $2.8
million related to the demolition and decommissioning of our Odessa, Texas
styrene manufacturing facility and non-cancelable lease costs.
11. Asset
Retirement Obligations
We recognize asset
retirement obligations in the period in which they are incurred. When the
liability is initially recorded, we capitalize the cost by increasing the
carrying amount of the related long-lived asset. Over time, the liability is
accreted to its settlement value and the capitalized cost is depreciated over
the useful life of the related asset. Upon settlement of the liability, we will
recognize a gain or loss for any difference between the settlement amount and
the liability recorded. Upon initial adoption of SFAS No. 143, “Accounting for Asset Retirement Obligations” we identified certain legal obligations
with indeterminate settlement dates; therefore, the fair value of these
obligations could not be reasonably estimated and we did not record a
liability. On December 31, 2005,
we adopted FIN 47. FIN 47 clarifies the
term conditional asset retirement obligation
used in SFAS No. 143 and clarifies when an entity would have sufficient
information to reasonably estimate the fair value of an asset retirement
obligation.
Asset retirement
obligations consist primarily of landfill capping and closure and post-closure
costs and asbestos abatement costs. We are legally required to perform capping
and closure and post-closure care on the landfills and asbestos abatement on
certain of our premises. In accordance with SFAS No. 143 and FIN 47, for each
landfill and premises containing
F-22
asbestos we recognized
the fair value of a liability for an asset retirement obligation and
capitalized that cost as part of the cost basis of the related asset.
The following table
describes changes to our asset retirement obligation liability (dollars in
millions):
|
|
|
2005
|
|
2004
|
|
|
Asset
retirement obligation at the beginning of the year
|
|
$
|
7.2
|
|
$
|
—
|
|
|
Liabilities
incurred
|
|
—
|
|
6.7
|
|
|
Accretion
expense
|
|
0.5
|
|
0.5
|
|
|
FIN
47 net transition adjustment
|
|
38.9
|
|
—
|
|
|
Asset
retirement obligation at the end of the year
|
|
$
|
46.6
|
|
$
|
7.2
|
|
The cumulative effect of
adopting FIN 47 resulted in an after-tax charge to earnings of $31.7 million
(net of income taxes of $4.8 million) for the year ended December 31,
2005. The pro forma effects of the
application of FIN 47 as if the statement had been adopted on January 1, 2003
(instead of on December 31, 2005) are presented below (pro forma amounts
assuming the accounting change is applied retroactively, net of tax) (dollars
in millions):
|
|
|
Year Ended December 31,
|
|
|
|
|
2005
|
|
2004
|
|
2003
|
|
|
Income
(loss) from continuing operations, as reported
|
|
$
|
192.1
|
|
$
|
(179.9
|
)
|
$
|
(314.7
|
)
|
|
Pro
forma adjustments:
|
|
|
|
|
|
|
|
|
Depreciation
expense
|
|
(0.3
|
)
|
(0.3
|
)
|
(0.3
|
)
|
|
Accretion
expense
|
|
(3.0
|
)
|
(2.8
|
)
|
(2.6
|
)
|
|
Income
(loss) from continuing operations, pro forma
|
|
$
|
188.8
|
|
$
|
(183.0
|
)
|
$
|
(317.6
|
)
|
|
|
|
|
|
|
|
|
|
|
|
|
|
|
The actual and pro forma
asset retirement obligation liability balances as if FIN 47 had been adopted on
January 1, 2003 (instead of December 31, 2005) were as follows (dollars in
millions):
|
|
|
2005
|
|
2004
|
|
|
Liability
for asset retirement obligations at beginning of period
|
|
$
|
43.1
|
|
$
|
33.1
|
|
|
Liability
for asset retirement obligations at end of period
|
|
46.6
|
|
43.1
|
|
|
|
|
|
|
|
|
|
12. Other Noncurrent Liabilities
Other noncurrent liabilities consisted of the following (dollars in
millions):
|
|
|
December 31,
|
|
|
|
|
2005
|
|
2004
|
|
|
Pension
liabilities
|
|
$
|
404.0
|
|
$
|
391.6
|
|
|
Other
postretirement benefits
|
|
129.9
|
|
89.9
|
|
|
Environmental
accruals
|
|
18.1
|
|
27.4
|
|
|
Notes
payable to affiliates
|
|
—
|
|
29.9
|
|
|
Restructuring,
impairment and plant closing costs
|
|
23.1
|
|
30.9
|
|
|
Fair
value of interest derivatives
|
|
—
|
|
8.3
|
|
|
Asset
retirement obligation
|
|
46.6
|
|
7.2
|
|
|
Other
noncurrent liabilities
|
|
148.3
|
|
127.1
|
|
|
Total
|
|
$
|
770.0
|
|
$
|
712.3
|
|
F-23
13. Securitization of Accounts Receivable
Under our A/R Securitization Program, we grant an
undivided interest in certain of our trade receivables to a qualified
off-balance sheet entity (the “Receivables Trust”) at a discount. This
undivided interest serves as security for the issuance of commercial paper and
medium-term notes by the Receivables Trust.
As of December 31, 2005 and 2004, the Receivables
Trust had approximately $192.2 million and $208.4 million, respectively, in
U.S. dollar equivalents in medium-term notes outstanding and approximately
$110.1 million in U.S. dollar equivalents and nil, respectively in commercial
paper outstanding. The medium-term notes have a scheduled maturity date of
September 15, 2006 with the scheduled amortization period commencing June 30,
2005. Our commercial paper facility provides for the issuance of both euro- and
U.S. dollar-denominated commercial paper up to a U.S. dollar equivalent of $175
million of which $125 million is committed through June 30, 2007 and $50
million is committed through September 30, 2006. Our A/R Securitization Program
is currently our cheapest form of borrowing within our capital structure. As of
December 31, 2005, the weighted average interest rate for the medium term notes
and commercial paper combined was approximately 3.5%.
As of December 31, 2005 and 2004, our retained
interest in receivables (including servicing assets) subject to the program was
approximately $164 million and $328 million, respectively. The value of the
retained interest is subject to credit and interest rate risk. For the years
ended December 31, 2005, 2004 and 2003, new sales of accounts receivable sold
into the program totaled approximately $5,585 million, $5,071 million and $4,132
million, respectively, and cash collections from receivables sold into the
program that were reinvested totaled $5,589 million, $5,017 million and $4,136
million, respectively. Servicing fees received during the year ended December
31, 2005, 2004 and 2003 were approximately $6 million, $6 million and $5
million, respectively.
We incur losses on the A/R Securitization Program for
the discount on receivables sold into the program and fees and expenses
associated with the program. For the years ended December 31, 2005, December
31, 2004 and December 31, 2003, losses on the A/R Securitization Program were
$10.7 million, $15.6 million and $32.4 million, respectively. We also retain
responsibility for the economic gains and losses on forward contracts mandated
by the terms of the program to hedge the currency exposures on the collateral
supporting the off-balance sheet debt issued. Gains and losses on forward
contracts included as a component of the loss on the A/R Securitization Program
were nil, a loss of $2.4 million and a loss of $24.6 million for the years
ended December 31, 2005, 2004 and 2003, respectively. As of each of December
31, 2005 and December 31, 2004, the fair value of the open forward currency
contracts was nil.
The key economic assumptions used in valuing the
residual interest are presented below:
|
|
|
December 31,
|
|
|
|
|
2005
|
|
2004
|
|
|
Weighted average
life (in days)
|
|
35 to 40
|
|
35 to 40
|
|
|
Credit losses
(annual rate)
|
|
Less than 1%
|
|
Less than 1%
|
|
|
Discount rate
(weighted average life)
|
|
Less than 1%
|
|
Less than 1%
|
|
A 10% and 20% adverse change in any of the key
economic assumptions would not have a material impact on the fair value of the
retained interest. Total receivables over 60 days past due as of December 31,
2005 and 2004 were $22.5 million and $12.1 million, respectively.
14. Long-Term Debt
Long-term
debt outstanding as of December 31, 2005 and 2004 was as follows (dollars
in millions):
|
|
|
December 31,
|
|
|
|
|
2005
|
|
2004
|
|
|
New
Credit Facilities:
|
|
|
|
|
|
|
Term
Loan B
|
|
$
|
2,099.3
|
|
$
|
—
|
|
|
Former
HI Credit Facilities:
|
|
|
|
|
|
|
Term
Loan B
|
|
—
|
|
1,314.1
|
|
|
Former
HLLC Credit Facilities:
|
|
|
|
|
|
|
Term
Loan B
|
|
—
|
|
715.0
|
|
|
Revolving
Facility
|
|
—
|
|
125.0
|
|
|
2010
Secured Notes
|
|
293.6
|
|
451.1
|
|
|
2009
Senior Notes
|
|
454.7
|
|
456.0
|
|
|
2011
Senior Floating Rate Notes
|
|
100.0
|
|
100.0
|
|
|
2012
Senior Fixed Rate Notes
|
|
198.0
|
|
300.0
|
|
|
Subordinated
Notes
|
|
1,145.2
|
|
1,242.0
|
|
|
Former
HLLC Subordinated Notes
|
|
—
|
|
59.3
|
|
|
Huntsman
Specialty Subordinated Note
|
|
—
|
|
101.2
|
|
|
Subordinated
note-affiliate
|
|
—
|
|
40.9
|
|
|
HIH
Senior Discount Notes
|
|
—
|
|
494.7
|
|
|
HIH
Senior Subordinated Discount Notes
|
|
—
|
|
413.7
|
|
|
Australian
Credit Facilities
|
|
63.8
|
|
59.2
|
|
|
HPS
(China) debt
|
|
42.6
|
|
10.4
|
|
|
AdMat
Senior Secured Notes
|
|
—
|
|
348.6
|
|
|
Other
|
|
60.7
|
|
60.5
|
|
|
Total
debt
|
|
$
|
4,457.9
|
|
$
|
6,291.7
|
|
|
|
|
|
|
|
|
|
Current
portion
|
|
$
|
44.6
|
|
$
|
37.5
|
|
|
Long-term
portion
|
|
4,413.3
|
|
5,799.6
|
|
|
Long-term
debt - affiliate
|
|
—
|
|
454.6
|
|
|
Total
debt
|
|
$
|
4,457.9
|
|
$
|
6,291.7
|
|
|
|
|
|
|
|
|
|
|
|
During 2005, Huntsman
Corporation completed a series of transactions designed to simplify its
consolidated financing and public reporting structure, to reduce its cost of
borrowings and to facilitate other organizational efficiencies. On
February 16, 2005, Huntsman Corporation completed its initial public
offering of common and mandatory preferred stock that resulted in approximately
$1.5 billion in net proceeds, substantially all of which were used to repay
indebtedness. On August 16, 2005, we completed the HLLC Merger and on
December 20, 2005 we completed the AdMat Minority Interest Transaction. As a
result of these transactions, we now operate all of Huntsman Corporation’s
businesses.
F-24
Credit
Facilities
On August 16, 2005,
in connection with the HLLC Merger, Huntsman
Corporation repaid our senior secured credit facilities, Huntsman LLC’s senior
secured credit facilities and a subordinated note (the “Huntsman Specialty
Subordinated Note) with available cash and with the proceeds of our new senior
credit facility (the “Senior Credit Facilities”). On December 20, 2005, in
connection with the AdMat Minority Interest Transaction, we increased the U.S.
dollar term loan B under the Senior Credit Facilities by $350 million. On each
of September 19, 2005 and December 30, 2005, we voluntarily prepaid
approximately $50 million in U.S. dollar equivalents on term loan B under the
Senior Credit Facilities. As of December 31, 2005, the Senior Credit Facilities
consisted of (i) a $650 million
revolving facility (the “Revolving Facility”), (ii) a $1,986.5 million
term loan B facility (the “Dollar Term Loan”), and (iii) a €95.3 million
(approximately $113 million) euro term loan B facility (the “Euro Term Loan,”
and collectively with the Dollar Term Loan, the “Term Loans”).
As of December 31, 2005,
there were no borrowings outstanding under the Revolving Facility. At our
option, the Revolving Facility bears interest at a rate equal to: (i) a LIBOR-based eurocurrency rate plus an
applicable margin ranging between 1.25% and 1.75% depending upon the most recent
leverage ratio, or (ii) a prime-based rate plus an applicable margin ranging
between 0.25% and 0.75% depending upon the most recent leverage ratio. As of
December 31, 2005, borrowings under the Revolving Facility bear interest at
LIBOR plus 1.75%. The Revolving Facility matures in 2010; provided that the
maturity of the Revolving Facility will accelerate if we do not repay all but
$100 million of our outstanding debt securities at least three months prior to
the maturity of those securities. As of December 31, 2005, we had $32.5 million
in U.S. dollar equivalents of letters of credit and bank guarantees issued and
outstanding under the Revolving Facility.
At our option, the Term
Loans bear interest at a rate equal to:
(i) a LIBOR-based eurocurrency rate plus an applicable margin ranging
between 1.50% and 2.00% depending upon the loan currency and the most recent
leverage ratio, or (ii) a prime-based rate plus an applicable margin ranging
between 0.50% and 0.75% depending upon the loan currency and the most recent
leverage ratio. As of December 31, 2005, borrowings under the Dollar Term Loan
bear interest at LIBOR plus 1.75% and borrowings under the Euro Term Loan bear
interest at LIBOR plus 2.00%. Each of the Dollar Term Loan and the Euro Term
Loan matures in 2012; provided that the maturity of the Term Loans will
accelerate if we do not repay all but $100 million of our outstanding debt
securities at least three months prior to the maturity of those securities. The
Dollar Term Loan and the Euro Term Loan each require amortization payments of
1% annually.
As of December 31, 2005,
the weighted average interest rate on the Senior Credit Facilities was
approximately 6.0%, excluding the impact of interest rate hedges.
Our obligations under the
Senior Credit Facilities are guaranteed by substantially all of our domestic
subsidiaries and certain of our foreign subsidiaries (the “Guarantors”) and are
secured by a first priority lien (generally shared with the holders of the 2010
Secured Notes (as defined below)) on substantially all of our domestic
property, plant and equipment, the stock of all of our material domestic
subsidiaries and certain foreign subsidiaries, and pledges of intercompany
notes between our various subsidiaries.
The credit agreements
governing the Senior Credit Facilities contain financial covenants typical for
these types of agreements, including a minimum interest coverage ratio, a
maximum debt-to-EBITDA ratio and a limit on capital expenditures. The credit
agreements also contain customary restrictions on our ability to incur liens,
incur additional debt, merge or sell assets, pay dividends, prepay other
indebtedness, make investments or engage in transactions with affiliates, and
other customary restrictions and default provisions.
Secured Notes
On August 16, 2005, in
connection with the HLLC Merger, we entered into supplemental indentures under
which we assumed the obligations of Huntsman LLC under its outstanding 11.625%
senior secured notes due 2010 (the “2010 Secured Notes”). As of December 31,
2005, we had outstanding $296.0 million aggregate principal amount ($293.6
million book
F-25
value and $455.4 million
original aggregate principal amount) of the 2010 Secured Notes, which are redeemable
after October 15, 2007 at 105.813% of the principal amount thereof, declining
ratably to par on and after October 15, 2009. In connection with Huntsman
Corporation’s initial public offering of common and preferred stock, we used
proceeds contributed to us to redeem $159.4 million of aggregate principal
amount of the 2010 Secured Notes. Interest on the 2010 Secured Notes is payable
semiannually in April and October of each year. The 2010 Secured Notes are
secured by a first priority lien on all collateral securing the Senior Credit
Facilities as described above (other than capital stock of our subsidiaries),
shared equally with the lenders on the Senior Credit Facilities, subject to
certain intercreditor arrangements.
The 2010 Secured Notes
contain covenants relating to the incurrence of debt and limitations on
distributions, asset sales and affiliate transactions and are guaranteed by the
Guarantors. The indentures governing the 2010 Secured Notes also contain change
of control provisions requiring us to offer to repurchase the notes upon a
change of control.
On December 20, 2005, in
connection with the AdMat Minority Interest Transaction, we redeemed all of AdMat’s outstanding
$250 million 11% senior secured fixed rate notes due 2010 and paid $35.6 million
in call premiums. Also in 2005, we redeemed all of AdMat’s $100.0 million
secured floating rate notes due 2008 and paid $6.0 million in call premiums.
The $250 million of AdMat secured fixed rate notes bore a per annum fixed
rate of interest of 11%, and the AdMat secured floating rate notes bore
interest at a rate per annum equal to LIBOR plus 8.0%, subject to a floor with
respect to LIBOR of 2.0%. The AdMat floating rate notes were issued with an
original issue discount of 2.0%.
Senior Notes
As of December 31, 2005,
we had outstanding $450.0 million aggregate principal amount ($455.0 million
book value) 9.875% senior notes due 2009 that were issued at a premium (the “2009
Senior Notes”). The 2009 Senior Notes are unsecured obligations. Interest on
the 2009 Senior Notes is payable semiannually in March and September and these
notes are redeemable after March 1, 2006 at 104.937% of the original
aggregate principal amount thereof, declining ratably to par on and after
March 1, 2008.
As of December 31, 2005,
we had outstanding $198.0 million ($300 million original aggregate principal
amount) of 11.5% senior unsecured fixed
rate notes due 2012 (the “2012 Senior Fixed Rate Notes”) and $100.0 million
senior unsecured floating rate notes due 2011 (the “2011 Senior Floating Rate Notes”). These
notes were previously obligations of Huntsman LLC. In connection with the HLLC
Merger, on August 16, 2005, we entered into supplemental indentures under which
we assumed the obligations of the 2012 Senior Fixed Rate Notes and the 2011
Senior Floating Rate Notes. In connection with Huntsman Corporation’s initial
public offering of common and preferred stock, we used proceeds contributed to
us to repay $102.0 million of aggregate principal amount of the 2012 Senior
Fixed Rate Notes. Interest on the 2012 Senior Fixed Rate Notes is payable
semiannually in January and July of each year. Interest on the 2011 Senior
Floating Rate Notes is at LIBOR plus 7.25 % (11.4% as of December 31, 2005) and
is payable quarterly in January, April, July and October of each year. The 2012
Senior Fixed Rate Notes are redeemable after July 15, 2008 at 105.75% of the
principal amount thereof, declining ratably to par on and after July 15, 2010.
The 2011 Senior Floating Rate Notes are redeemable after July 15, 2006 at
104.0% of the principal amount thereof, declining ratably to par on and after
July 15, 2008. At any time prior to July 15, 2007, we may redeem up to 40% of
the original aggregate principal amount of the 2012 Senior Fixed Rate Notes at
a redemption price of 111.5% with proceeds of a qualified equity offering. At
any time prior to July 15, 2006, we may redeem up to 40% of the original
aggregate principal amount of the 2011 Senior Floating Rate Notes with the
proceeds of a qualified equity offering at a redemption price equal to the par
value plus LIBOR plus 7.25%.
The indentures governing
the 2009 Senior Notes, the 2012 Senior Fixed Rate Notes and the 2011 Senior
Floating Rate Notes contain covenants, among other things, relating to the
incurrence of debt and limitations on distributions, asset sales and affiliate
transactions and are guaranteed by the Guarantors. The indentures governing
these notes also contain change of control provisions requiring us to offer to
repurchase the notes upon a change of control.
Subordinated
Notes
As of December 31, 2005, we
had outstanding $175 million 7.375% senior subordinated notes due 2015 and
€135 million ($159.8 million) 7.5% senior subordinated notes due 2015
(collectively, the “2015 Subordinated Notes”). The 2015 Subordinated Notes are
redeemable on or after January 1, 2010 at 103.688% and 103.750%,
respectively, of the principal amount thereof, declining ratably to par on and
after January 1, 2013. In addition, at any time prior to January 1, 2008,
we may redeem up to 40% of the original aggregate principal amount of the
$175 million and €135 million 2015 Subordinated Notes at
redemption prices of 107.375% and 107.5%, plus accrued and unpaid interest,
respectively, with the proceeds of a qualified equity offering. Under the terms
of a registration rights agreement among our Company, the Guarantors and the
initial purchasers of the 2015 Subordinated Notes, we were required to complete
an exchange offer for the 2015 Subordinated Notes on or before September 11,
2005. Under the terms of the registration rights agreement, because we did not
complete
F-26
the exchange offer by
this date, we are required to pay additional interest on the 2015 Subordinated
Notes at a rate of 0.25% per year for the first 90-day period following this
date, and this rate increases by an additional 0.25% for each subsequent 90-day
period, up to a maximum of 1.0%. As of December 31, 2005, we were paying an
additional 0.50% on the 2015 Subordinated Notes.
As of December 31, 2005, we
also had outstanding $366.1 million ($600 million original aggregate principal
amount) and €372.0 million ($440.4 million) (€450 million original aggregate
principal amount) 10.125% senior subordinated notes due 2009 (the “2009
Subordinated Notes” and, together with the 2015 Subordinated Notes, the “Subordinated
Notes”). As of December 31, 2005, the 2009 Subordinated Notes have an
unamortized premium of $3.8 million and are redeemable at 103.375% of the
principal amount thereof, which declines to 101.688% on July 1, 2006 and to par
on and after July 1, 2007.
As of December 31, 2005, we
had outstanding a combined total of $541.1 million and €507.0 million
($600.3 million) Subordinated Notes, plus $3.8 million of unamortized
premium. The Subordinated Notes are unsecured and interest is payable
semiannually in January and July of each year.
The Subordinated Notes
contain, among other things, covenants relating to the incurrence of debt and
limitations on distributions, asset sales and affiliate transactions and are
guaranteed by the Guarantors. The indentures governing these notes also contain
change of control provisions requiring us to offer to repurchase the notes upon
a change of control.
Immediately prior to the
HLLC Merger, we funded the redemption of Huntsman LLC’s outstanding 9.5% senior
subordinated notes due 2007 and Huntsman LLC’s senior subordinated floating
rate notes due 2007, which together had an aggregate outstanding principal
amount of approximately $59.3 million. The redemption was completed on
September 1, 2005.
On August 16, 2005, in
connection with the HLLC Merger, we repaid, in full, the Huntsman Specialty
Subordinated Note which had an aggregate principal amount of $106.6 million and
bore interest at 7.0%.
Senior Discount
Notes
On June 30, 1999,
HIH issued senior discount notes (“HIH Senior Discount Notes”) and senior
subordinated discount notes (the “HIH Senior Subordinated Discount Notes” and,
collectively with the HIH Senior Discount Notes, the “HIH Discount Notes”) to
ICI with initial stated values of $242.7 million and $265.3 million,
respectively. The HIH Discount Notes were due December 31, 2009. Prior to
redemption, interest on the HIH Senior Discount Notes and the HIH Senior
Subordinated Discount Notes accrued at 13.375% and 13.125%, respectively, per
annum and was paid in kind. During the first quarter of 2005, we redeemed, in
full, $505.6 million of accreted value of the HIH Senior Discount Notes
and paid call premiums of approximately $33.8 million. In order to make
this redemption, we used proceeds contributed to us from Huntsman Corporation’s
initial public offering in the amount of $504.4 million and used
$35.0 million in cash. In addition, on February 28, 2005, in connection
with Huntsman Corporation’s initial public offering, HMP contributed the Senior
Subordinated Discount Notes at an accreted value of $422.8 million to us in
exchange for equity.
Other Debt
We maintain a
$25.0 million multicurrency overdraft facility used for the working
capital needs for our European subsidiaries (the “European Overdraft Facility”).
As of December 31, 2005 and 2004, there were no borrowings outstanding under
the European Overdraft Facility.
HPS, one of our Chinese
MDI joint ventures and our consolidated affiliate, has obtained secured loans
for the construction of MDI production facilities near Shanghai, China. This
debt consists of various committed loans in the aggregate amount of
approximately $121 million. As of December 31, 2005, HPS had
$19.5 million outstanding in U.S. dollar borrowings and 186 million
in RMB borrowings ($23.1 million) under these facilities. The interest
rate on these facilities is LIBOR plus 0.48% for U.S. dollar borrowings and 90%
of the Peoples Bank of China rate for RMB borrowings. As of December 31, 2005,
the interest rate was approximately 5.0% for U.S. dollar borrowings and 5.5%
for RMB borrowings. The loans are secured by substantially all the assets of
HPS and will be repaid in 16 semiannual installments beginning no later than
June 30, 2007. The financing is non-recourse to us but is guaranteed
during the construction phase by affiliates of HPS, including Huntsman
Corporation. Huntsman Corporation has guaranteed 70% of any amount due and
unpaid by HPS under the loans described above (except for the VAT facility,
which is not guaranteed). Huntsman Corporation’s guarantees remain in effect
until HPS has commenced production of at least 70% of capacity for at least 30
days and achieved a debt service cost ratio of at least 1.5:1.
F-27
Our Chinese MDI joint
ventures are unrestricted subsidiaries under the Senior Credit Facilities and
under the indentures governing our outstanding notes. HPS is expected to begin
operations at the beginning of the third quarter of 2006.
Our Australian
subsidiaries maintain credit facilities that had an aggregate outstanding
balance of A$87.2 million ($63.8 million) as of December 31, 2005. These
facilities are non-recourse to us and bear interest at the Australian index
rate plus a margin of 2.9%. As of December 31, 2005, the interest rate for
these facilities was 8.6%.
We finance certain of our
insurance premiums. As of December 31, 2005, we had $20.6 million in insurance
premium financing, all of which is due in the next 12 months.
On February 16, 2005, we paid in full a 15% note
payable to an affiliated entity in the amount of $41.6 million.
Compliance with Covenants
Our management believes
that we are in compliance with the covenants contained in the agreements
governing the Senior Credit Facilities, the A/R Securitization Program and the
indentures governing our notes.
Maturities
The scheduled maturities of our debt by year as of
December 31, 2005 are as follows (dollars in millions):
|
Year ending December 31:
|
|
|
|
|
2006
|
|
$
|
44.6
|
|
|
2007
|
|
84.0
|
|
|
2008
|
|
23.9
|
|
|
2009
|
|
1,289.2
|
|
|
2010
|
|
317.3
|
|
|
Later
Years
|
|
2,698.9
|
|
|
|
|
$
|
4,457.9
|
|
We also have lease
obligations accounted for as capital leases which are included in other
long-term debt The scheduled maturities
of our commitments under capital leases are as follows (dollars in millions):
|
Year ending December 31:
|
|
|
|
|
2006
|
|
$
|
2.3
|
|
|
2007
|
|
2.1
|
|
|
2008
|
|
2.4
|
|
|
2009
|
|
2.7
|
|
|
2010
|
|
2.3
|
|
|
Later
Years
|
|
0.8
|
|
|
Total
minimum payments
|
|
12.6
|
|
|
Less:
amounts representing interest
|
|
(4.0
|
)
|
|
Present
value of minimum lease payments
|
|
8.6
|
|
|
Less:
current portion of capital leases
|
|
(1.9
|
)
|
|
Long-term
portion of capital leases
|
|
$
|
6.7
|
|
|
|
|
|
|
|
In connection with
repayment of indebtedness, we recorded a loss on early extinguishment of debt
for the years ended December 31, 2005 and 2004 of $167.3 million and $25.6
million, respectively.
15. Fair Value of Financial Instruments
|
|
|
December 31,
|
|
|
|
|
2005
|
|
2004
|
|
|
|
|
Carrying
Amount
|
|
Estimated
Fair Value
|
|
Carrying
Amount
|
|
Estimated
Fair Value
|
|
|
|
|
(Dollars in Millions)
|
|
|
Non-qualified
employee benefit plan investments
|
|
$
|
5.4
|
|
$
|
5.4
|
|
$
|
4.3
|
|
$
|
4.3
|
|
|
Long-term
debt
|
|
4,457.9
|
|
4,593.2
|
|
6,291.7
|
|
6,645.7
|
|
|
Notes
receivable from affiliates
|
|
3.0
|
|
3.0
|
|
23.6
|
|
23.6
|
|
|
|
|
|
|
|
|
|
|
|
|
|
|
|
F-28
Interest rates that are currently available to
us for issuance of debt with similar terms and remaining maturities are used to
estimate fair value for debt issues that are not quoted on an exchange.
The fair value of government securities and non-qualified employee
benefit plan investments are estimated using prevailing market prices.
The carrying amount reported in the balance
sheets for cash and cash equivalents, accounts receivable, and accounts payable
approximates fair value because of the immediate or short-term maturity of
these financial instruments.
The fair value estimates
presented herein are based on pertinent information available to management as
of December 31, 2005 and 2004. Although management is not aware of any
factors that would significantly affect the estimated fair value amounts, such
amounts have not been comprehensively revalued for purposes of these financial
statements since December 31, 2005, and current estimates of fair value may
differ significantly from the amounts presented herein.
16. Derivative Instruments and Hedging Activities
We are exposed to market risks, such as changes in
interest rates, foreign exchange rates and commodity pricing risks. From time
to time, we enter into transactions, including transactions involving
derivative instruments, to manage certain of these exposures. We manage
interest rate exposure through a program designed to reduce the impact of
fluctuations in variable interest rates and to meet the requirements of certain
credit agreements.
All derivatives, whether designed in hedging
relationships or not, are recorded on the balance sheet at fair value. If the
derivative is designated as a fair-value hedge, the changes in the fair value
of the derivative and the hedged items are recognized in earnings. If the
derivative is designated as a cash-flow hedge, changes in the fair value of the
derivative are recorded in accumulated other comprehensive (loss) income, to
the extent effective, and will be recognized in the income statement when the
hedged item affects earnings. We perform effectiveness assessments in order to
use hedge accounting at each reporting period. For a derivative that does not
qualify as a hedge, changes in fair value are recognized in earnings.
We have also participated in some derivatives that
were classified as non-designated derivative instruments and we hedge our net
investment in certain European operations. Changes in the fair value of any
non-designated derivative instruments and any ineffectiveness in cash flow
hedges are reported in current period earnings. Changes in the fair value of
the hedge in the net investment of certain European operations are recorded in
accumulated other comprehensive (loss) income.
Interest Rate Hedging
Through our borrowing activities, we are exposed to
interest rate risk. Such risk arises due to the structure of our debt
portfolio, including the duration of the portfolio and the mix of fixed and
F-29
floating interest rates. Actions taken to reduce interest rate risk
include managing the mix and rate characteristics of various interest bearing
liabilities as well as entering into interest rate swaps, collars and options.
We may purchase both interest rate swaps and interest
rate collars to reduce the impact of changes in interest rates on our
floating-rate long-term debt. Under interest rate swaps, we agree with other
parties to exchange, at specified intervals, the difference between fixed-rate
and floating-rate interest amounts calculated by reference to an agreed
notional principal amount. When we enter into collars, the collars entitle us
to receive from the counterparties (major banks) the amounts, if any, by which
our interest payments on certain of our floating-rate borrowings exceed a
certain rate, and require us to pay to the counterparties (major banks) the amount,
if any, by which our interest payments on certain of our floating-rate
borrowings are less than a certain rate.
Interest rate contracts were recorded as a component
of other non-current liabilities as of December 31, 2005 and 2004. The
effective portion of the changes in the fair value of the swaps are recorded in
accumulated other comprehensive loss, with any ineffectiveness recorded in
interest expense.
As of December 31, 2005 and 2004, we had entered into
various types of interest rate contracts to manage our interest risk on our
long-term debt as indicated below (dollars in millions):
|
|
|
2005
|
|
2004
|
|
|
Notional amount
|
|
$
|
83.3
|
|
$
|
184.3
|
|
|
Fair value
|
|
|
|
|
|
|
Cash flow hedges
|
|
—
|
|
(2.0
|
)
|
|
Non-designated
derivatives
|
|
0.4
|
|
(1.2
|
)
|
|
Maturity
|
|
2006-2010
|
|
2005-2007
|
|
|
|
|
|
|
|
|
|
For the year ended December 31, 2005 and 2004, the
changes in accumulated other comprehensive (loss) income associated with cash
flow hedging activities is indicated below:
|
|
|
2005
|
|
2004
|
|
|
|
|
|
|
|
|
|
Balance at
January 1
|
|
$
|
5.2
|
|
$
|
15.7
|
|
|
Current period
change in fair value
|
|
(1.9
|
)
|
(10.9
|
)
|
|
Reclassifications
to earnings
|
|
(1.2
|
)
|
0.4
|
|
|
Balance at
December 31
|
|
$
|
2.1
|
|
$
|
5.2
|
|
|
|
|
|
|
|
|
|
|
|
During the next twelve months ending December 31,
2006, approximately $2.0 million is expected to be reclassified from
accumulated other comprehensive loss to earnings. The actual amount that will
be reclassified to earnings over the next twelve months may vary from this
amount due to changing market conditions.
We are exposed to credit losses in the event of
nonperformance by a counterparty to the derivative financial instruments. We
anticipate, however, that the counterparties will be able to fully satisfy obligations
under the contracts. Market risk arises from changes in interest rates.
Commodity Price Hedging
As of December 31, 2005, there were no cash flow
commodity price hedging contracts in place. As of December 31, 2004, there was
$0.1 million included in other current assets and accrued liabilities related
to cash flow commodity price hedging contracts recorded in other current assets
and other comprehensive income.
F-30
As of December 31, 2005, commodity price hedging
contracts designated as fair value hedges are included in the balance sheet as
$0.4 million in other current liabilities and as a $0.8 million increase in inventory.
As of December 31, 2004, commodity price hedging contracts designated as fair
value hedges are included in the balance sheet as $1.5 million in other current
assets and a $1.8 million decrease in inventory.
Commodity price contracts not designated as hedges are
reflected in the balance sheet as $2.0 million and $0.2 million in other
current assets and liabilities, respectively, as of December 31, 2005 and as
$5.6 million and $1.8 million in other current assets and liabilities,
respectively, as of December 31, 2004.
During the year ended December 31, 2005 we recorded a
decrease of $2.2 million and for the years ended December 31, 2004 and 2003, we
recorded an increase of $2.4 million and $1.2 million, respectively, related to
changes in cost of goods sold related to net gains and losses from settled
contracts, net gains and losses in fair value price hedges, and the change in
fair value on commodity price hedging contracts not designated as hedges.
Foreign Currency Rate Hedging
We may enter into foreign currency derivative
instruments to minimize the short-term impact of movements in foreign currency
rates. These contracts are not designated as hedges for financial reporting
purposes and are recorded at fair value. As of December 31, 2005 and 2004 and
for the year ended December 31, 2005, 2004 and 2003 the fair value, change in
fair value, and realized gains (losses) of outstanding foreign currency rate
hedging contracts was not significant.
Net Investment Hedging
As of December 31, 2005, excluding the cross-currency
interest rate swaps discussed below, we have designated approximately €330
million of our euro-denominated debt as a hedge of our net investments in
foreign subsidiaries. Currency effects of net investment hedges produced a gain
of $55.0 million, a loss of $51.5 million and a loss of $93.6 million in other
comprehensive income (loss) (foreign currency translation adjustments) for the
years ended December 31, 2005, 2004, and 2003, respectively. As of December 31,
2005 and 2004, there was a cumulative net loss of approximately $133.5 million
and $188.5 million, respectively.
We have outstanding cross-currency interest rate swaps
of fixed rate debt. We entered into these swaps with various financial
institutions in order to more effectively hedge our overall underlying euro long-term
net asset and euro cash flow exposures. In the aggregate, we agreed to swap
$175 million of 7.375% fixed rate debt for €132.4 million of 6.63% fixed rate
debt. As a result, we will pay fixed rate interest at an annual rate of 6.63%
on €132.4 million of principal and will receive fixed rate interest at an
annual rate of 7.375% on $175 million of principal through January 1, 2010. At
maturity on January 1, 2010, we are required to pay principal of €132.4 million
and will receive principal of $175 million. Interest installments are paid
semiannually on January 1 and July 1 of each year beginning July 1, 2005
through maturity. The swap is designated as a net investment hedge. As of December
31, 2005, the fair value of this swap was $15 million and recorded in the
balance sheet in other noncurrent assets. The fair value as of December 31,
2004 was a liability of $8 million recorded in other noncurrent liabilities.
In another swap transaction, we agreed to swap $31.3
million of 11.0% fixed rate debt for €25.0 million of 9.4% fixed rate debt. As
a result, we will pay fixed rate interest at an annual rate of 9.4% on €25.0
million of principal and will receive fixed rate interest of 11.0% on $31.3
million of principal through July 15, 2007. At maturity, July 15, 2007, we are
required to pay principal of €25.0 million and will receive principal of $31.3
million. Interest installments are paid semiannually on January 15 and July 15
of each year, beginning July 15, 2005 through maturity. The swap is not
F-31
designated as a hedge for reporting purposes. As of December 31, 2005,
the fair value of this was $2 million and recorded in other noncurrent assets
in the balance sheet. For the year ended December 31, 2005, this swap decreased
interest expense by $0.3 million.
Foreign currency transaction gains and losses on
intercompany loans that are not designated as Permanent Loans (as defined
below) are recorded in earnings. Foreign currency transaction gains and losses
on intercompany loans that we may designate as permanent because they are not
expected to be repaid in the foreseeable future (“Permanent Loans”) are
recorded in other comprehensive income. From time to time, we review such
designation of intercompany loans, and, during the year ended December 31,
2005, we have increased the amount of our Permanent Loans.
17. Employee Benefit Plans
Defined Benefit Pension and Other
Postretirement Benefit Plans
Our
employees participate in a trusteed, non-contributory defined benefit pension
plan (the “Plan”) that covers substantially all of our full-time U.S.
employees. Effective July 1, 2004, the Plan formula for employees not
covered by a collective bargaining agreement was converted to a cash balance plan.
For represented employees, participation in the cash balance plan is subject to
the terms of negotiated contracts.
Between July 1, 2004 and September 1, 2005, thirteen collectively
bargained units had negotiated to participate. For participating employees,
benefits accrued under the prior formula were converted to opening cash balance
accounts. The new cash balance benefit formula provides annual pay credits from
4% to 12% of eligible pay, depending on age and service, plus accrued interest.
Participants in the plan on July 1, 2004 may be eligible for additional
annual pay credits from 1% to 8%, depending on their age and service as of that
date, for up to five years. The conversion to the cash balance plan did not
have a significant impact on ongoing pension expense.
We
sponsor defined benefit pension plans in a number of countries outside of the U.S. The availability of these plans, and their
specific design provisions, are consistent with local competitive practices and
regulations.
We
also sponsor two unfunded postretirement benefit plans other than pensions,
which provide medical and life insurance benefits.
In May 2004, the FASB issued FASB Staff Position (“FSP”)
No. 106-2, “Accounting and Disclosure
Requirements Related to the Medicare Prescription Drug, Improvement and
Modernization Act of 2003.” The FSP provides accounting guidance for
the effects of the Medicare Prescription Drug, Improvement and Modernization
Act of 2003 (the “Act”) to a sponsor of a postretirement health care plan. On
July 1, 2004 we adopted the provisions of FSP No. 106-2. The adoption
of FSP No. 106-2 reduced our non-pension postretirement accumulated
benefit obligation by approximately $4.7 million, which has been
recognized as a change in our unrecognized actuarial gain/loss. The adoption of
FSP No. 106-2 reduced the net periodic postretirement benefit cost
recognized during the year ended December 31, 2004 by approximately
$0.5 million.
In 2005, we changed the measurement date of our pension and
postretirement benefit plans from December 31 to November 30. We believe the
one-month change of the measurement date is preferable because it provides us
more time to review the completeness and accuracy of the actuarial benefit
information which results in an improvement in our internal control procedures.
The effect of the change in measurement date on the respective obligations and
assets of the plan resulted in a cumulative effect of a change in accounting
principle credit, net of tax of $1.5 million, of $4.2 million recorded in
the year ended December 31, 2005. The
pro forma impact of changing this accounting policy is to reduce net loss by
approximately $0.2 million and $6.9 million, respectively for the years ended
December 31, 2004 and 2003.
The
following table sets forth the changes in funded status of the plans and the
amounts recognized in the consolidated balance sheets during 2005 and 2004
(dollars in millions). The measurement date of the plans was November 30 in
2005 and December 31 in 2004.
F-32
|
|
|
Defined Benefit Pension
Plans
|
|
Other Postretirement Benefit Plans
|
|
|
|
|
2005
|
|
2004
|
|
2005
|
|
2004
|
|
|
|
|
U.S. Plans
|
|
Non-U.S.
Plans
|
|
U.S. Plans
|
|
Non-U.S.
Plans
|
|
U.S. Plans
|
|
Non-U.S.
Plans
|
|
U.S. Plans
|
|
Non-U.S.
Plans
|
|
|
Change in benefit obligation
|
|
|
|
|
|
|
|
|
|
|
|
|
|
|
|
|
|
|
Benefit
obligation at beginning of year
|
|
$
|
489.5
|
|
$
|
2,020.7
|
|
$
|
483.2
|
|
$
|
1,658.3
|
|
$
|
126.9
|
|
$
|
4.3
|
|
$
|
140.8
|
|
$
|
4.2
|
|
|
Adjustment
due to change in
|
|
|
|
|
|
|
|
|
|
|
|
|
|
|
|
|
|
|
measurement
date
|
|
(2.1
|
)
|
(11.5
|
)
|
—
|
|
—
|
|
(0.2
|
)
|
—
|
|
—
|
|
—
|
|
|
Service
cost
|
|
30.6
|
|
48.3
|
|
19.0
|
|
45.1
|
|
4.1
|
|
—
|
|
3.3
|
|
—
|
|
|
Interest
cost
|
|
36.0
|
|
90.3
|
|
30.7
|
|
86.9
|
|
9.3
|
|
0.2
|
|
7.5
|
|
0.3
|
|
|
Participant
contributions
|
|
—
|
|
5.8
|
|
—
|
|
5.2
|
|
—
|
|
—
|
|
—
|
|
—
|
|
|
Plan
amendments
|
|
(21.4
|
)
|
(15.4
|
)
|
(58.8
|
)
|
(0.3
|
)
|
(8.3
|
)
|
—
|
|
—
|
|
—
|
|
|
Exchange
rate changes
|
|
—
|
|
(242.3
|
)
|
—
|
|
155.5
|
|
—
|
|
0.2
|
|
—
|
|
—
|
|
|
Divestitures/Acquisitions
|
|
—
|
|
0.3
|
|
—
|
|
—
|
|
—
|
|
—
|
|
—
|
|
—
|
|
|
Settlements/transfers
|
|
—
|
|
(2.7
|
)
|
|
|
(1.2
|
)
|
—
|
|
—
|
|
—
|
|
—
|
|
|
Other
|
|
—
|
|
(0.3
|
)
|
|
|
3.3
|
|
—
|
|
—
|
|
—
|
|
—
|
|
|
Curtailments
|
|
—
|
|
(2.6
|
)
|
|
|
(1.3
|
)
|
—
|
|
—
|
|
—
|
|
(0.1
|
)
|
|
Special
termination benefits
|
|
—
|
|
11.4
|
|
|
|
10.7
|
|
|
|
—
|
|
—
|
|
—
|
|
|
Actuarial
(gain)/loss
|
|
13.2
|
|
108.5
|
|
39.1
|
|
126.4
|
|
(0.4
|
)
|
0.4
|
|
(15.8
|
)
|
0.3
|
|
|
Consolidation
of Rubicon
|
|
116.4
|
|
—
|
|
—
|
|
—
|
|
34.2
|
|
—
|
|
—
|
|
—
|
|
|
Benefits
paid
|
|
(36.8
|
)
|
(69.3
|
)
|
(23.7
|
)
|
(67.9
|
)
|
(9.7
|
)
|
(0.3
|
)
|
(8.9
|
)
|
(0.4
|
)
|
|
Benefit
obligation at end of year
|
|
$
|
625.4
|
|
$
|
1,941.2
|
|
$
|
489.5
|
|
$
|
2,020.7
|
|
$
|
155.9
|
|
$
|
4.8
|
|
$
|
126.9
|
|
$
|
4.3
|
|
|
|
|
|
|
|
|
|
|
|
|
|
|
|
|
|
|
|
|
|
Change in plan assets
|
|
|
|
|
|
|
|
|
|
|
|
|
|
|
|
|
|
|
Fair
value of plan assets at beginning of year
|
|
$
|
297.9
|
|
$
|
1,607.4
|
|
$
|
257.8
|
|
$
|
1,345.1
|
|
$
|
—
|
|
$
|
—
|
|
$
|
—
|
|
$
|
—
|
|
|
Adjustment
due to change in
|
|
|
|
|
|
|
|
|
|
|
|
|
|
|
|
|
|
|
measurement
date
|
|
(8.8
|
)
|
(8.8
|
)
|
—
|
|
—
|
|
—
|
|
—
|
|
—
|
|
—
|
|
|
Actual
return on plan assets
|
|
36.5
|
|
236.1
|
|
34.9
|
|
149.3
|
|
—
|
|
—
|
|
—
|
|
—
|
|
|
Adjustments
to opening value
|
|
—
|
|
—
|
|
—
|
|
(4.3
|
)
|
—
|
|
—
|
|
—
|
|
—
|
|
|
Exchange
rate changes
|
|
—
|
|
(199.9
|
)
|
—
|
|
125.2
|
|
—
|
|
—
|
|
—
|
|
—
|
|
|
Divestitures/Acquisitions
|
|
—
|
|
0.2
|
|
—
|
|
—
|
|
—
|
|
—
|
|
—
|
|
—
|
|
|
Participant
contributions
|
|
—
|
|
5.8
|
|
—
|
|
5.2
|
|
—
|
|
—
|
|
—
|
|
—
|
|
|
Other
|
|
—
|
|
4.3
|
|
—
|
|
(2.3
|
)
|
—
|
|
—
|
|
—
|
|
—
|
|
|
Administrative
expenses
|
|
—
|
|
(1.3
|
)
|
—
|
|
(0.8
|
)
|
—
|
|
—
|
|
—
|
|
—
|
|
|
Company
contributions
|
|
50.8
|
|
55.8
|
|
28.9
|
|
59.0
|
|
9.7
|
|
0.3
|
|
8.9
|
|
0.4
|
|
|
Settlements/Transfers
|
|
—
|
|
(3.9
|
)
|
—
|
|
(1.1
|
)
|
|
|
|
|
|
|
|
|
|
Consolidation
of Rubicon
|
|
77.4
|
|
—
|
|
—
|
|
—
|
|
—
|
|
—
|
|
—
|
|
—
|
|
|
Benefits
paid
|
|
(36.8
|
)
|
(69.3
|
)
|
(23.7
|
)
|
(67.9
|
)
|
(9.7
|
)
|
(0.3
|
)
|
(8.9
|
)
|
(0.4
|
)
|
|
Fair
value of plan assets at end of year
|
|
$
|
417.0
|
|
$
|
1,626.4
|
|
$
|
297.9
|
|
$
|
1,607.4
|
|
$
|
—
|
|
$
|
—
|
|
$
|
—
|
|
$
|
—
|
|
|
|
|
|
|
|
|
|
|
|
|
|
|
|
|
|
|
|
|
|
Funded status
|
|
|
|
|
|
|
|
|
|
|
|
|
|
|
|
|
|
|
Funded
status
|
|
$
|
(208.4
|
)
|
$
|
(314.8
|
)
|
$
|
(191.6
|
)
|
$
|
(413.3
|
)
|
$
|
(155.9
|
)
|
$
|
(4.8
|
)
|
$
|
(126.9
|
)
|
$
|
(4.3
|
)
|
|
Unrecognized
net actuarial loss
|
|
158.0
|
|
446.4
|
|
119.6
|
|
552.2
|
|
55.4
|
|
1.4
|
|
57.8
|
|
1.1
|
|
|
Unrecognized
prior service cost
|
|
(68.4
|
)
|
(6.5
|
)
|
(52.3
|
)
|
5.7
|
|
(26.9
|
)
|
—
|
|
(17.8
|
)
|
—
|
|
|
Unrecognized
net transition obligation
|
|
2.8
|
|
2.4
|
|
3.9
|
|
3.2
|
|
—
|
|
0.2
|
|
—
|
|
0.2
|
|
|
Contributions
paid December 1 through December 31
|
|
3.3
|
|
3.7
|
|
—
|
|
—
|
|
0.7
|
|
—
|
|
—
|
|
—
|
|
|
Accrued
benefit cost
|
|
$
|
(112.7
|
)
|
$
|
131.2
|
|
$
|
(120.4
|
)
|
$
|
147.8
|
|
$
|
(126.7
|
)
|
$
|
(3.2
|
)
|
$
|
(86.9
|
)
|
$
|
(3.0
|
)
|
|
|
|
|
|
|
|
|
|
|
|
|
|
|
|
|
|
|
|
|
Amounts
recognized in balance sheet:
|
|
|
|
|
|
|
|
|
|
|
|
|
|
|
|
|
|
|
Accrued benefit
cost recognized in accrued liabilities and other noncurrent liabilities
|
|
$
|
(185.9
|
)
|
$
|
(239.9
|
)
|
$
|
(173.6
|
)
|
$
|
(241.1
|
)
|
$
|
(126.7
|
)
|
$
|
(3.2
|
)
|
$
|
(86.9
|
)
|
$
|
(3.0
|
)
|
|
Prepaid pension
cost
|
|
1.1
|
|
237.1
|
|
0.8
|
|
266.4
|
|
—
|
|
—
|
|
—
|
|
—
|
|
|
Intangible asset
|
|
3.7
|
|
3.7
|
|
4.1
|
|
4.5
|
|
—
|
|
—
|
|
—
|
|
—
|
|
|
Accumulated other
comprehensive income
|
|
68.4
|
|
130.3
|
|
48.3
|
|
118.0
|
|
—
|
|
—
|
|
—
|
|
—
|
|
|
Accrued benefit
cost
|
|
$
|
(112.7
|
)
|
$
|
131.2
|
|
$
|
(120.4
|
)
|
$
|
147.8
|
|
$
|
(126.7
|
)
|
$
|
(3.2
|
)
|
$
|
(86.9
|
)
|
$
|
(3.0
|
)
|
|
|
|
|
|
|
|
|
|
|
|
|
|
|
|
|
|
|
|
|
|
|
|
|
|
|
|
|
|
|
|
|
|
|
F-33
Components of the net periodic benefit costs for the years ended
December 31, 2005, 2004 and 2003 are as follows (dollars in millions):
|
|
|
Defined Benefit Pension Plans
|
|
|
|
|
U.S. plans
|
|
Non U.S. plans
|
|
|
|
|
2005
|
|
2004
|
|
2003
|
|
2005
|
|
2004
|
|
2003
|
|
|
|
|
|
|
|
|
|
|
|
|
|
|
|
|
|
Service
cost
|
|
$
|
30.6
|
|
$
|
19.0
|
|
$
|
10.7
|
|
$
|
48.3
|
|
$
|
45.1
|
|
$
|
38.8
|
|
|
Interest
cost
|
|
36.0
|
|
30.7
|
|
19.5
|
|
90.3
|
|
86.9
|
|
67.0
|
|
|
Expected
return on assets
|
|
(31.1
|
)
|
(22.1
|
)
|
(13.6
|
)
|
(105.8
|
)
|
(96.4
|
)
|
(70.4
|
)
|
|
Amortization
of transition obligation
|
|
1.1
|
|
1.1
|
|
0.7
|
|
0.7
|
|
0.7
|
|
0.6
|
|
|
Amortization
of prior service cost
|
|
(4.0
|
)
|
1.0
|
|
0.6
|
|
(1.2
|
)
|
0.5
|
|
0.6
|
|
|
Amortization
of actuarial loss
|
|
7.4
|
|
4.8
|
|
0.7
|
|
24.0
|
|
20.2
|
|
22.6
|
|
|
Curtailment
gain
|
|
—
|
|
—
|
|
—
|
|
(1.2
|
)
|
—
|
|
—
|
|
|
Settlement
loss
|
|
—
|
|
—
|
|
—
|
|
1.3
|
|
—
|
|
—
|
|
|
Special
termination benefits
|
|
—
|
|
—
|
|
—
|
|
11.4
|
|
4.7
|
|
10.5
|
|
|
Net
periodic benefit cost
|
|
$
|
40.0
|
|
$
|
34.5
|
|
$
|
18.6
|
|
$
|
67.8
|
|
$
|
61.7
|
|
$
|
69.7
|
|
|
|
|
Other Postretirement Benefit Plans
|
|
|
|
|
U.S. plans
|
|
Non U.S. plans
|
|
|
|
|
2005
|
|
2004
|
|
2003
|
|
2005
|
|
2004
|
|
2003
|
|
|
|
|
|
|
|
|
|
|
|
|
|
|
|
|
|
Service
cost
|
|
$
|
4.1
|
|
$
|
3.3
|
|
$
|
2.5
|
|
$
|
—
|
|
$
|
—
|
|
$
|
—
|
|
|
Interest
cost
|
|
9.3
|
|
7.5
|
|
5.9
|
|
0.2
|
|
0.3
|
|
0.2
|
|
|
Expected
return on assets
|
|
—
|
|
—
|
|
—
|
|
—
|
|
—
|
|
—
|
|
|
Amortization
of transition obligation
|
|
—
|
|
—
|
|
—
|
|
—
|
|
—
|
|
—
|
|
|
Amortization
of prior service cost
|
|
(2.4
|
)
|
(1.9
|
)
|
(0.3
|
)
|
—
|
|
—
|
|
—
|
|
|
Amortization
of actuarial loss
|
|
3.3
|
|
3.5
|
|
1.9
|
|
0.1
|
|
0.1
|
|
0.1
|
|
|
Net
periodic benefit cost
|
|
$
|
14.3
|
|
$
|
12.4
|
|
$
|
10.0
|
|
$
|
0.3
|
|
$
|
0.4
|
|
$
|
0.3
|
|
The following assumptions were used to determine the projected benefit
obligation at the measurement date and the net periodic pension cost for the
year:
|
|
|
Defined Benefit Pension Plans
|
|
|
|
|
U.S. plans
|
|
Non U.S. plans
|
|
|
|
|
2005
|
|
2004
|
|
2003
|
|
2005
|
|
2004
|
|
2003
|
|
|
Projected
benefit obligation:
|
|
|
|
|
|
|
|
|
|
|
|
|
|
|
Discount
rate
|
|
5.75
|
%
|
5.75
|
%
|
6.00
|
%
|
4.61
|
%
|
4.85
|
%
|
5.30
|
%
|
|
Rate
of compensation increase
|
|
3.90
|
%
|
4.00
|
%
|
4.00
|
%
|
3.33
|
%
|
3.65
|
%
|
3.51
|
%
|
|
|
|
|
|
|
|
|
|
|
|
|
|
|
|
|
Net
periodic pension cost:
|
|
|
|
|
|
|
|
|
|
|
|
|
|
|
Discount
rate
|
|
5.75
|
%
|
6.00
|
%
|
6.75
|
%
|
4.85
|
%
|
5.30
|
%
|
5.49
|
%
|
|
Rate
of compensation increase
|
|
4.00
|
%
|
4.00
|
%
|
4.00
|
%
|
3.65
|
%
|
3.51
|
%
|
3.76
|
%
|
|
Expected
return on plan assets
|
|
8.25
|
%
|
8.25
|
%
|
8.25
|
%
|
7.06
|
%
|
7.11
|
%
|
7.29
|
%
|
|
|
|
Other Postretirement Benefit Plans
|
|
|
|
|
U.S. plans
|
|
Non U.S. plans
|
|
|
|
|
2005
|
|
2004
|
|
2003
|
|
2005
|
|
2004
|
|
2003
|
|
|
Projected
benefit obligation:
|
|
|
|
|
|
|
|
|
|
|
|
|
|
|
Discount
rate
|
|
5.71
|
%
|
5.75
|
%
|
6.00
|
%
|
5.00
|
%
|
5.77
|
%
|
6.25
|
%
|
|
Rate
of compensation increase
|
|
3.90
|
%
|
4.00
|
%
|
4.00
|
%
|
3.33
|
%
|
3.65
|
%
|
3.51
|
%
|
|
|
|
|
|
|
|
|
|
|
|
|
|
|
|
|
Net
periodic pension cost:
|
|
|
|
|
|
|
|
|
|
|
|
|
|
|
Discount
rate
|
|
5.75
|
%
|
6.00
|
%
|
6.75
|
%
|
5.77
|
%
|
6.25
|
%
|
6.25
|
%
|
|
Rate
of compensation increase
|
|
4.00
|
%
|
4.00
|
%
|
4.00
|
%
|
3.65
|
%
|
3.51
|
%
|
3.76
|
%
|
F-34
The
projected benefit obligation, accumulated benefit obligation, and fair value of
plan assets for the defined benefit pension plans with accumulated benefit
obligations in excess of plan assets were as follows (dollars
in millions):
|
|
|
U.S. Plans
|
|
Non U.S. Plans
|
|
|
|
|
2005
|
|
2004
|
|
2005
|
|
2004
|
|
|
Projected
benefit obligation
|
|
$
|
625.4
|
|
$
|
489.9
|
|
$
|
1,430.5
|
|
$
|
1,415.9
|
|
|
Accumulated
benefit obligation
|
|
604.9
|
|
468.3
|
|
1,220.8
|
|
1,113.4
|
|
|
Fair
value of plan assets
|
|
417.0
|
|
297.9
|
|
1,089.6
|
|
998.7
|
|
|
|
|
|
|
|
|
|
|
|
|
|
|
|
Expected
future contributions and benefit payments are as follows for the U.S. and non
U.S. plans (dollars in millions):
|
|
|
|
|
Other Postretirement
|
|
|
|
|
Defined Benefit Pension Plans
|
|
Benefit Plans
|
|
|
2006 expected employer contributions:
|
|
|
|
|
|
|
To
plan trusts
|
|
$
|
100.4
|
|
$
|
13.1
|
|
|
To
plan participants
|
|
6.3
|
|
0.4
|
|
|
|
|
|
|
|
|
|
Expected benefit payments:
|
|
|
|
|
|
|
2006
|
|
$
|
98.2
|
|
$
|
13.1
|
|
|
2007
|
|
94.9
|
|
13.4
|
|
|
2008
|
|
99.4
|
|
13.4
|
|
|
2009
|
|
103.7
|
|
13.6
|
|
|
2010
|
|
107.9
|
|
13.7
|
|
|
2011-2015
|
|
606.9
|
|
71.4
|
|
|
|
|
|
|
|
|
|
|
|
In
2005, the health care trend rate used to measure the expected increase in the
cost of benefits was assumed to be 9% decreasing to 5% after 2009. Assumed health care cost trend rates have a
significant effect on the amounts reported for the postretirement benefit
plans. A 1% change in assumed health care cost trend rates would have the
following effects (dollars in millions):
|
|
|
Point
|
|
Point
|
|
|
Asset category
|
|
Increase
|
|
Decrease
|
|
|
|
|
|
|
|
|
|
Effect
on total of service and interest cost
|
|
$
|
0.5
|
|
$
|
(0.4
|
)
|
|
Effect
on postretirement benefit obligation
|
|
|
4.7
|
|
|
(4.5
|
)
|
The
asset allocation for our pension plans at the end of 2005 and 2004 and the
target allocation for 2006, by asset category, follows. The fair value of plan
assets for these plans was $2,043.4 million at the end of 2005. Based upon
historical returns, the expectations of our investment committee and outside
advisors, the expected long-term rate of return on these assets is estimated to
be between 7.06% to 8.25%.
F-35
|
|
|
|
|
Allocation at
|
|
Allocation at
|
|
|
Asset category
|
|
Target Allocation
|
|
December 31, 2005
|
|
December 31, 2004
|
|
|
|
|
|
|
|
|
|
|
|
Large
Cap Equities
|
|
30%
|
|
31
|
%
|
29
|
%
|
|
Small/Mid
Cap Equities
|
|
15%-20%
|
|
19
|
%
|
22
|
%
|
|
International
Equities
|
|
10%-15%
|
|
16
|
%
|
16
|
%
|
|
Fixed
Income
|
|
15%-20%
|
|
17
|
%
|
18
|
%
|
|
Real
Estate/Other
|
|
10%-15%
|
|
14
|
%
|
14
|
%
|
|
Cash
|
|
0%
|
|
3
|
%
|
1
|
%
|
|
Total
U.S. pension plans
|
|
|
|
100
|
%
|
100
|
%
|
|
|
|
|
|
|
|
|
|
|
Equities
|
|
59%
|
|
60
|
%
|
61
|
%
|
|
Fixed
Income
|
|
37%
|
|
35
|
%
|
34
|
%
|
|
Real
estate
|
|
3%
|
|
4
|
%
|
3
|
%
|
|
Cash
|
|
1%
|
|
1
|
%
|
2
|
%
|
|
Total
non-U.S. pension plans
|
|
|
|
100
|
%
|
100
|
%
|
Equity
securities in our pension plans did not include any equity securities of our
Company or our affiliates at the end of 2005.
Our
pension plan assets are managed by outside investment managers; assets are
rebalanced based upon market opportunities and the consideration of transactions
costs. Our strategy with respect to pension assets is to pursue an investment
plan that, over the long term is expected to protect the funded status of the
plan, enhance the real purchasing power of plan assets, and not threaten the
plan’s ability to meet currently committed obligations.
Defined Contribution Plans
We
have a money purchase pension plan covering substantially all of our domestic
employees who have completed at least two years of service. Employer
contributions are made based on a percentage of employees’ earnings (ranging up
to 8%).
We
also have a salary deferral plan covering substantially all domestic employees.
Plan participants may elect to make voluntary contributions to this plan up to
a specified amount of their compensation. We contribute an amount equal to
one-half of the participant’s contribution, not to exceed 2% of the
participant’s compensation.
Coincident
with the introduction of the cash balance formula within our defined benefit
pension plan, the money purchase pension plan was closed to new hires. At the same time, the company match in the
salary deferral plan was increased, for new hires, to a 100% match, not to
exceed 4% of the participant’s compensation, once the participant has achieved
six years of service with the Company.
Our
total combined expense for the above defined contribution plans for the years
ended December 31, 2005, 2004, and 2003 was approximately $15.9 million,
$20.7 million, $17.3 million, respectively.
Supplemental Salary Deferral Plan and Supplemental
Executive Retirement Plan
The
Huntsman Supplemental Savings Plan (“SSP”) is a non-qualified plan covering key
management employees and allows participants to defer amounts that would
otherwise be paid as compensation. The participant can defer up to 75% of their
salary and bonus each year. This plan also provides benefits that would be
provided under the Huntsman Salary Deferral Plan if that plan were not subject
to legal limits on the amount of contributions that can be allocated to an
individual in a single year. The SSP was
amended and restated as of January 1, 2005 to allow eligible executive
employees to comply with Section 409A of the Internal Revenue Code of 1986 (“Section
409A”).
The
Huntsman Supplemental Executive Retirement Plan (the “SERP”) is an unfunded
nonqualified pension plan established to provide certain executive employees
with benefits that could not be provided, due to legal limitations, under the
Huntsman Defined Benefit Pension Plan, a qualified defined benefit pension plan,
and the Huntsman Money Purchase Pension Plan, a qualified money purchase
pension plan. On December 23, 2005, the SERP was amended and restated for four
purposes: (1) to transfer certain liabilities related to benefits for eligible
executive employees to the newly-established Huntsman Supplemental Executive
MPP Plan (the “SEMPP”), (2) to reflect a change in the benefit formula in the
Huntsman Defined Benefit Pension Plan, (3) to provide for the merger of the
Polyurethanes Executive Pension Plan and the Polyurethanes Excess Benefit Plan
(each an unfunded nonqualified pension plan) into the SERP, and (4) to allow
eligible executive employees to comply with Section 409A. The effective date of
the amendment and restatement of the SERP with respect to items (1)-(3) is July
1, 2004 because each of these items relates to the amendment of the Huntsman
Defined Benefit Pension Plan which was effective on such date. The effective
date of the amendment and restatement of the SERP with respect to item (4) is
January 1, 2005 in accordance with Section 409A.
Assets
of these plans are included in other assets and were $5.3 million and $4.3
million at December 31, 2005 and 2004, respectively. During the year ended
December 31, 2005, 2004 and 2003, we expensed $0.5 million, $0.5 million and
$1.1 million for the SSP and SERP, respectively.
International Plans
International
employees are covered by various post employment arrangements consistent with
local practices and regulations. Such obligations are included in the consolidated
financial statements in other long-term liabilities.
F-36
18. Income Taxes
The following is a summary of U.S. and non-U.S. provisions for current
and deferred income taxes (dollars in millions):
|
|
|
Year ended December 31,
|
|
|
|
|
2005
|
|
2004
|
|
2003
|
|
|
Income
tax expense (benefit):
|
|
|
|
|
|
|
|
|
U.S.
|
|
|
|
|
|
|
|
|
Current
|
|
$
|
1.5
|
|
$
|
11.1
|
|
$
|
8.1
|
|
|
Deferred
|
|
—
|
|
(2.4
|
)
|
0.1
|
|
|
Non-U.S.
|
|
|
|
|
|
|
|
|
Current
|
|
25.1
|
|
24.3
|
|
23.6
|
|
|
Deferred
|
|
16.2
|
|
(55.9
|
)
|
9.2
|
|
|
Total
|
|
$
|
42.8
|
|
$
|
(22.9
|
)
|
$
|
41.0
|
|
The following
schedule reconciles the differences between the U.S. federal income taxes at
the U.S. statutory rate to our provision (benefit) for income taxes (dollars in
millions):
|
|
|
Year ended December 31,
|
|
|
|
|
2005
|
|
2004
|
|
2003
|
|
|
|
|
|
|
|
|
|
|
|
Income
(loss) before income tax and minority interests
|
|
$
|
236.6
|
|
$
|
(195.6
|
)
|
$
|
(275.2
|
)
|
|
|
|
|
|
|
|
|
|
|
Expected
expense (benefit) at U.S. statutory rate of 35%
|
|
$
|
82.8
|
|
$
|
(68.4
|
)
|
$
|
(96.3
|
)
|
|
Change
resulting from:
|
|
|
|
|
|
|
|
|
State
taxes (benefit) net of federal benefit
|
|
2.9
|
|
4.0
|
|
(4.1
|
)
|
|
Effects
of non-U.S. operations and tax rate differential
|
|
7.8
|
|
(38.7
|
)
|
7.4
|
|
|
Effect
of AdMat Consolidation Transaction
|
|
88.4
|
|
—
|
|
—
|
|
|
Incremental
U.S. tax on non-U.S. income
|
|
18.2
|
|
28.4
|
|
1.6
|
|
|
Domestic
(income) loss allocable to minority interests
|
|
(9.5
|
)
|
11.5
|
|
14.3
|
|
|
Change
in valuation allowance
|
|
(150.7
|
)
|
48.7
|
|
112.5
|
|
|
Other
- net
|
|
2.9
|
|
(8.4
|
)
|
5.6
|
|
|
Total
income tax expense (benefit)
|
|
$
|
42.8
|
|
$
|
(22.9
|
)
|
$
|
41.0
|
|
F-37
The
components of (losses) earnings from continuing operations before taxes were as
follows (dollars in millions):
|
|
|
Year ended December 31,
|
|
|
|
|
2005
|
|
2004
|
|
2003
|
|
|
|
|
|
|
|
|
|
|
|
Income
(loss) before income taxes:
|
|
|
|
|
|
|
|
|
U.S.
|
|
$
|
63.1
|
|
$
|
(109.4
|
)
|
$
|
(153.4
|
)
|
|
Non-U.S.
|
|
173.5
|
|
(86.2
|
)
|
(121.8
|
)
|
|
Total
|
|
$
|
236.6
|
|
$
|
(195.6
|
)
|
$
|
(275.2
|
)
|
Subsequent to the AdMat Transaction in June 2003, substantially all
non-U.S. operations of AdMat were treated as branches of our Company for U.S.
income tax purposes and were, therefore, subject to both U.S. and non-U.S.
income tax. The pre-tax income in the
table above and the preceding U.S. and non-U.S. allocation of the income tax
provision by taxing jurisdiction may, therefore, not be directly related.
Components of deferred income tax assets and liabilities were as follows
(dollars in millions):
|
|
|
December 31,
|
|
December 31,
|
|
|
|
|
2005
|
|
2004
|
|
|
Deferred
income tax assets:
|
|
|
|
|
|
|
Net
operating loss and AMT credit carryforwards
|
|
$
|
942.5
|
|
$
|
1,214.6
|
|
|
Pension
and other employee compensation
|
|
166.9
|
|
134.8
|
|
|
Plant,
property and equipment
|
|
44.8
|
|
69.5
|
|
|
Intangible
assets
|
|
107.0
|
|
112.8
|
|
|
Inventory
costing
|
|
4.8
|
|
—
|
|
|
Other,
net
|
|
65.3
|
|
113.2
|
|
|
Total
|
|
1,331.3
|
|
1,644.9
|
|
|
|
|
|
|
|
|
|
Deferred
income tax liabilities:
|
|
|
|
|
|
|
Plant,
property and equipment
|
|
(851.1
|
)
|
(682.4
|
)
|
|
Pension
and other employee compensation
|
|
(39.2
|
)
|
(54.0
|
)
|
|
Inventory
costing
|
|
—
|
|
(11.0
|
)
|
|
Basis
difference in investment in HIH
|
|
—
|
|
(85.1
|
)
|
|
Other,
net
|
|
(39.6
|
)
|
(15.3
|
)
|
|
Total
|
|
(929.9
|
)
|
(847.8
|
)
|
|
|
|
|
|
|
|
|
Net
deferred tax asset before valuation allowance
|
|
401.4
|
|
797.1
|
|
|
Valuation
allowance
|
|
(495.3
|
)
|
(937.2
|
)
|
|
Net
deferred tax liability
|
|
$
|
(93.9
|
)
|
$
|
(140.1
|
)
|
|
|
|
|
|
|
|
|
Current
tax asset
|
|
$
|
31.2
|
|
$
|
11.9
|
|
|
Current
tax liability
|
|
(2.4
|
)
|
(14.5
|
)
|
|
Non-current
tax asset
|
|
94.2
|
|
42.7
|
|
|
Non-current
tax liability
|
|
(216.9
|
)
|
(180.2
|
)
|
|
Total
|
|
$
|
(93.9
|
)
|
$
|
(140.1
|
)
|
|
|
|
|
|
|
|
|
|
|
|
As of December 31, 2005, we have U.S. Federal net
operating loss carryforwards (“NOLs”) of $1,026.3 million. The U.S. NOLs begin
to expire in 2018 and fully expire in 2025. We also have NOLs of $1,762.4
million in various non-U.S. jurisdictions.
While the majority of the non-U.S. NOLs have no expiration date, $467.6
million have a limited life and $2.9 million may expire in 2006.
F-38
Included in the
$1,762.4 million of non-U.S. NOLs is $930.6 million attributable to AdMat’s
Luxembourg entities. As of December 31,
2005, there is a valuation allowance of $265.4 million against these net
tax-effected NOLs of $279.2 million. Due to the uncertainty surrounding the
realization of the benefits of these losses that may result from future
dissolution or restructuring of the Luxembourg entities, we continue to reduce
the related deferred tax asset with a valuation allowance.
We are subject to
the “ownership change” rules of Section 382 of the Internal Revenue Code. Under these rules, our use of the NOLs could
be limited in tax periods following the date of the ownership change. Based upon the existence of significant tax
“built-in income” items, the effect of the ownership change rules on the
ability to utilize the NOLs is not anticipated to be material.
We have a
valuation allowance against our entire U.S. and a material portion of our
non-U.S. net deferred tax assets. We
have specific valuation allowances of $2.7 million that, when reversed, will
reduce goodwill and other non-current intangibles. During the year ended December 31, 2005, we
reversed valuation allowances of $0.8 million, which were used to reduce
non-current intangibles. Additionally, included in the deferred tax assets at December 31,
2005 is approximately $7.7 million of cumulative tax benefit related to equity
transactions which will be credited to members’ equity when realized, after all
other valuation allowances have been reversed.
The decrease in valuation allowances between December 31, 2004 and 2005
which is not accounted for in the rate reconciliation is attributable to the
following: Foreign currency movements
($81.0 million); adjustments to deferred tax assets (with a full valuation
allowance) for tax contingencies ($98.0 million); adjustments to deferred tax
assets with a full valuation allowance for changes in tax filing positions
($27.0 million); other adjustments to deferred tax assets with a full valuation
allowance ($60.4 million); and movement of net deferred assets unrelated to
income or loss from continuing operations and other items ($24.8 million).
During the year
ended December 31, 2005, included in the $7.8 million “Effects of non-U.S.
operations and tax rate differential” above is approximately $8.0 million of
non-recurring items including cancellation of debt income that was offset by
NOLs (with a full valuation allowance), amounts associated with enacted changes
in tax rates, the expiration of tax statute of limitations as well as the
establishment of contingency reserves.
The “Effect of the AdMat Transaction” above is approximately $88.4
million of tax expense fully offset by changes in valuation allowances. The
components of the $88.4 million are as follows: $30.7 million associated with
loss recapture income related to non-U.S. losses that had previously been
deducted for U.S. taxation purposes; $6.2 million associated with current year
non-U.S. losses not deducted for U.S. tax purposes; and $51.5 million
associated with the write-down of net deferred tax assets, with a full
valuation allowance, related to the U.S. taxation of AdMat non-U.S. entities. Effective
January 1, 2006, certain of AdMat’s non-U.S. operations previously treated as
branches will no-longer be treated as branches and will only be subject to U.S.
taxation on future earnings to the extent those earnings are repatriated. This eliminates current double taxation of
non-U.S. earnings that was inherent in the AdMat tax structure.
On August 16, 2005, HIH
and Huntsman LLC were merged with and into our Company, and we continued in
existence as the surviving entity. Prior
to the merger, HIH, including our Company, was treated as a partnership for
U.S. federal income tax purposes and as such was generally not subject to U.S.
income tax, but rather such income was taxed directly to its owners. A net deferred tax liability was recognized
for the excess of the difference in the book and tax investment in the
partnership over the difference in the book and tax basis of the net assets of
the partnership. After the merger, we
are treated as a corporate subsidiary and subject to U.S. income tax. The basis difference in the investment in the
HIH partnership has been reversed, offset by a corresponding change in
valuation allowance.
For non-U.S. entities that are not treated as branches for U.S. tax
purposes, we do not provide for income taxes on the undistributed earnings of
these subsidiaries as earnings are reinvested and, in the opinion of
management, will continue to be reinvested indefinitely. The undistributed earnings of non-U.S.
subsidiaries that are deemed to be
permanently invested were $56.5 million at December 31, 2005. It is not practicable
to determine the unrecognized deferred tax liability on those earnings.
As a matter of course,
our subsidiaries are regularly audited by various taxing authorities in both
the U.S. and numerous non-U.S. jurisdictions.
We believe adequate provision has been made for all outstanding issues
for all open years. Significant
judgments and estimates are required in determining the global provision for
income taxes, including judgments and estimates regarding the realization of
deferred tax assets and the ultimate outcome of tax-related contingencies. During the ordinary course of business, there
are many transactions and calculations for which the ultimate tax determination
is uncertain. We either recognize a
liability, including related interest, or reduce a tax asset, for the
anticipated outcome of tax audits. We
adjust these amounts in light of changing facts and circumstances, such as the
closing of a tax audit or the expiration of a statute of limitations in the
period in which the change occurs. If
our tax positions are ultimately upheld under
F-39
audits by respective
taxing authorities, it is possible that the provision for income taxes in
future years may reflect significant favorable adjustments. During 2005, the IRS audit for the years
ended 1998 through 2001 was completed, with the exception of two issues as to which
we are pursuing an administrative appeal before the IRS. The potential net adjustment to our net
operating losses is approximately $200 million.
Due to the uncertainty of realization caused by the tax audit, the gross
deferred assets have been reduced, offset by a corresponding change in
valuation allowance.
19. Commitments and Contingencies
Purchase Commitments
We have various purchase commitments extending through 2023 for
materials and supplies entered into in the ordinary course of business. The
purchase commitments are contracts that require minimum volume purchases.
Certain contracts allow for changes in minimum required purchase volumes in the
event of a temporary or permanent shutdown of a facility. The contractual
purchase price for substantially all of these contracts require minimum
payments, even if no volume is purchased. Historically, we have not made any
minimum payments under such take or pay contracts without taking product.
Total purchase commitments as of December 31, 2005 are as follows
(dollars in millions):
|
Year ending December 31:
|
|
|
|
|
2006
|
|
$
|
2,325.6
|
|
|
2007
|
|
1,520.1
|
|
|
2008
|
|
375.1
|
|
|
2009
|
|
125.4
|
|
|
2010
|
|
88.7
|
|
|
Thereafter
|
|
184.1
|
|
|
|
|
$
|
4,619.0
|
|
|
|
|
|
|
|
Legal Matters
Discoloration Claims
Certain claims have been
filed against us relating to discoloration of unplasticized polyvinyl chloride
products allegedly caused by our titanium dioxide (“Discoloration Claims”).
Substantially all of the titanium dioxide that is the subject of these claims
was manufactured prior to our acquisition of our titanium dioxide business from
ICI in 1999. Net of amounts we have received from insurers and pursuant to
contracts of indemnity, we have paid approximately $16 million in costs
and settlement amounts for Discoloration Claims as of December 31, 2005.
The following table
presents information about the number of Discoloration Claims for the periods
indicated. Claims include all claims for which service has been received by us,
and each such claim represents a plaintiff who is pursuing a claim against us.
|
|
|
Year ended
December 31, 2005
|
|
Year ended
December 31, 2004
|
|
Year ended
December 31, 2003
|
|
|
Claims
filed during period
|
|
0
|
|
1
|
|
1
|
|
|
Claims
resolved during period
|
|
1
|
|
2
|
|
2
|
|
|
Claims
unresolved at end of period
|
|
2
|
|
3
|
|
4
|
|
During
the year ended December 31, 2004, we settled claims for approximately
$45 million, approximately $30 million of which was paid by our
insurers or ICI and approximately $15 million of which was paid by us.
During 2004, we recorded charges of $15.1 million relating to
Discoloration Claims. During the year ended December 31, 2005, we
settled a claim for approximately $1 million, all of which was paid by ICI. The
two Discoloration Claims unresolved as of December 31, 2005 asserted aggregate
damages of approximately $63 million. An appropriate liability has been
accrued for these claims. Based on our understanding of the merits of these
claims and our rights under contracts of indemnity and insurance, we do not
believe that the net impact on our financial condition, results of operations
or liquidity will be material.
While additional
Discoloration Claims may be made in the future, we cannot reasonably estimate
the amount of loss related to such claims. Although we may incur additional
costs as a result of future claims (including settlement costs), based
F-40
on our history with
Discoloration Claims to date, the fact that substantially all of the titanium
dioxide that has been the subject of these Discoloration Claims was
manufactured and sold more than six years ago, and the fact that we have rights
under contract to indemnity, including from ICI, we do not believe that any
unasserted Discoloration Claims will have a material impact on our financial
condition, results of operations, or liquidity. Based on this conclusion and
our inability to reasonably estimate our expected costs with respect to these unasserted
claims, we have made no accruals in our financial statements as of December 31,
2005 for costs associated with unasserted Discoloration Claims.
Ciba
Settlement
Vantico concluded that
certain of the products of its former Electronics division may have infringed
patents owned by Taiyo and it entered into a license agreement in
October 2001 with Taiyo to obtain the right to use the Taiyo patents. This
license agreement required payment of approximately $4 million in back
royalties and agreement to pay periodic royalties for future use. We believe
that Ciba Specialty Chemicals Holdings Inc. (“Ciba”) is liable under the
indemnity provisions of certain agreements in connection with the leveraged
buy-out transaction in 2000 involving Ciba and Vantico for certain payments
made under the license agreement and related costs and expenses, and we
initiated an arbitration proceeding against Ciba. In July 2004, we entered
into a settlement agreement with Ciba with respect to this matter. In general,
the settlement agreement provided that Ciba would pay us $11.1 million in
2004. We received additional consideration in the form of modifications to
certain operating agreements between us and Ciba. In August 2004, we
received payment of the $11.1 million settlement.
Environmental
Litigation
We have been a party to
various lawsuits brought by persons alleging personal injuries and/or property
damage based upon alleged exposure to toxic air emissions. For example, since
June 2003, a number of lawsuits have been filed in state district court in
Jefferson County, Texas against several local chemical plants and refineries,
including our subsidiary, Huntsman Petrochemical Corporation. Generally, these
lawsuits have alleged that the refineries and chemical plants located in the
vicinity of the plaintiffs’ homes discharged chemicals into the air that
interfere with use and enjoyment of property and cause health problems and/or
property damages. None of these lawsuits have included the amount of damages
being sought. The following table presents information about the number of
claims asserting damages based upon alleged exposure to toxic air emissions for
the periods indicated. Claims include all claims for which service has been
received by us, and each such claim represents a plaintiff who is pursuing a
claim against us.
|
|
|
Year ended
December 31, 2005
|
|
Year ended
December 31, 2004
|
|
Year ended
December 31, 2003
|
|
|
Claims
filed during period
|
|
2,104
|
|
214
|
|
721
|
|
|
Claims
resolved during period
|
|
2,988
|
|
51
|
|
0
|
|
|
Claims
unresolved at end of period
|
|
0
|
|
884
|
|
721
|
|
All claims filed as of December 31, 2005 have been
resolved through dismissal and/or settlement.
In addition, we have been named as a “premises
defendant” in a number of asbestos exposure cases, typically a claim by a
non-employee of exposure to asbestos while at a facility. In the past, these
cases typically have involved multiple plaintiffs bringing actions against
multiple defendants, and the complaint has not indicated which plaintiffs were
making claims against which defendants, where or how the alleged injuries
occurred, or what injuries each plaintiff claimed. These facts, which would be
central to any estimate of probable loss, generally have been learned only
through discovery. Recent changes in Texas tort procedures have required many
pending cases to be split into multiple cases, one for each claimant,
increasing the number of pending cases reported below for the year ended December
31, 2005. Nevertheless, the complaints in these cases provide little additional
information. We do not believe that the increased number of cases reflects an
increase in the number of underlying claims.
Where the alleged
exposure occurred prior to our ownership or operation of the relevant
“premises,” the prior owners and operators generally have contractually agreed
to retain liability for, and to indemnify us against, asbestos exposure claims.
This indemnification is not subject to any time or dollar amount limitations.
Upon service of a complaint in one of these cases, we tender it to the prior
owner or operator. None of the complaints in these cases state the amount of
damages being sought. The prior owner or operator accepts responsibility for
the conduct of the defense of the cases and payment of any amounts due to the
claimants. In our eleven-year experience with tendering these cases, we have
not made any payment with respect to any tendered asbestos cases. We believe
that the prior owners or operators have the intention and ability to continue
to honor their indemnities, although we cannot assure you that they will
continue to do so or that we will not be liable for these cases if they do not.
F-41
The following table presents for the periods indicated
certain information about cases for which service has been received that we
have tendered to the prior owner or operator, all of which have been accepted.
|
|
|
Year ended
December 31, 2005
|
|
Year ended
December 31, 2004
|
|
Year ended
December 31, 2003
|
|
|
Tendered during period
|
|
284
|
|
94
|
|
|
|
|
Resolved during period
|
|
106
|
|
65
|
|
|
|
|
Unresolved at end of period
|
|
576
|
|
398
|
|
369
|
|
We have never made any payments with respect to these
cases. As of December 31, 2005, we had an accrued liability of
$12.5 million relating to these cases and a corresponding receivable of
$12.5 million relating to our indemnity protection with respect to these
cases. We cannot assure you that our liability will not exceed our accruals or
that our liability associated with these cases would not be material to our
financial condition, results of operations or liquidity.
Certain cases in which we are a “premises defendant”
are not subject to indemnification by prior owners or operators. The following
table presents for the periods indicated certain information about these cases.
Cases include all cases for which service has been received by us.
|
|
|
Year ended
December 31, 2005
|
|
Year ended
December 31, 2004
|
|
Year ended
December 31, 2003
|
|
|
Filed during period
|
|
55
|
|
23
|
|
|
|
|
Resolved during period
|
|
56
|
|
42
|
|
|
|
|
Unresolved at end of period
|
|
34
|
|
29
|
|
48
|
|
We paid gross settlement costs for asbestos exposure
cases that are not subject to indemnification of $0.1 million,
$1.0 million and $0.2 million in 2005, 2004 and 2003, respectively. The cases for the year ended December 31,
2005 include cases filed against Rubicon LLC, which became our consolidated
subsidiary on January 1, 2005, as follows:
one case filed during the period, one case resolved during the period
and six cases unresolved at the end of the period.
As of December 31, 2005, we had an accrual of $0.9 million
relating to these cases. We cannot assure you that our liability will not
exceed our accruals or that our liability associated with these cases would not
be material to our financial condition, results of operations or liquidity.
Antitrust Matters
We have been named as a defendant in putative class
action antitrust suits alleging a conspiracy to fix prices in the MDI, TDI, and
polyether polyols industries that are now consolidated as the “Polyether
Polyols Cases” in multidistrict litigation known as In re Urethane Antitrust
Litigation, MDL No. 1616, Civil No. 2:04-md-01616-JWL-DJW, United States
District Court, District of Kansas, initial order transferring and
consolidating cases filed August 23, 2004. Other defendants named in the
Polyether Polyols Cases are Bayer, BASF, Dow, and Lyondell. Bayer has announced
that it has entered into a settlement agreement with the plaintiffs.
These consolidated cases are in the early stages of
class certification discovery. The pleadings of the plaintiffs do not provide
specifics about any alleged illegal conduct of the defendants and we are not
aware of any evidence of illegal conduct by us or any of our employees. For
these reasons, we cannot estimate the possible loss or range of loss relating
to these claims, and therefore we have not accrued a liability for these
claims. Nevertheless, we could incur losses due to these claims in the future
and those losses could be material.
In addition, on February 16, 2006, the Antitrust
Division of the U.S. Department of Justice served us with a grand jury subpoena
requesting the production of documents relating to sales and pricing of TDI,
MDI, polyether polyols and related systems. Bayer and Lyondell have announced
that they have also been served with subpoenas in this matter. We intend to
cooperate fully in this matter.
Tax Dispute
In connection with the audit of our income tax returns
for the years ended 1998 through 2001, we received a Notice of Proposed
Adjustment from the Internal Revenue Service and, in late 2005, we initiated an
administrative appeal before the Internal Revenue Service. The potential
liability and the potential reduction to our net operating losses have been
reserved in our financial statements. For more information on this matter,
including the potential net adjustment to our net operating losses, see “Note
18. Income Taxes.”
Other
Proceedings
We are a party to various other proceedings instituted
by private plaintiffs, governmental authorities and others arising under
provisions of applicable laws, including various environmental, products
liability and other laws. Except as
F-42
otherwise disclosed in this report, we do not believe that the outcome
of any of these matters will have a material adverse effect on our financial
condition, results of operations or liquidity.
Gain Contingencies
While the 2005 U.S. Gulf Coast storms did not cause
serious structural damage to our facilities, they did cause operational
disruptions for us and certain of our suppliers and customers. Some of our products
were temporarily negatively impacted by restrictions on the availability of
certain raw materials and our business was adversely impacted by logistics and
transportation disruptions. Certain of our operations were suspended for much
of the fourth quarter of 2005. We are in the process of preparing claims for
possible recovery of damages under our insurance policies for property damage and
business interruption. We can provide no assurances that we will recover these
damages (or the amount of recovery, if any), and as such, we have not recorded
any receivables from our insurance carriers at December 31, 2005. However, we
anticipate obtaining at least a partial recovery, net of insurance deductibles,
by the end of 2006.
20. Environmental, Health and Safety Matters
General
We are subject to extensive federal, state, local and
foreign laws, regulations, rules and ordinances relating to pollution,
protection of the environment and the generation, storage, handling,
transportation, treatment, disposal and remediation of hazardous substances and
waste materials. In the ordinary course of business, we are subject to frequent
environmental inspections and monitoring and occasional investigations by
governmental enforcement authorities. In addition, our production facilities
require operating permits that are subject to renewal, modification and, in
certain circumstances, revocation. Actual or alleged violations of
environmental laws or permit requirements could result in restrictions or
prohibitions on plant operations, substantial civil or criminal sanctions, as
well as, under some environmental laws, the assessment of strict liability
and/or joint and several liability. Moreover, changes in environmental
regulations could inhibit or interrupt our operations, or require us to modify
our facilities or operations. Accordingly, environmental or regulatory matters
may cause us to incur significant unanticipated losses, costs or liabilities.
Environmental,
Health and Safety Systems
We are committed to achieving and maintaining
compliance with all applicable environmental, health and safety (“EHS”) legal
requirements, and we have developed policies and management systems that are
intended to identify the multitude of EHS legal requirements applicable to our
operations, enhance compliance with applicable legal requirements, ensure the
safety of our employees, contractors, community neighbors and customers and
minimize the production and emission of wastes and other pollutants. Although
EHS legal requirements are constantly changing and are frequently difficult to
comply with, these EHS management systems are designed to assist us in our
compliance goals while also fostering efficiency and improvement and minimizing
overall risk to us.
EHS Capital
Expenditures
We may incur future costs for capital improvements and
general compliance under EHS laws, including costs to acquire, maintain and
repair pollution control equipment. For the years ended December 31, 2005 and
2004, our capital expenditures for EHS matters totaled $48.9 million and
$55.4 million, respectively. Since capital expenditures for these matters are
subject to evolving regulatory requirements and depend, in part, on the timing,
promulgation and enforcement of specific requirements, we cannot provide
assurance that our recent expenditures will be indicative of future amounts
required under EHS laws.
Governmental
Enforcement Proceedings
On occasion, we receive notices of violation,
enforcement and other complaints from regulatory agencies alleging
non-compliance with applicable EHS law. By way of example, we are aware of the
individual matters set out below, which we believe to be the most significant
presently pending matters and unasserted claims. Although we may incur costs or
penalties in connection with the governmental proceedings discussed below,
based on currently available information and our past experience, we believe
that the ultimate resolution of these matters will not have a material impact
on our financial condition, results of operations or cash flows.
In May 2003, the State of Texas settled an air
enforcement case with us relating to our Port Arthur plant. Under the
settlement, we are required to pay a civil penalty of $7.5 million over more
than four years, undertake environmental monitoring projects totaling about
$1.5 million in costs, and pay $0.4 million in attorney’s fees to the Texas
Attorney General. As of December 31, 2005, we have paid $3.5 million toward the
penalty and $0.4 million for the attorney’s fees. The monitoring projects are
underway and on schedule. We do not anticipate that this settlement will have a
material adverse effect on our financial condition, results of operations or
cash flows.
Beginning in the third quarter of 2004 and extending
through December 2005, we have received notifications of approximately eight
separate enforcement actions from the Texas Commission on Environmental Quality
(“TCEQ”) for alleged violations related to air emissions at our Port Neches or
our Port Arthur plant. These alleged violations primarily relate to specific
upset emissions, emissions from cooling towers, or flare operations occurring
at particular times and at particular operating units during 2004 and 2005.
These notices of violation appear to be part of a larger enforcement initiative
by the TCEQ regional office focused on upset emissions at chemical and refining
industry plants located within the Beaumont/Port Arthur region. TCEQ has made
individual proposals to us to resolve four of the notices of alleged violation
F-43
for approximately $0.1 million each. TCEQ has also made a proposal to
resolve one of the remaining notices, addressing upset emissions at Port
Neches, for $0.2 million. TCEQ has not made a penalty proposal for two other
notices, and the final notice is seeking a penalty of less than $5,000. Final
resolution of these matters is subject to negotiation between us and TCEQ. We
do not believe that the resolution of these matters will result in the
imposition of costs material to our financial condition, results of operations
or cash flows.
By letter dated September 13, 2005 the Tamil Nadu
Pollution Control Board (the “TNPCB”) issued an Order in follow-up to a Show
Cause notice dated June 30, 2005,
requiring a manufacturing facility of Petro Araldite Private Limited, a
subsidiary of AdMat in Chennai, India, to close for one week and to submit an
action plan and timeline to reduce chemical oxygen demand in its wastewater
effluent. The facility complied with the order and submitted an action
plan to the TNPCB, which has been accepted pending installation of assets to
remedy the issue. A consent order
renewal was subsequently issued covering the period through March 31,
2006. The proposed changes are
being installed and we expect these modifications to resolve the current issues
with the TNPCB. Ultimately, if the asset
modifications do not resolve the effluent issue, or the TNPCB believes the plan
or its implementation is inadequate, the TNPCB has the power to take further enforcement
action, including shutting down the facility for a longer period or permanently,
initiating criminal sanctions or imposing fines. Nevertheless, we believe that the investments in progress will fully resolve
this matter. If they do not, however, the ultimate resolution will not have a
material impact on our financial condition, results of operations or cash flows.
Remediation
Liabilities
We have incurred, and we may in the future incur,
liability to investigate and clean up waste or contamination at our current or
former facilities or facilities operated by third parties at which we may have
disposed of waste or other materials. Similarly, we may incur costs for the
cleanup of wastes that were disposed of prior to the purchase of our
businesses. Under some circumstances, the scope of our liability may extend to
damages to natural resources. Specifically, under the U.S. Comprehensive
Environmental Response, Compensation and Liability Act of 1980, as amended (“CERCLA”),
and similar state laws, a current or former owner or operator of real property
may be liable for remediation costs regardless of whether the release or
disposal of hazardous substances was in compliance with law at the time it
occurred, and a current owner or operator may be liable regardless of whether
it owned or operated the facility at the time of the release. In addition,
under the U.S. Resource Conservation and Recovery Act of 1976, as amended (“RCRA”),
and similar state laws, we may be required to remediate contamination
originating from our properties as a condition to our hazardous waste permit.
For example, our Odessa, Port Arthur, and Port Neches facilities in Texas are
the subject of ongoing remediation requirements under RCRA authority. In many
cases, our potential liability arising from historical contamination is based
on operations and other events occurring prior to our ownership of the relevant
facility. In these situations, we frequently obtained an indemnity agreement
from the prior owner addressing remediation liabilities arising from
pre-closing conditions. We have successfully exercised our rights under these
contractual covenants for a number of sites, and where applicable, mitigated
our ultimate remediation liability. We cannot assure you, however, that all of
such matters will be subject to indemnity or that our existing indemnities will
be sufficient to cover our liabilities for such matters.
Some of our manufacturing sites have an extended
history of industrial chemical manufacturing and use, including on-site waste
disposal. We are aware of soil, groundwater and surface water contamination
from past operations at some of our sites, and we may find contamination at
other sites in the future. Based on available information and the
indemnification rights we believe are likely to be available, we believe that
the costs to investigate and remediate known contamination will not have a
material adverse effect on our financial condition, results of operations or
cash flows. However, if such indemnities are unavailable or do not fully cover
the costs of investigation and remediation or we are required to contribute to
such costs, and if such costs are material, then such expenditures may have a
material adverse effect on our financial condition, results of operations or
cash flows. At the current time, we are unable to estimate the full cost, exclusive
of indemnification benefits, to remediate any of the known contamination sites.
We have been notified by third parties of claims
against us or our subsidiaries for cleanup liabilities at approximately 12
former facilities and other third party sites, including but not limited to
sites listed under CERCLA. Based on current information and past experience at
other CERCLA sites, we do not expect any of these third party claims to result
in a material liability to us.
Environmental
Reserves
We have established financial reserves relating to
anticipated environmental cleanup obligations, site reclamation and closure
costs and known penalties. Liabilities are recorded when potential liabilities
are either known or considered probable and can be reasonably estimated. Our
liability estimates are based upon available facts, existing technology and
past experience. On a consolidated basis, we have accrued approximately $25
million and $35 million for environmental liabilities as of December 31, 2005
and 2004, respectively. Of these amounts, approximately $7 million and $8
million are classified as accrued liabilities on our consolidated balance
sheets as of December 31, 2005 and 2004, respectively, and approximately
F-44
$18 million and $27 million are classified as other noncurrent
liabilities on our consolidated balance sheets as of December 31, 2005 and
2004, respectively. In certain cases, our remediation liabilities are payable
over periods of up to 30 years. We may incur losses for environmental
remediation in excess of the amounts accrued; however, we are not able to
estimate the amount or range of such potential excess.
Regulatory
Developments
Under the European Union (“EU”) Integrated Pollution
Prevention and Control Directive (“IPPC”), EU member governments are to adopt
rules and implement a cross media (air, water and waste) environmental
permitting program for individual facilities. While the EU countries are at
varying stages in their respective implementation of the IPPC permit program,
we have submitted all necessary IPPC permit applications required to date, and
in some cases received completed permits from the applicable government agency.
We expect to submit all other IPPC applications and related documents on a
timely basis as the various countries implement the IPPC permit program.
Although we do not know with certainty what each IPPC permit will require, we
believe, based upon our experience with the permits received to date, that the
costs of compliance with the IPPC permit program will not be material to our financial
condition, results of operations or cash flows.
In October 2003, the European Commission (“EC”)
adopted a proposal for a new EU regulatory framework for chemicals. Under this
proposed new system called “REACH” (Registration, Evaluation and Authorization
of Chemicals), companies that manufacture or import more than one ton of a
chemical substance per year would be required to register such manufacture or
import in a central database. On
November 17, 2005, the European Parliament completed its first reading of the
EC-drafted REACH legislation. Ministers
from EU’s 25 member states (sitting as the Council) finalized their own
position on the text on December 13, 2005, paving the way for final agreement
between Parliament and the Council in late 2006 and for REACH to become law in
early 2007. As proposed, REACH would require risk assessment of chemicals,
preparations (e.g., soaps and paints) and articles (e.g., consumer products)
before those materials could be manufactured or imported into EU countries.
Where warranted by a risk assessment, hazardous substances would require
authorizations for their use. This regulation could impose risk control
strategies that would require expenditures by us. As currently envisioned,
REACH would take effect in three primary stages over eleven years following the
final effective date (assuming final approval).
The impacts of REACH on the chemical industry and on us are unclear at
this time because the parameters of the program are still in development.
MTBE Developments
We produce MTBE, an oxygenate that is blended with
gasoline to reduce vehicle air emissions and to enhance the octane rating of
gasoline. The use of MTBE has become
controversial in the U.S. and elsewhere and has been curtailed and may be
eliminated in the future by legislation or regulatory action. For example, about 25 states have adopted
rules that prohibit or restrict the use of MTBE in gasoline sold in those
states. Those states account for a
substantial portion of the “pre-ban” U.S. MTBE market. In addition, the Energy Policy Act of 2005 is
beginning to have an adverse impact on our MTBE business in the U.S., since it
mandates increased use of renewable fuels and eliminates the oxygenate
requirement for reformulated gasoline established by the 1990 Clean Air Act
Amendments. Although the extent of the
potential impact of the new law is still unclear there have been indications
that certain gasoline refiners and distributors may stop using MTBE and that
certain pipeline companies may stop shipping gasoline containing MTBE. A significant loss in demand for our MTBE in
the U.S. could result in a material loss in revenues or material costs or
expenditures. Moreover, additional phase-outs
or other future regulation of MTBE may result in a further reduction in demand
for our MTBE in the U.S..
A number of lawsuits have been filed, primarily
against gasoline manufacturers, marketers and distributors, by persons seeking
so recover damages allegedly arising from the presence of MTBE in
groundwater. While we have not been
named as a defendant in any litigation concerning the environmental effects of
MTBE, we cannot provide assurances that we will not be involved in any such
litigation or that such litigation will not have a material adverse effect on
our business, financial condition and results of operations.
F-45
21. Other Comprehensive (Loss) Income
The components of other comprehensive (loss) income were
as follows (dollars in millions):
|
|
|
December 31,
|
|
|
|
|
2005
|
|
2004
|
|
2003
|
|
|
|
|
Accumulated
income (loss)
|
|
Income (loss)
|
|
Accumulated
income (loss)
|
|
Income (loss)
|
|
Income (loss)
|
|
|
Foreign currency
translation adjustments, net of tax of $0.2 million and $5.0 million as of
December 31, 2005 and 2004, respectively.
|
|
$
|
51.7
|
|
$
|
(239.5
|
)
|
$
|
291.2
|
|
$
|
109.9
|
|
$
|
218.8
|
|
|
Unrealized gain
(loss) on nonqualified plan investments
|
|
0.8
|
|
(0.1
|
)
|
0.9
|
|
0.3
|
|
0.6
|
|
|
Unrealized gain
(loss) on derivative instruments
|
|
16.0
|
|
26.5
|
|
(10.5
|
)
|
5.2
|
|
(4.1
|
)
|
|
Minimum pension
liability, net of tax, $45.4 million and $29.3 million as of December 31, 2005
and 2004, respectively
|
|
(153.3
|
)
|
(16.3
|
)
|
(137.0
|
)
|
(41.2
|
)
|
(7.4
|
)
|
|
Minimum pension
liability unconsolidated affiliate
|
|
(0.8
|
)
|
8.0
|
|
(8.8
|
)
|
(3.2
|
)
|
(0.2
|
)
|
|
Unrealized (loss)
gain on securities
|
|
—
|
|
(0.1
|
)
|
0.1
|
|
—
|
|
4.6
|
|
|
Other
comprehensive income (loss) of unconsolidated affiliates
|
|
7.3
|
|
(0.8
|
)
|
8.1
|
|
(1.1
|
)
|
9.2
|
|
|
Total
|
|
$
|
(78.3
|
)
|
$
|
(222.3
|
)
|
$
|
144.0
|
|
$
|
69.9
|
|
$
|
221.5
|
|
Items of other comprehensive (loss) income of our
Company and our consolidated affiliates have been recorded net of tax, with the
exception of the foreign currency translation adjustments related to
subsidiaries with earnings permanently reinvested. The tax effect is determined
based upon the jurisdiction where the income or loss was recognized and is net
of valuation allowances that have been recorded.
22. Related Party Transactions
Our accompanying consolidated financial statements
include the following balances not otherwise disclosed with affiliates of our
Company (dollars in millions):
|
|
|
Year ended December 31,
|
|
|
|
|
2005
|
|
2004
|
|
2003
|
|
|
Sales to:
|
|
|
|
|
|
|
|
|
Huntsman
Corporation
|
|
$
|
—
|
|
$
|
—
|
|
$
|
53.0
|
|
|
Other
unconsolidated affiliates
|
|
104.0
|
|
47.9
|
|
101.9
|
|
|
Inventory purchases from:
|
|
|
|
|
|
|
|
|
Huntsman
Corporation
|
|
—
|
|
—
|
|
76.3
|
|
|
Other
unconsolidated affiliates
|
|
—
|
|
403.9
|
|
261.4
|
|
|
Operating
expenses allocated from:
|
|
|
|
|
|
|
|
|
Huntsman
Corporation
|
|
—
|
|
—
|
|
(22.3
|
)
|
|
|
|
|
|
|
|
|
|
|
|
We have agreed with the Jon and Karen Huntsman Foundation,
a private charitable foundation established by Jon M. and Karen H. Huntsman to
further the charitable interests of the Huntsman family, that we will donate
our Salt Lake City office building and our option to acquire an adjacent
undeveloped parcel of land to the foundation free of debt. We have agreed to
complete this donation on the earlier of November 30, 2009 or the date on which
we occupy less than 20% of the two main floors of the Salt Lake City office
building. Under certain circumstances, after we make this donation, we will
have the right, but not the obligation, to lease space in the Salt Lake City
office building from the foundation.
Through May 2002, we paid the premiums on various life
insurance policies for Jon M. Huntsman. These policies have been liquidated,
and the cash values have been paid to Mr. Huntsman. Mr. Huntsman is indebted to
us in the amount of approximately $1.4 million, which represents the insurance
premiums paid on his behalf through May 2002.
23. Operating Leases
We lease a number
of assets which are accounted for as operating leases. The lease obligation reflected in our
statement of operations as rental expense, totaled $74.1 million, $55.2 million
and $40.0 million for the three years ended December 31, 2005, 2004 and 2003,
respectively. The minimum future rental
payments due under existing agreements are by year (dollars in millions):
F-46
|
Year ending December 31:
|
|
|
|
|
2006
|
|
$
|
62.3
|
|
|
2007
|
|
54.1
|
|
|
2008
|
|
46.6
|
|
|
2009
|
|
43.6
|
|
|
2010
|
|
40.1
|
|
|
Thereafter
|
|
167.2
|
|
|
|
|
$
|
413.9
|
|
24. Other Operating Expense (Income)
Other operating expense (income) consisted of the
following (dollars in millions):
|
|
|
Year ended December 31,
|
|
|
|
|
2005
|
|
2004
|
|
2003
|
|
|
Foreign exchange losses (gains)
|
|
$
|
39.0
|
|
$
|
(118.8
|
)
|
$
|
(103.6
|
)
|
|
Bad debts
|
|
4.2
|
|
2.0
|
|
10.2
|
|
|
Legal and contract settlements - net
|
|
—
|
|
6.6
|
|
2.0
|
|
|
Other
|
|
(1.0
|
)
|
29.2
|
|
12.9
|
|
|
Total other
operating expense (income)
|
|
$
|
42.2
|
|
$
|
(81.0
|
)
|
$
|
(78.5
|
)
|
25. Discontinued Operations
On July 6, 2005, we sold our toluene di-isocyanate (“TDI”)
business. The sale involved the transfer of our TDI customer list and sales
contracts. We further agreed to discontinue the use of our remaining TDI
assets. TDI has been accounted for as a discontinued operation under SFAS
No. 144. Accordingly, the following results of TDI have been presented as
discontinued operations in the accompanying consolidated statements of
operations (dollars in millions):
|
|
|
Year ended December 31,
|
|
|
|
|
2005
|
|
2004
|
|
2003
|
|
|
Revenues
|
|
$
|
24.4
|
|
$
|
59.4
|
|
$
|
62.3
|
|
|
Costs and expenses
|
|
(31.9
|
)
|
(67.2
|
)
|
(64.9
|
)
|
|
Loss on disposal
|
|
(36.4
|
)
|
—
|
|
—
|
|
|
Operating loss
|
|
(43.9
|
)
|
(7.8
|
)
|
(2.6
|
)
|
|
Income tax expense
|
|
—
|
|
—
|
|
—
|
|
|
|
|
|
|
|
|
|
|
|
Loss from discontinued operations, net of tax
|
|
$
|
(43.9
|
)
|
$
|
(7.8
|
)
|
$
|
(2.6
|
)
|
The loss on disposal of $36.4 million for the
year ended December 31, 2005 includes an impairment of long-lived assets
of $24.7 million. We expect to incur approximately $2 million of
additional costs related to the TDI transaction by the end of the second
quarter of 2006. The TDI business is reported in our Polyurethanes operating
segment in the accompanying consolidated financial statements.
26. Operating Segment Information
We derive our revenues, earnings and cash flows from
the manufacture and sale of a wide variety of differentiated and commodity
chemical products. We report our operations through six segments:
Polyurethanes, Advanced Materials, Performance Products, Pigments, Polymers and
Base Chemicals. We have organized our
business and derived our operating segments around differences in product
lines.
F-47
The major products of each reportable operating
segment are as follows:
|
Segment
|
|
Products
|
|
Polyurethanes
|
|
MDI, TPU, polyols,
aniline, PO and MTBE(1)
|
|
Advanced Materials
|
|
Epoxy resin compounds,
cross-linkers, matting agents, curing agents, epoxy, acrylic and
polyurethane-based adhesives and tooling resins and sterolithography
tooling resins
|
|
Performance Products
|
|
Amines, surfactants,
linear alkylbenzene, maleic anhydride, other performance chemicals, glycols,
and technology licenses
|
|
Pigments
|
|
Titanium dioxide
|
|
Polymers
|
|
Ethylene (produced at
the Odessa, Texas facilities primarily for internal use), polyethylene,
polypropylene, expandable polystyrene, styrene and other polymers
|
|
Base Chemicals
|
|
Olefins (primarily
ethylene and propylene), butadiene(2), MTBE(2), benzene, cyclohexane and
paraxylene
|
(1) The PO/MTBE operations in our Polyurethanes
segment are not included in the announced sale of our U.S. butadiene and MTBE
business (operated in our Base Chemicals segment). See “Note 3. Business
Combinations and Dispositions.”
(2) We have announced the sale of our U.S.
butadiene and MTBE business operated in our Base Chemicals segment; this
transaction is expect to close in mid-2006. See “Note 3. Business Combinations
and Dispositions.”
Sales between segments are generally recognized at
external market prices.
F-48
|
|
|
December 31,
|
|
|
|
|
2005
|
|
2004
|
|
2003 (4)
|
|
|
Net Sales (including intercompany sales):
|
|
|
|
|
|
|
|
|
Polyurethanes
|
|
$
|
3,396.3
|
|
$
|
2,818.0
|
|
$
|
2,235.2
|
|
|
Advanced
Materials
|
|
1,185.3
|
|
1,162.4
|
|
517.8
|
|
|
Performance
Products
|
|
1,960.9
|
|
1,927.8
|
|
1,348.3
|
|
|
Pigments
|
|
1,052.8
|
|
1,048.1
|
|
1,010.0
|
|
|
Polymers
|
|
1,702.0
|
|
1,451.8
|
|
774.4
|
|
|
Base Chemicals
|
|
4,462.1
|
|
3,859.0
|
|
2,207.3
|
|
|
Eliminations
|
|
(797.8
|
)
|
(840.7
|
)
|
(446.7
|
)
|
|
Total
|
|
$
|
12,961.6
|
|
$
|
11,426.4
|
|
$
|
7,646.3
|
|
|
|
|
|
|
|
|
|
|
|
Segment EBITDA (1):
|
|
|
|
|
|
|
|
|
Polyurethanes
|
|
$
|
676.3
|
|
$
|
364.0
|
|
$
|
233.4
|
|
|
Advanced
Materials
|
|
154.1
|
|
151.0
|
|
29.4
|
|
|
Performance
Products
|
|
157.3
|
|
91.0
|
|
80.9
|
|
|
Pigments
|
|
115.3
|
|
(30.0
|
)
|
105.4
|
|
|
Polymers
|
|
102.7
|
|
77.6
|
|
57.8
|
|
|
Base Chemicals
|
|
264.3
|
|
276.2
|
|
79.4
|
|
|
Corporate and
other (2)
|
|
(410.3
|
)
|
(48.8
|
)
|
12.1
|
|
|
Total
|
|
|
1,059.7
|
|
|
881.0
|
|
|
598.4
|
|
|
Interest expense, net
|
|
(425.6
|
)
|
(592.6
|
)
|
(480.5
|
)
|
|
Income tax (expense) benefit (3)
|
|
(39.5
|
)
|
22.9
|
|
(41.0
|
)
|
|
Depreciation and amortization
|
|
(473.9
|
)
|
(499.0
|
)
|
(394.2
|
)
|
|
Net income
(loss)
|
|
$
|
120.7
|
|
$
|
(187.7
|
)
|
$
|
(317.3
|
)
|
|
|
|
|
|
|
|
|
|
|
Depreciation and Amortization:
|
|
|
|
|
|
|
|
|
Polyurethanes
|
|
$
|
147.4
|
|
$
|
147.8
|
|
$
|
143.6
|
|
|
Advanced
Materials
|
|
46.5
|
|
53.8
|
|
27.3
|
|
|
Performance
Products
|
|
52.0
|
|
54.3
|
|
42.5
|
|
|
Pigments
|
|
77.0
|
|
83.2
|
|
65.3
|
|
|
Polymers
|
|
56.2
|
|
59.5
|
|
32.6
|
|
|
Base Chemicals
|
|
85.3
|
|
89.9
|
|
67.9
|
|
|
Corporate and
other (2)
|
|
9.5
|
|
10.5
|
|
15.0
|
|
|
Total
|
|
$
|
473.9
|
|
$
|
499.0
|
|
$
|
394.2
|
|
|
|
|
|
|
|
|
|
|
|
Capital Expenditures:
|
|
|
|
|
|
|
|
|
Polyurethanes
|
|
$
|
106.6
|
|
$
|
45.8
|
|
$
|
39.1
|
|
|
Advanced
Materials
|
|
27.4
|
|
17.4
|
|
5.8
|
|
|
Performance
Products
|
|
44.2
|
|
43.8
|
|
33.9
|
|
|
Pigments
|
|
27.1
|
|
42.7
|
|
51.7
|
|
|
Polymers
|
|
38.4
|
|
14.5
|
|
21.2
|
|
|
Base Chemicals
|
|
82.2
|
|
56.7
|
|
41.6
|
|
|
Corporate and
other
|
|
12.8
|
|
5.7
|
|
11.5
|
|
|
Total
|
|
$
|
338.7
|
|
$
|
226.6
|
|
$
|
204.8
|
|
|
|
|
|
|
|
|
|
|
|
Total Assets:
|
|
|
|
|
|
|
|
|
Polyurethanes
|
|
$
|
4,074.5
|
|
$
|
4,056.0
|
|
|
|
|
Advanced
Materials
|
|
896.7
|
|
956.4
|
|
|
|
|
Performance
Products
|
|
1,465.0
|
|
1,124.4
|
|
|
|
|
Pigments
|
|
1,659.7
|
|
1,514.5
|
|
|
|
|
Polymers
|
|
955.4
|
|
878.7
|
|
|
|
|
Base Chemicals
|
|
1,969.0
|
|
2,009.7
|
|
|
|
|
Corporate and
Eliminations
|
|
(2,387.3
|
)
|
(1,365.3
|
)
|
|
|
|
Total
|
|
$
|
8,633.0
|
|
$
|
9,174.4
|
|
|
|
(1) Segment
EBITDA is defined as net income (loss) before interest, income tax,
depreciation and amortization, and certain corporate and other items.
(2) Corporate
and other items includes unallocated corporate overhead, loss on sale of
accounts receivable, foreign exchange gains or losses and other non-operating
income (expense).
(3) Includes
a tax benefit of $3.3 million in 2005 on the cumulative effect of changes in
accounting principle.
F-49
(4) Effective
May 1, 2003, HLLC is consolidated with the results of the Company. On
June 30, 2003, affiliates of the Company completed the AdMat Transaction.
AdMat has been included in our consolidated financial statements since
June 30, 2003.
|
|
|
December 31,
|
|
|
|
|
2005
|
|
2004
|
|
2003 (2)
|
|
|
By Geographic Area
|
|
|
|
|
|
|
|
|
Net sales:
|
|
|
|
|
|
|
|
|
United States
|
|
$
|
7,447.5
|
|
$
|
6,385.1
|
|
$
|
3,888.8
|
|
|
United Kingdom
|
|
2,988.7
|
|
2,718.2
|
|
1,965.9
|
|
|
Netherlands
|
|
1,838.9
|
|
1,274.6
|
|
1,039.1
|
|
|
Other nations
|
|
2,876.7
|
|
2,857.0
|
|
2,125.2
|
|
|
Eliminations
|
|
(2,190.2
|
)
|
(1,808.5
|
)
|
(1,372.7
|
)
|
|
Total
|
|
$
|
12,961.6
|
|
$
|
11,426.4
|
|
$
|
7,646.3
|
|
|
Long-lived assets (1):
|
|
|
|
|
|
|
|
|
United States
|
|
$
|
1,960.6
|
|
$
|
2,059.2
|
|
|
|
|
United Kingdom
|
|
980.7
|
|
1,121.8
|
|
|
|
|
Netherlands
|
|
326.8
|
|
402.6
|
|
|
|
|
Other nations
|
|
1,068.6
|
|
1,233.7
|
|
|
|
|
Total
|
|
$
|
4,336.7
|
|
$
|
4,817.3
|
|
|
|
(1) Long
lived assets are made up of property, plant and equipment.
(2) Effective
May 1, 2003, HLLC is consolidated with the results of the Company. On
June 30, 2003, affiliates of the Company completed the AdMat Transaction.
AdMat has been included in our consolidated financial statements since
June 30, 2003.
28. Selected Unaudited Quarterly Financial Data
A summary of selected unaudited quarterly financial data for the years
ended December 31, 2005 and 2004 is as follows (dollars in millions):
|
|
|
Three months ended
|
|
|
|
|
March 31,
2005(a)
|
|
June 30,
2005
|
|
September 30,
2005
|
|
December 31,
2005
|
|
|
Revenues
|
|
$
|
3,349.3
|
|
$
|
3,339.5
|
|
$
|
3,121.8
|
|
$
|
3,151.0
|
|
|
Gross profit
|
|
594.9
|
|
513.2
|
|
397.5
|
|
265.6
|
|
|
Restructuring,
impairment and plant closing costs
|
|
10.4
|
|
18.8
|
|
71.3
|
|
23.1
|
|
|
Income (loss)
before accounting changes
|
|
110.2
|
|
112.6
|
|
(26.3
|
)
|
(48.3
|
)
|
|
Net income
(loss)
|
|
114.4
|
|
112.6
|
|
(26.3
|
)
|
(80.0
|
)
|
|
|
|
|
|
|
|
|
|
|
|
|
|
|
|
|
|
Three months ended
|
|
|
|
|
March 31,
2004
|
|
June 30,
2004
|
|
September 30,
2004
|
|
December 31,
2004
|
|
|
Revenues
|
|
$
|
2,620.8
|
|
$
|
2,754.0
|
|
$
|
2,934.8
|
|
$
|
3,116.8
|
|
|
Gross profit
|
|
282.8
|
|
350.0
|
|
375.0
|
|
393.5
|
|
|
Restructuring,
impairment and plant closing costs
|
|
8.7
|
|
150.5
|
|
43.2
|
|
96.9
|
|
|
Net (loss)
income
|
|
(82.2
|
)
|
(172.4
|
)
|
55.2
|
|
11.7
|
|
|
|
|
|
|
|
|
|
|
|
|
|
|
|
(a) During
the fourth quarter of 2005, we changed the measurement date of our pension and
postretirement benefit plans from December 31 to November 30, and recorded a
cumulative effect of a change in accounting principle credit, net of tax, of
$4.2 million. In accordance with SFAS
No. 3, “Reporting Accounting Changes in Interim Financial
Statements,” the cumulative effect of this accounting change was
reported effective January 1, 2005.
29. Condensed Consolidating Financial Statements –
Huntsman International LLC
The following condensed consolidating financial
statements present, in separate columns, financial information for the following:
Huntsman International LLC (on a parent only basis), with its investment in
subsidiaries recorded under the equity method; the Guarantors on a combined,
and where appropriate, consolidated basis; and the non-guarantors on a
combined, and
F-50
where appropriate, consolidated basis. Additional columns present
eliminating adjustments and consolidated totals as of December 31, 2005 and
December 31, 2004 and for the years ended December 31, 2005, 2004, and
2003. There are no contractual restrictions limiting transfers of cash from
guarantor subsidiaries to our Company. Each of the Guarantors is 100% owned by
us and has fully and unconditionally guaranteed our outstanding notes on a
joint and several basis.
F-51
HUNTSMAN INTERNATIONAL LLC AND
SUBSIDIARIES
CONDENSED CONSOLIDATING BALANCE
SHEET
AS OF DECEMBER 31, 2005
(Dollars in Millions)
|
|
|
Parent
Company
|
|
Guarantors
|
|
Non-
guarantors
|
|
Eliminations
|
|
Consolidated
Huntsman
International
LLC
|
|
|
ASSETS
|
|
|
|
|
|
|
|
|
|
|
|
|
|
|
|
|
|
|
|
|
|
|
|
|
|
Current
assets:
|
|
|
|
|
|
|
|
|
|
|
|
|
Cash and cash
equivalents
|
|
$
|
10.0
|
|
$
|
7.9
|
|
$
|
114.6
|
|
$
|
—
|
|
$
|
132.5
|
|
|
Accounts and
notes receivables, net
|
|
88.6
|
|
537.5
|
|
849.1
|
|
—
|
|
1,475.2
|
|
|
Accounts receivable
from affiliates
|
|
523.4
|
|
1,035.6
|
|
479.5
|
|
(2,028.1
|
)
|
10.4
|
|
|
Inventories, net
|
|
129.7
|
|
428.0
|
|
753.2
|
|
(1.7
|
)
|
1,309.2
|
|
|
Prepaid expenses
|
|
3.6
|
|
28.9
|
|
27.7
|
|
(14.3
|
)
|
45.9
|
|
|
Deferred income
taxes
|
|
45.5
|
|
—
|
|
0.3
|
|
(14.6
|
)
|
31.2
|
|
|
Other current
assets
|
|
27.7
|
|
1.7
|
|
49.1
|
|
(8.6
|
)
|
69.9
|
|
|
Total
current assets
|
|
828.5
|
|
2,039.6
|
|
2,273.5
|
|
(2,067.3
|
)
|
3,074.3
|
|
|
|
|
|
|
|
|
|
|
|
|
|
|
|
Property, plant
and equipment, net
|
|
559.3
|
|
1,383.8
|
|
2,390.4
|
|
3.2
|
|
4,336.7
|
|
|
Investment in
affiliates
|
|
3,521.8
|
|
2,253.7
|
|
65.7
|
|
(5,665.6
|
)
|
175.6
|
|
|
Intangible
assets, net
|
|
170.4
|
|
(3.8
|
)
|
55.4
|
|
—
|
|
222.0
|
|
|
Goodwill
|
|
—
|
|
88.0
|
|
7.3
|
|
(4.1
|
)
|
91.2
|
|
|
Deferred income
taxes
|
|
—
|
|
19.9
|
|
88.9
|
|
(14.6
|
)
|
94.2
|
|
|
Receivables from
affiliates
|
|
2,204.1
|
|
1,810.3
|
|
3.0
|
|
(4,014.4
|
)
|
3.0
|
|
|
Other noncurrent
assets
|
|
90.1
|
|
142.1
|
|
403.8
|
|
—
|
|
636.0
|
|
|
|
|
|
|
|
|
|
|
|
|
|
|
|
Total
assets
|
|
$
|
7,374.2
|
|
$
|
7,733.6
|
|
$
|
5,288.0
|
|
$
|
(11,762.8
|
)
|
$
|
8,633.0
|
|
|
|
|
|
|
|
|
|
|
|
|
|
|
|
LIABILITIES AND MEMBERS’ EQUITY
|
|
|
|
|
|
|
|
|
|
|
|
|
Current
liabilities:
|
|
|
|
|
|
|
|
|
|
|
|
|
Accounts payable
|
|
$
|
78.7
|
|
$
|
429.1
|
|
$
|
584.9
|
|
$
|
—
|
|
$
|
1,092.7
|
|
|
Accounts payable
to affiliates
|
|
1,214.8
|
|
282.9
|
|
539.3
|
|
(2,028.3
|
)
|
8.7
|
|
|
Accrued
liabilities
|
|
188.3
|
|
185.0
|
|
382.0
|
|
(23.0
|
)
|
732.3
|
|
|
Deferred income
taxes
|
|
—
|
|
19.9
|
|
(2.9
|
)
|
(14.6
|
)
|
2.4
|
|
|
Current portion
of long-term debt
|
|
20.3
|
|
9.6
|
|
14.7
|
|
—
|
|
44.6
|
|
|
Total
current liabilities
|
|
1,502.1
|
|
926.5
|
|
1,518.0
|
|
(2,065.9
|
)
|
1,880.7
|
|
|
|
|
|
|
|
|
|
|
|
|
|
|
|
Long-term debt
|
|
4,358.1
|
|
2,134.6
|
|
1,935.0
|
|
(4,014.4
|
)
|
4,413.3
|
|
|
Deferred income
taxes
|
|
45.5
|
|
0.3
|
|
185.7
|
|
(14.6
|
)
|
216.9
|
|
|
Other noncurrent
liabilities
|
|
136.8
|
|
202.2
|
|
431.5
|
|
(0.5
|
)
|
770.0
|
|
|
Total
liabilities
|
|
6,042.5
|
|
3,263.6
|
|
4,070.2
|
|
(6,095.4
|
)
|
7,280.9
|
|
|
|
|
|
|
|
|
|
|
|
|
|
|
|
Minority
interest in consolidated subsidiaries
|
|
—
|
|
84.7
|
|
15.6
|
|
(79.9
|
)
|
20.4
|
|
|
Members’
equity:
|
|
|
|
|
|
|
|
|
|
|
|
|
Members’ equity
|
|
2,794.0
|
|
3,821.1
|
|
1,302.0
|
|
(5,123.1
|
)
|
2,794.0
|
|
|
Subsidiary
preferred stock
|
|
—
|
|
73.4
|
|
1.4
|
|
(74.8
|
)
|
—
|
|
|
(Accumulated
deficit) retained earnings
|
|
(1,384.0
|
)
|
421.6
|
|
8.5
|
|
(430.1
|
)
|
(1,384.0
|
)
|
|
Accumulated other
comprehensive (loss) income
|
|
(78.3
|
)
|
69.2
|
|
(109.7
|
)
|
40.5
|
|
(78.3
|
)
|
|
Total
members’ equity
|
|
1,331.7
|
|
4,385.3
|
|
1,202.2
|
|
(5,587.5
|
)
|
1,331.7
|
|
|
|
|
|
|
|
|
|
|
|
|
|
|
|
Total
liabilities and members’ equity
|
|
$
|
7,374.2
|
|
$
|
7,733.6
|
|
$
|
5,288.0
|
|
$
|
(11,762.8
|
)
|
$
|
8,633.0
|
|
F-52
HUNTSMAN INTERNATIONAL LLC AND
SUBSIDIARIES
CONDENSED CONSOLIDATING BALANCE
SHEET
AS OF DECEMBER 31, 2004
(Dollars in Millions)
|
|
|
Parent
Company
|
|
Guarantors
|
|
Non-
guarantors
|
|
Eliminations
|
|
Consolidated
Huntsman
International
LLC
|
|
|
ASSETS
|
|
|
|
|
|
|
|
|
|
|
|
|
|
|
|
|
|
|
|
|
|
|
|
|
|
Current
assets:
|
|
|
|
|
|
|
|
|
|
|
|
|
Cash and cash
equivalents
|
|
$
|
7.3
|
|
$
|
14.0
|
|
$
|
222.2
|
|
$
|
—
|
|
$
|
243.5
|
|
|
Restricted cash
|
|
0.3
|
|
8.6
|
|
—
|
|
—
|
|
8.9
|
|
|
Accounts and
notes receivables, net
|
|
77.8
|
|
492.3
|
|
1,015.8
|
|
(0.1
|
)
|
1,585.8
|
|
|
Accounts
receivable from affiliates
|
|
93.1
|
|
278.6
|
|
55.1
|
|
(416.4
|
)
|
10.4
|
|
|
Inventories, net
|
|
122.4
|
|
351.6
|
|
780.9
|
|
(1.0
|
)
|
1,253.9
|
|
|
Prepaid expenses
|
|
3.9
|
|
29.1
|
|
27.8
|
|
(15.7
|
)
|
45.1
|
|
|
Deferred income
taxes
|
|
—
|
|
—
|
|
11.9
|
|
—
|
|
11.9
|
|
|
Other current
assets
|
|
57.6
|
|
404.1
|
|
45.3
|
|
(482.1
|
)
|
24.9
|
|
|
Total
current assets
|
|
362.4
|
|
1,578.3
|
|
2,159.0
|
|
(915.3
|
)
|
3,184.4
|
|
|
|
|
|
|
|
|
|
|
|
|
|
|
|
Property, plant
and equipment, net
|
|
615.5
|
|
1,433.1
|
|
2,768.7
|
|
—
|
|
4,817.3
|
|
|
Investment in
affiliates
|
|
3,374.2
|
|
1,410.7
|
|
61.9
|
|
(4,675.9
|
)
|
170.9
|
|
|
Intangible
assets, net
|
|
199.4
|
|
(11.4
|
)
|
67.6
|
|
(2.4
|
)
|
253.2
|
|
|
Goodwill
|
|
—
|
|
—
|
|
3.3
|
|
—
|
|
3.3
|
|
|
Deferred income
taxes
|
|
0.4
|
|
13.1
|
|
29.2
|
|
—
|
|
42.7
|
|
|
Receivables from
affiliates
|
|
2,219.6
|
|
2,242.8
|
|
276.3
|
|
(4,715.1
|
)
|
23.6
|
|
|
Other noncurrent
assets
|
|
115.9
|
|
165.6
|
|
404.0
|
|
(6.5
|
)
|
679.0
|
|
|
|
|
|
|
|
|
|
|
|
|
|
|
|
Total
assets
|
|
$
|
6,887.4
|
|
$
|
6,832.2
|
|
$
|
5,770.0
|
|
$
|
(10,315.2
|
)
|
$
|
9,174.4
|
|
|
|
|
|
|
|
|
|
|
|
|
|
|
|
LIABILITIES AND MEMBERS’ EQUITY
|
|
|
|
|
|
|
|
|
|
|
|
|
Current
liabilities:
|
|
|
|
|
|
|
|
|
|
|
|
|
Accounts payable
|
|
$
|
48.6
|
|
$
|
293.8
|
|
$
|
619.7
|
|
$
|
—
|
|
$
|
962.1
|
|
|
Accounts payable
to affiliates
|
|
57.7
|
|
149.9
|
|
243.2
|
|
(416.5
|
)
|
34.3
|
|
|
Accrued liabilities
|
|
547.2
|
|
206.9
|
|
518.4
|
|
(493.3
|
)
|
779.2
|
|
|
Deferred income
taxes
|
|
45.6
|
|
(28.8
|
)
|
1.0
|
|
(3.3
|
)
|
14.5
|
|
|
Current portion
of long-term debt
|
|
22.3
|
|
1.9
|
|
13.3
|
|
—
|
|
37.5
|
|
|
Total
current liabilities
|
|
721.4
|
|
623.7
|
|
1,395.6
|
|
(913.1
|
)
|
1,827.6
|
|
|
|
|
|
|
|
|
|
|
|
|
|
|
|
Long-term debt
|
|
5,359.1
|
|
391.8
|
|
48.7
|
|
—
|
|
5,799.6
|
|
|
Long-term debt to
affiliates
|
|
518.0
|
|
2,327.5
|
|
2,324.1
|
|
(4,715.0
|
)
|
454.6
|
|
|
Deferred income
taxes
|
|
(34.2
|
)
|
33.8
|
|
180.6
|
|
—
|
|
180.2
|
|
|
Other noncurrent
liabilities
|
|
159.7
|
|
201.3
|
|
353.1
|
|
(1.8
|
)
|
712.3
|
|
|
Total
liabilities
|
|
6,724.0
|
|
3,578.1
|
|
4,302.1
|
|
(5,629.9
|
)
|
8,974.3
|
|
|
|
|
|
|
|
|
|
|
|
|
|
|
|
Minority
interest in consolidated subsidiaries
|
|
—
|
|
91.3
|
|
11.2
|
|
(65.8
|
)
|
36.7
|
|
|
Members’
equity:
|
|
|
|
|
|
|
|
|
|
|
|
|
Members’ equity
|
|
1,524.1
|
|
2,630.2
|
|
1,576.5
|
|
(4,206.7
|
)
|
1,524.1
|
|
|
Subsidiary
preferred stock
|
|
—
|
|
70.6
|
|
1.4
|
|
(72.0
|
)
|
—
|
|
|
(Accumulated
deficit) retained earnings
|
|
(1,504.7
|
)
|
105.9
|
|
(118.6
|
)
|
12.7
|
|
(1,504.7
|
)
|
|
Accumulated other
comprehensive income (loss)
|
|
144.0
|
|
356.1
|
|
(2.6
|
)
|
(353.5
|
)
|
144.0
|
|
|
Total
members’ equity
|
|
163.4
|
|
3,162.8
|
|
1,456.7
|
|
(4,619.5
|
)
|
163.4
|
|
|
|
|
|
|
|
|
|
|
|
|
|
|
|
Total
liabilities and members’ equity
|
|
$
|
6,887.4
|
|
$
|
6,832.2
|
|
$
|
5,770.0
|
|
$
|
(10,315.2
|
)
|
$
|
9,174.4
|
|
F-53
HUNTSMAN
INTERNATIONAL LLC AND SUBSIDIARIES
CONDENSED CONSOLIDATING STATEMENT
OF OPERATIONS
YEAR ENDED DECEMBER 31, 2005
(Dollars in Millions)
|
|
|
Parent
Company
|
|
Guarantors
|
|
Non-
guarantors
|
|
Eliminations
|
|
Consolidated
Huntsman
International
LLC
|
|
|
Revenues:
|
|
|
|
|
|
|
|
|
|
|
|
|
Trade sales,
services and fees
|
|
$
|
1,364.0
|
|
$
|
4,737.3
|
|
$
|
6,756.3
|
|
$
|
—
|
|
$
|
12,857.6
|
|
|
Related party
sales
|
|
248.9
|
|
255.9
|
|
966.7
|
|
(1,367.5
|
)
|
104.0
|
|
|
Total
revenues
|
|
1,612.9
|
|
4,993.2
|
|
7,723.0
|
|
(1,367.5
|
)
|
12,961.6
|
|
|
Cost of
goods sold
|
|
1,290.5
|
|
4,445.7
|
|
6,815.5
|
|
(1,361.3
|
)
|
11,190.4
|
|
|
|
|
|
|
|
|
|
|
|
|
|
|
|
Gross
profit
|
|
322.4
|
|
547.5
|
|
907.5
|
|
(6.2
|
)
|
1,771.2
|
|
|
Selling, general
and administrative
|
|
117.8
|
|
158.4
|
|
402.2
|
|
(0.7
|
)
|
677.7
|
|
|
Research and
development
|
|
34.9
|
|
26.0
|
|
34.6
|
|
—
|
|
95.5
|
|
|
Other operating
(income) expense
|
|
(26.3
|
)
|
6.7
|
|
61.8
|
|
—
|
|
42.2
|
|
|
Restructuring,
impairment and plant closing costs
|
|
5.0
|
|
23.7
|
|
94.9
|
|
—
|
|
123.6
|
|
|
|
|
|
|
|
|
|
|
|
|
|
|
|
Operating
income
|
|
191.0
|
|
332.7
|
|
314.0
|
|
(5.5
|
)
|
832.2
|
|
|
Interest expense,
net
|
|
(220.7
|
)
|
(67.9
|
)
|
(137.0
|
)
|
—
|
|
(425.6
|
)
|
|
Gain (loss) on
accounts receivable securitization program
|
|
15.7
|
|
(2.8
|
)
|
(23.6
|
)
|
—
|
|
(10.7
|
)
|
|
Equity in income
of affiliates and subsidiaries
|
|
273.5
|
|
167.7
|
|
8.2
|
|
(441.2
|
)
|
8.2
|
|
|
Other (expense)
income
|
|
(119.7
|
)
|
(54.1
|
)
|
11.4
|
|
(5.1
|
)
|
(167.5
|
)
|
|
Income
from continuing operations before income taxes, minority interest and
accounting changes
|
|
139.8
|
|
375.6
|
|
173.0
|
|
(451.8
|
)
|
236.6
|
|
|
Income tax
benefit (expense)
|
|
25.0
|
|
(28.0
|
)
|
(39.8
|
)
|
—
|
|
(42.8
|
)
|
|
Minority interest
expense
|
|
—
|
|
(20.0
|
)
|
(0.8
|
)
|
19.1
|
|
(1.7
|
)
|
|
Income
from continuing operations
|
|
164.8
|
|
327.6
|
|
132.4
|
|
(432.7
|
)
|
192.1
|
|
|
Loss from
discontinued operations (including loss on disposal of $36.4), net of tax
|
|
(43.9
|
)
|
—
|
|
—
|
|
—
|
|
(43.9
|
)
|
|
Cumulative effect
of changes in accounting principle, net of tax
|
|
(0.2
|
)
|
(2.0
|
)
|
(25.3
|
)
|
—
|
|
(27.5
|
)
|
|
Net
income
|
|
$
|
120.7
|
|
$
|
325.6
|
|
$
|
107.1
|
|
$
|
(432.7
|
)
|
$
|
120.7
|
|
F-54
HUNTSMAN
INTERNATIONAL LLC AND SUBSIDIARIES
CONDENSED CONSOLIDATING STATEMENT
OF OPERATIONS
YEAR ENDED DECEMBER 31, 2004
(Dollars in Millions)
|
|
|
Parent
Company
|
|
Guarantors
|
|
Non-
guarantors
|
|
Eliminations
|
|
Consolidated
Huntsman
International
LLC
|
|
|
Revenues:
|
|
|
|
|
|
|
|
|
|
|
|
|
Trade sales,
services and fees
|
|
$
|
1,177.8
|
|
$
|
3,893.8
|
|
$
|
6,059.7
|
|
$
|
247.2
|
|
$
|
11,378.5
|
|
|
Related party
sales
|
|
181.3
|
|
509.3
|
|
137.9
|
|
(780.6
|
)
|
47.9
|
|
|
Total
revenues
|
|
1,359.1
|
|
4,403.1
|
|
6,197.6
|
|
(533.4
|
)
|
11,426.4
|
|
|
Cost of
goods sold
|
|
1,126.6
|
|
4,012.3
|
|
5,406.9
|
|
(520.7
|
)
|
10,025.1
|
|
|
|
|
|
|
|
|
|
|
|
|
|
|
|
Gross
profit
|
|
232.5
|
|
390.8
|
|
790.7
|
|
(12.7
|
)
|
1,401.3
|
|
|
Selling, general
and administrative
|
|
78.3
|
|
179.5
|
|
416.1
|
|
(21.4
|
)
|
652.5
|
|
|
Research and
development
|
|
32.2
|
|
27.3
|
|
36.6
|
|
—
|
|
96.1
|
|
|
Other operating
income
|
|
(9.1
|
)
|
(30.1
|
)
|
(41.8
|
)
|
—
|
|
(81.0
|
)
|
|
Restructuring,
impairment and plant closing costs
|
|
2.4
|
|
14.3
|
|
282.6
|
|
—
|
|
299.3
|
|
|
|
|
|
|
|
|
|
|
|
|
|
|
|
Operating
income
|
|
128.7
|
|
199.8
|
|
97.2
|
|
8.7
|
|
434.4
|
|
|
Interest expense,
net
|
|
(369.0
|
)
|
(46.7
|
)
|
(176.9
|
)
|
—
|
|
(592.6
|
)
|
|
Gain (loss) on
accounts receivable securitization program
|
|
3.6
|
|
(2.0
|
)
|
(17.2
|
)
|
—
|
|
(15.6
|
)
|
|
Equity in income
(loss) of affiliates and subsidiaries
|
|
68.7
|
|
(21.4
|
)
|
3.9
|
|
(47.2
|
)
|
4.0
|
|
|
Other (expense)
income
|
|
(35.0
|
)
|
9.9
|
|
5.8
|
|
(6.5
|
)
|
(25.8
|
)
|
|
(Loss)
income from continuing operations before income taxes, minority interest and
accounting changes
|
|
(203.0
|
)
|
139.6
|
|
(87.2
|
)
|
(45.0
|
)
|
(195.6
|
)
|
|
Income tax
benefit (expense)
|
|
23.1
|
|
(52.9
|
)
|
52.7
|
|
—
|
|
22.9
|
|
|
Minority interest
expense
|
|
—
|
|
(10.5
|
)
|
(1.0
|
)
|
4.3
|
|
(7.2
|
)
|
|
(Loss)
income from continuing operations
|
|
(179.9
|
)
|
76.2
|
|
(35.5
|
)
|
(40.7
|
)
|
(179.9
|
)
|
|
Loss from
discontinued operations, net of tax
|
|
(7.8
|
)
|
—
|
|
—
|
|
—
|
|
(7.8
|
)
|
|
Net
(loss) income
|
|
$
|
(187.7
|
)
|
$
|
76.2
|
|
$
|
(35.5
|
)
|
$
|
(40.7
|
)
|
$
|
(187.7
|
)
|
F-55
HUNTSMAN INTERNATIONAL LLC AND
SUBSIDIARIES
CONDENSED CONSOLIDATING STATEMENT
OF OPERATIONS
YEAR ENDED DECEMBER 31, 2003
(Dollars in Millions)
|
|
|
Parent
Company
|
|
Guarantors
|
|
Non-
guarantors
|
|
Eliminations
|
|
Consolidated
Huntsman
International
LLC
|
|
|
Revenues:
|
|
|
|
|
|
|
|
|
|
|
|
|
Trade sales,
services and fees
|
|
$
|
842.8
|
|
$
|
2,303.9
|
|
$
|
4,320.8
|
|
$
|
23.9
|
|
$
|
7,491.4
|
|
|
Related party
sales
|
|
140.2
|
|
236.9
|
|
204.8
|
|
(427.0
|
)
|
154.9
|
|
|
Total
revenues
|
|
983.0
|
|
2,540.8
|
|
4,525.6
|
|
(403.1
|
)
|
7,646.3
|
|
|
Cost of
goods sold
|
|
811.6
|
|
2,350.4
|
|
4,100.6
|
|
(426.4
|
)
|
6,836.2
|
|
|
|
|
|
|
|
|
|
|
|
|
|
|
|
Gross
profit
|
|
171.4
|
|
190.4
|
|
425.0
|
|
23.3
|
|
810.1
|
|
|
Selling, general
and administrative
|
|
125.7
|
|
69.4
|
|
291.8
|
|
23.2
|
|
510.1
|
|
|
Research and
development
|
|
37.7
|
|
17.3
|
|
31.8
|
|
—
|
|
86.8
|
|
|
Other operating
(income) expense
|
|
(66.5
|
)
|
(12.9
|
)
|
0.9
|
|
—
|
|
(78.5
|
)
|
|
Restructuring,
impairment and plant closing (credits) costs
|
|
—
|
|
(1.5
|
)
|
56.5
|
|
—
|
|
55.0
|
|
|
|
|
|
|
|
|
|
|
|
|
|
|
|
Operating
income
|
|
74.5
|
|
118.1
|
|
44.0
|
|
0.1
|
|
236.7
|
|
|
Interest
(expense) income, net
|
|
(374.9
|
)
|
50.0
|
|
(155.6
|
)
|
—
|
|
(480.5
|
)
|
|
(Loss) gain on
accounts receivable securitization program
|
|
(64.3
|
)
|
(2.8
|
)
|
34.7
|
|
—
|
|
(32.4
|
)
|
|
Equity in income
(loss) of affiliates and subsidiaries
|
|
37.0
|
|
(104.8
|
)
|
1.6
|
|
67.9
|
|
1.7
|
|
|
Other (expense)
income
|
|
(4.4
|
)
|
13.6
|
|
(7.7
|
)
|
(2.2
|
)
|
(0.7
|
)
|
|
(Loss)
income from continuing operations before income taxes, minority interest and
accounting changes
|
|
(332.1
|
)
|
74.1
|
|
(83.0
|
)
|
65.8
|
|
(275.2
|
)
|
|
Income tax
benefit (expense)
|
|
17.4
|
|
(25.1
|
)
|
(33.3
|
)
|
—
|
|
(41.0
|
)
|
|
Minority interest
(expense) income
|
|
—
|
|
(0.6
|
)
|
—
|
|
2.1
|
|
1.5
|
|
|
(Loss)
income from continuing operations
|
|
(314.7
|
)
|
48.4
|
|
(116.3
|
)
|
67.9
|
|
(314.7
|
)
|
|
Loss from
discontinued operations, net of tax
|
|
(2.6
|
)
|
—
|
|
—
|
|
—
|
|
(2.6
|
)
|
|
Net
(loss) income
|
|
$
|
(317.3
|
)
|
$
|
48.4
|
|
$
|
(116.3
|
)
|
$
|
67.9
|
|
$
|
(317.3
|
)
|
F-56
HUNTSMAN INTERNATIONAL LLC AND
SUBSIDIARIES
CONDENSED CONSOLIDATING STATEMENT
OF CASH FLOWS
YEAR ENDED DECEMBER 31, 2005
(Dollars in Millions)
|
|
|
Parent
Company
|
|
Guarantors
|
|
Non-
Guarantors
|
|
Eliminations
|
|
Consolidated
Huntsman
International
LLC
|
|
|
Net cash
provided by operating activities
|
|
288.0
|
|
456.0
|
|
255.5
|
|
(11.2
|
)
|
988.3
|
|
|
|
|
|
|
|
|
|
|
|
|
|
|
|
Investing
activities:
|
|
|
|
|
|
|
|
|
|
|
|
|
Capital
expenditures
|
|
(32.9
|
)
|
(70.2
|
)
|
(235.6
|
)
|
—
|
|
(338.7
|
)
|
|
Investment in
affiliates, net
|
|
(114.0
|
)
|
(10.3
|
)
|
(8.0
|
)
|
124.3
|
|
(8.0
|
)
|
|
Proceeds from
sale of assets
|
|
6.4
|
|
7.1
|
|
4.7
|
|
—
|
|
18.2
|
|
|
Net cash received
from affiliates
|
|
—
|
|
4.5
|
|
1.7
|
|
—
|
|
6.2
|
|
|
Change in
restricted cash
|
|
0.3
|
|
8.6
|
|
—
|
|
—
|
|
8.9
|
|
|
Other, net
|
|
—
|
|
(1.6
|
)
|
(1.3
|
)
|
—
|
|
(2.9
|
)
|
|
Net cash
used in investing activities
|
|
(140.2
|
)
|
(61.9
|
)
|
(238.5
|
)
|
124.3
|
|
(316.3
|
)
|
|
|
|
|
|
|
|
|
|
|
|
|
|
|
Financing
activities:
|
|
|
|
|
|
|
|
|
|
|
|
|
Net (repayment)
borrowings under revolving loan facilities
|
|
(125.0
|
)
|
—
|
|
6.3
|
|
—
|
|
(118.7
|
)
|
|
Repayment of
long-term debt
|
|
(3,004.6
|
)
|
(453.3
|
)
|
(3.2
|
)
|
—
|
|
(3,461.1
|
)
|
|
Proceeds from
long-term debt
|
|
2,203.6
|
|
—
|
|
31.4
|
|
—
|
|
2,235.0
|
|
|
Call premiums
related to early extinguishment of debt
|
|
(64.2
|
)
|
(50.8
|
)
|
10.3
|
|
—
|
|
(104.7
|
)
|
|
Payments on notes
payable
|
|
(30.5
|
)
|
(1.9
|
)
|
0.8
|
|
—
|
|
(31.6
|
)
|
|
Debt issuance
costs paid
|
|
(16.9
|
)
|
(0.4
|
)
|
—
|
|
—
|
|
(17.3
|
)
|
|
Dividend to
parent for acquisition of minority interest
|
|
(124.8
|
)
|
—
|
|
—
|
|
—
|
|
(124.8
|
)
|
|
Contribution from
parent
|
|
837.6
|
|
—
|
|
—
|
|
—
|
|
837.6
|
|
|
Intercompany
advances, net of repayments
|
|
179.7
|
|
116.0
|
|
(172.9
|
)
|
(122.8
|
)
|
—
|
|
|
Dividends paid
|
|
—
|
|
(9.7
|
)
|
—
|
|
9.7
|
|
—
|
|
|
Other, net
|
|
—
|
|
(0.1
|
)
|
5.0
|
|
—
|
|
4.9
|
|
|
Net cash
(used in) provided by financing activities
|
|
(145.1
|
)
|
(400.2
|
)
|
(122.3
|
)
|
(113.1
|
)
|
(780.7
|
)
|
|
|
|
|
|
|
|
|
|
|
|
|
|
|
Effect of
exchange rate changes on cash
|
|
—
|
|
—
|
|
(2.3
|
)
|
—
|
|
(2.3
|
)
|
|
|
|
|
|
|
|
|
|
|
|
|
|
|
Increase
(decrease) in cash and cash equivalents
|
|
2.7
|
|
(6.1
|
)
|
(107.6
|
)
|
—
|
|
(111.0
|
)
|
|
Cash and cash
equivalents at beginning of period
|
|
7.3
|
|
14.0
|
|
222.2
|
|
—
|
|
243.5
|
|
|
Cash and cash
equivalents at end of period
|
|
$
|
10.0
|
|
$
|
7.9
|
|
$
|
114.6
|
|
$
|
—
|
|
$
|
132.5
|
|
|
|
|
|
|
|
|
|
|
|
|
|
|
|
|
|
|
F-57
HUNTSMAN INTERNATIONAL LLC AND
SUBSIDIARIES
CONDENSED CONSOLIDATING STATEMENT
OF CASH FLOWS
YEAR ENDED DECEMBER 31, 2004
(Dollars in Millions)
|
|
|
Parent
Company
|
|
Guarantors
|
|
Non-
Guarantors
|
|
Eliminations
|
|
Consolidated
Huntsman
International
LLC
|
|
|
Net cash
(used in) provided by operating activities
|
|
(334.1
|
)
|
452.0
|
|
71.2
|
|
(7.5
|
)
|
181.6
|
|
|
|
|
|
|
|
|
|
|
|
|
|
|
|
Investing
activities:
|
|
|
|
|
|
|
|
|
|
|
|
|
Capital
expenditures
|
|
(22.8
|
)
|
(60.8
|
)
|
(143.0
|
)
|
—
|
|
(226.6
|
)
|
|
Investment in
affiliates, net
|
|
—
|
|
—
|
|
(11.8
|
)
|
—
|
|
(11.8
|
)
|
|
Proceeds from
sale of assets
|
|
0.1
|
|
—
|
|
5.1
|
|
—
|
|
5.2
|
|
|
Net cash (paid
to) received from affiliates
|
|
(2.6
|
)
|
8.6
|
|
—
|
|
—
|
|
6.0
|
|
|
Change in
restricted cash
|
|
0.6
|
|
1.0
|
|
—
|
|
—
|
|
1.6
|
|
|
Other, net
|
|
—
|
|
2.2
|
|
0.4
|
|
—
|
|
2.6
|
|
|
Net cash
used in investing activities
|
|
(24.7
|
)
|
(49.0
|
)
|
(149.3
|
)
|
—
|
|
(223.0
|
)
|
|
|
|
|
|
|
|
|
|
|
|
|
|
|
Financing
activities:
|
|
|
|
|
|
|
|
|
|
|
|
|
Net borrowings
under revolving loan facilities
|
|
90.8
|
|
—
|
|
23.0
|
|
—
|
|
113.8
|
|
|
Repayment of
long-term debt
|
|
(2,701.1
|
)
|
(37.7
|
)
|
(84.0
|
)
|
—
|
|
(2,822.8
|
)
|
|
Proceeds from
long-term debt
|
|
2,839.1
|
|
—
|
|
30.7
|
|
—
|
|
2,869.8
|
|
|
Call premiums
related to early extinguishment of debt
|
|
(17.0
|
)
|
—
|
|
—
|
|
—
|
|
(17.0
|
)
|
|
Payments on notes
payable
|
|
(19.6
|
)
|
—
|
|
—
|
|
—
|
|
(19.6
|
)
|
|
Net repayments of
overdraft facility
|
|
(7.5
|
)
|
(0.9
|
)
|
(2.2
|
)
|
—
|
|
(10.6
|
)
|
|
Debt issuance
costs paid
|
|
(35.6
|
)
|
—
|
|
—
|
|
—
|
|
(35.6
|
)
|
|
Intercompany
advances, net of repayments
|
|
199.6
|
|
(355.9
|
)
|
156.3
|
|
—
|
|
—
|
|
|
Dividends paid
|
|
—
|
|
(4.9
|
)
|
(2.6
|
)
|
7.5
|
|
—
|
|
|
Other, net
|
|
—
|
|
—
|
|
5.4
|
|
—
|
|
5.4
|
|
|
Net cash
provided by (used in) financing activities
|
|
348.7
|
|
(399.4
|
)
|
126.6
|
|
7.5
|
|
83.4
|
|
|
|
|
|
|
|
|
|
|
|
|
|
|
|
Effect of
exchange rate changes on cash
|
|
—
|
|
(0.9
|
)
|
12.0
|
|
—
|
|
11.1
|
|
|
|
|
|
|
|
|
|
|
|
|
|
|
|
(Decrease)
increase in cash and cash equivalents
|
|
(10.1
|
)
|
2.7
|
|
60.5
|
|
—
|
|
53.1
|
|
|
Cash and cash
equivalents at beginning of period
|
|
17.4
|
|
11.3
|
|
161.7
|
|
—
|
|
190.4
|
|
|
Cash and cash
equivalents at end of period
|
|
$
|
7.3
|
|
$
|
14.0
|
|
$
|
222.2
|
|
$
|
—
|
|
$
|
243.5
|
|
|
|
|
|
|
|
|
|
|
|
|
|
|
|
|
|
|
F-58
HUNTSMAN INTERNATIONAL LLC AND
SUBSIDIARIES
CONDENSED CONSOLIDATING STATEMENT
OF CASH FLOWS
YEAR
ENDED DECEMBER 31, 2003
(Dollars
in Millions)
|
|
|
Parent
Company
|
|
Guarantors
|
|
Non-
Guarantors
|
|
Eliminations
|
|
Consolidated
Huntsman
International
LLC
|
|
|
Net cash
(used in) provided by operating activities
|
|
$
|
(168.5
|
)
|
$
|
290.4
|
|
$
|
98.0
|
|
$
|
(4.0
|
)
|
$
|
215.9
|
|
|
|
|
|
|
|
|
|
|
|
|
|
|
|
Investing
activities:
|
|
|
|
|
|
|
|
|
|
|
|
|
Capital
expenditures
|
|
(17.9
|
)
|
(60.6
|
)
|
(126.3
|
)
|
—
|
|
(204.8
|
)
|
|
Proceeds from
sale of assets
|
|
—
|
|
0.2
|
|
—
|
|
—
|
|
0.2
|
|
|
Acquisition of
business, net of cash acquired
|
|
0.3
|
|
(431.7
|
)
|
53.5
|
|
—
|
|
(377.9
|
)
|
|
Purchase of
Vantico senior notes
|
|
—
|
|
(22.7
|
)
|
—
|
|
—
|
|
(22.7
|
)
|
|
Net cash (paid
to) received from affiliates
|
|
(9.1
|
)
|
0.8
|
|
—
|
|
—
|
|
(8.3
|
)
|
|
Investment in
affiliates, net
|
|
6.1
|
|
—
|
|
(6.1
|
)
|
—
|
|
—
|
|
|
Change in
restricted cash
|
|
(0.8
|
)
|
(0.6
|
)
|
—
|
|
—
|
|
(1.4
|
)
|
|
Other, net
|
|
—
|
|
(2.3
|
)
|
0.1
|
|
—
|
|
(2.2
|
)
|
|
Net cash
used in investing activities
|
|
(21.4
|
)
|
(516.9
|
)
|
(78.8
|
)
|
—
|
|
(617.1
|
)
|
|
|
|
|
|
|
|
|
|
|
|
|
|
|
Financing
activities:
|
|
|
|
|
|
|
|
|
|
|
|
|
Net repayment
under revolving loan facilities
|
|
(168.3
|
)
|
—
|
|
—
|
|
—
|
|
(168.3
|
)
|
|
Repayment of
long-term debt
|
|
(593.2
|
)
|
(1.2
|
)
|
(8.0
|
)
|
—
|
|
(602.4
|
)
|
|
Proceeds from
long term debt
|
|
813.4
|
|
—
|
|
—
|
|
—
|
|
813.4
|
|
|
Issuance of
senior secured notes
|
|
—
|
|
348.0
|
|
—
|
|
—
|
|
348.0
|
|
|
Cost of raising
equity capital
|
|
—
|
|
(10.4
|
)
|
0.3
|
|
—
|
|
(10.1
|
)
|
|
Payment on notes
payable
|
|
—
|
|
—
|
|
(1.0
|
)
|
—
|
|
(1.0
|
)
|
|
Net borrowings (repayment)
of overdraft facility
|
|
7.5
|
|
—
|
|
(2.3
|
)
|
—
|
|
5.2
|
|
|
Debt issuance
costs paid
|
|
(30.1
|
)
|
(14.4
|
)
|
—
|
|
—
|
|
(44.5
|
)
|
|
Intercompany
advances, net of repayments
|
|
91.8
|
|
(183.9
|
)
|
92.1
|
|
—
|
|
—
|
|
|
Dividends paid
|
|
—
|
|
(4.0
|
)
|
—
|
|
4.0
|
|
—
|
|
|
Contribution from
parent
|
|
—
|
|
164.4
|
|
—
|
|
—
|
|
164.4
|
|
|
Other, net
|
|
—
|
|
—
|
|
2.7
|
|
—
|
|
2.7
|
|
|
Net cash
provided by financing activities
|
|
121.1
|
|
298.5
|
|
83.8
|
|
4.0
|
|
507.4
|
|
|
|
|
|
|
|
|
|
|
|
|
|
|
|
Effect of
exchange rate changes on cash
|
|
—
|
|
(1.1
|
)
|
9.9
|
|
—
|
|
8.8
|
|
|
|
|
|
|
|
|
|
|
|
|
|
|
|
(Decrease)
increase in cash and cash equivalents
|
|
(68.8
|
)
|
70.9
|
|
112.9
|
|
—
|
|
115.0
|
|
|
Cash and cash
equivalents at beginning of period
|
|
86.2
|
|
(59.6
|
)
|
48.8
|
|
—
|
|
75.4
|
|
|
Cash and cash
equivalents at end of period
|
|
$
|
17.4
|
|
$
|
11.3
|
|
$
|
161.7
|
|
$
|
—
|
|
$
|
190.4
|
|
F-59
30. Condensed Consolidating Financial Statements – Huntsman
Advanced Materials LLC
On December 20, 2005, in connection with the AdMat
Minority Interest Transaction, we redeemed all of AdMat’s outstanding $250
million 11% senior secured fixed rate notes due 2010 and paid $35.6 million in
call premiums. Also during 2005, we redeemed all of AdMat’s remaining $100.0
million secured floating rate notes due 2008 and paid $6.0 million in call
premiums. See “Note 14 Long-Term Debt” Prior to the AdMat Minority Interest
Transaction, we fully and unconditionally guaranteed the AdMat secured notes.
In connection with the AdMat Minority Interest
Transaction, AdMat and its U.S. subsidiaries that had previously guaranteed the
AdMat secured notes (the “AdMat Guarantors”) executed supplemental indentures
to guarantee all of our outstanding debt securities. The following condensed
consolidating financial statements present, in separate columns, financial
information for the following: Huntsman International LLC (on a parent only
basis), with its investment in subsidiaries recorded under the equity method;
Huntsman Advanced Materials LLC (the Issuer Company); the AdMat Guarantors on a
combined, and where appropriate, consolidated basis; and the AdMat
non-guarantors on a combined, and where appropriate, consolidated basis.
Additional columns present eliminating adjustments and consolidated totals as
of December 31, 2005 and December 31, 2004 and for the years ended December 31,
2005, 2004, and 2003. There were no contractual restrictions limiting transfers
of cash from guarantor subsidiaries to AdMat. Each of the AdMat Guarantors is
100% owned by us and had fully and unconditionally guaranteed the AdMat secured
notes on a joint and several basis.
F-60
HUNTSMAN INTERNATIONAL LLC AND
SUBSIDIARIES
CONDENSED CONSOLIDATING BALANCE
SHEET
AS OF
DECEMBER 31, 2005
(Dollars
in Millions)
|
|
|
Parent Company
|
|
Issuer Company
|
|
Guarantors
|
|
Non- guarantors
|
|
Eliminations
|
|
Consolidated
Huntsman
International LLC
|
|
|
ASSETS
|
|
|
|
|
|
|
|
|
|
|
|
|
|
|
Current assets:
|
|
|
|
|
|
|
|
|
|
|
|
|
|
|
Cash and cash equivalents
|
|
$
|
10.0
|
|
$
|
2.3
|
|
$
|
6.3
|
|
$
|
113.9
|
|
$
|
—
|
|
$
|
132.5
|
|
|
Accounts and notes receivables, net
|
|
88.6
|
|
1.6
|
|
41.4
|
|
1,343.6
|
|
—
|
|
1,475.2
|
|
|
Accounts receivable from affiliates
|
|
523.4
|
|
2.8
|
|
176.7
|
|
1,246.5
|
|
(1,939.0
|
)
|
10.4
|
|
|
Inventories, net
|
|
129.7
|
|
1.9
|
|
50.3
|
|
1,128.1
|
|
(0.8
|
)
|
1,309.2
|
|
|
Prepaid expenses
|
|
3.6
|
|
—
|
|
1.4
|
|
55.1
|
|
(14.2
|
)
|
45.9
|
|
|
Deferred income taxes
|
|
45.5
|
|
—
|
|
0.7
|
|
(14.8
|
)
|
(0.2
|
)
|
31.2
|
|
|
Other current assets
|
|
27.7
|
|
—
|
|
4.4
|
|
37.8
|
|
—
|
|
69.9
|
|
|
Total current assets
|
|
828.5
|
|
8.6
|
|
281.2
|
|
3,910.2
|
|
(1,954.2
|
)
|
3,074.3
|
|
|
|
|
|
|
|
|
|
|
|
|
|
|
|
|
|
Property, plant and
equipment, net
|
|
559.3
|
|
10.6
|
|
273.7
|
|
3,489.9
|
|
3.2
|
|
4,336.7
|
|
|
Investment in affiliates
|
|
3,521.8
|
|
262.2
|
|
427.1
|
|
509.6
|
|
(4,545.1
|
)
|
175.6
|
|
|
Intangible assets, net
|
|
170.4
|
|
(14.7
|
)
|
19.8
|
|
46.5
|
|
—
|
|
222.0
|
|
|
Goodwill
|
|
—
|
|
88.0
|
|
—
|
|
3.2
|
|
—
|
|
91.2
|
|
|
Deferred income taxes
|
|
—
|
|
5.2
|
|
37.1
|
|
51.9
|
|
—
|
|
94.2
|
|
|
Receivables from affiliates
|
|
2,204.1
|
|
146.5
|
|
262.9
|
|
170.4
|
|
(2,780.9
|
)
|
3.0
|
|
|
Other noncurrent assets
|
|
90.1
|
|
2.1
|
|
3.0
|
|
540.9
|
|
(0.1
|
)
|
636.0
|
|
|
Total assets
|
|
$
|
7,374.2
|
|
$
|
508.5
|
|
$
|
1,304.8
|
|
$
|
8,722.6
|
|
$
|
(9,277.1
|
)
|
$
|
8,633.0
|
|
|
|
|
|
|
|
|
|
|
|
|
|
|
|
|
|
LIABILITIES AND MEMBERS’ EQUITY
|
|
|
|
|
|
|
|
|
|
|
|
|
|
|
Current liabilities:
|
|
|
|
|
|
|
|
|
|
|
|
|
|
|
Accounts payable
|
|
$
|
78.7
|
|
$
|
—
|
|
$
|
30.8
|
|
$
|
983.2
|
|
$
|
—
|
|
$
|
1,092.7
|
|
|
Accounts payable to affiliates
|
|
1,214.8
|
|
77.6
|
|
34.2
|
|
621.0
|
|
(1,938.9
|
)
|
8.7
|
|
|
Accrued liabilities
|
|
188.3
|
|
36.9
|
|
34.0
|
|
407.2
|
|
65.9
|
|
732.3
|
|
|
Deferred income taxes
|
|
—
|
|
5.2
|
|
1.1
|
|
76.4
|
|
(80.3
|
)
|
2.4
|
|
|
Current portion of long-term debt
|
|
20.3
|
|
0.9
|
|
—
|
|
23.4
|
|
—
|
|
44.6
|
|
|
Total current liabilities
|
|
1,502.1
|
|
120.6
|
|
100.1
|
|
2,111.2
|
|
(1,953.3
|
)
|
1,880.7
|
|
|
|
|
|
|
|
|
|
|
|
|
|
|
|
|
|
Long-term debt
|
|
4,290.6
|
|
—
|
|
—
|
|
122.7
|
|
—
|
|
4,413.3
|
|
|
Long-term debt to affiliates
|
|
67.5
|
|
—
|
|
286.3
|
|
2,427.1
|
|
(2,780.9
|
)
|
—
|
|
|
Deferred income taxes
|
|
45.5
|
|
0.3
|
|
14.5
|
|
156.6
|
|
—
|
|
216.9
|
|
|
Other noncurrent liabilities
|
|
136.8
|
|
0.5
|
|
97.5
|
|
535.2
|
|
—
|
|
770.0
|
|
|
Total liabilities
|
|
6,042.5
|
|
121.4
|
|
498.4
|
|
5,352.8
|
|
(4,734.2
|
)
|
7,280.9
|
|
|
|
|
|
|
|
|
|
|
|
|
|
|
|
|
|
Minority interest in consolidated subsidiaries
|
|
—
|
|
—
|
|
—
|
|
97.2
|
|
(76.8
|
)
|
20.4
|
|
|
Members’ equity:
|
|
|
|
|
|
|
|
|
|
|
|
|
|
|
Members’ equity
|
|
2,794.0
|
|
426.9
|
|
847.2
|
|
2,875.1
|
|
(4,149.2
|
)
|
2,794.0
|
|
|
Subsidiary preferred stock
|
|
—
|
|
—
|
|
—
|
|
72.0
|
|
(72.0
|
)
|
—
|
|
|
(Accumulated deficit) retained earnings
|
|
(1,384.0
|
)
|
(18.4
|
)
|
(22.4
|
)
|
259.0
|
|
(218.2
|
)
|
(1,384.0
|
)
|
|
Accumulated other comprehensive (loss) income
|
|
(78.3
|
)
|
(21.4
|
)
|
(18.4
|
)
|
66.5
|
|
(26.7
|
)
|
(78.3
|
)
|
|
Total members’ equity
|
|
1,331.7
|
|
387.1
|
|
806.4
|
|
3,272.6
|
|
(4,466.1
|
)
|
1,331.7
|
|
|
Total liabilities and members’ equity
|
|
$
|
7,374.2
|
|
$
|
508.5
|
|
$
|
1,304.8
|
|
$
|
8,722.6
|
|
$
|
(9,277.1
|
)
|
$
|
8,633.0
|
|
F-61
HUNTSMAN INTERNATIONAL LLC AND
SUBSIDIARIES
CONDENSED CONSOLIDATING BALANCE
SHEET
AS OF
DECEMBER 31, 2004
(Dollars
in Millions)
|
|
|
Parent Company
|
|
Issuer Company
|
|
Guarantors
|
|
Non- guarantors
|
|
Eliminations
|
|
Consolidated
Huntsman
International
LLC
|
|
|
ASSETS
|
|
|
|
|
|
|
|
|
|
|
|
|
|
|
Current assets:
|
|
|
|
|
|
|
|
|
|
|
|
|
|
|
Cash and cash equivalents
|
|
$
|
7.3
|
|
$
|
4.6
|
|
$
|
70.8
|
|
$
|
160.8
|
|
$
|
—
|
|
$
|
243.5
|
|
|
Restricted cash
|
|
0.3
|
|
—
|
|
—
|
|
8.6
|
|
—
|
|
8.9
|
|
|
Accounts and notes receivables, net
|
|
77.5
|
|
—
|
|
52.9
|
|
1,455.1
|
|
0.3
|
|
1,585.8
|
|
|
Accounts receivable from affiliates
|
|
93.4
|
|
76.7
|
|
228.0
|
|
279.4
|
|
(667.1
|
)
|
10.4
|
|
|
Inventories, net
|
|
122.4
|
|
—
|
|
47.1
|
|
1,085.4
|
|
(1.0
|
)
|
1,253.9
|
|
|
Prepaid expenses
|
|
3.9
|
|
—
|
|
—
|
|
56.9
|
|
(15.7
|
)
|
45.1
|
|
|
Deferred income taxes
|
|
—
|
|
—
|
|
—
|
|
11.9
|
|
—
|
|
11.9
|
|
|
Other current assets
|
|
57.6
|
|
0.1
|
|
8.9
|
|
11.9
|
|
(53.6
|
)
|
24.9
|
|
|
Total current assets
|
|
362.4
|
|
81.4
|
|
407.7
|
|
3,070.0
|
|
(737.1
|
)
|
3,184.4
|
|
|
|
|
|
|
|
|
|
|
|
|
|
|
|
|
|
Property, plant and equipment, net
|
|
615.5
|
|
—
|
|
329.9
|
|
3,871.9
|
|
—
|
|
4,817.3
|
|
|
Investment in affiliates
|
|
3,374.2
|
|
416.2
|
|
204.1
|
|
(1,122.0
|
)
|
(2,701.6
|
)
|
170.9
|
|
|
Intangible assets, net
|
|
199.4
|
|
(23.6
|
)
|
23.6
|
|
56.2
|
|
(2.4
|
)
|
253.2
|
|
|
Goodwill
|
|
—
|
|
—
|
|
—
|
|
3.3
|
|
—
|
|
3.3
|
|
|
Deferred income taxes
|
|
0.4
|
|
5.2
|
|
28.6
|
|
8.5
|
|
—
|
|
42.7
|
|
|
Receivables from affiliates
|
|
2,219.6
|
|
425.6
|
|
355.3
|
|
1,961.5
|
|
(4,938.4
|
)
|
23.6
|
|
|
Other noncurrent assets
|
|
115.9
|
|
13.9
|
|
—
|
|
555.7
|
|
(6.5
|
)
|
679.0
|
|
|
Total assets
|
|
$
|
6,887.4
|
|
$
|
918.7
|
|
$
|
1,349.2
|
|
$
|
8,405.1
|
|
$
|
(8,386.0
|
)
|
$
|
9,174.4
|
|
|
|
|
|
|
|
|
|
|
|
|
|
|
|
|
|
LIABILITIES AND MEMBERS’ EQUITY
|
|
|
|
|
|
|
|
|
|
|
|
|
|
|
Current liabilities:
|
|
|
|
|
|
|
|
|
|
|
|
|
|
|
Accounts payable
|
|
$
|
48.6
|
|
$
|
—
|
|
$
|
25.4
|
|
$
|
888.2
|
|
$
|
(0.1
|
)
|
$
|
962.1
|
|
|
Accounts payable to affiliates
|
|
57.7
|
|
33.6
|
|
146.9
|
|
462.9
|
|
(666.8
|
)
|
34.3
|
|
|
Accrued liabilities
|
|
547.2
|
|
25.8
|
|
51.0
|
|
219.8
|
|
(64.6
|
)
|
779.2
|
|
|
Deferred income taxes
|
|
45.6
|
|
5.3
|
|
1.0
|
|
(34.1
|
)
|
(3.3
|
)
|
14.5
|
|
|
Current portion of long-term debt
|
|
22.3
|
|
0.7
|
|
—
|
|
14.5
|
|
—
|
|
37.5
|
|
|
Total current liabilities
|
|
721.4
|
|
65.4
|
|
224.3
|
|
1,551.3
|
|
(734.8
|
)
|
1,827.6
|
|
|
|
|
|
|
|
|
|
|
|
|
|
|
|
|
|
Long-term debt
|
|
5,359.1
|
|
348.6
|
|
—
|
|
91.9
|
|
—
|
|
5,799.6
|
|
|
Long-term debt to affiliates
|
|
518.0
|
|
249.1
|
|
420.6
|
|
4,205.3
|
|
(4,938.4
|
)
|
454.6
|
|
|
Deferred income taxes
|
|
(34.2
|
)
|
—
|
|
—
|
|
214.4
|
|
—
|
|
180.2
|
|
|
Other noncurrent liabilities
|
|
159.7
|
|
—
|
|
123.7
|
|
430.7
|
|
(1.8
|
)
|
712.3
|
|
|
Total liabilities
|
|
6,724.0
|
|
663.1
|
|
768.6
|
|
6,493.6
|
|
(5,675.0
|
)
|
8,974.3
|
|
|
|
|
|
|
|
|
|
|
|
|
|
|
|
|
|
Minority interest in consolidated subsidiaries
|
|
—
|
|
—
|
|
25.5
|
|
74.6
|
|
(63.4
|
)
|
36.7
|
|
|
Members’ equity:
|
|
|
|
|
|
|
|
|
|
|
|
|
|
|
Members’ equity
|
|
1,524.1
|
|
222.1
|
|
525.6
|
|
1,499.1
|
|
(2,246.8
|
)
|
1,524.1
|
|
|
Subsidiary preferred stock
|
|
—
|
|
—
|
|
—
|
|
72.0
|
|
(72.0
|
)
|
—
|
|
|
(Accumulated deficit) retained earnings
|
|
(1,504.7
|
)
|
38.9
|
|
34.3
|
|
(91.2
|
)
|
18.0
|
|
(1,504.7
|
)
|
|
Accumulated other comprehensive income (loss)
|
|
144.0
|
|
(5.4
|
)
|
(4.8
|
)
|
357.0
|
|
(346.8
|
)
|
144.0
|
|
|
Total members’ equity
|
|
163.4
|
|
255.6
|
|
555.1
|
|
1,836.9
|
|
(2,647.6
|
)
|
163.4
|
|
|
Total liabilities and members’ equity
|
|
$
|
6,887.4
|
|
$
|
918.7
|
|
$
|
1,349.2
|
|
$
|
8,405.1
|
|
$
|
(8,386.0
|
)
|
$
|
9,174.4
|
|
F-62
HUNTSMAN INTERNATIONAL LLC AND
SUBSIDIARIES
CONDENSED CONSOLIDATING STATEMENT
OF OPERATIONS
YEAR ENDED DECEMBER 31, 2005
(Dollars in Millions)
|
|
|
Parent Company
|
|
Issuer Company
|
|
Guarantors
|
|
Non- guarantors
|
|
Eliminations
|
|
Consolidated Huntsman International LLC
|
|
|
Revenues:
|
|
|
|
|
|
|
|
|
|
|
|
|
|
|
Trade sales, services and fees
|
|
$
|
1,364.0
|
|
$
|
—
|
|
$
|
279.5
|
|
$
|
11,214.1
|
|
$
|
—
|
|
$
|
12,857.6
|
|
|
Related party sales
|
|
248.9
|
|
—
|
|
137.1
|
|
864.7
|
|
(1,146.7
|
)
|
104.0
|
|
|
Total revenues
|
|
1,612.9
|
|
—
|
|
416.6
|
|
12,078.8
|
|
(1,146.7
|
)
|
12,961.6
|
|
|
Cost of goods sold
|
|
1,290.5
|
|
0.4
|
|
340.3
|
|
10,701.4
|
|
(1,142.2
|
)
|
11,190.4
|
|
|
|
|
|
|
|
|
|
|
|
|
|
|
|
|
|
Gross profit (loss)
|
|
322.4
|
|
(0.4
|
)
|
76.3
|
|
1,377.4
|
|
(4.5
|
)
|
1,771.2
|
|
|
Selling, general and administrative
|
|
117.8
|
|
1.2
|
|
(15.5
|
)
|
574.2
|
|
—
|
|
677.7
|
|
|
Research and development
|
|
34.9
|
|
—
|
|
30.8
|
|
29.8
|
|
—
|
|
95.5
|
|
|
Other operating (income) expense
|
|
(26.3
|
)
|
(7.9
|
)
|
36.8
|
|
39.6
|
|
—
|
|
42.2
|
|
|
Restructuring, impairment and plant closing costs
|
|
5.0
|
|
—
|
|
0.3
|
|
118.3
|
|
—
|
|
123.6
|
|
|
|
|
|
|
|
|
|
|
|
|
|
|
|
|
|
Operating income
|
|
191.0
|
|
6.3
|
|
23.9
|
|
615.5
|
|
(4.5
|
)
|
832.2
|
|
|
Interest (expense) income, net
|
|
(220.7
|
)
|
(27.8
|
)
|
9.0
|
|
(186.1
|
)
|
—
|
|
(425.6
|
)
|
|
Gain (loss) on accounts receivable securitization program
|
|
15.7
|
|
—
|
|
—
|
|
(26.4
|
)
|
—
|
|
(10.7
|
)
|
|
Equity in income (loss) of affiliates and subsidiaries
|
|
273.5
|
|
44.3
|
|
(53.7
|
)
|
8.2
|
|
(264.1
|
)
|
8.2
|
|
|
Other (expense) income
|
|
(119.7
|
)
|
(52.6
|
)
|
0.2
|
|
9.8
|
|
(5.2
|
)
|
(167.5
|
)
|
|
Income (loss) from continuing operations before income taxes,
minority interest and accounting changes
|
|
139.8
|
|
(29.8
|
)
|
(20.6
|
)
|
421.0
|
|
(273.8
|
)
|
236.6
|
|
|
Income tax benefit (expense)
|
|
25.0
|
|
(27.5
|
)
|
(6.1
|
)
|
(34.2
|
)
|
—
|
|
(42.8
|
)
|
|
Minority interest expense
|
|
—
|
|
—
|
|
(0.7
|
)
|
(19.3
|
)
|
18.3
|
|
(1.7
|
)
|
|
Income (loss) from continuing operations
|
|
164.8
|
|
(57.3
|
)
|
(27.4
|
)
|
367.5
|
|
(255.5
|
)
|
192.1
|
|
|
Loss from discontinued operations (including loss on disposal of
$36.4), net of tax
|
|
(43.9
|
)
|
—
|
|
—
|
|
—
|
|
—
|
|
(43.9
|
)
|
|
Cumulative effect of changes in accounting principle, net of tax
|
|
(0.2
|
)
|
—
|
|
(0.8
|
)
|
(26.5
|
)
|
—
|
|
(27.5
|
)
|
|
Net income (loss)
|
|
$
|
120.7
|
|
$
|
(57.3
|
)
|
$
|
(28.2
|
)
|
$
|
341.0
|
|
$
|
(255.5
|
)
|
$
|
120.7
|
|
F-63
HUNTSMAN INTERNATIONAL LLC AND
SUBSIDIARIES
CONDENSED CONSOLIDATING STATEMENT
OF OPERATIONS
YEAR ENDED DECEMBER 31, 2004
(Dollars in Millions)
|
|
|
Parent
Company
|
|
Issuer
Company
|
|
Guarantors
|
|
Non-
guarantors
|
|
Eliminations
|
|
Consolidated
Huntsman
International LLC
|
|
|
Revenues:
|
|
|
|
|
|
|
|
|
|
|
|
|
|
|
Trade sales, services and fees
|
|
$
|
1,177.8
|
|
$
|
—
|
|
$
|
246.1
|
|
$
|
9,707.3
|
|
$
|
247.3
|
|
$
|
11,378.5
|
|
|
Related party sales
|
|
181.3
|
|
—
|
|
99.0
|
|
329.4
|
|
(561.8
|
)
|
47.9
|
|
|
Total revenues
|
|
1,359.1
|
|
—
|
|
345.1
|
|
10,036.7
|
|
(314.5
|
)
|
11,426.4
|
|
|
Cost of goods sold
|
|
1,126.6
|
|
—
|
|
395.4
|
|
8,809.4
|
|
(306.3
|
)
|
10,025.1
|
|
|
|
|
|
|
|
|
|
|
|
|
|
|
|
|
|
Gross profit (loss)
|
|
232.5
|
|
—
|
|
(50.3
|
)
|
1,227.3
|
|
(8.2
|
)
|
1,401.3
|
|
|
Selling, general and administrative
|
|
78.3
|
|
7.7
|
|
69.9
|
|
508.6
|
|
(12.0
|
)
|
652.5
|
|
|
Research and development
|
|
32.2
|
|
—
|
|
32.4
|
|
31.5
|
|
—
|
|
96.1
|
|
|
Other operating income
|
|
(9.1
|
)
|
(11.0
|
)
|
(45.3
|
)
|
(15.6
|
)
|
—
|
|
(81.0
|
)
|
|
Restructuring, impairment and plant closing costs
|
|
2.4
|
|
—
|
|
6.4
|
|
290.5
|
|
—
|
|
299.3
|
|
|
|
|
|
|
|
|
|
|
|
|
|
|
|
|
|
Operating income (loss)
|
|
128.7
|
|
3.3
|
|
(113.7
|
)
|
412.3
|
|
3.8
|
|
434.4
|
|
|
Interest (expense) income, net
|
|
(369.0
|
)
|
(6.2
|
)
|
173.4
|
|
(390.8
|
)
|
—
|
|
(592.6
|
)
|
|
Gain (loss) on accounts receivable securitization program
|
|
3.6
|
|
—
|
|
—
|
|
(19.2
|
)
|
—
|
|
(15.6
|
)
|
|
Equity in income (loss) of affiliates and subsidiaries
|
|
68.7
|
|
84.3
|
|
(4.5)
|
|
(97.7
|
)
|
(46.8
|
)
|
4.0
|
|
|
Other (expense) income
|
|
(35.0
|
)
|
—
|
|
—
|
|
15.7
|
|
(6.5
|
)
|
(25.8
|
)
|
|
(Loss) income from continuing operations before income taxes,
minority interest and accounting changes
|
|
(203.0
|
)
|
81.4
|
|
55.2
|
|
(79.7
|
)
|
(49.5
|
)
|
(195.6
|
)
|
|
Income tax benefit (expense)
|
|
23.1
|
|
(29.2
|
)
|
(3.0
|
)
|
32.0
|
|
—
|
|
22.9
|
|
|
Minority interest expense
|
|
—
|
|
—
|
|
(6.2
|
)
|
(4.3
|
)
|
3.3
|
|
(7.2
|
)
|
|
(Loss) income from continuing operations
|
|
(179.9
|
)
|
52.2
|
|
46.0
|
|
(52.0
|
)
|
(46.2
|
)
|
(179.9
|
)
|
|
Loss from discontinued operations, net of tax
|
|
(7.8
|
)
|
—
|
|
—
|
|
—
|
|
—
|
|
(7.8
|
)
|
|
Net (loss) income
|
|
$
|
(187.7
|
)
|
$
|
52.2
|
|
$
|
46.0
|
|
$
|
(52.0
|
)
|
$
|
(46.2
|
)
|
$
|
(187.7
|
)
|
F-64
HUNTSMAN
INTERNATIONAL LLC AND SUBSIDIARIES
CONDENSED
CONSOLIDATING STATEMENT OF OPERATIONS
YEAR ENDED
DECEMBER 31, 2003
(Dollars
in Millions)
|
|
|
Parent
Company
|
|
Issuer
Company
|
|
Guarantors
|
|
Non-
guarantors
|
|
Eliminations
|
|
Consolidated
Huntsman
International
LLC
|
|
|
Revenues:
|
|
|
|
|
|
|
|
|
|
|
|
|
|
|
Trade sales, services and fees
|
|
$
|
842.8
|
|
$
|
—
|
|
$
|
273.4
|
|
$
|
6,351.4
|
|
$
|
23.8
|
|
$
|
7,491.4
|
|
|
Related party sales
|
|
140.2
|
|
|
—
|
|
124.2
|
|
253.0
|
|
(362.5
|
)
|
154.9
|
|
|
Total revenues
|
|
983.0
|
|
|
—
|
|
397.6
|
|
6,604.4
|
|
(338.7
|
)
|
7,646.3
|
|
|
Cost of goods sold
|
|
811.6
|
|
2.0
|
|
341.5
|
|
6,042.9
|
|
(361.8
|
)
|
6,836.2
|
|
|
|
|
|
|
|
|
|
|
|
|
|
|
|
|
|
Gross profit (loss)
|
|
171.4
|
|
(2.0
|
)
|
56.1
|
|
561.5
|
|
23.1
|
|
810.1
|
|
|
Selling, general and administrative
|
|
125.7
|
|
6.3
|
|
28.0
|
|
326.9
|
|
23.2
|
|
510.1
|
|
|
Research and development
|
|
37.7
|
|
—
|
|
20.9
|
|
28.2
|
|
—
|
|
86.8
|
|
|
Other operating income
|
|
(66.5
|
)
|
(8.9
|
)
|
(2.6
|
)
|
(0.5
|
)
|
—
|
|
(78.5
|
)
|
|
Restructuring, impairment and plant
closing costs
|
|
—
|
|
—
|
|
—
|
|
55.0
|
|
—
|
|
55.0
|
|
|
|
|
|
|
|
|
|
|
|
|
|
|
|
|
|
Operating income
|
|
74.5
|
|
0.6
|
|
9.8
|
|
151.9
|
|
(0.1
|
)
|
236.7
|
|
|
Interest expense, net
|
|
(374.9
|
)
|
(3.6
|
)
|
(16.0
|
)
|
(86.0
|
)
|
—
|
|
(480.5
|
)
|
|
(Loss) gain on accounts receivable securitization
program
|
|
(64.3
|
)
|
—
|
|
—
|
|
31.9
|
|
—
|
|
(32.4
|
)
|
|
Equity in income (loss) of affiliates and
subsidiaries
|
|
37.0
|
|
(15.8
|
)
|
(0.1
|
)
|
(93.5
|
)
|
74.1
|
|
1.7
|
|
|
Other (expense) income
|
|
(4.4
|
)
|
—
|
|
—
|
|
6.8
|
|
(3.1
|
)
|
(0.7
|
)
|
|
(Loss) income from continuing
operations before income taxes, minority interest and accounting changes
|
|
(332.1
|
)
|
(18.8
|
)
|
(6.3
|
)
|
11.1
|
|
70.9
|
|
(275.2
|
)
|
|
Income tax benefit (expense)
|
|
17.4
|
|
5.5
|
|
(7.0
|
)
|
(56.9
|
)
|
—
|
|
(41.0
|
)
|
|
Minority interest income (expense)
|
|
—
|
|
—
|
|
1.5
|
|
(2.1
|
)
|
2.1
|
|
1.5
|
|
|
Loss from continuing operations
|
|
(314.7
|
)
|
(13.3
|
)
|
(11.8
|
)
|
(47.9
|
)
|
73.0
|
|
(314.7
|
)
|
|
Loss from discontinued operations, net of
tax
|
|
(2.6
|
)
|
—
|
|
—
|
|
—
|
|
—
|
|
(2.6
|
)
|
|
Net loss
|
|
$
|
(317.3
|
)
|
$
|
(13.3
|
)
|
$
|
(11.8
|
)
|
$
|
(47.9
|
)
|
$
|
73.0
|
|
$
|
(317.3
|
)
|
F-65
HUNTSMAN
INTERNATIONAL LLC AND SUBSIDIARIES
CONDENSED
CONSOLIDATING STATEMENT OF CASH FLOWS
YEAR ENDED
DECEMBER 31, 2005
(Dollars
in Millions)
|
|
|
Parent
Company
|
|
Issuer Company
|
|
Guarantors
|
|
Non-
Guarantors
|
|
Eliminations
|
|
Consolidated
Huntsman
International
LLC
|
|
|
Net cash
provided by (used in) operating activities
|
|
288.0
|
|
112.1
|
|
(47.4
|
)
|
645.3
|
|
(9.7
|
)
|
988.3
|
|
|
|
|
|
|
|
|
|
|
|
|
|
|
|
|
|
Investing
activities:
|
|
|
|
|
|
|
|
|
|
|
|
|
|
|
Capital
expenditures
|
|
(32.9
|
)
|
—
|
|
(21.4
|
)
|
(284.4
|
)
|
—
|
|
(338.7
|
)
|
|
Investment
in affiliates, net
|
|
(114.0
|
)
|
—
|
|
1.5
|
|
(8.1
|
)
|
112.6
|
|
(8.0
|
)
|
|
Proceeds
from sale of assets
|
|
6.4
|
|
—
|
|
—
|
|
11.8
|
|
—
|
|
18.2
|
|
|
Net cash
received from affiliates
|
|
—
|
|
—
|
|
0.3
|
|
5.9
|
|
—
|
|
6.2
|
|
|
Change in
restricted cash
|
|
0.3
|
|
—
|
|
—
|
|
8.6
|
|
—
|
|
8.9
|
|
|
Other, net
|
|
—
|
|
—
|
|
(1.4
|
)
|
(1.5
|
)
|
—
|
|
(2.9
|
)
|
|
Net cash
used in investing activities
|
|
(140.2
|
)
|
—
|
|
(21.0
|
)
|
(267.7
|
)
|
112.6
|
|
(316.3
|
)
|
|
|
|
|
|
|
|
|
|
|
|
|
|
|
|
|
Financing
activities:
|
|
|
|
|
|
|
|
|
|
|
|
|
|
|
Net
(repayment) borrowings under revolving loan facilities
|
|
(125.0
|
)
|
—
|
|
—
|
|
6.3
|
|
—
|
|
(118.7
|
)
|
|
Repayment of
long-term debt
|
|
(3,004.6
|
)
|
(350.0
|
)
|
—
|
|
(106.5
|
)
|
—
|
|
(3,461.1
|
)
|
|
Proceeds
from long-term debt
|
|
2,203.6
|
|
—
|
|
—
|
|
31.4
|
|
—
|
|
2,235.0
|
|
|
Call
premiums related to early extinguishment of debt
|
|
(64.2
|
)
|
(40.6
|
)
|
—
|
|
0.1
|
|
—
|
|
(104.7
|
)
|
|
Payments on
notes payable
|
|
(30.5
|
)
|
(1.9
|
)
|
—
|
|
0.8
|
|
—
|
|
(31.6
|
)
|
|
Debt
issuance costs paid
|
|
(16.9
|
)
|
(0.4
|
)
|
—
|
|
—
|
|
—
|
|
(17.3
|
)
|
|
Dividend to
parent for acquisition of minority interest
|
|
(124.8
|
)
|
—
|
|
—
|
|
—
|
|
—
|
|
(124.8
|
)
|
|
Contribution
from parent
|
|
837.6
|
|
—
|
|
—
|
|
—
|
|
—
|
|
837.6
|
|
|
Intercompany
advances - net of repayments
|
|
179.7
|
|
278.5
|
|
2.1
|
|
(347.7
|
)
|
(112.6
|
)
|
—
|
|
|
Dividends
paid
|
|
—
|
|
—
|
|
—
|
|
(9.7
|
)
|
9.7
|
|
—
|
|
|
Other, net
|
|
—
|
|
—
|
|
—
|
|
4.9
|
|
—
|
|
4.9
|
|
|
Net cash
(used in) provided by financing activities
|
|
(145.1
|
)
|
(114.4
|
)
|
2.1
|
|
(420.4
|
)
|
(102.9
|
)
|
(780.7
|
)
|
|
|
|
|
|
|
|
|
|
|
|
|
|
|
|
|
Effect of
exchange rate changes on cash
|
|
—
|
|
—
|
|
1.8
|
|
(4.1
|
)
|
—
|
|
(2.3
|
)
|
|
|
|
|
|
|
|
|
|
|
|
|
|
|
|
|
Increase
(decrease) in cash and cash equivalents
|
|
2.7
|
|
(2.3
|
)
|
(64.5
|
)
|
(46.9
|
)
|
—
|
|
(111.0
|
)
|
|
Cash and
cash equivalents at beginning of period
|
|
7.3
|
|
4.6
|
|
70.8
|
|
160.8
|
|
—
|
|
243.5
|
|
|
Cash and cash
equivalents at end of period
|
|
$
|
10.0
|
|
$
|
2.3
|
|
$
|
6.3
|
|
$
|
113.9
|
|
$
|
—
|
|
$
|
132.5
|
|
|
|
|
|
|
|
|
|
|
|
|
|
|
|
|
|
|
|
|
|
F-66
HUNTSMAN
INTERNATIONAL LLC AND SUBSIDIARIES
CONDENSED
CONSOLIDATING STATEMENT OF CASH FLOWS
YEAR ENDED
DECEMBER 31, 2004
(Dollars
in Millions)
|
|
|
Parent
Company
|
|
Issuer Company
|
|
Guarantors
|
|
Non-
Guarantors
|
|
Eliminations
|
|
Consolidated
Huntsman
International
LLC
|
|
|
Net cash (used in) provided by operating
activities
|
|
(334.1
|
)
|
(25.4
|
)
|
128.2
|
|
420.4
|
|
(7.5
|
)
|
181.6
|
|
|
|
|
|
|
|
|
|
|
|
|
|
|
|
|
|
Investing activities:
|
|
|
|
|
|
|
|
|
|
|
|
|
|
|
Capital expenditures
|
|
(22.8
|
)
|
—
|
|
(12.8
|
)
|
(191.0
|
)
|
—
|
|
(226.6
|
)
|
|
Investment in affiliates, net
|
|
—
|
|
—
|
|
0.2
|
|
(12.0
|
)
|
—
|
|
(11.8
|
)
|
|
Proceeds from sale of assets
|
|
0.1
|
|
—
|
|
0.9
|
|
4.2
|
|
—
|
|
5.2
|
|
|
Net cash (paid to) received from affiliates
|
|
(2.6
|
)
|
—
|
|
—
|
|
8.6
|
|
—
|
|
6.0
|
|
|
Change in restricted cash
|
|
0.6
|
|
—
|
|
—
|
|
1.0
|
|
—
|
|
1.6
|
|
|
Other, net
|
|
—
|
|
—
|
|
—
|
|
2.6
|
|
—
|
|
2.6
|
|
|
Net cash used in investing activities
|
|
(24.7
|
)
|
—
|
|
(11.7
|
)
|
(186.6
|
)
|
—
|
|
(223.0
|
)
|
|
|
|
|
|
|
|
|
|
|
|
|
|
|
|
|
Financing activities:
|
|
|
|
|
|
|
|
|
|
|
|
|
|
|
Net borrowings under revolving loan
facilities
|
|
90.8
|
|
—
|
|
—
|
|
23.0
|
|
—
|
|
113.8
|
|
|
Repayment of long-term debt
|
|
(2,701.1
|
)
|
—
|
|
—
|
|
(121.7
|
)
|
—
|
|
(2,822.8
|
)
|
|
Proceeds from long-term debt
|
|
2,839.1
|
|
—
|
|
—
|
|
30.7
|
|
—
|
|
2,869.8
|
|
|
Call premiums related to early
extinguishment of debt
|
|
(17.0
|
)
|
—
|
|
—
|
|
—
|
|
—
|
|
(17.0
|
)
|
|
Payments on notes payable
|
|
(19.6
|
)
|
—
|
|
—
|
|
—
|
|
—
|
|
(19.6
|
)
|
|
Net repayment of overdraft facility
|
|
(7.5
|
)
|
(0.9
|
)
|
—
|
|
(2.2
|
)
|
—
|
|
(10.6
|
)
|
|
Debt issuance costs paid
|
|
(35.6
|
)
|
—
|
|
—
|
|
—
|
|
—
|
|
(35.6
|
)
|
|
Intercompany advances - net of repayments
|
|
199.6
|
|
21.0
|
|
(90.5
|
)
|
(130.1
|
)
|
—
|
|
—
|
|
|
Dividends paid
|
|
—
|
|
—
|
|
—
|
|
(7.5
|
)
|
7.5
|
|
—
|
|
|
Other, net
|
|
—
|
|
—
|
|
—
|
|
5.4
|
|
—
|
|
5.4
|
|
|
Net cash provided by (used in) financing
activities
|
|
348.7
|
|
20.1
|
|
(90.5
|
)
|
(202.4
|
)
|
7.5
|
|
83.4
|
|
|
|
|
|
|
|
|
|
|
|
|
|
|
|
|
|
Effect of exchange rate changes on cash
|
|
—
|
|
—
|
|
(0.9
|
)
|
12.0
|
|
—
|
|
11.1
|
|
|
|
|
|
|
|
|
|
|
|
|
|
|
|
|
|
(Decrease) increase in cash and cash
equivalents
|
|
(10.1
|
)
|
(5.3
|
)
|
25.1
|
|
43.4
|
|
—
|
|
53.1
|
|
|
Cash and cash equivalents at beginning of
period
|
|
17.4
|
|
9.9
|
|
45.7
|
|
117.4
|
|
—
|
|
190.4
|
|
|
Cash and cash equivalents at end of period
|
|
$
|
7.3
|
|
$
|
4.6
|
|
$
|
70.8
|
|
$
|
160.8
|
|
$
|
—
|
|
$
|
243.5
|
|
|
|
|
|
|
|
|
|
|
|
|
|
|
|
|
|
|
|
|
|
F-67
HUNTSMAN
INTERNATIONAL LLC AND SUBSIDIARIES
CONDENSED
CONSOLIDATING STATEMENT OF CASH FLOWS
YEAR ENDED
DECEMBER 31, 2003
(Dollars
in Millions)
|
|
|
Parent
Company
|
|
Issuer Company
|
|
Guarantors
|
|
Non-
Guarantors
|
|
Eliminations
|
|
Consolidated
Huntsman
International
LLC
|
|
|
Net cash (used in) provided by operating
activities
|
|
(168.5
|
)
|
(23.4
|
)
|
28.6
|
|
383.2
|
|
(4.0
|
)
|
215.9
|
|
|
|
|
|
|
|
|
|
|
|
|
|
|
|
|
|
Investing activities:
|
|
|
|
|
|
|
|
|
|
|
|
|
|
|
Capital expenditures
|
|
(17.9
|
)
|
—
|
|
(4.1
|
)
|
(182.8
|
)
|
—
|
|
(204.8
|
)
|
|
Investment in affiliates, net
|
|
6.1
|
|
—
|
|
—
|
|
(6.1
|
)
|
—
|
|
—
|
|
|
Proceeds from sale of assets
|
|
—
|
|
—
|
|
—
|
|
0.2
|
|
—
|
|
0.2
|
|
|
Acquisition of business, net of cash acquired
|
|
0.3
|
|
(431.9
|
)
|
18.8
|
|
34.9
|
|
—
|
|
(377.9
|
)
|
|
Purchase of Vantico senior notes
|
|
—
|
|
(22.7
|
)
|
—
|
|
—
|
|
—
|
|
(22.7
|
)
|
|
Net cash (paid to) received from affiliates
|
|
(9.1
|
)
|
—
|
|
—
|
|
0.8
|
|
—
|
|
(8.3
|
)
|
|
Change in restricted cash
|
|
(0.8
|
)
|
—
|
|
—
|
|
(0.6
|
)
|
—
|
|
(1.4
|
)
|
|
Other, net
|
|
—
|
|
—
|
|
—
|
|
(2.2
|
)
|
—
|
|
(2.2
|
)
|
|
Net cash (used in) provided by investing
activities
|
|
(21.4
|
)
|
(454.6
|
)
|
14.7
|
|
(155.8
|
)
|
—
|
|
(617.1
|
)
|
|
|
|
|
|
|
|
|
|
|
|
|
|
|
|
|
Financing activities:
|
|
|
|
|
|
|
|
|
|
|
|
|
|
|
Net repayment under revolving loan
facilities
|
|
(168.3
|
)
|
—
|
|
—
|
|
—
|
|
—
|
|
(168.3
|
)
|
|
Repayment of long-term debt
|
|
(593.2
|
)
|
—
|
|
—
|
|
(9.2
|
)
|
—
|
|
(602.4
|
)
|
|
Proceeds from long-term debt
|
|
813.4
|
|
—
|
|
—
|
|
—
|
|
—
|
|
813.4
|
|
|
Issuance of senior secured notes
|
|
—
|
|
348.0
|
|
—
|
|
—
|
|
—
|
|
348.0
|
|
|
Cost of raising equity capital
|
|
—
|
|
(10.1
|
)
|
—
|
|
—
|
|
—
|
|
(10.1
|
)
|
|
Payments on notes payable
|
|
—
|
|
—
|
|
(1.0
|
)
|
—
|
|
—
|
|
(1.0
|
)
|
|
Net borrowings (repayment) of overdraft
facility
|
|
7.5
|
|
—
|
|
(0.7
|
)
|
(1.6
|
)
|
—
|
|
5.2
|
|
|
Debt issuance costs paid
|
|
(30.1
|
)
|
(14.4
|
)
|
—
|
|
—
|
|
—
|
|
(44.5
|
)
|
|
Contribution from parent
|
|
—
|
|
164.4
|
|
—
|
|
—
|
|
—
|
|
164.4
|
|
|
Intercompany advances - net of repayments
|
|
91.8
|
|
—
|
|
1.3
|
|
(93.1
|
)
|
—
|
|
—
|
|
|
Dividends paid
|
|
—
|
|
—
|
|
—
|
|
(4.0
|
)
|
4.0
|
|
—
|
|
|
Other, net
|
|
—
|
|
—
|
|
—
|
|
2.7
|
|
—
|
|
2.7
|
|
|
Net cash provided by (used in) financing
activities
|
|
121.1
|
|
487.9
|
|
(0.4
|
)
|
(105.2
|
)
|
4.0
|
|
507.4
|
|
|
|
|
|
|
|
|
|
|
|
|
|
|
|
|
|
Effect of exchange rate changes on cash
|
|
—
|
|
—
|
|
2.8
|
|
6.0
|
|
—
|
|
8.8
|
|
|
|
|
|
|
|
|
|
|
|
|
|
|
|
|
|
(Decrease) increase in cash and cash
equivalents
|
|
(68.8
|
)
|
9.9
|
|
45.7
|
|
128.2
|
|
—
|
|
115.0
|
|
|
Cash and cash equivalents at beginning of
period
|
|
86.2
|
|
—
|
|
—
|
|
(10.8
|
)
|
—
|
|
75.4
|
|
|
Cash and cash equivalents at end of period
|
|
$
|
17.4
|
|
$
|
9.9
|
|
$
|
45.7
|
|
$
|
117.4
|
|
$
|
—
|
|
$
|
190.4
|
|
|
|
|
|
|
|
|
|
|
|
|
|
|
|
|
|
|
|
|
|
F-68
HUNTSMAN
INTERNATIONAL LLC AND SUBSIDIARIES
Schedule II—Valuation and Qualifying
Accounts
(Dollars
in Millions)
|
|
|
|
|
Column C
|
|
|
|
|
|
|
Column A
|
|
Column B
|
|
Additions
|
|
Column D
|
|
Column E
|
|
|
Description
|
|
Balance at
Beginning
of Period
|
|
Charged
to cost and
expenses
|
|
Charged
to other
accounts
|
|
Deductions
|
|
Balance at
End of
Period
|
|
|
|
|
|
|
|
|
|
|
|
|
|
|
|
Allowance for Doubtful Accounts:
|
|
|
|
|
|
|
|
|
|
|
|
|
Year ended December 31, 2005
|
|
$
|
25.8
|
|
$
|
4.2
|
|
$
|
3.7
|
|
$
|
—
|
|
$
|
33.7
|
|
|
Year ended December 31, 2004
|
|
26.5
|
|
2.0
|
|
—
|
|
(2.7
|
)
|
25.8
|
|
|
Year ended December 31, 2003
|
|
14.5
|
|
10.2
|
|
14.3
|
(1)
|
(12.5
|
)
|
26.5
|
|
|
|
|
|
|
|
|
|
|
|
|
|
|
|
Valuation Allowance on Deferred Tax Assets:
|
|
|
|
|
|
|
|
|
|
|
|
|
Year ended December 31, 2005
|
|
937.2
|
|
(150.7
|
)
|
—
|
|
(291.2
|
)(2)
|
495.3
|
|
|
Year ended December 31, 2004
|
|
763.3
|
|
48.7
|
|
182.3
|
|
(57.1
|
)
|
937.2
|
|
|
Year ended December 31, 2003
|
|
149.6
|
|
112.5
|
|
502.0
|
|
(0.8
|
)
|
763.3
|
|
|
|
|
|
|
|
|
|
|
|
|
|
|
|
|
|
|
(1) Represents specific
reserves provided for receivables as a result of the HLLC Consolidation
Transaction and the AdMat Transaction in 2003.
(2) See “Note 18 Income
Taxes” to our Consolidated Financial Statements included elsewhere in this
report
F-69
EXHIBIT INDEX
|
Number
|
|
Description
|
|
|
|
|
|
2.1
|
|
Agreement and Plan of Merger dated August 16,
2005 relating to our merger with Huntsman LLC (incorporated by reference to Exhibit 2.1
to our current report on Form 8-K filed August 22, 2005).
|
|
|
|
|
|
2.2
|
|
Share and Asset Purchase Agreement by and
between our Company, Ciba Specialty Chemicals Holding Inc. and RM 2526
Vermogensverwaltungs GmbH dated as of February 18, 2006 (incorporated by
reference to Exhibit 2.1 to our current report on Form 8-K filed February 24,
2006).
|
|
|
|
|
|
3.1
|
|
Certificate of Formation of our Company
(incorporated by reference to Exhibit 3.1 to our registration statement
on Form S-4 (File No. 333- 85141))
|
|
|
|
|
|
3.2
|
|
Second Amended and Restated Limited
Liability Company Agreement of our Company dated December 20, 2001
(incorporated by reference to Exhibit 3.2 to amendment no. 1 to our
annual report on Form 10-K/A for the year ended December 31, 2001)
|
|
|
|
|
|
3.3
|
|
Certificate of Amendment to Certificate of Formation
of Huntsman International LLC (incorporated by reference to Exhibit 3.9
to our annual report on Form 10-K for the year ended December 31,
2000)
|
|
3.16
|
|
Limited Liability Company Agreement of
Huntsman Texas Holdings LLC dated July 12, 2000 (incorporated by
reference to Exhibit 3.12 to our registration statement on Form S-4
(File No. 333-58578))
|
|
|
|
|
|
3.17
|
|
Certificate of Formation of Eurofuels LLC
(incorporated by reference to Exhibit 3.13 to our registration statement
on Form S-4 (File No. 333-58578))
|
|
|
|
|
|
3.18
|
|
Limited Liability Company Agreement of
Eurofuels LLC dated July 12, 2000 (incorporated by reference to Exhibit 3.14
to our registration statement on Form S-4 (File No. 333-58578))
|
|
|
|
|
|
3.19
|
|
Certificate of Formation of Eurostar
Industries LLC (incorporated by reference to Exhibit 3.15 to our
registration statement on Form S-4 (File No. 333- 58578))
|
|
|
|
|
|
3.20
|
|
Limited Liability Company Agreement of
Eurostar Industries LLC dated July 12, 2000 (incorporated by reference
to Exhibit 3.16 to our registration statement on Form S-4 (File No. 333-58578))
|
|
|
|
|
|
3.21
|
|
Certificate of Limited Partnership of
Huntsman Ethyleneamines Ltd. (incorporated by reference to Exhibit 3.17
to our registration statement on Form S-4 (File No. 333-58578))
|
|
|
|
|
|
3.22
|
|
Articles of Limited Partnership of Huntsman
Ethyleneamines Ltd. dated January 5, 2001 (incorporated by reference to Exhibit 3.18
to our registration statement on Form S-4 (File No. 333-58578))
|
|
|
|
|
|
3.23
|
|
Certificate of Limited Partnership of
Huntsman Propylene Oxide Ltd. (incorporated by reference to Exhibit 3.19
to our registration statement on Form S-4 (File No. 333-58578))
|
|
|
|
|
|
3.24
|
|
First Amended and Restated Articles of
Limited Partnership of Huntsman Propylene Oxide Ltd. dated October 1,
2000 (incorporated by reference to Exhibit 3.20 to our registration
statement on Form S-4 (File No. 333-58578))
|
|
|
|
|
|
3.25
|
|
Certificate of Limited Partnership of
Huntsman International Fuels, L.P. (incorporated by reference to Exhibit 3.21
to our registration statement on Form S-4 (File No. 333-58578))
|
|
|
|
|
|
3.26
|
|
Certificate of First Amendment to
Certificate of Limited Partnership of Huntsman International Fuels, L.P.
(incorporated by reference to Exhibit 3.22 to our registration statement
on Form S-4 (File No. 333-58578))
|
|
|
|
|
|
3.27
|
|
First Amended and Restated Articles of
Limited Partnership of Huntsman International Fuels, L.P. dated October 1,
2000 (incorporated by reference to Exhibit 3.23 to our registration
statement on Form S-4 (File No. 333-58578))
|
|
|
|
|
|
4.1
|
|
Indenture, dated as of June 30, 1999,
among Huntsman International LLC (f/k/a Huntsman ICI Chemicals LLC), the
Guarantors party thereto and Bank One, N.A., as Trustee, relating to the
101/8% Senior Subordinated Notes due 2009 (incorporated by reference to Exhibit 4.1
to our registration statement on Form S-4 (File No. 333-85141))
|
|
|
|
|
|
4.2
|
|
Form of 101/8% Senior Subordinated
Note due 2009 denominated in dollars (included as Exhibit A-3 to Exhibit 4.1)
|
|
|
|
|
|
4.3
|
|
Form of 101/8% Senior Subordinated
Note due 2009 denominated in euros (included as Exhibit A-4 to Exhibit 4.1)
|
|
|
|
|
|
4.4
|
|
Form of Guarantee relating to the
101/8% Senior Subordinated Notes due 2009 (included as Exhibit E of Exhibit 4.1)
|
|
|
|
|
|
4.5
|
|
First Amendment, dated January 5,
2000, to Indenture, dated as of June 30, 1999, among Huntsman
International LLC (f/k/a Huntsman ICI Chemicals LLC), as Issuer, each of the
Guarantors named therein and Bank One, N.A., as Trustee (incorporated by
reference to Exhibit 4.6 to our registration statement on Form S-4
(File No. 333-85141))
|
|
|
|
|
|
4.6
|
|
Indenture, dated as of March 13, 2001,
among Huntsman International LLC, as Issuer, the Guarantors named therein and
The Bank of New York, as Trustee, relating to 101/8% Senior Subordinated
Notes due 2009 (incorporated by reference to Exhibit 4.6 to amendment no. 1
to our annual report on Form 10-K/A for
|
|
|
|
the year ended December 31, 2001)
|
|
|
|
|
|
4.7
|
|
Form of 101/8% Senior Subordinated
Note due 2009 denominated in dollars (included as Exhibit A-3 to Exhibit 4.6)
|
|
|
|
|
|
4.8
|
|
Form of 101/8% Senior Subordinated
Note due 2009 denominated in euros (included as Exhibit A-4 to Exhibit 4.6)
|
|
|
|
|
|
4.9
|
|
Form of Guarantee relating to the 10 1/8%
Senior Subordinated Notes due 2009 (included as Exhibit E of Exhibit 4.6)
|
|
|
|
|
|
4.10
|
|
First Supplemental Indenture, dated as of January 11,
2002, among our Company, as Issuer, the Guarantors named therein and The Bank
of New York, as Trustee, relating to 10 1/8% Senior Subordinated Notes due
2009 (incorporated by reference to Exhibit 4.7 to amendment no. 1
to our annual report on Form 10-K/A for the year ended December 31,
2001)
|
|
|
|
|
|
4.11
|
|
Indenture, dated as of March 21, 2002,
among our Company, as Issuer, the Guarantors named therein and Wells Fargo
Bank Minnesota, National Association, as Trustee, relating to the 9 7/8%
Senior Notes due 2009 (incorporated by reference to Exhibit 4.8 to
amendment no. 1 to our annual report on Form 10-K/A for the year
ended December 31, 2001)
|
|
|
|
|
|
4.12
|
|
Form of 9 7/8% Senior Note due
2009 denominated in dollars (included as Exhibit A-3 to Exhibit 4.11)
|
|
|
|
|
|
4.13
|
|
Form of 9 7/8% Senior Note due
2009 denominated in euros (included as Exhibit A-4 to Exhibit 4.11)
|
|
|
|
|
|
4.14
|
|
Form of Guarantee relating to the 9 7/8%
Senior Notes due 2009 (included as Exhibit E of Exhibit 4.11)
|
|
|
|
|
|
4.15
|
|
Amended and Restated Guarantee, dated as of
April 11, 2003, among the Guarantors named therein and Wells Fargo Bank
Minnesota, National Association, as Trustee, relating to the 9 7/8% Senior
Notes due 2009 (incorporated by reference to Exhibit 4.15 to our
registration statement on Form S-4 (File No. 333-106482))
|
|
|
|
|
|
4.16
|
|
Indenture, dated as of December 17,
2004, among our Company, as Issuer, the Guarantors named therein and Wells
Fargo Bank, National Association, as Trustee, relating to 7 3/8% Senior
Subordinated Notes due 2015 and 7 1/2% Senior Subordinated Notes due 2015
(incorporated by reference to Exhibit 4.1 to our current report on Form 8-K
dated December 17, 2004 (File No. 333-85141))
|
|
|
|
|
|
4.19
|
|
Form of 7 3/8% Senior Subordinated
Notes due 2015 denominated in dollars (included as Exhibit A-1 to Exhibit 4.16)
|
|
|
|
|
|
4.20
|
|
Form of 7 1/2% Senior Subordinated
Notes due 2015 denominated in euros (included as Exhibit A-2 to Exhibit 4.16)
|
|
|
|
|
|
4.21
|
|
Form of Guarantee (included as Exhibit E
to Exhibit 4.16)
|
|
|
|
|
|
4.22
|
|
Exchange and Registration Rights Agreement,
dated as of December 17, 2004, among our Company, the Guarantors as
defined therein, and the Purchasers as defined therein, relating to the 7 3/8%
Senior Subordinated Notes due 2015 and the 7 1/2% Senior Subordinated Notes
due 2015 (incorporated by reference to Exhibit 4.2 to our current report
on Form 8-K dated December 17, 2004 (File No. 333-85141))
|
|
4.23
|
|
Supplemental Indenture dated August 16,
2005 to Indenture dated as of June 30, 1999, as amended, among our
Company, the guarantors named therein, and Wells Fargo Bank, National
Association (as successor by consolidation to Wells Fargo Bank Minnesota,
National Association), as trustee, relating to our dollar and euro
denominated 10 1/8% senior subordinated notes due 2009 (incorporated by
reference to Exhibit 4.1 to our current report on Form 8-K filed August 22,
2005)
|
|
|
|
|
|
4.24
|
|
Supplemental Indenture dated August 16,
2005 to Indenture dated as of March 13, 2001, as amended, among our Company,
the Guarantors named therein, and The Bank of New York, as trustee, relating
to our euro denominated 10 1/8% senior subordinated notes due 2009
(incorporated by reference to Exhibit 4.2 to our current report on Form 8-K
filed August 22, 2005)
|
|
|
|
|
|
4.25
|
|
Supplemental Indenture dated August 16,
2005 to Indenture dated as of March 21, 2002 among our Company, the Guarantors
named therein, and Wells Fargo Bank, National Association (as successor by
consolidation to Wells Fargo Bank Minnesota, National Association), as
trustee, relating to our 9 7/8% senior notes due 2009 (incorporated by
reference to Exhibit 4.3 to our current report on Form 8-K filed August 22,
2005)
|
|
|
|
|
|
4.26
|
|
Supplemental Indenture dated August 16,
2005 to Indenture dated as of December 17, 2004 among our Company, the Guarantors
named therein, and Wells Fargo Bank, National Association (as successor by
consolidation to Wells Fargo Bank Minnesota, National Association), as
trustee, relating to our dollar denominated 7 3/8% senior subordinated notes
due 2015 and euro denominated 7 1/2% senior subordinated notes due 2015
(incorporated by reference to Exhibit 4.4 to our current report on Form 8-K
filed August 22, 2005)
|
|
|
|
|
|
4.27
|
|
Indenture dated September 30, 2003
among Huntsman LLC, the Guarantors named therein, and HSBC Bank USA, National
Association, as trustee, relating to our 11 5/8% senior secured notes due
2010, originally issued by Huntsman LLC (incorporated by reference to Exhibit 4.36
to Huntsman LLC’s registration statement on Form S-4 (File No. 333-112279))
|
|
|
|
|
|
4.28
|
|
Supplemental Indenture dated July 13,
2005 to Indenture dated September 30, 2003 among Huntsman LLC, the Guarantors
named therein and HSBC Bank USA, National Association, as trustee, relating
to our 11 5/8% senior secured notes due 2010, originally issued by Huntsman
LLC (incorporated by reference to Exhibit 4.2 to the current report on Form 8-K
of Huntsman LLC filed July 15, 2005)
|
|
|
|
|
|
4.29
|
|
Supplemental Indenture dated August 16,
2005 to Indenture dated September 30, 2003 among our Company, the Guarantors
named therein and HSBC Bank USA, National Association, as trustee, relating
to our 11 5/8% senior secured notes due 2010, originally issued by Huntsman
LLC (incorporated by reference to Exhibit 4.7 to our current report on Form 8-K
filed August 22, 2005)
|
|
|
|
|
|
4.30
|
|
Indenture dated June 22, 2004 among Huntsman
LLC, the Guarantors named therein, and HSBC Bank USA, National Association,
as trustee, relating to our 11 1/2% senior notes due 2012 and senior floating
rate notes due 2011, originally issued by Huntsman LLC (incorporated by
reference to Exhibit 4.1 to the quarterly report on Form 10-Q of Huntsman
LLC for the quarter ended June 30, 2004)
|
|
|
|
|
|
4.31
|
|
Supplemental Indenture dated July 11,
2005 to Indenture dated June 22, 2004 among Huntsman LLC, the Guarantors
named therein and HSBC Bank USA, National Association, as trustee, relating
to our 11 1/2% senior notes due 2012 and senior floating rate notes due 2011
(incorporated by reference to Exhibit 4.1 to the current report on Form 8-K
of Huntsman LLC filed July 15, 2005)
|
|
|
|
|
|
4.32
|
|
Supplemental Indenture dated August 16,
2005 to Indenture dated June 22, 2004 among our Company, the Guarantors
named therein and HSBC Bank USA, National Association, as trustee, relating to
our 11 1/2% senior notes due 2012 and senior floating rate notes due 2011,
originally issued by Huntsman LLC (incorporated by reference to Exhibit 4.10
to our current report on Form 8-K filed August 22, 2005)
|
|
|
|
|
|
4.33
|
|
Supplemental Indenture dated December 20,
2005 to Indenture dated as of June 30, 1999, as amended, among our
Company, the Guarantors named therein, and Wells Fargo Bank, National
Association (as successor by consolidation to Wells Fargo Bank Minnesota,
National Association), as trustee, relating to our Company’s dollar and euro
denominated 10 1/8% senior subordinated notes due 2009 (incorporated by
reference to Exhibit 4.1 to our current report on Form 8-K filed on
December 27, 2005)
|
|
4.34
|
|
Supplemental Indenture dated December 20,
2005 to Indenture dated as of March 13, 2001, as amended, among our
Company, the Guarantors named therein, and The Bank of New York, as trustee,
relating to our euro denominated 10 1/8% senior subordinated notes due 2009
(incorporated by reference to Exhibit 4.2 to our current report on Form 8-K
filed on December 27, 2005)
|
|
|
|
|
|
4.35
|
|
Supplemental Indenture dated December 20,
2005 to Indenture dated as of March 21, 2002, as amended, among our
Company, the Guarantors named therein, and Wells Fargo Bank, National Association
(as successor by consolidation to Wells Fargo Bank Minnesota, National
Association), as trustee, relating to our 9 7/8% senior notes due 2009
(incorporated by reference to Exhibit 4.3 to our current report on Form 8-K
filed on December 27, 2005)
|
|
|
|
|
|
4.36
|
|
Supplemental Indenture dated December 20,
2005 to Indenture dated as of December 17, 2004, as amended, among our
Company, the Guarantors named therein, and Wells Fargo Bank, National
Association (as successor by consolidation to Wells Fargo Bank Minnesota,
National Association), as trustee, relating to our dollar denominated 7 3/8%
senior subordinated notes due 2015 and euro denominated 7 ½% senior
subordinated notes due 2015 (incorporated by reference to Exhibit 4.4 to
our current report on Form 8-K filed on December 27, 2005)
|
|
|
|
|
|
4.37
|
|
Supplemental Indenture dated December 20,
2005 to Indenture dated September 30, 2003 among our Company (as
successor by merger to Huntsman LLC), the Guarantors named therein and HSBC
Bank USA, National Association, as trustee, relating to our 11 5/8%
senior secured notes due 2010 (incorporated by reference to Exhibit 4.5
to our current report on Form 8-K filed on December 27, 2005)
|
|
|
|
|
|
4.38
|
|
Supplemental Indenture dated December 20,
2005 to Indenture dated June 22, 2004, as amended, among our Company (as
successor by merger to Huntsman LLC), the Guarantors named therein, and HSBC
Bank USA, National Association, as trustee, relating to our 11 1/2% senior
notes due 2012 and senior floating rate notes due 2011 (incorporated by
reference to Exhibit 4.6 to our current report on Form 8-K filed on
December 27, 2005)
|
|
|
|
|
|
10.1
|
|
Contribution Agreement, dated as of April 15,
1999, by and among Imperial Chemical Industries PLC, Huntsman Specialty
Chemicals Corporation, Huntsman International Holdings LLC (f/k/a Huntsman
ICI Holdings LLC) and our Company (f/k/a Huntsman ICI Chemicals LLC) as
amended by the first Amending Agreement, dated June 4, 1999, the second
Amending Agreement, dated June 30, 1999, and the third Amending
Agreement, dated June 30, 1999 (incorporated by reference to Exhibit 10.1
to our registration statement on Form S-4 (File No. 333-85141))
|
|
|
|
|
|
10.2
|
|
Purchase and Sale Agreement (PO/MTBE
Business), dated March 21, 1997, among Texaco, Texaco Chemical Inc. and
Huntsman Specialty Chemicals Corporation (incorporated by reference to Exhibit 10.2
to our registration statement on Form S-4 (File No. 333-85141))
|
|
|
|
|
|
10.3
|
|
Operating and Maintenance Agreement, dated
as of March 21, 1997, by and between Huntsman Specialty Chemicals
Corporation and Huntsman Petrochemical Corporation (incorporated by reference
to Exhibit 10.3 to our registration statement on Form S-4 (File No. 333-85141))
|
|
|
|
|
|
|
|
the year ended December 31, 2000)
|
|
|
|
|
|
10.7
|
|
Second Amendment, dated as of March 5,
2001, is entered into by and among Huntsman International LLC, Huntsman
International Holdings LLC, the undersigned financial institutions, including
Bankers Trust Company, in their capacities as lenders hereunder, Bankers
Trust Company, as Lead Arranger, Administrative Agent for the Lenders and
Sole Book Manager, Goldman Sachs Credit Partners L.P., as Syndication Agent
and Co-Arranger and The Chase Manhattan Bank and UBS Warburg LLC (as
successor to Warburg Dillon Read), as Co-Arrangers and as Co-Documentation
Agents, to the Credit Agreement dated as of June 30, 1999 (incorporated
by reference to Exhibit 10.16 to our annual report on Form
10-K for the year ended December 31, 2000)
|
|
|
|
|
|
10.8
|
|
Contribution Agreement, among Huntsman
International LLC, as Contributor and Originator, and Huntsman Receivables
Finance LLC, as the Company, dated as of December 20, 2000 (incorporated
by reference to Exhibit 10.17 to our annual report on Form 10-K for
the year ended December 31, 2000)
|
|
|
|
|
|
10.9
|
|
Huntsman Master Trust Pooling Agreement,
dated as of December 21, 2000, among Huntsman Receivables Finance LLC,
as Company, Huntsman (Europe) BVBA, as Master Servicer, and Chase Manhattan
Bank (Ireland) Plc, as Trustee (incorporated by reference to Exhibit 10.18
to our annual report on Form 10-K for the year ended December 31,
2000)
|
|
|
|
|
|
10.10
|
|
Huntsman Master Trust, Series 2000-1
Supplement, dated as of December 21, 2000, to Pooling Agreement dated as
of December 21, 2000, among Huntsman Receivables Finance LLC, as Company,
Huntsman (Europe), BVBA, as Master Servicer, The Chase Manhattan Bank, as
Funding Agent, Park Avenue Receivables Corp., as Series 2000-1 Initial
Purchaser, the several financial institutions party thereto from time to time
as Series 2000-1 APA Banks, and Chase Manhattan Bank (Ireland) Plc, as
Trustee (incorporated by reference to Exhibit 10.19 to our annual report
on Form 10-K for the year ended December 31, 2000)
|
|
|
|
|
|
10.11
|
|
Servicing Agreement, dated as of December 21,
2000, among Huntsman Receivables Finance LLC, as the Company, Huntsman
(Europe) BVBA, as Master Servicer, Tioxide Americas Inc., Huntsman ICI
Holland B.V., Tioxide Europe Limited, Huntsman International LLC, Huntsman
Petrochemicals (U.K.) Limited, Huntsman Propylene Oxide Ltd., Huntsman
International Fuels L.P., as Local Servicers, Chase Manhattan Bank (Ireland)
Plc, as Trustee, Pricewaterhousecoopers, as Liquidation Servicer, and
Huntsman International LLC, as Servicer Guarantor (incorporated by reference
to Exhibit 10.20 to our annual report on Form 10-K for the year
ended December 31, 2000)
|
|
|
|
|
|
10.12
|
|
U.S. Receivables Purchase Agreement,
Huntsman International LLC, as Purchaser, and Tioxide Americas Inc., Huntsman
Propylene Oxide Ltd. and Huntsman International Fuels, L.P., each as a Seller
and an Originator (incorporated by reference to Exhibit 10.21 to our
annual report on Form 10-K for the year ended December 31, 2000)
|
|
|
|
|
|
10.13
|
|
Dutch Receivables Purchase Agreement, dated
as of December 21, 2000, between Huntsman International LLC, as
Purchaser, Huntsman ICI Holland B.V., as Originator, Huntsman ICI (Europe)
B.V.B.A., as Master Servicer (incorporated by reference to Exhibit 10.22
to our annual report on Form 10-K for the year ended December 31,
2000)
|
|
|
|
|
|
10.14
|
|
U.K. Receivables Purchase Agreement, dated
as of December 20, 2000, between Huntsman International LLC, as
Purchaser, Tioxide Europe Limited and Huntsman Petrochemicals (U.K.) Limited,
as Originators, and Huntsman (Europe) B.V.B.A., as Master Servicer
(incorporated by reference to Exhibit 10.23 to our annual report on Form 10-K
for the year ended December 31, 2000)
|
|
|
|
|
|
10.15
|
|
Third Amendment, dated as of November 30,
2001, by and among Huntsman International LLC, Huntsman International
Holdings LLC and the various agents and lending institutions party thereto
(incorporated by reference to Exhibit 10.1 to our current report on Form 8-K
filed December 4, 2001)
|
|
|
|
|
|
10.16
|
|
Fourth Amendment to Credit Agreement, dated
as of March 15, 2002, by and among Huntsman International LLC, Huntsman
International Holdings LLC and the various agents and lending institutions
party thereto (incorporated by reference to Exhibit 10.25 to amendment no. 1
to our annual report on Form 10-K/A for the year ended December 31,
2001)
|
|
10.17
|
|
Amendment Agreement, dated December 20,
2001, between Imperial Chemical Industries PLC, Huntsman Specialty Chemicals
Corporation, Huntsman International Holdings LLC and our Company, to amend
the Contribution Agreement dated as of April 15, 1999 (incorporated by
reference to Exhibit 10.26 to our registration statement on Form S-4
(File No. 333-106482))
|
|
|
|
|
|
10.18
|
|
Second Amendment, dated as of October 21,
2002, between Huntsman Receivables Finance LLC, Huntsman (Europe), BVBA, and
J.P. Morgan (Ireland) PLC, to Series 2000-1 Supplement, dated as of December 21,
2000 (incorporated by reference to Exhibit 10.27 to our annual report on
Form 10-K for the year ended December 31, 2002)
|
|
|
|
|
|
10.19
|
|
First Amendment to Series 2001-1
Supplement, dated as of October 21, 2002, among Huntsman Receivables
Finance LLC, Huntsman (Europe) BVBA and J.P. Morgan Bank (Ireland) PLC
(incorporated by reference to Exhibit 10.28 to our annual report on Form 10-K
for the year ended December 31, 2002)
|
|
|
|
|
|
10.20
|
|
First Amendment to Amended and Restated
Pooling Agreement, dated as of October 21, 2002, among Huntsman
Receivables Finance LLC, Huntsman (Europe) BVBA and J.P. Morgan Bank
(Ireland) PLC (incorporated by reference to Exhibit 10.29 to our annual
report on Form 10-K for the year ended December 31, 2002)
|
|
|
|
|
|
10.21
|
|
Amended and Restated Servicing Agreement,
dated as of October 21, 2002, among Huntsman Receivables Finance LLC, as
the Company, Huntsman (Europe) BVBA, as Master Servicer, Tioxide Americas
Inc., Huntsman Holland B.V., Tioxide Europe Limited, our Company, Huntsman
Petrochemicals (UK) Limited, Huntsman Propylene Oxide Ltd., Huntsman
International Fuels L.P., Tioxide Europe SRL, Huntsman Surface Sciences
Italia SRL, Huntsman Patrica S.R.L., Tioxide Europe S.L., Huntsman Surface Sciences
Ibérica, S.L., Tioxide Europe SAS, Huntsman Surface Sciences (France) S.A.S.,
Huntsman Surface Sciences UK Ltd, Huntsman Ethyleneamines Ltd., as Local
Servicers, J.P. Morgan Bank (Ireland) PLC, as Trustee,
Pricewaterhousecoopers, as Liquidation Servicer, and our Company, as Servicer
Guarantor (incorporated by reference to Exhibit 10.30 to our annual
report on Form 10-K for the year ended December 31, 2002)
|
|
|
|
|
|
10.22
|
|
Amended and Restated U.S. Receivables
Purchase Agreement, dated as of October 21, 2002, among our Company, as
Purchaser, and Tioxide Americas Inc., Huntsman Propylene Oxide Ltd., Huntsman
International Fuels L.P., and Huntsman Ethyleneamines Ltd., each as a Seller
and an Originator (incorporated by reference to Exhibit 10.31 to our annual
report on Form 10-K for the year ended December 31, 2002)
|
|
|
|
|
|
10.23
|
|
Amended and Restated UK Receivables
Purchase Agreement, dated as of October 21, 2002, among our Company, as
Purchaser, Huntsman Surface Sciences UK Limited, Tioxide Europe Limited, and
Huntsman Petrochemicals (UK) Limited, as Originators, Huntsman (Europe)
B.V.B.A, as Master Servicer (incorporated by reference to Exhibit 10.32
to our annual report on Form 10-K for the year ended December 31,
2002)
|
|
|
|
|
|
10.25
|
|
Deed of Amendment to Contribution
Agreement, dated as of November 27, 2002, among Imperial Chemical
Industries PLC, Huntsman Specialty Chemicals Corporation, Huntsman
International Holdings, LLC, and our Company (incorporated by reference to Exhibit 10.34
to our annual report on Form 10-K for the year ended December 31,
2002)
|
|
|
|
|
|
10.27
|
|
Business Consulting Agreement, dated as of June 3,
2003, between our Company and Jon M. Huntsman (incorporated by reference to Exhibit 10.41
to our registration statement on Form S-4 (File No. 333-106482))
|
|
10.30
|
|
Credit Agreement dated August 16, 2005
among our Company, Deutsche Bank AG New York Branch as Administrative Agent
and the other financial institutions named therein (incorporated by reference
to Exhibit 10.1 to our current report on Form 8-K filed August 22,
2005)
|
|
|
|
|
|
10.31
|
|
Intercreditor Agreement dated August 16,
2005 among Deutsche Bank AG New York Branch as collateral agent and
administrative agent under the above referenced credit agreement, and HSBC
Bank USA, National Association as trustee under the indenture governing our
11 5/8% senior secured notes (incorporated by reference to Exhibit 10.2
to our current report on Form 8-K filed August 22, 2005)
|
|
|
|
|
|
10.32
|
|
Collateral Security Agreement dated August 16,
2005 among our Company, Deutsche Bank AG New York Branch and other financial
institutions named therein (incorporated by reference to Exhibit 10.3 to
our current report on Form 8-K filed August 22, 2005)
|
|
|
|
|
|
10.33
|
|
Second Amendment to Amended and Restated
Pooling Agreement dated August 16, 2005 among Huntsman Receivables Finance
LLC, Huntsman (Europe), BVBA and J.P. Morgan Bank (incorporated by reference
to Exhibit 10.4 to our current report on Form 8-K filed August 22,
2005)
|
|
|
|
|
|
10.34
|
|
Fourth Amendment to 2000-1 Supplement dated
August 16, 2005 among Huntsman Receivables Finance LLC, Huntsman
(Europe), BVBA and J.P. Morgan (Ireland) Plc (incorporated by reference to Exhibit 10.5
to our current report on Form
8-K filed August 22, 2005)
|
|
|
|
|
|
10.35
|
|
Consent and First Amendment to Credit
Agreement dated December 20, 2005 among our Company, Deutsche Bank AG
New York Branch as Administrative Agent and the other financial institutions
named therein (incorporated by reference to Exhibit 10.1 to our current
report on Form 8-K filed on December 27, 2005)
|
|
|
|
|
|
10.36
|
|
Collateral Security Agreement Supplement No. 1
dated December 20, 2005 among our Company, Deutsche Bank AG New York
Branch, Huntsman Advanced Materials Holdings LLC, Huntsman Advanced Materials
LLC and Huntsman Advanced Materials Americas, Inc (incorporated by
reference to Exhibit 10.2 to our current report on Form 8-K filed
on December 27, 2005)
|
|
|
|
|
|
10.37
|
|
Amended and Restated Huntsman Supplemental
Executive Retirement Plan (incorporated by reference to Exhibit 10.1 to
our current report on Form 8-K filed on December 30, 2005)
|
|
|
|
|
|
10.38
|
|
Huntsman Supplemental Executive MPP Plan
(incorporated by reference to Exhibit 10.2 to our current report on Form
8-K filed on December 30, 2005)
|
|
|
|
|
|
10.39
|
|
Amended and Restated Huntsman Supplemental
Savings Plan (incorporated by reference to Exhibit 10.3 to our current
report on Form 8-K filed on December 30, 2005)
|
|
|
|
|
|
10.40*
|
|
Fifth Amendment to Series 2000-1 Supplement, dated March 14, 2006,
among Huntsman Receivables Finance LLC, Huntsman (Europe), BVBA, JPMorgan
Chase Bank, N.A. and J.P. Morgan (Ireland) plc.
|
|
|
|
|
|
18.1*
|
|
Preferability Letter from Deloitte &
Touche LLP
|
|
|
|
|
|
21.1
|
|
Omitted pursuant to General Instruction I
of Form 10-K
|
|
|
|
|
|
31.1*
|
|
Certification of Chief Executive Officer pursuant
to Section 302 of the Sarbanes-Oxley Act of 2002
|
|
|
|
|
|
31.2*
|
|
Certification of Chief Financial Officer
pursuant to Section 302 of the Sarbanes-Oxley Act of 2002
|
|
|
|
|
|
32.1*
|
|
Certification of Chief Executive Officer
pursuant to Section 906 of the Sarbanes-Oxley Act of 2002
|
|
|
|
|
|
32.2*
|
|
Certification of Chief Financial Officer
pursuant to Section 906 of the Sarbanes-Oxley Act of 2002
|
* Filed
herewith.